Immigrants from Syria vs Tsimshian Disability Age Over 75
COMPARE
Immigrants from Syria
Tsimshian
Disability Age Over 75
Disability Age Over 75 Comparison
Immigrants from Syria
Tsimshian
47.8%
DISABILITY AGE OVER 75
17.4/ 100
METRIC RATING
207th/ 347
METRIC RANK
59.2%
DISABILITY AGE OVER 75
0.0/ 100
METRIC RATING
346th/ 347
METRIC RANK
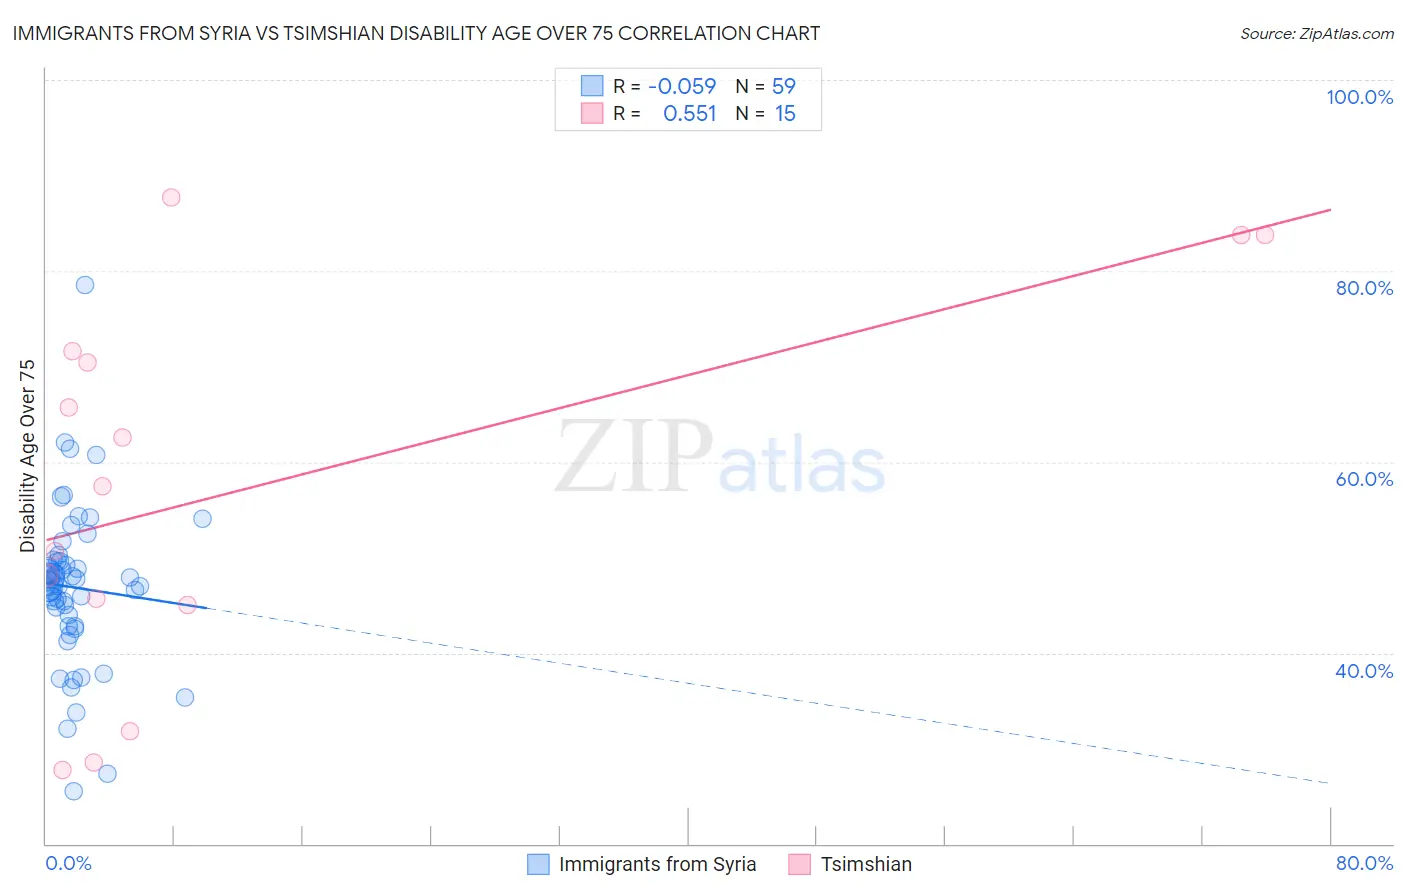
Immigrants from Syria vs Tsimshian Disability Age Over 75 Correlation Chart
The statistical analysis conducted on geographies consisting of 174,043,785 people shows a slight negative correlation between the proportion of Immigrants from Syria and percentage of population with a disability over the age of 75 in the United States with a correlation coefficient (R) of -0.059 and weighted average of 47.8%. Similarly, the statistical analysis conducted on geographies consisting of 15,620,176 people shows a substantial positive correlation between the proportion of Tsimshian and percentage of population with a disability over the age of 75 in the United States with a correlation coefficient (R) of 0.551 and weighted average of 59.2%, a difference of 24.0%.
Disability Age Over 75 Correlation Summary
| Measurement | Immigrants from Syria | Tsimshian |
| Minimum | 25.4% | 27.7% |
| Maximum | 78.6% | 87.8% |
| Range | 53.1% | 60.1% |
| Mean | 46.8% | 57.4% |
| Median | 47.5% | 57.4% |
| Interquartile 25% (IQ1) | 42.8% | 45.0% |
| Interquartile 75% (IQ3) | 49.6% | 71.6% |
| Interquartile Range (IQR) | 6.8% | 26.6% |
| Standard Deviation (Sample) | 8.4% | 20.0% |
| Standard Deviation (Population) | 8.3% | 19.3% |
Similar Demographics by Disability Age Over 75
Demographics Similar to Immigrants from Syria by Disability Age Over 75
In terms of disability age over 75, the demographic groups most similar to Immigrants from Syria are Immigrants from Senegal (47.8%, a difference of 0.020%), Immigrants from Ghana (47.7%, a difference of 0.060%), Jamaican (47.7%, a difference of 0.060%), Nigerian (47.7%, a difference of 0.070%), and Trinidadian and Tobagonian (47.7%, a difference of 0.10%).
| Demographics | Rating | Rank | Disability Age Over 75 |
| Immigrants | Somalia | 21.4 /100 | #200 | Fair 47.7% |
| Immigrants | Cuba | 20.9 /100 | #201 | Fair 47.7% |
| Immigrants | Bahamas | 20.7 /100 | #202 | Fair 47.7% |
| Trinidadians and Tobagonians | 20.0 /100 | #203 | Fair 47.7% |
| Nigerians | 19.2 /100 | #204 | Poor 47.7% |
| Immigrants | Ghana | 19.1 /100 | #205 | Poor 47.7% |
| Jamaicans | 19.0 /100 | #206 | Poor 47.7% |
| Immigrants | Syria | 17.4 /100 | #207 | Poor 47.8% |
| Immigrants | Senegal | 16.9 /100 | #208 | Poor 47.8% |
| Immigrants | Indonesia | 14.2 /100 | #209 | Poor 47.8% |
| Vietnamese | 11.9 /100 | #210 | Poor 47.9% |
| Panamanians | 11.8 /100 | #211 | Poor 47.9% |
| Immigrants | Burma/Myanmar | 11.7 /100 | #212 | Poor 47.9% |
| Laotians | 11.5 /100 | #213 | Poor 47.9% |
| Immigrants | Barbados | 10.7 /100 | #214 | Poor 47.9% |
Demographics Similar to Tsimshian by Disability Age Over 75
In terms of disability age over 75, the demographic groups most similar to Tsimshian are Inupiat (58.4%, a difference of 1.4%), Navajo (58.3%, a difference of 1.6%), Yup'ik (61.1%, a difference of 3.2%), Tohono O'odham (56.7%, a difference of 4.4%), and Lumbee (56.2%, a difference of 5.3%).
| Demographics | Rating | Rank | Disability Age Over 75 |
| Apache | 0.0 /100 | #333 | Tragic 53.6% |
| Alaskan Athabascans | 0.0 /100 | #334 | Tragic 54.0% |
| Kiowa | 0.0 /100 | #335 | Tragic 54.2% |
| Immigrants | Armenia | 0.0 /100 | #336 | Tragic 54.3% |
| Yuman | 0.0 /100 | #337 | Tragic 54.4% |
| Colville | 0.0 /100 | #338 | Tragic 55.4% |
| Pima | 0.0 /100 | #339 | Tragic 55.8% |
| Pueblo | 0.0 /100 | #340 | Tragic 55.9% |
| Houma | 0.0 /100 | #341 | Tragic 56.2% |
| Lumbee | 0.0 /100 | #342 | Tragic 56.2% |
| Tohono O'odham | 0.0 /100 | #343 | Tragic 56.7% |
| Navajo | 0.0 /100 | #344 | Tragic 58.3% |
| Inupiat | 0.0 /100 | #345 | Tragic 58.4% |
| Tsimshian | 0.0 /100 | #346 | Tragic 59.2% |
| Yup'ik | 0.0 /100 | #347 | Tragic 61.1% |