Assyrian/Chaldean/Syriac vs Creek Disability Age Over 75
COMPARE
Assyrian/Chaldean/Syriac
Creek
Disability Age Over 75
Disability Age Over 75 Comparison
Assyrians/Chaldeans/Syriacs
Creek
49.1%
DISABILITY AGE OVER 75
0.2/ 100
METRIC RATING
272nd/ 347
METRIC RANK
51.5%
DISABILITY AGE OVER 75
0.0/ 100
METRIC RATING
319th/ 347
METRIC RANK
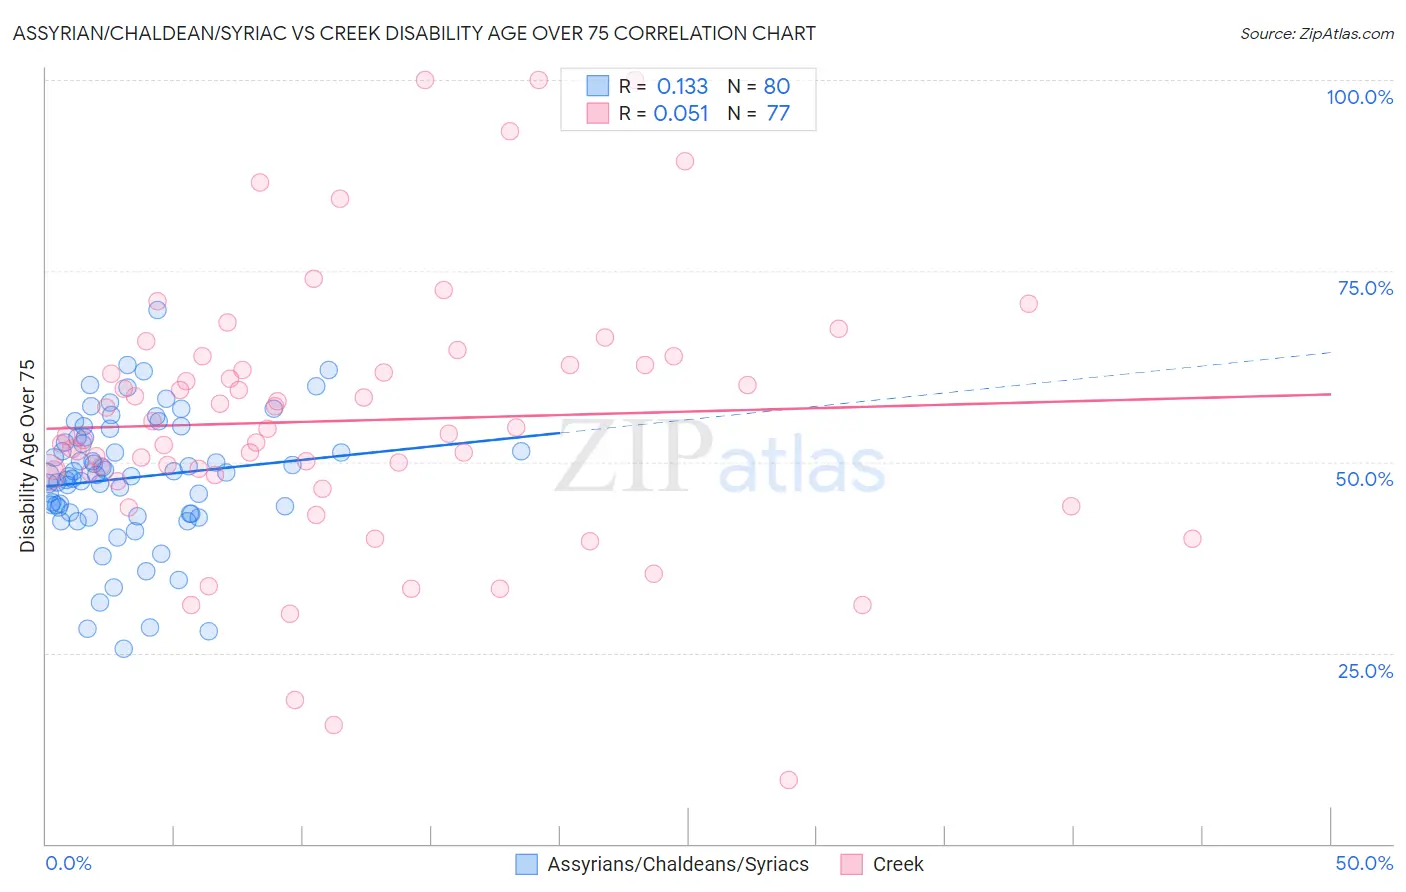
Assyrian/Chaldean/Syriac vs Creek Disability Age Over 75 Correlation Chart
The statistical analysis conducted on geographies consisting of 110,272,420 people shows a poor positive correlation between the proportion of Assyrians/Chaldeans/Syriacs and percentage of population with a disability over the age of 75 in the United States with a correlation coefficient (R) of 0.133 and weighted average of 49.1%. Similarly, the statistical analysis conducted on geographies consisting of 178,338,253 people shows a slight positive correlation between the proportion of Creek and percentage of population with a disability over the age of 75 in the United States with a correlation coefficient (R) of 0.051 and weighted average of 51.5%, a difference of 4.9%.
Disability Age Over 75 Correlation Summary
| Measurement | Assyrian/Chaldean/Syriac | Creek |
| Minimum | 25.6% | 8.3% |
| Maximum | 69.9% | 100.0% |
| Range | 44.3% | 91.7% |
| Mean | 47.9% | 55.4% |
| Median | 48.2% | 53.7% |
| Interquartile 25% (IQ1) | 43.3% | 48.5% |
| Interquartile 75% (IQ3) | 53.1% | 62.7% |
| Interquartile Range (IQR) | 9.9% | 14.2% |
| Standard Deviation (Sample) | 8.5% | 17.5% |
| Standard Deviation (Population) | 8.4% | 17.4% |
Similar Demographics by Disability Age Over 75
Demographics Similar to Assyrians/Chaldeans/Syriacs by Disability Age Over 75
In terms of disability age over 75, the demographic groups most similar to Assyrians/Chaldeans/Syriacs are Fijian (49.0%, a difference of 0.010%), Potawatomi (49.0%, a difference of 0.030%), Immigrants from Iraq (49.1%, a difference of 0.050%), Immigrants from El Salvador (49.0%, a difference of 0.060%), and Guatemalan (49.0%, a difference of 0.080%).
| Demographics | Rating | Rank | Disability Age Over 75 |
| Hondurans | 0.3 /100 | #265 | Tragic 48.9% |
| U.S. Virgin Islanders | 0.2 /100 | #266 | Tragic 48.9% |
| Malaysians | 0.2 /100 | #267 | Tragic 49.0% |
| Guatemalans | 0.2 /100 | #268 | Tragic 49.0% |
| Immigrants | El Salvador | 0.2 /100 | #269 | Tragic 49.0% |
| Potawatomi | 0.2 /100 | #270 | Tragic 49.0% |
| Fijians | 0.2 /100 | #271 | Tragic 49.0% |
| Assyrians/Chaldeans/Syriacs | 0.2 /100 | #272 | Tragic 49.1% |
| Immigrants | Iraq | 0.1 /100 | #273 | Tragic 49.1% |
| Immigrants | Guatemala | 0.1 /100 | #274 | Tragic 49.1% |
| Immigrants | Dominica | 0.1 /100 | #275 | Tragic 49.1% |
| Immigrants | Uzbekistan | 0.1 /100 | #276 | Tragic 49.2% |
| Hawaiians | 0.1 /100 | #277 | Tragic 49.2% |
| Immigrants | Laos | 0.1 /100 | #278 | Tragic 49.2% |
| Guamanians/Chamorros | 0.0 /100 | #279 | Tragic 49.4% |
Demographics Similar to Creek by Disability Age Over 75
In terms of disability age over 75, the demographic groups most similar to Creek are Seminole (51.5%, a difference of 0.0%), Paiute (51.5%, a difference of 0.14%), Dutch West Indian (51.5%, a difference of 0.15%), Yakama (51.3%, a difference of 0.33%), and Comanche (51.7%, a difference of 0.48%).
| Demographics | Rating | Rank | Disability Age Over 75 |
| Cheyenne | 0.0 /100 | #312 | Tragic 50.9% |
| Immigrants | Azores | 0.0 /100 | #313 | Tragic 50.9% |
| Immigrants | Mexico | 0.0 /100 | #314 | Tragic 51.1% |
| Mexicans | 0.0 /100 | #315 | Tragic 51.1% |
| Chickasaw | 0.0 /100 | #316 | Tragic 51.2% |
| Yakama | 0.0 /100 | #317 | Tragic 51.3% |
| Seminole | 0.0 /100 | #318 | Tragic 51.5% |
| Creek | 0.0 /100 | #319 | Tragic 51.5% |
| Paiute | 0.0 /100 | #320 | Tragic 51.5% |
| Dutch West Indians | 0.0 /100 | #321 | Tragic 51.5% |
| Comanche | 0.0 /100 | #322 | Tragic 51.7% |
| Immigrants | Yemen | 0.0 /100 | #323 | Tragic 52.0% |
| Menominee | 0.0 /100 | #324 | Tragic 52.3% |
| Immigrants | Cabo Verde | 0.0 /100 | #325 | Tragic 52.4% |
| Ute | 0.0 /100 | #326 | Tragic 52.6% |