Nepalese vs Tsimshian Disability Age Over 75
COMPARE
Nepalese
Tsimshian
Disability Age Over 75
Disability Age Over 75 Comparison
Nepalese
Tsimshian
52.6%
DISABILITY AGE OVER 75
0.0/ 100
METRIC RATING
327th/ 347
METRIC RANK
59.2%
DISABILITY AGE OVER 75
0.0/ 100
METRIC RATING
346th/ 347
METRIC RANK
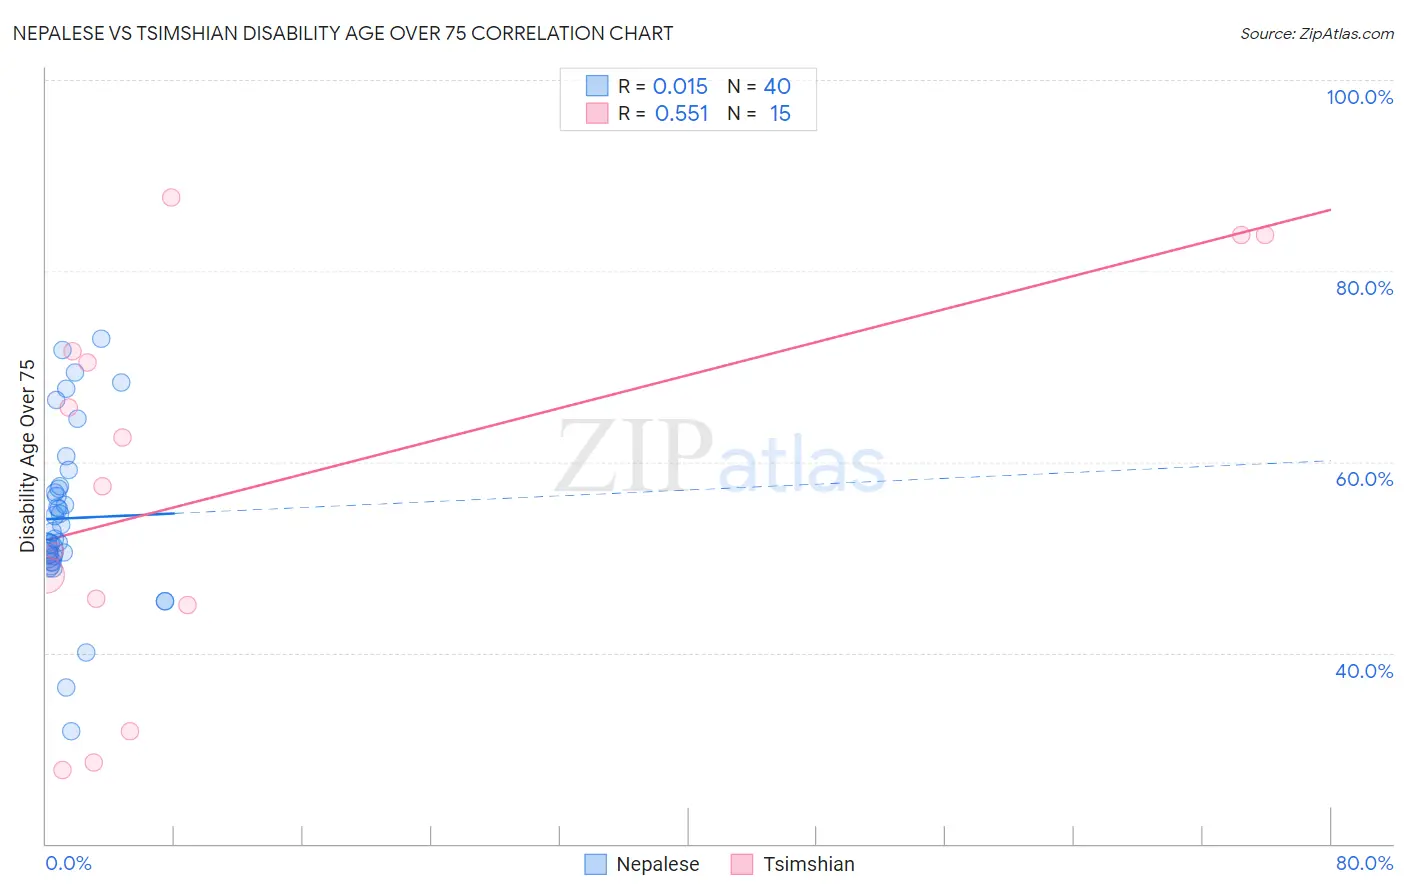
Nepalese vs Tsimshian Disability Age Over 75 Correlation Chart
The statistical analysis conducted on geographies consisting of 24,521,755 people shows no correlation between the proportion of Nepalese and percentage of population with a disability over the age of 75 in the United States with a correlation coefficient (R) of 0.015 and weighted average of 52.6%. Similarly, the statistical analysis conducted on geographies consisting of 15,620,176 people shows a substantial positive correlation between the proportion of Tsimshian and percentage of population with a disability over the age of 75 in the United States with a correlation coefficient (R) of 0.551 and weighted average of 59.2%, a difference of 12.6%.
Disability Age Over 75 Correlation Summary
| Measurement | Nepalese | Tsimshian |
| Minimum | 31.7% | 27.7% |
| Maximum | 72.9% | 87.8% |
| Range | 41.1% | 60.1% |
| Mean | 54.1% | 57.4% |
| Median | 52.3% | 57.4% |
| Interquartile 25% (IQ1) | 49.8% | 45.0% |
| Interquartile 75% (IQ3) | 57.3% | 71.6% |
| Interquartile Range (IQR) | 7.5% | 26.6% |
| Standard Deviation (Sample) | 8.8% | 20.0% |
| Standard Deviation (Population) | 8.7% | 19.3% |
Demographics Similar to Nepalese and Tsimshian by Disability Age Over 75
In terms of disability age over 75, the demographic groups most similar to Nepalese are Ute (52.6%, a difference of 0.030%), Choctaw (52.7%, a difference of 0.19%), Alaska Native (52.8%, a difference of 0.41%), Puerto Rican (52.9%, a difference of 0.58%), and Hopi (52.9%, a difference of 0.60%). Similarly, the demographic groups most similar to Tsimshian are Inupiat (58.4%, a difference of 1.4%), Navajo (58.3%, a difference of 1.6%), Tohono O'odham (56.7%, a difference of 4.4%), Lumbee (56.2%, a difference of 5.3%), and Houma (56.2%, a difference of 5.4%).
| Demographics | Rating | Rank | Disability Age Over 75 |
| Ute | 0.0 /100 | #326 | Tragic 52.6% |
| Nepalese | 0.0 /100 | #327 | Tragic 52.6% |
| Choctaw | 0.0 /100 | #328 | Tragic 52.7% |
| Alaska Natives | 0.0 /100 | #329 | Tragic 52.8% |
| Puerto Ricans | 0.0 /100 | #330 | Tragic 52.9% |
| Hopi | 0.0 /100 | #331 | Tragic 52.9% |
| Natives/Alaskans | 0.0 /100 | #332 | Tragic 53.1% |
| Apache | 0.0 /100 | #333 | Tragic 53.6% |
| Alaskan Athabascans | 0.0 /100 | #334 | Tragic 54.0% |
| Kiowa | 0.0 /100 | #335 | Tragic 54.2% |
| Immigrants | Armenia | 0.0 /100 | #336 | Tragic 54.3% |
| Yuman | 0.0 /100 | #337 | Tragic 54.4% |
| Colville | 0.0 /100 | #338 | Tragic 55.4% |
| Pima | 0.0 /100 | #339 | Tragic 55.8% |
| Pueblo | 0.0 /100 | #340 | Tragic 55.9% |
| Houma | 0.0 /100 | #341 | Tragic 56.2% |
| Lumbee | 0.0 /100 | #342 | Tragic 56.2% |
| Tohono O'odham | 0.0 /100 | #343 | Tragic 56.7% |
| Navajo | 0.0 /100 | #344 | Tragic 58.3% |
| Inupiat | 0.0 /100 | #345 | Tragic 58.4% |
| Tsimshian | 0.0 /100 | #346 | Tragic 59.2% |