Assyrian/Chaldean/Syriac vs Immigrants from Zaire Disability Age Over 75
COMPARE
Assyrian/Chaldean/Syriac
Immigrants from Zaire
Disability Age Over 75
Disability Age Over 75 Comparison
Assyrians/Chaldeans/Syriacs
Immigrants from Zaire
49.1%
DISABILITY AGE OVER 75
0.2/ 100
METRIC RATING
272nd/ 347
METRIC RANK
47.1%
DISABILITY AGE OVER 75
74.8/ 100
METRIC RATING
153rd/ 347
METRIC RANK
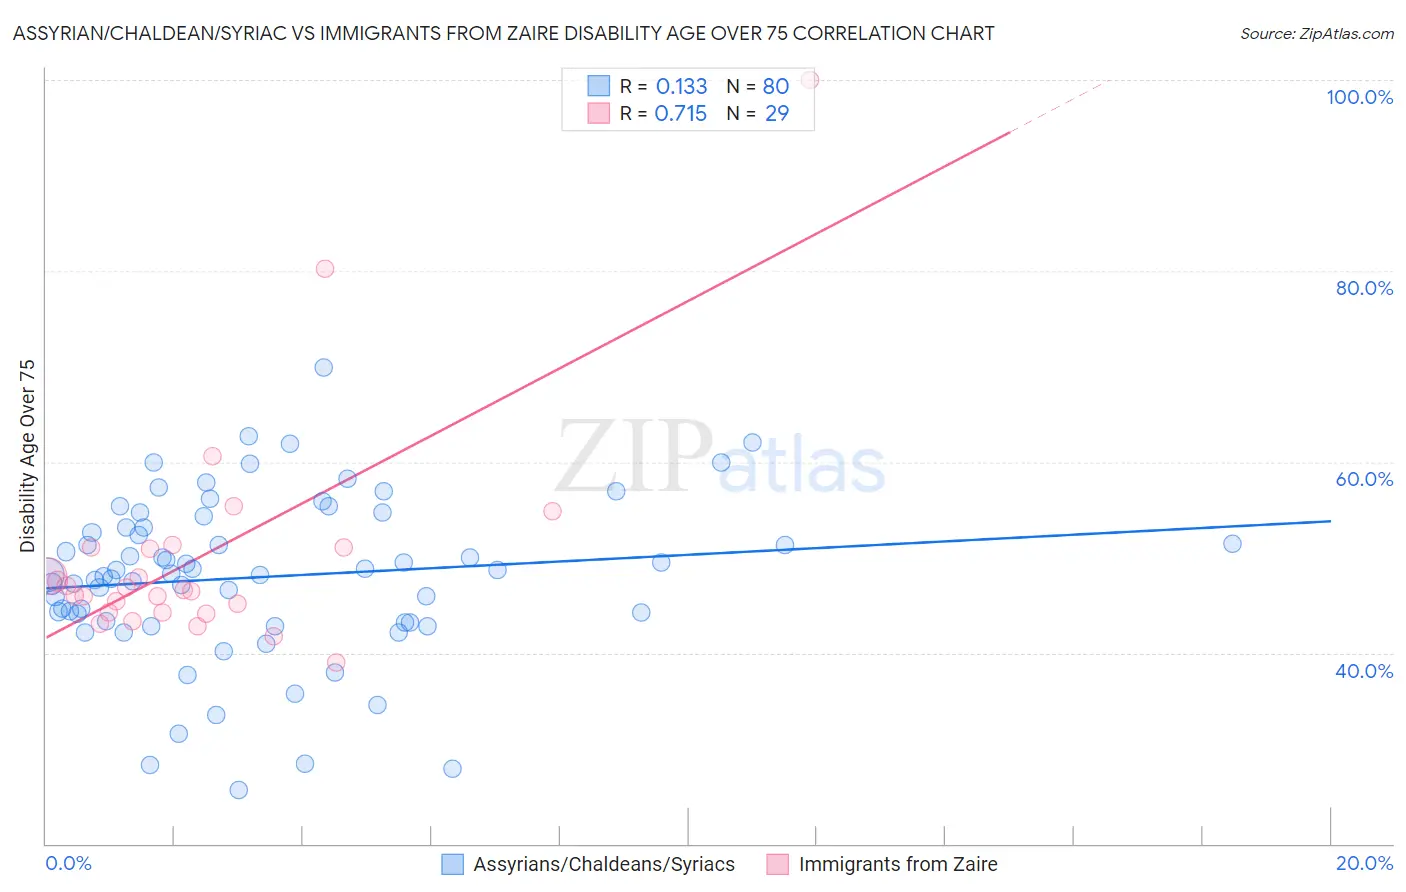
Assyrian/Chaldean/Syriac vs Immigrants from Zaire Disability Age Over 75 Correlation Chart
The statistical analysis conducted on geographies consisting of 110,272,420 people shows a poor positive correlation between the proportion of Assyrians/Chaldeans/Syriacs and percentage of population with a disability over the age of 75 in the United States with a correlation coefficient (R) of 0.133 and weighted average of 49.1%. Similarly, the statistical analysis conducted on geographies consisting of 107,207,758 people shows a strong positive correlation between the proportion of Immigrants from Zaire and percentage of population with a disability over the age of 75 in the United States with a correlation coefficient (R) of 0.715 and weighted average of 47.1%, a difference of 4.3%.
Disability Age Over 75 Correlation Summary
| Measurement | Assyrian/Chaldean/Syriac | Immigrants from Zaire |
| Minimum | 25.6% | 39.0% |
| Maximum | 69.9% | 100.0% |
| Range | 44.3% | 61.0% |
| Mean | 47.9% | 50.2% |
| Median | 48.2% | 46.6% |
| Interquartile 25% (IQ1) | 43.3% | 44.2% |
| Interquartile 75% (IQ3) | 53.1% | 51.0% |
| Interquartile Range (IQR) | 9.9% | 6.8% |
| Standard Deviation (Sample) | 8.5% | 12.2% |
| Standard Deviation (Population) | 8.4% | 12.0% |
Similar Demographics by Disability Age Over 75
Demographics Similar to Assyrians/Chaldeans/Syriacs by Disability Age Over 75
In terms of disability age over 75, the demographic groups most similar to Assyrians/Chaldeans/Syriacs are Fijian (49.0%, a difference of 0.010%), Potawatomi (49.0%, a difference of 0.030%), Immigrants from Iraq (49.1%, a difference of 0.050%), Immigrants from El Salvador (49.0%, a difference of 0.060%), and Guatemalan (49.0%, a difference of 0.080%).
| Demographics | Rating | Rank | Disability Age Over 75 |
| Hondurans | 0.3 /100 | #265 | Tragic 48.9% |
| U.S. Virgin Islanders | 0.2 /100 | #266 | Tragic 48.9% |
| Malaysians | 0.2 /100 | #267 | Tragic 49.0% |
| Guatemalans | 0.2 /100 | #268 | Tragic 49.0% |
| Immigrants | El Salvador | 0.2 /100 | #269 | Tragic 49.0% |
| Potawatomi | 0.2 /100 | #270 | Tragic 49.0% |
| Fijians | 0.2 /100 | #271 | Tragic 49.0% |
| Assyrians/Chaldeans/Syriacs | 0.2 /100 | #272 | Tragic 49.1% |
| Immigrants | Iraq | 0.1 /100 | #273 | Tragic 49.1% |
| Immigrants | Guatemala | 0.1 /100 | #274 | Tragic 49.1% |
| Immigrants | Dominica | 0.1 /100 | #275 | Tragic 49.1% |
| Immigrants | Uzbekistan | 0.1 /100 | #276 | Tragic 49.2% |
| Hawaiians | 0.1 /100 | #277 | Tragic 49.2% |
| Immigrants | Laos | 0.1 /100 | #278 | Tragic 49.2% |
| Guamanians/Chamorros | 0.0 /100 | #279 | Tragic 49.4% |
Demographics Similar to Immigrants from Zaire by Disability Age Over 75
In terms of disability age over 75, the demographic groups most similar to Immigrants from Zaire are Immigrants from Belarus (47.1%, a difference of 0.0%), Immigrants from Iran (47.1%, a difference of 0.010%), Arab (47.1%, a difference of 0.040%), Immigrants from Asia (47.0%, a difference of 0.050%), and Bhutanese (47.1%, a difference of 0.070%).
| Demographics | Rating | Rank | Disability Age Over 75 |
| Guyanese | 84.3 /100 | #146 | Excellent 46.9% |
| Immigrants | Peru | 84.1 /100 | #147 | Excellent 46.9% |
| Asians | 81.6 /100 | #148 | Excellent 46.9% |
| Welsh | 81.3 /100 | #149 | Excellent 47.0% |
| Immigrants | Russia | 79.3 /100 | #150 | Good 47.0% |
| French Canadians | 79.0 /100 | #151 | Good 47.0% |
| Immigrants | Asia | 76.5 /100 | #152 | Good 47.0% |
| Immigrants | Zaire | 74.8 /100 | #153 | Good 47.1% |
| Immigrants | Belarus | 74.8 /100 | #154 | Good 47.1% |
| Immigrants | Iran | 74.7 /100 | #155 | Good 47.1% |
| Arabs | 73.3 /100 | #156 | Good 47.1% |
| Bhutanese | 72.6 /100 | #157 | Good 47.1% |
| Immigrants | Guyana | 71.9 /100 | #158 | Good 47.1% |
| Immigrants | Morocco | 71.4 /100 | #159 | Good 47.1% |
| Immigrants | Middle Africa | 68.3 /100 | #160 | Good 47.1% |