Argentinean vs Immigrants from Latvia Master's Degree
COMPARE
Argentinean
Immigrants from Latvia
Master's Degree
Master's Degree Comparison
Argentineans
Immigrants from Latvia
18.2%
MASTER'S DEGREE
99.9/ 100
METRIC RATING
62nd/ 347
METRIC RANK
19.1%
MASTER'S DEGREE
100.0/ 100
METRIC RATING
41st/ 347
METRIC RANK
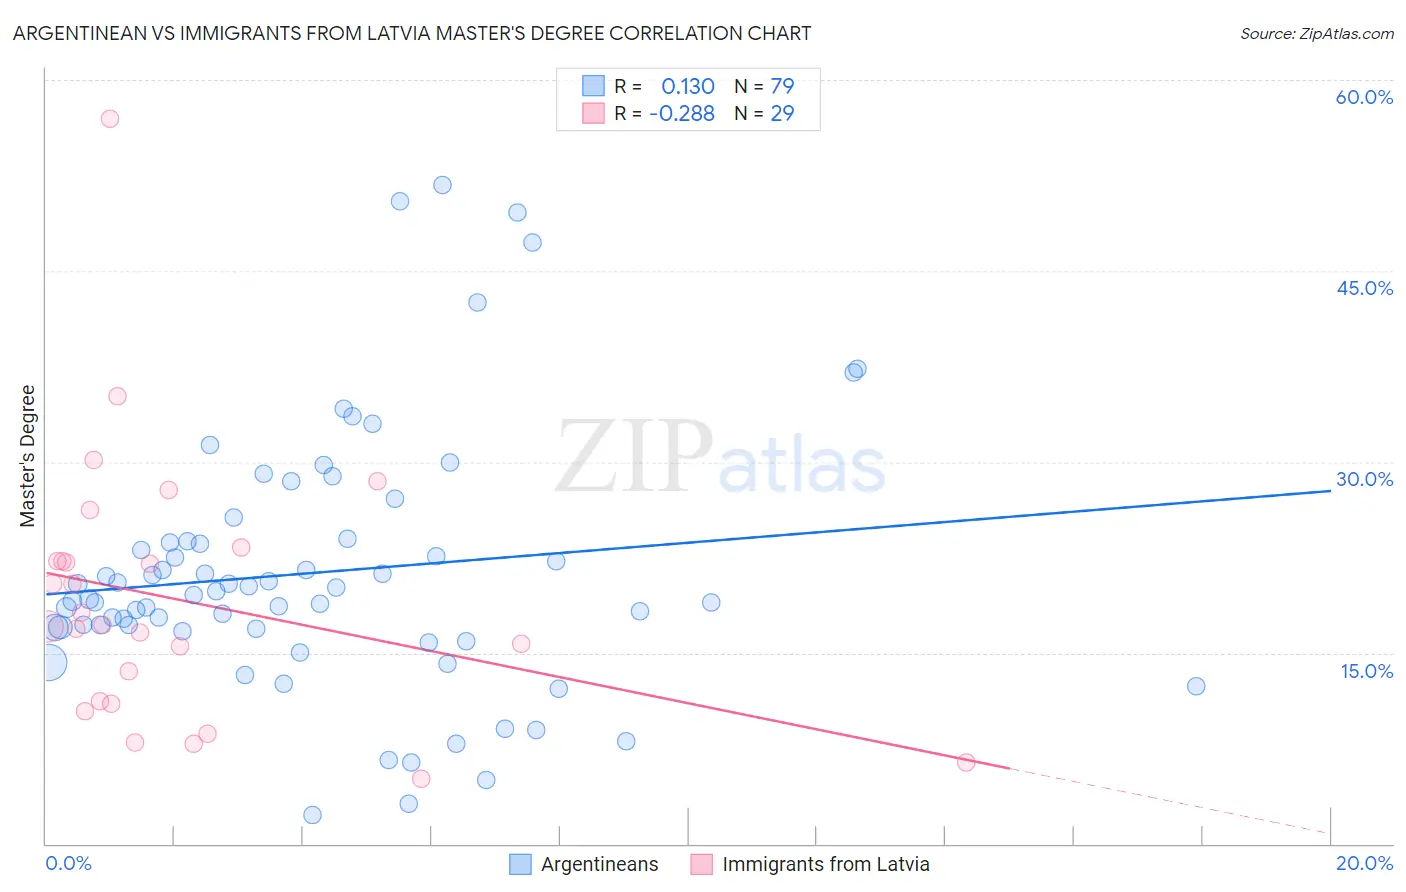
Argentinean vs Immigrants from Latvia Master's Degree Correlation Chart
The statistical analysis conducted on geographies consisting of 297,078,027 people shows a poor positive correlation between the proportion of Argentineans and percentage of population with at least master's degree education in the United States with a correlation coefficient (R) of 0.130 and weighted average of 18.2%. Similarly, the statistical analysis conducted on geographies consisting of 113,728,237 people shows a weak negative correlation between the proportion of Immigrants from Latvia and percentage of population with at least master's degree education in the United States with a correlation coefficient (R) of -0.288 and weighted average of 19.1%, a difference of 4.8%.
Master's Degree Correlation Summary
| Measurement | Argentinean | Immigrants from Latvia |
| Minimum | 2.2% | 5.1% |
| Maximum | 51.7% | 56.9% |
| Range | 49.5% | 51.8% |
| Mean | 21.3% | 19.2% |
| Median | 19.5% | 17.2% |
| Interquartile 25% (IQ1) | 16.9% | 11.1% |
| Interquartile 75% (IQ3) | 23.8% | 22.7% |
| Interquartile Range (IQR) | 6.9% | 11.6% |
| Standard Deviation (Sample) | 10.1% | 10.5% |
| Standard Deviation (Population) | 10.0% | 10.3% |
Similar Demographics by Master's Degree
Demographics Similar to Argentineans by Master's Degree
In terms of master's degree, the demographic groups most similar to Argentineans are Immigrants from Europe (18.2%, a difference of 0.36%), Immigrants from Netherlands (18.1%, a difference of 0.36%), South African (18.1%, a difference of 0.44%), New Zealander (18.3%, a difference of 0.51%), and Immigrants from Bulgaria (18.3%, a difference of 0.74%).
| Demographics | Rating | Rank | Master's Degree |
| Immigrants | Serbia | 99.9 /100 | #55 | Exceptional 18.5% |
| Asians | 99.9 /100 | #56 | Exceptional 18.4% |
| Immigrants | Asia | 99.9 /100 | #57 | Exceptional 18.4% |
| Australians | 99.9 /100 | #58 | Exceptional 18.4% |
| Immigrants | Bulgaria | 99.9 /100 | #59 | Exceptional 18.3% |
| New Zealanders | 99.9 /100 | #60 | Exceptional 18.3% |
| Immigrants | Europe | 99.9 /100 | #61 | Exceptional 18.2% |
| Argentineans | 99.9 /100 | #62 | Exceptional 18.2% |
| Immigrants | Netherlands | 99.9 /100 | #63 | Exceptional 18.1% |
| South Africans | 99.9 /100 | #64 | Exceptional 18.1% |
| Immigrants | Kazakhstan | 99.8 /100 | #65 | Exceptional 18.0% |
| Ethiopians | 99.8 /100 | #66 | Exceptional 18.0% |
| Immigrants | Argentina | 99.8 /100 | #67 | Exceptional 18.0% |
| Immigrants | Ethiopia | 99.8 /100 | #68 | Exceptional 17.9% |
| Immigrants | Uzbekistan | 99.8 /100 | #69 | Exceptional 17.9% |
Demographics Similar to Immigrants from Latvia by Master's Degree
In terms of master's degree, the demographic groups most similar to Immigrants from Latvia are Immigrants from Bolivia (19.1%, a difference of 0.35%), Immigrants from Saudi Arabia (19.0%, a difference of 0.43%), Immigrants from Greece (19.0%, a difference of 0.44%), Immigrants from Spain (19.1%, a difference of 0.47%), and Immigrants from Malaysia (18.9%, a difference of 0.72%).
| Demographics | Rating | Rank | Master's Degree |
| Immigrants | Denmark | 100.0 /100 | #34 | Exceptional 19.5% |
| Immigrants | Northern Europe | 100.0 /100 | #35 | Exceptional 19.5% |
| Immigrants | Russia | 100.0 /100 | #36 | Exceptional 19.4% |
| Mongolians | 100.0 /100 | #37 | Exceptional 19.4% |
| Bolivians | 100.0 /100 | #38 | Exceptional 19.3% |
| Immigrants | Spain | 100.0 /100 | #39 | Exceptional 19.1% |
| Immigrants | Bolivia | 100.0 /100 | #40 | Exceptional 19.1% |
| Immigrants | Latvia | 100.0 /100 | #41 | Exceptional 19.1% |
| Immigrants | Saudi Arabia | 100.0 /100 | #42 | Exceptional 19.0% |
| Immigrants | Greece | 100.0 /100 | #43 | Exceptional 19.0% |
| Immigrants | Malaysia | 100.0 /100 | #44 | Exceptional 18.9% |
| Immigrants | Belarus | 100.0 /100 | #45 | Exceptional 18.9% |
| Immigrants | Norway | 100.0 /100 | #46 | Exceptional 18.8% |
| Immigrants | Austria | 100.0 /100 | #47 | Exceptional 18.8% |
| Paraguayans | 100.0 /100 | #48 | Exceptional 18.8% |