Immigrants from South Eastern Asia vs Lumbee Self-Care Disability
COMPARE
Immigrants from South Eastern Asia
Lumbee
Self-Care Disability
Self-Care Disability Comparison
Immigrants from South Eastern Asia
Lumbee
2.5%
SELF-CARE DISABILITY
12.9/ 100
METRIC RATING
201st/ 347
METRIC RANK
3.0%
SELF-CARE DISABILITY
0.0/ 100
METRIC RATING
331st/ 347
METRIC RANK
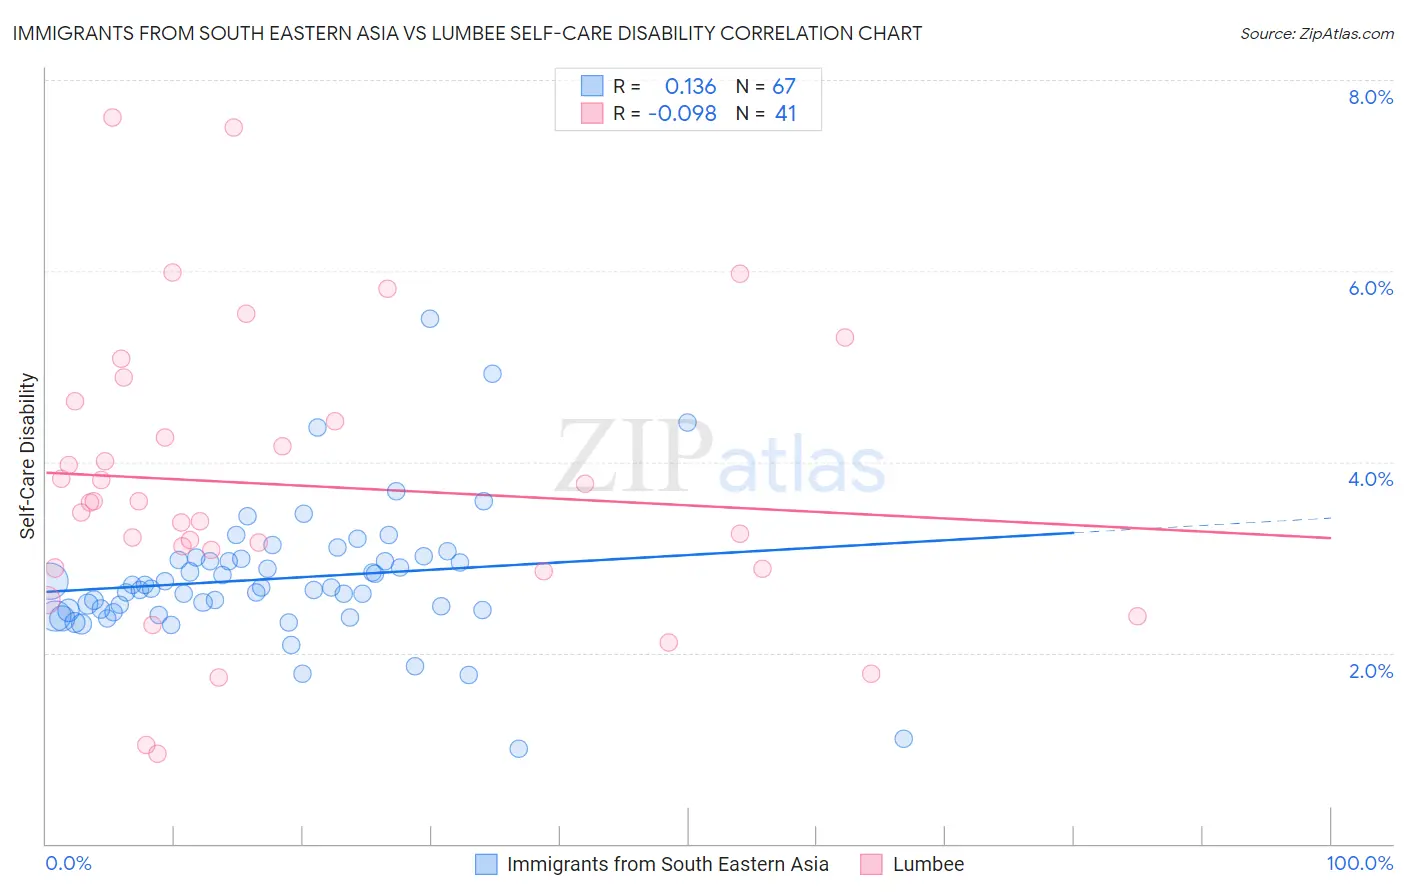
Immigrants from South Eastern Asia vs Lumbee Self-Care Disability Correlation Chart
The statistical analysis conducted on geographies consisting of 511,565,632 people shows a poor positive correlation between the proportion of Immigrants from South Eastern Asia and percentage of population with self-care disability in the United States with a correlation coefficient (R) of 0.136 and weighted average of 2.5%. Similarly, the statistical analysis conducted on geographies consisting of 92,217,287 people shows a slight negative correlation between the proportion of Lumbee and percentage of population with self-care disability in the United States with a correlation coefficient (R) of -0.098 and weighted average of 3.0%, a difference of 17.6%.
Self-Care Disability Correlation Summary
| Measurement | Immigrants from South Eastern Asia | Lumbee |
| Minimum | 0.99% | 0.94% |
| Maximum | 5.5% | 7.6% |
| Range | 4.5% | 6.7% |
| Mean | 2.8% | 3.8% |
| Median | 2.7% | 3.6% |
| Interquartile 25% (IQ1) | 2.4% | 2.9% |
| Interquartile 75% (IQ3) | 3.0% | 4.5% |
| Interquartile Range (IQR) | 0.54% | 1.6% |
| Standard Deviation (Sample) | 0.71% | 1.5% |
| Standard Deviation (Population) | 0.70% | 1.5% |
Similar Demographics by Self-Care Disability
Demographics Similar to Immigrants from South Eastern Asia by Self-Care Disability
In terms of self-care disability, the demographic groups most similar to Immigrants from South Eastern Asia are Immigrants from Western Africa (2.5%, a difference of 0.030%), Slovak (2.5%, a difference of 0.030%), Immigrants from Lebanon (2.5%, a difference of 0.050%), Immigrants from Bahamas (2.5%, a difference of 0.11%), and Immigrants from Ghana (2.5%, a difference of 0.18%).
| Demographics | Rating | Rank | Self-Care Disability |
| Immigrants | Germany | 17.9 /100 | #194 | Poor 2.5% |
| Immigrants | Southern Europe | 15.6 /100 | #195 | Poor 2.5% |
| Koreans | 15.5 /100 | #196 | Poor 2.5% |
| Crow | 15.2 /100 | #197 | Poor 2.5% |
| Immigrants | Immigrants | 15.0 /100 | #198 | Poor 2.5% |
| Immigrants | Ghana | 14.7 /100 | #199 | Poor 2.5% |
| Immigrants | Western Africa | 13.3 /100 | #200 | Poor 2.5% |
| Immigrants | South Eastern Asia | 12.9 /100 | #201 | Poor 2.5% |
| Slovaks | 12.6 /100 | #202 | Poor 2.5% |
| Immigrants | Lebanon | 12.4 /100 | #203 | Poor 2.5% |
| Immigrants | Bahamas | 11.9 /100 | #204 | Poor 2.5% |
| Immigrants | Russia | 11.0 /100 | #205 | Poor 2.5% |
| Alaskan Athabascans | 10.4 /100 | #206 | Poor 2.5% |
| French | 9.9 /100 | #207 | Tragic 2.5% |
| Central Americans | 8.7 /100 | #208 | Tragic 2.5% |
Demographics Similar to Lumbee by Self-Care Disability
In terms of self-care disability, the demographic groups most similar to Lumbee are Nepalese (3.0%, a difference of 0.12%), Kiowa (3.0%, a difference of 0.36%), Dutch West Indian (3.0%, a difference of 0.59%), Houma (3.0%, a difference of 0.66%), and Immigrants from the Azores (3.0%, a difference of 0.71%).
| Demographics | Rating | Rank | Self-Care Disability |
| Cherokee | 0.0 /100 | #324 | Tragic 2.9% |
| Immigrants | Uzbekistan | 0.0 /100 | #325 | Tragic 2.9% |
| Paiute | 0.0 /100 | #326 | Tragic 2.9% |
| Blacks/African Americans | 0.0 /100 | #327 | Tragic 2.9% |
| Hopi | 0.0 /100 | #328 | Tragic 2.9% |
| Cajuns | 0.0 /100 | #329 | Tragic 2.9% |
| Nepalese | 0.0 /100 | #330 | Tragic 3.0% |
| Lumbee | 0.0 /100 | #331 | Tragic 3.0% |
| Kiowa | 0.0 /100 | #332 | Tragic 3.0% |
| Dutch West Indians | 0.0 /100 | #333 | Tragic 3.0% |
| Houma | 0.0 /100 | #334 | Tragic 3.0% |
| Immigrants | Azores | 0.0 /100 | #335 | Tragic 3.0% |
| Immigrants | Yemen | 0.0 /100 | #336 | Tragic 3.0% |
| Choctaw | 0.0 /100 | #337 | Tragic 3.0% |
| Cape Verdeans | 0.0 /100 | #338 | Tragic 3.0% |