Apache vs Immigrants from Eastern Africa Master's Degree
COMPARE
Apache
Immigrants from Eastern Africa
Master's Degree
Master's Degree Comparison
Apache
Immigrants from Eastern Africa
11.0%
MASTER'S DEGREE
0.0/ 100
METRIC RATING
315th/ 347
METRIC RANK
16.3%
MASTER'S DEGREE
95.2/ 100
METRIC RATING
126th/ 347
METRIC RANK
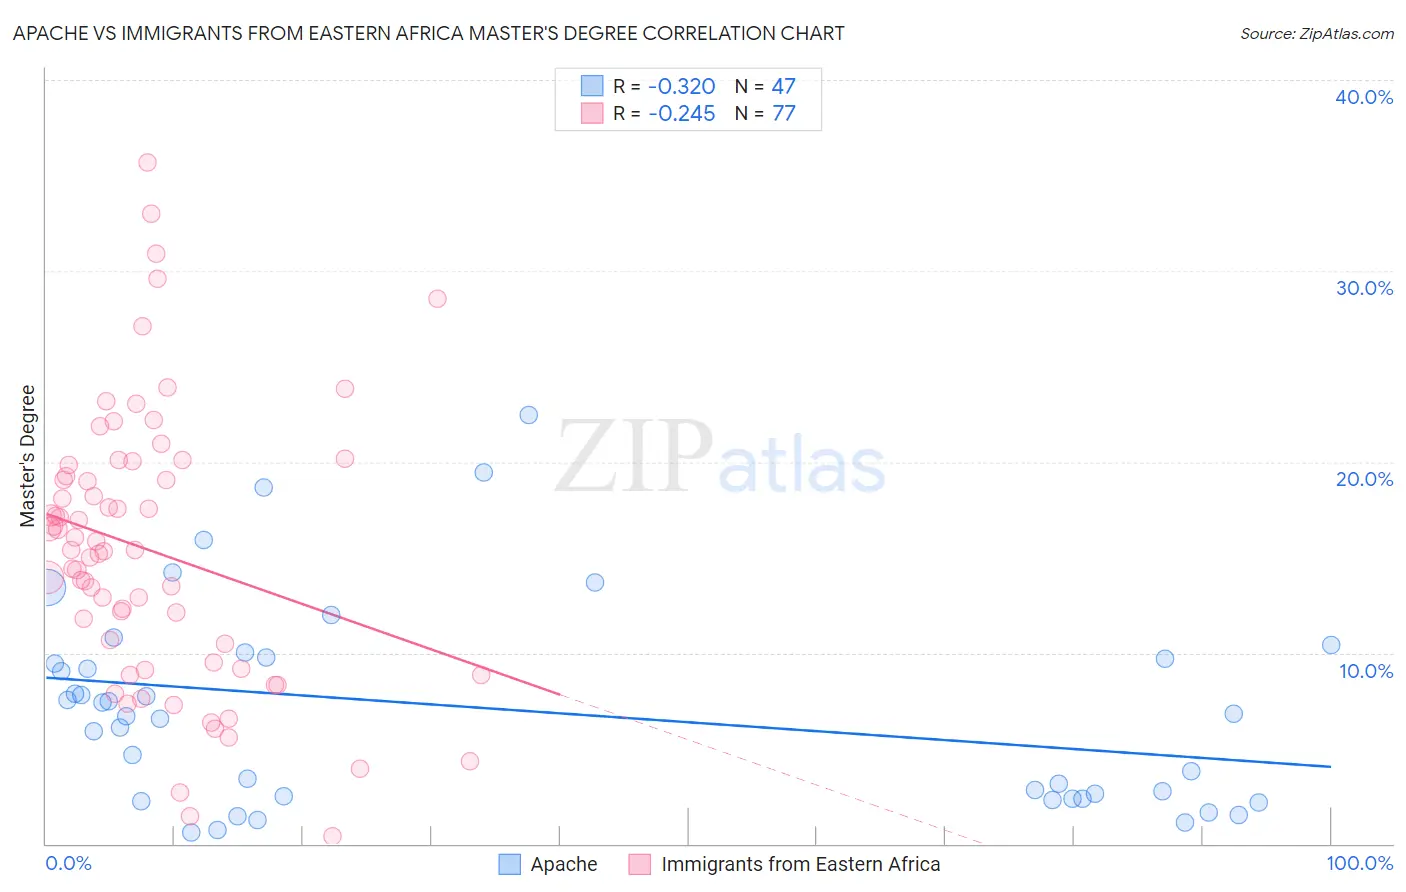
Apache vs Immigrants from Eastern Africa Master's Degree Correlation Chart
The statistical analysis conducted on geographies consisting of 231,057,413 people shows a mild negative correlation between the proportion of Apache and percentage of population with at least master's degree education in the United States with a correlation coefficient (R) of -0.320 and weighted average of 11.0%. Similarly, the statistical analysis conducted on geographies consisting of 355,067,936 people shows a weak negative correlation between the proportion of Immigrants from Eastern Africa and percentage of population with at least master's degree education in the United States with a correlation coefficient (R) of -0.245 and weighted average of 16.3%, a difference of 49.0%.
Master's Degree Correlation Summary
| Measurement | Apache | Immigrants from Eastern Africa |
| Minimum | 0.59% | 0.40% |
| Maximum | 22.5% | 35.7% |
| Range | 21.9% | 35.3% |
| Mean | 7.0% | 15.3% |
| Median | 6.7% | 15.4% |
| Interquartile 25% (IQ1) | 2.3% | 9.3% |
| Interquartile 75% (IQ3) | 9.8% | 19.6% |
| Interquartile Range (IQR) | 7.4% | 10.2% |
| Standard Deviation (Sample) | 5.3% | 7.2% |
| Standard Deviation (Population) | 5.3% | 7.2% |
Similar Demographics by Master's Degree
Demographics Similar to Apache by Master's Degree
In terms of master's degree, the demographic groups most similar to Apache are Cajun (11.0%, a difference of 0.0%), Hispanic or Latino (10.9%, a difference of 0.34%), Yaqui (11.0%, a difference of 0.40%), Choctaw (11.0%, a difference of 0.58%), and Seminole (11.0%, a difference of 0.67%).
| Demographics | Rating | Rank | Master's Degree |
| Puerto Ricans | 0.0 /100 | #308 | Tragic 11.2% |
| Puget Sound Salish | 0.0 /100 | #309 | Tragic 11.1% |
| Shoshone | 0.0 /100 | #310 | Tragic 11.1% |
| Seminole | 0.0 /100 | #311 | Tragic 11.0% |
| Choctaw | 0.0 /100 | #312 | Tragic 11.0% |
| Yaqui | 0.0 /100 | #313 | Tragic 11.0% |
| Cajuns | 0.0 /100 | #314 | Tragic 11.0% |
| Apache | 0.0 /100 | #315 | Tragic 11.0% |
| Hispanics or Latinos | 0.0 /100 | #316 | Tragic 10.9% |
| Hopi | 0.0 /100 | #317 | Tragic 10.9% |
| Immigrants | Cuba | 0.0 /100 | #318 | Tragic 10.9% |
| Kiowa | 0.0 /100 | #319 | Tragic 10.8% |
| Immigrants | Micronesia | 0.0 /100 | #320 | Tragic 10.8% |
| Pennsylvania Germans | 0.0 /100 | #321 | Tragic 10.7% |
| Sioux | 0.0 /100 | #322 | Tragic 10.7% |
Demographics Similar to Immigrants from Eastern Africa by Master's Degree
In terms of master's degree, the demographic groups most similar to Immigrants from Eastern Africa are Italian (16.4%, a difference of 0.11%), Immigrants from Eritrea (16.4%, a difference of 0.19%), Croatian (16.4%, a difference of 0.26%), Palestinian (16.3%, a difference of 0.26%), and British (16.4%, a difference of 0.27%).
| Demographics | Rating | Rank | Master's Degree |
| Jordanians | 96.5 /100 | #119 | Exceptional 16.5% |
| Lebanese | 96.4 /100 | #120 | Exceptional 16.5% |
| Afghans | 96.2 /100 | #121 | Exceptional 16.5% |
| British | 95.6 /100 | #122 | Exceptional 16.4% |
| Croatians | 95.6 /100 | #123 | Exceptional 16.4% |
| Immigrants | Eritrea | 95.5 /100 | #124 | Exceptional 16.4% |
| Italians | 95.4 /100 | #125 | Exceptional 16.4% |
| Immigrants | Eastern Africa | 95.2 /100 | #126 | Exceptional 16.3% |
| Palestinians | 94.8 /100 | #127 | Exceptional 16.3% |
| Immigrants | Sierra Leone | 94.7 /100 | #128 | Exceptional 16.3% |
| Immigrants | Syria | 93.3 /100 | #129 | Exceptional 16.2% |
| Immigrants | Jordan | 92.7 /100 | #130 | Exceptional 16.1% |
| Taiwanese | 91.9 /100 | #131 | Exceptional 16.1% |
| Serbians | 91.7 /100 | #132 | Exceptional 16.1% |
| Immigrants | Sudan | 90.2 /100 | #133 | Exceptional 16.0% |