Apache vs Immigrants from Albania Cognitive Disability
COMPARE
Apache
Immigrants from Albania
Cognitive Disability
Cognitive Disability Comparison
Apache
Immigrants from Albania
18.6%
COGNITIVE DISABILITY
0.0/ 100
METRIC RATING
320th/ 347
METRIC RANK
17.2%
COGNITIVE DISABILITY
64.9/ 100
METRIC RATING
165th/ 347
METRIC RANK
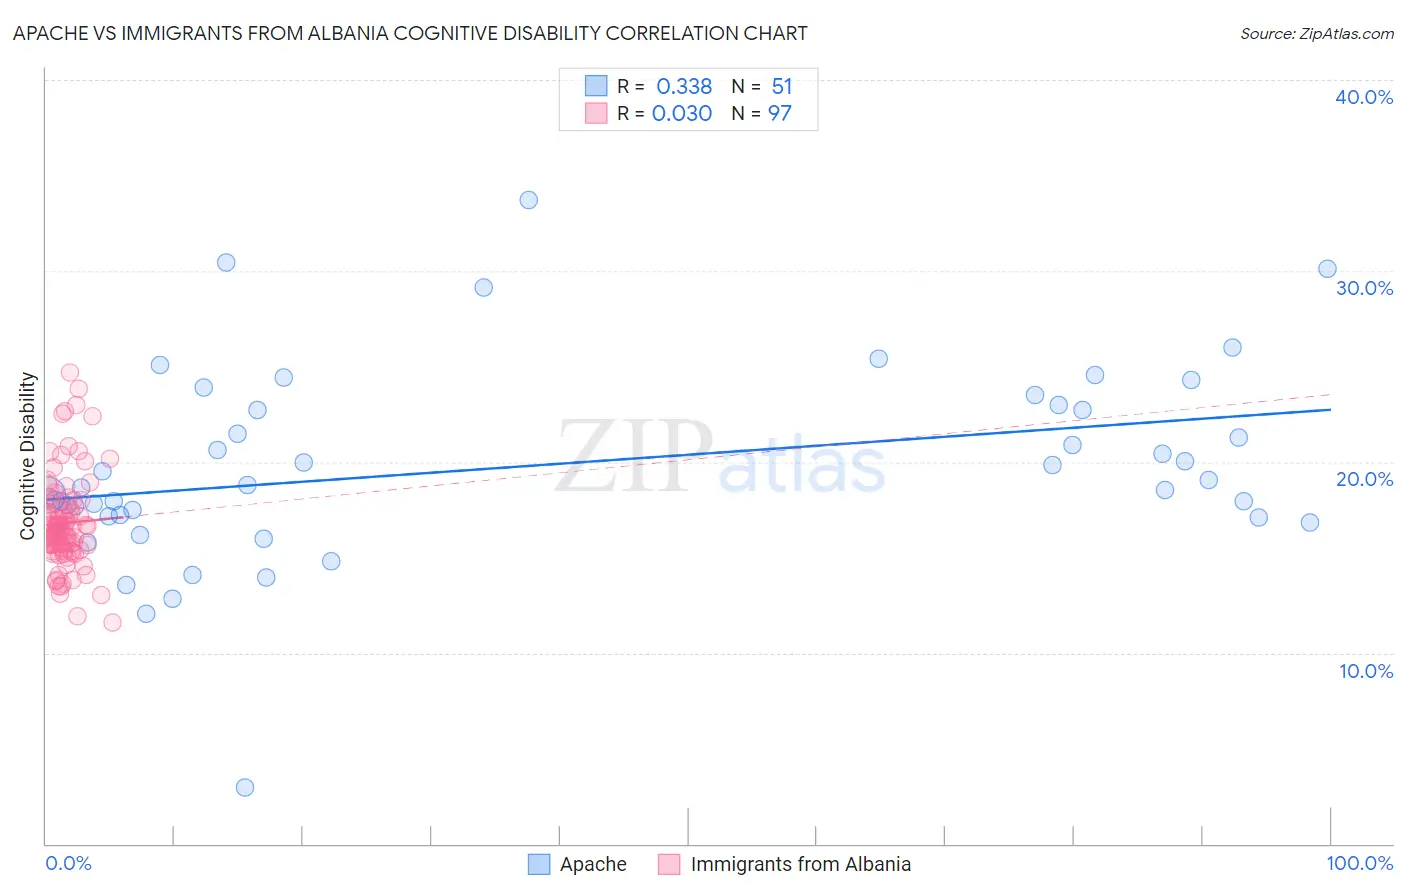
Apache vs Immigrants from Albania Cognitive Disability Correlation Chart
The statistical analysis conducted on geographies consisting of 231,073,406 people shows a mild positive correlation between the proportion of Apache and percentage of population with cognitive disability in the United States with a correlation coefficient (R) of 0.338 and weighted average of 18.6%. Similarly, the statistical analysis conducted on geographies consisting of 119,394,902 people shows no correlation between the proportion of Immigrants from Albania and percentage of population with cognitive disability in the United States with a correlation coefficient (R) of 0.030 and weighted average of 17.2%, a difference of 8.3%.
Cognitive Disability Correlation Summary
| Measurement | Apache | Immigrants from Albania |
| Minimum | 2.9% | 11.6% |
| Maximum | 33.7% | 24.7% |
| Range | 30.8% | 13.2% |
| Mean | 19.8% | 16.8% |
| Median | 18.8% | 16.4% |
| Interquartile 25% (IQ1) | 17.2% | 15.5% |
| Interquartile 75% (IQ3) | 23.0% | 17.7% |
| Interquartile Range (IQR) | 5.8% | 2.2% |
| Standard Deviation (Sample) | 5.2% | 2.4% |
| Standard Deviation (Population) | 5.2% | 2.4% |
Similar Demographics by Cognitive Disability
Demographics Similar to Apache by Cognitive Disability
In terms of cognitive disability, the demographic groups most similar to Apache are Comanche (18.6%, a difference of 0.040%), Bangladeshi (18.6%, a difference of 0.080%), African (18.6%, a difference of 0.090%), Immigrants from Liberia (18.7%, a difference of 0.16%), and Pueblo (18.7%, a difference of 0.17%).
| Demographics | Rating | Rank | Cognitive Disability |
| Yaqui | 0.0 /100 | #313 | Tragic 18.5% |
| Sub-Saharan Africans | 0.0 /100 | #314 | Tragic 18.5% |
| Immigrants | Dominica | 0.0 /100 | #315 | Tragic 18.6% |
| Immigrants | Middle Africa | 0.0 /100 | #316 | Tragic 18.6% |
| Liberians | 0.0 /100 | #317 | Tragic 18.6% |
| Bangladeshis | 0.0 /100 | #318 | Tragic 18.6% |
| Comanche | 0.0 /100 | #319 | Tragic 18.6% |
| Apache | 0.0 /100 | #320 | Tragic 18.6% |
| Africans | 0.0 /100 | #321 | Tragic 18.6% |
| Immigrants | Liberia | 0.0 /100 | #322 | Tragic 18.7% |
| Pueblo | 0.0 /100 | #323 | Tragic 18.7% |
| Dominicans | 0.0 /100 | #324 | Tragic 18.7% |
| Indonesians | 0.0 /100 | #325 | Tragic 18.7% |
| Immigrants | Senegal | 0.0 /100 | #326 | Tragic 18.7% |
| U.S. Virgin Islanders | 0.0 /100 | #327 | Tragic 18.7% |
Demographics Similar to Immigrants from Albania by Cognitive Disability
In terms of cognitive disability, the demographic groups most similar to Immigrants from Albania are Immigrants from Ecuador (17.2%, a difference of 0.010%), Immigrants from Syria (17.2%, a difference of 0.040%), Immigrants (17.2%, a difference of 0.070%), Immigrants from Portugal (17.2%, a difference of 0.090%), and Ecuadorian (17.2%, a difference of 0.16%).
| Demographics | Rating | Rank | Cognitive Disability |
| Celtics | 74.1 /100 | #158 | Good 17.1% |
| Immigrants | Latvia | 73.2 /100 | #159 | Good 17.2% |
| Australians | 72.4 /100 | #160 | Good 17.2% |
| Americans | 72.2 /100 | #161 | Good 17.2% |
| Yugoslavians | 71.6 /100 | #162 | Good 17.2% |
| Immigrants | Switzerland | 71.5 /100 | #163 | Good 17.2% |
| Armenians | 70.1 /100 | #164 | Good 17.2% |
| Immigrants | Albania | 64.9 /100 | #165 | Good 17.2% |
| Immigrants | Ecuador | 64.4 /100 | #166 | Good 17.2% |
| Immigrants | Syria | 63.5 /100 | #167 | Good 17.2% |
| Immigrants | Immigrants | 62.5 /100 | #168 | Good 17.2% |
| Immigrants | Portugal | 61.8 /100 | #169 | Good 17.2% |
| Ecuadorians | 59.6 /100 | #170 | Average 17.2% |
| Tlingit-Haida | 59.4 /100 | #171 | Average 17.2% |
| Immigrants | Turkey | 56.7 /100 | #172 | Average 17.2% |