Aleut vs Uruguayan Disability
COMPARE
Aleut
Uruguayan
Disability
Disability Comparison
Aleuts
Uruguayans
13.1%
DISABILITY
0.0/ 100
METRIC RATING
292nd/ 347
METRIC RANK
11.2%
DISABILITY
97.4/ 100
METRIC RATING
98th/ 347
METRIC RANK
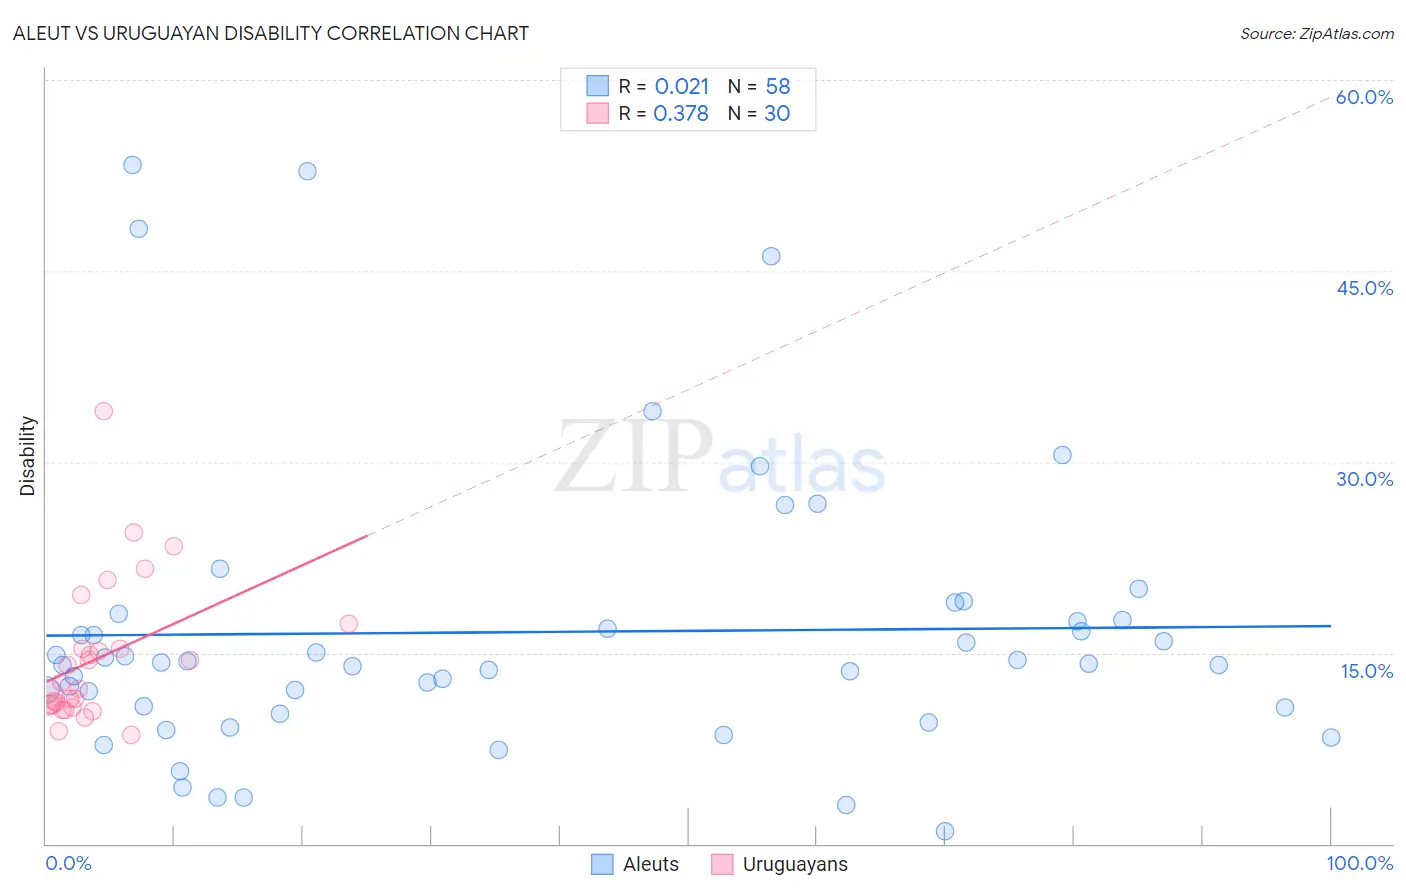
Aleut vs Uruguayan Disability Correlation Chart
The statistical analysis conducted on geographies consisting of 61,782,940 people shows no correlation between the proportion of Aleuts and percentage of population with a disability in the United States with a correlation coefficient (R) of 0.021 and weighted average of 13.1%. Similarly, the statistical analysis conducted on geographies consisting of 144,784,951 people shows a mild positive correlation between the proportion of Uruguayans and percentage of population with a disability in the United States with a correlation coefficient (R) of 0.378 and weighted average of 11.2%, a difference of 16.6%.
Disability Correlation Summary
| Measurement | Aleut | Uruguayan |
| Minimum | 0.97% | 8.6% |
| Maximum | 53.3% | 34.0% |
| Range | 52.4% | 25.4% |
| Mean | 16.6% | 14.6% |
| Median | 14.2% | 12.4% |
| Interquartile 25% (IQ1) | 10.7% | 10.9% |
| Interquartile 75% (IQ3) | 17.6% | 15.3% |
| Interquartile Range (IQR) | 6.9% | 4.4% |
| Standard Deviation (Sample) | 11.3% | 5.6% |
| Standard Deviation (Population) | 11.2% | 5.5% |
Similar Demographics by Disability
Demographics Similar to Aleuts by Disability
In terms of disability, the demographic groups most similar to Aleuts are Marshallese (13.1%, a difference of 0.0%), Celtic (13.1%, a difference of 0.30%), Yaqui (13.1%, a difference of 0.36%), Nonimmigrants (13.2%, a difference of 0.42%), and Central American Indian (13.2%, a difference of 0.46%).
| Demographics | Rating | Rank | Disability |
| Crow | 0.0 /100 | #285 | Tragic 12.9% |
| English | 0.0 /100 | #286 | Tragic 13.0% |
| Africans | 0.0 /100 | #287 | Tragic 13.0% |
| Whites/Caucasians | 0.0 /100 | #288 | Tragic 13.0% |
| Slovaks | 0.0 /100 | #289 | Tragic 13.0% |
| Cheyenne | 0.0 /100 | #290 | Tragic 13.0% |
| Yaqui | 0.0 /100 | #291 | Tragic 13.1% |
| Aleuts | 0.0 /100 | #292 | Tragic 13.1% |
| Marshallese | 0.0 /100 | #293 | Tragic 13.1% |
| Celtics | 0.0 /100 | #294 | Tragic 13.1% |
| Immigrants | Nonimmigrants | 0.0 /100 | #295 | Tragic 13.2% |
| Central American Indians | 0.0 /100 | #296 | Tragic 13.2% |
| Hopi | 0.0 /100 | #297 | Tragic 13.2% |
| Alaska Natives | 0.0 /100 | #298 | Tragic 13.2% |
| French | 0.0 /100 | #299 | Tragic 13.2% |
Demographics Similar to Uruguayans by Disability
In terms of disability, the demographic groups most similar to Uruguayans are Bhutanese (11.2%, a difference of 0.0%), Immigrants from Czechoslovakia (11.2%, a difference of 0.010%), Immigrants from Zimbabwe (11.2%, a difference of 0.14%), Immigrants from Greece (11.3%, a difference of 0.18%), and Immigrants from Morocco (11.2%, a difference of 0.21%).
| Demographics | Rating | Rank | Disability |
| Immigrants | Western Asia | 98.1 /100 | #91 | Exceptional 11.2% |
| Ecuadorians | 98.0 /100 | #92 | Exceptional 11.2% |
| Immigrants | Ecuador | 98.0 /100 | #93 | Exceptional 11.2% |
| Immigrants | Morocco | 97.8 /100 | #94 | Exceptional 11.2% |
| Eastern Europeans | 97.8 /100 | #95 | Exceptional 11.2% |
| Immigrants | Zimbabwe | 97.7 /100 | #96 | Exceptional 11.2% |
| Bhutanese | 97.4 /100 | #97 | Exceptional 11.2% |
| Uruguayans | 97.4 /100 | #98 | Exceptional 11.2% |
| Immigrants | Czechoslovakia | 97.4 /100 | #99 | Exceptional 11.2% |
| Immigrants | Greece | 96.9 /100 | #100 | Exceptional 11.3% |
| Immigrants | Nicaragua | 96.8 /100 | #101 | Exceptional 11.3% |
| Immigrants | Eastern Africa | 96.7 /100 | #102 | Exceptional 11.3% |
| Immigrants | Uruguay | 96.4 /100 | #103 | Exceptional 11.3% |
| Immigrants | Immigrants | 96.4 /100 | #104 | Exceptional 11.3% |
| Immigrants | Kazakhstan | 96.4 /100 | #105 | Exceptional 11.3% |