Aleut vs Paraguayan Disability
COMPARE
Aleut
Paraguayan
Disability
Disability Comparison
Aleuts
Paraguayans
13.1%
DISABILITY
0.0/ 100
METRIC RATING
292nd/ 347
METRIC RANK
10.6%
DISABILITY
100.0/ 100
METRIC RATING
32nd/ 347
METRIC RANK
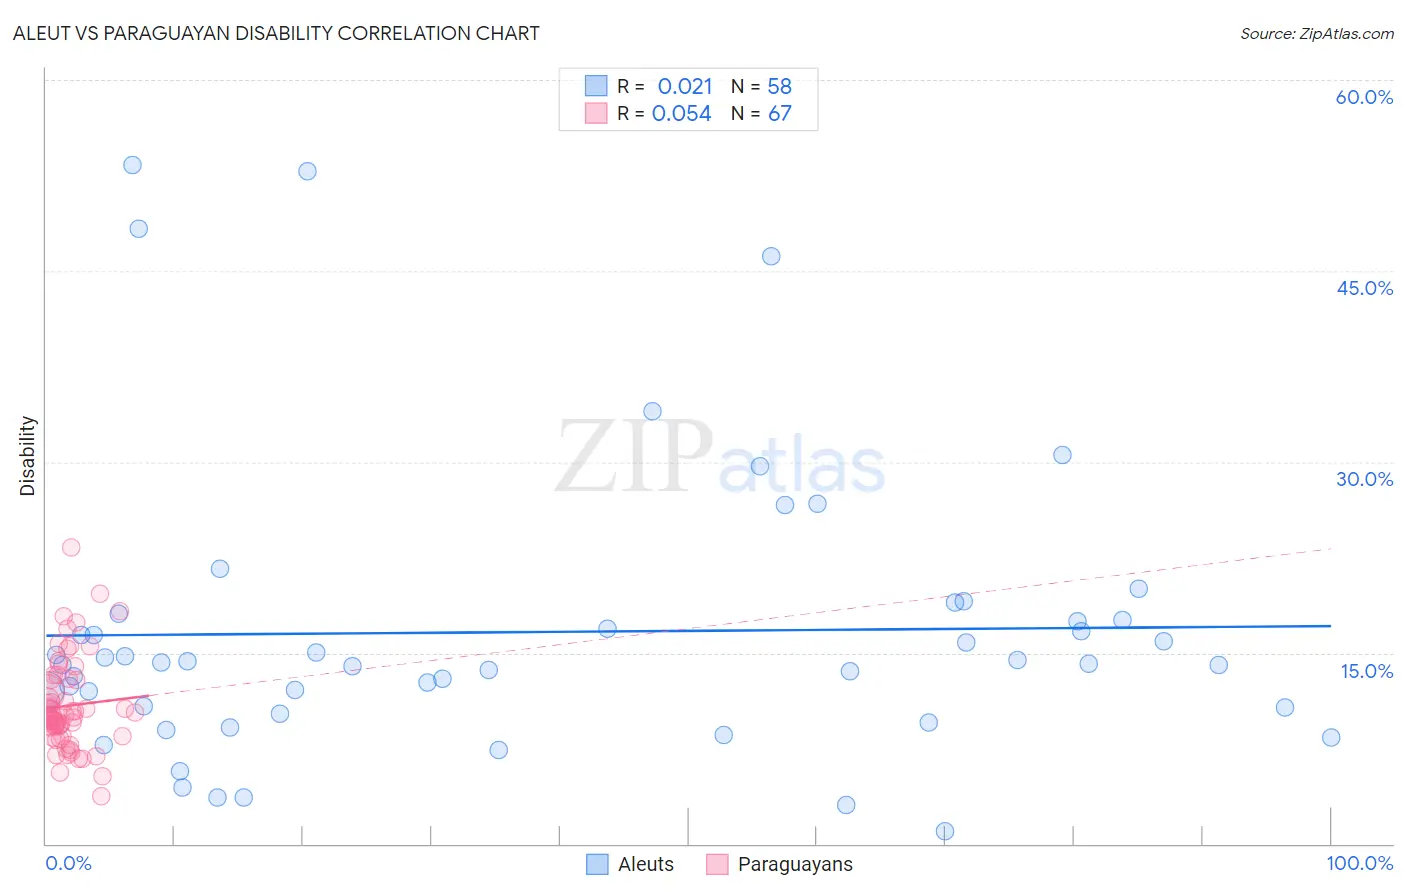
Aleut vs Paraguayan Disability Correlation Chart
The statistical analysis conducted on geographies consisting of 61,782,940 people shows no correlation between the proportion of Aleuts and percentage of population with a disability in the United States with a correlation coefficient (R) of 0.021 and weighted average of 13.1%. Similarly, the statistical analysis conducted on geographies consisting of 95,111,700 people shows a slight positive correlation between the proportion of Paraguayans and percentage of population with a disability in the United States with a correlation coefficient (R) of 0.054 and weighted average of 10.6%, a difference of 23.0%.
Disability Correlation Summary
| Measurement | Aleut | Paraguayan |
| Minimum | 0.97% | 3.7% |
| Maximum | 53.3% | 23.3% |
| Range | 52.4% | 19.6% |
| Mean | 16.6% | 10.8% |
| Median | 14.2% | 10.1% |
| Interquartile 25% (IQ1) | 10.7% | 8.5% |
| Interquartile 75% (IQ3) | 17.6% | 12.9% |
| Interquartile Range (IQR) | 6.9% | 4.4% |
| Standard Deviation (Sample) | 11.3% | 3.6% |
| Standard Deviation (Population) | 11.2% | 3.6% |
Similar Demographics by Disability
Demographics Similar to Aleuts by Disability
In terms of disability, the demographic groups most similar to Aleuts are Marshallese (13.1%, a difference of 0.0%), Celtic (13.1%, a difference of 0.30%), Yaqui (13.1%, a difference of 0.36%), Nonimmigrants (13.2%, a difference of 0.42%), and Central American Indian (13.2%, a difference of 0.46%).
| Demographics | Rating | Rank | Disability |
| Crow | 0.0 /100 | #285 | Tragic 12.9% |
| English | 0.0 /100 | #286 | Tragic 13.0% |
| Africans | 0.0 /100 | #287 | Tragic 13.0% |
| Whites/Caucasians | 0.0 /100 | #288 | Tragic 13.0% |
| Slovaks | 0.0 /100 | #289 | Tragic 13.0% |
| Cheyenne | 0.0 /100 | #290 | Tragic 13.0% |
| Yaqui | 0.0 /100 | #291 | Tragic 13.1% |
| Aleuts | 0.0 /100 | #292 | Tragic 13.1% |
| Marshallese | 0.0 /100 | #293 | Tragic 13.1% |
| Celtics | 0.0 /100 | #294 | Tragic 13.1% |
| Immigrants | Nonimmigrants | 0.0 /100 | #295 | Tragic 13.2% |
| Central American Indians | 0.0 /100 | #296 | Tragic 13.2% |
| Hopi | 0.0 /100 | #297 | Tragic 13.2% |
| Alaska Natives | 0.0 /100 | #298 | Tragic 13.2% |
| French | 0.0 /100 | #299 | Tragic 13.2% |
Demographics Similar to Paraguayans by Disability
In terms of disability, the demographic groups most similar to Paraguayans are Immigrants from Egypt (10.6%, a difference of 0.10%), Immigrants from Turkey (10.6%, a difference of 0.17%), Immigrants from Kuwait (10.7%, a difference of 0.25%), Immigrants from Argentina (10.6%, a difference of 0.33%), and Egyptian (10.6%, a difference of 0.46%).
| Demographics | Rating | Rank | Disability |
| Immigrants | Malaysia | 100.0 /100 | #25 | Exceptional 10.6% |
| Argentineans | 100.0 /100 | #26 | Exceptional 10.6% |
| Cypriots | 100.0 /100 | #27 | Exceptional 10.6% |
| Egyptians | 100.0 /100 | #28 | Exceptional 10.6% |
| Immigrants | Argentina | 100.0 /100 | #29 | Exceptional 10.6% |
| Immigrants | Turkey | 100.0 /100 | #30 | Exceptional 10.6% |
| Immigrants | Egypt | 100.0 /100 | #31 | Exceptional 10.6% |
| Paraguayans | 100.0 /100 | #32 | Exceptional 10.6% |
| Immigrants | Kuwait | 100.0 /100 | #33 | Exceptional 10.7% |
| Immigrants | Ethiopia | 100.0 /100 | #34 | Exceptional 10.7% |
| Immigrants | Indonesia | 100.0 /100 | #35 | Exceptional 10.7% |
| Ethiopians | 100.0 /100 | #36 | Exceptional 10.7% |
| Turks | 100.0 /100 | #37 | Exceptional 10.7% |
| Afghans | 99.9 /100 | #38 | Exceptional 10.8% |
| Cambodians | 99.9 /100 | #39 | Exceptional 10.8% |