Aleut vs Liberian Disability
COMPARE
Aleut
Liberian
Disability
Disability Comparison
Aleuts
Liberians
13.1%
DISABILITY
0.0/ 100
METRIC RATING
292nd/ 347
METRIC RANK
12.2%
DISABILITY
1.5/ 100
METRIC RATING
245th/ 347
METRIC RANK
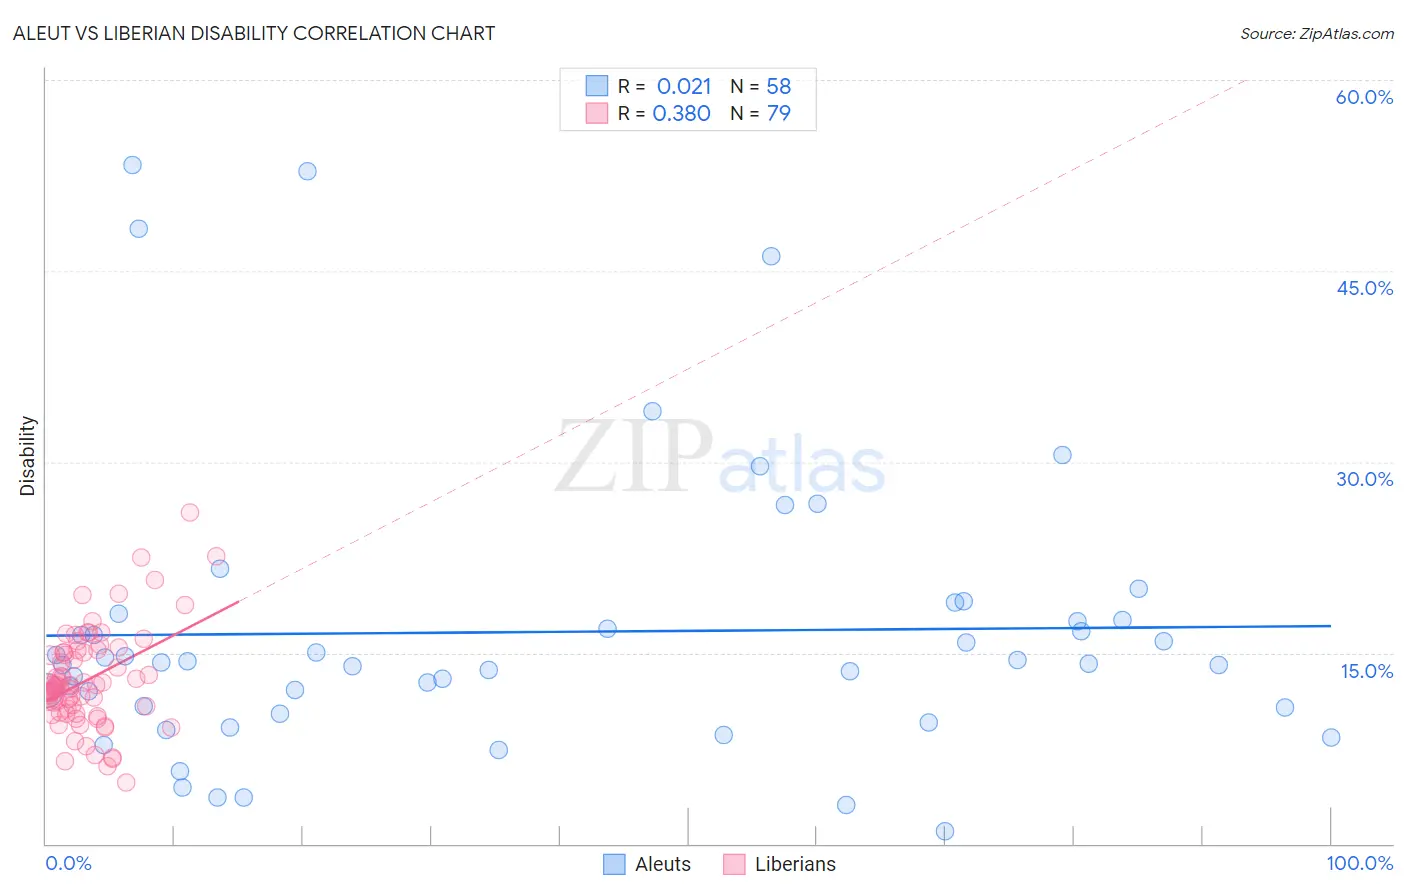
Aleut vs Liberian Disability Correlation Chart
The statistical analysis conducted on geographies consisting of 61,782,940 people shows no correlation between the proportion of Aleuts and percentage of population with a disability in the United States with a correlation coefficient (R) of 0.021 and weighted average of 13.1%. Similarly, the statistical analysis conducted on geographies consisting of 118,083,063 people shows a mild positive correlation between the proportion of Liberians and percentage of population with a disability in the United States with a correlation coefficient (R) of 0.380 and weighted average of 12.2%, a difference of 7.0%.
Disability Correlation Summary
| Measurement | Aleut | Liberian |
| Minimum | 0.97% | 4.8% |
| Maximum | 53.3% | 26.0% |
| Range | 52.4% | 21.2% |
| Mean | 16.6% | 12.9% |
| Median | 14.2% | 12.3% |
| Interquartile 25% (IQ1) | 10.7% | 10.3% |
| Interquartile 75% (IQ3) | 17.6% | 15.0% |
| Interquartile Range (IQR) | 6.9% | 4.7% |
| Standard Deviation (Sample) | 11.3% | 3.9% |
| Standard Deviation (Population) | 11.2% | 3.9% |
Similar Demographics by Disability
Demographics Similar to Aleuts by Disability
In terms of disability, the demographic groups most similar to Aleuts are Marshallese (13.1%, a difference of 0.0%), Celtic (13.1%, a difference of 0.30%), Yaqui (13.1%, a difference of 0.36%), Nonimmigrants (13.2%, a difference of 0.42%), and Central American Indian (13.2%, a difference of 0.46%).
| Demographics | Rating | Rank | Disability |
| Crow | 0.0 /100 | #285 | Tragic 12.9% |
| English | 0.0 /100 | #286 | Tragic 13.0% |
| Africans | 0.0 /100 | #287 | Tragic 13.0% |
| Whites/Caucasians | 0.0 /100 | #288 | Tragic 13.0% |
| Slovaks | 0.0 /100 | #289 | Tragic 13.0% |
| Cheyenne | 0.0 /100 | #290 | Tragic 13.0% |
| Yaqui | 0.0 /100 | #291 | Tragic 13.1% |
| Aleuts | 0.0 /100 | #292 | Tragic 13.1% |
| Marshallese | 0.0 /100 | #293 | Tragic 13.1% |
| Celtics | 0.0 /100 | #294 | Tragic 13.1% |
| Immigrants | Nonimmigrants | 0.0 /100 | #295 | Tragic 13.2% |
| Central American Indians | 0.0 /100 | #296 | Tragic 13.2% |
| Hopi | 0.0 /100 | #297 | Tragic 13.2% |
| Alaska Natives | 0.0 /100 | #298 | Tragic 13.2% |
| French | 0.0 /100 | #299 | Tragic 13.2% |
Demographics Similar to Liberians by Disability
In terms of disability, the demographic groups most similar to Liberians are British (12.2%, a difference of 0.020%), Basque (12.2%, a difference of 0.020%), Swiss (12.2%, a difference of 0.030%), Indonesian (12.2%, a difference of 0.060%), and Polish (12.2%, a difference of 0.10%).
| Demographics | Rating | Rank | Disability |
| Norwegians | 1.9 /100 | #238 | Tragic 12.2% |
| Swedes | 1.8 /100 | #239 | Tragic 12.2% |
| Hungarians | 1.7 /100 | #240 | Tragic 12.2% |
| Yugoslavians | 1.7 /100 | #241 | Tragic 12.2% |
| Poles | 1.7 /100 | #242 | Tragic 12.2% |
| British | 1.5 /100 | #243 | Tragic 12.2% |
| Basques | 1.5 /100 | #244 | Tragic 12.2% |
| Liberians | 1.5 /100 | #245 | Tragic 12.2% |
| Swiss | 1.5 /100 | #246 | Tragic 12.2% |
| Indonesians | 1.4 /100 | #247 | Tragic 12.2% |
| Guamanians/Chamorros | 1.4 /100 | #248 | Tragic 12.3% |
| Carpatho Rusyns | 1.4 /100 | #249 | Tragic 12.3% |
| Sub-Saharan Africans | 1.4 /100 | #250 | Tragic 12.3% |
| Europeans | 1.4 /100 | #251 | Tragic 12.3% |
| Bermudans | 1.1 /100 | #252 | Tragic 12.3% |