Somali vs Liberian Disability
COMPARE
Somali
Liberian
Disability
Disability Comparison
Somalis
Liberians
11.9%
DISABILITY
17.3/ 100
METRIC RATING
194th/ 347
METRIC RANK
12.2%
DISABILITY
1.5/ 100
METRIC RATING
245th/ 347
METRIC RANK
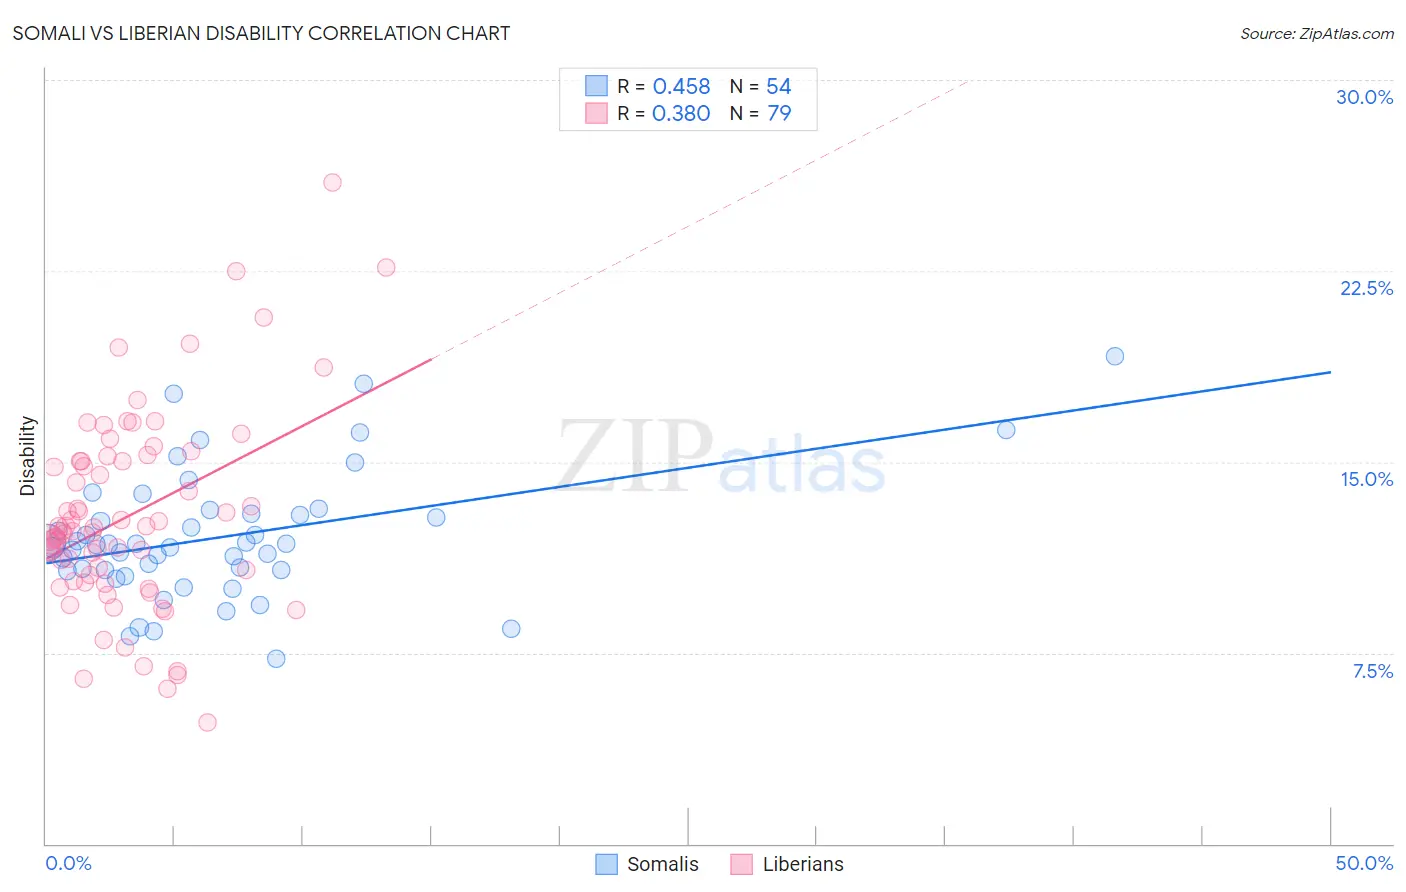
Somali vs Liberian Disability Correlation Chart
The statistical analysis conducted on geographies consisting of 99,315,749 people shows a moderate positive correlation between the proportion of Somalis and percentage of population with a disability in the United States with a correlation coefficient (R) of 0.458 and weighted average of 11.9%. Similarly, the statistical analysis conducted on geographies consisting of 118,083,063 people shows a mild positive correlation between the proportion of Liberians and percentage of population with a disability in the United States with a correlation coefficient (R) of 0.380 and weighted average of 12.2%, a difference of 2.8%.
Disability Correlation Summary
| Measurement | Somali | Liberian |
| Minimum | 7.3% | 4.8% |
| Maximum | 19.1% | 26.0% |
| Range | 11.8% | 21.2% |
| Mean | 12.0% | 12.9% |
| Median | 11.8% | 12.3% |
| Interquartile 25% (IQ1) | 10.8% | 10.3% |
| Interquartile 75% (IQ3) | 12.9% | 15.0% |
| Interquartile Range (IQR) | 2.2% | 4.7% |
| Standard Deviation (Sample) | 2.5% | 3.9% |
| Standard Deviation (Population) | 2.5% | 3.9% |
Similar Demographics by Disability
Demographics Similar to Somalis by Disability
In terms of disability, the demographic groups most similar to Somalis are Immigrants from Bosnia and Herzegovina (11.9%, a difference of 0.050%), Lithuanian (11.9%, a difference of 0.11%), Barbadian (11.9%, a difference of 0.11%), Serbian (11.9%, a difference of 0.15%), and Ute (11.9%, a difference of 0.16%).
| Demographics | Rating | Rank | Disability |
| Lebanese | 27.9 /100 | #187 | Fair 11.8% |
| Immigrants | Mexico | 23.8 /100 | #188 | Fair 11.9% |
| Immigrants | Zaire | 21.8 /100 | #189 | Fair 11.9% |
| Immigrants | West Indies | 21.1 /100 | #190 | Fair 11.9% |
| Ute | 19.5 /100 | #191 | Poor 11.9% |
| Lithuanians | 18.8 /100 | #192 | Poor 11.9% |
| Immigrants | Bosnia and Herzegovina | 18.0 /100 | #193 | Poor 11.9% |
| Somalis | 17.3 /100 | #194 | Poor 11.9% |
| Barbadians | 15.8 /100 | #195 | Poor 11.9% |
| Serbians | 15.4 /100 | #196 | Poor 11.9% |
| Immigrants | Belize | 15.2 /100 | #197 | Poor 11.9% |
| Ukrainians | 14.7 /100 | #198 | Poor 11.9% |
| Immigrants | Panama | 14.6 /100 | #199 | Poor 11.9% |
| Belizeans | 12.8 /100 | #200 | Poor 11.9% |
| Assyrians/Chaldeans/Syriacs | 12.6 /100 | #201 | Poor 11.9% |
Demographics Similar to Liberians by Disability
In terms of disability, the demographic groups most similar to Liberians are British (12.2%, a difference of 0.020%), Basque (12.2%, a difference of 0.020%), Swiss (12.2%, a difference of 0.030%), Indonesian (12.2%, a difference of 0.060%), and Polish (12.2%, a difference of 0.10%).
| Demographics | Rating | Rank | Disability |
| Norwegians | 1.9 /100 | #238 | Tragic 12.2% |
| Swedes | 1.8 /100 | #239 | Tragic 12.2% |
| Hungarians | 1.7 /100 | #240 | Tragic 12.2% |
| Yugoslavians | 1.7 /100 | #241 | Tragic 12.2% |
| Poles | 1.7 /100 | #242 | Tragic 12.2% |
| British | 1.5 /100 | #243 | Tragic 12.2% |
| Basques | 1.5 /100 | #244 | Tragic 12.2% |
| Liberians | 1.5 /100 | #245 | Tragic 12.2% |
| Swiss | 1.5 /100 | #246 | Tragic 12.2% |
| Indonesians | 1.4 /100 | #247 | Tragic 12.2% |
| Guamanians/Chamorros | 1.4 /100 | #248 | Tragic 12.3% |
| Carpatho Rusyns | 1.4 /100 | #249 | Tragic 12.3% |
| Sub-Saharan Africans | 1.4 /100 | #250 | Tragic 12.3% |
| Europeans | 1.4 /100 | #251 | Tragic 12.3% |
| Bermudans | 1.1 /100 | #252 | Tragic 12.3% |