Hmong vs Liberian Disability
COMPARE
Hmong
Liberian
Disability
Disability Comparison
Hmong
Liberians
12.8%
DISABILITY
0.0/ 100
METRIC RATING
276th/ 347
METRIC RANK
12.2%
DISABILITY
1.5/ 100
METRIC RATING
245th/ 347
METRIC RANK
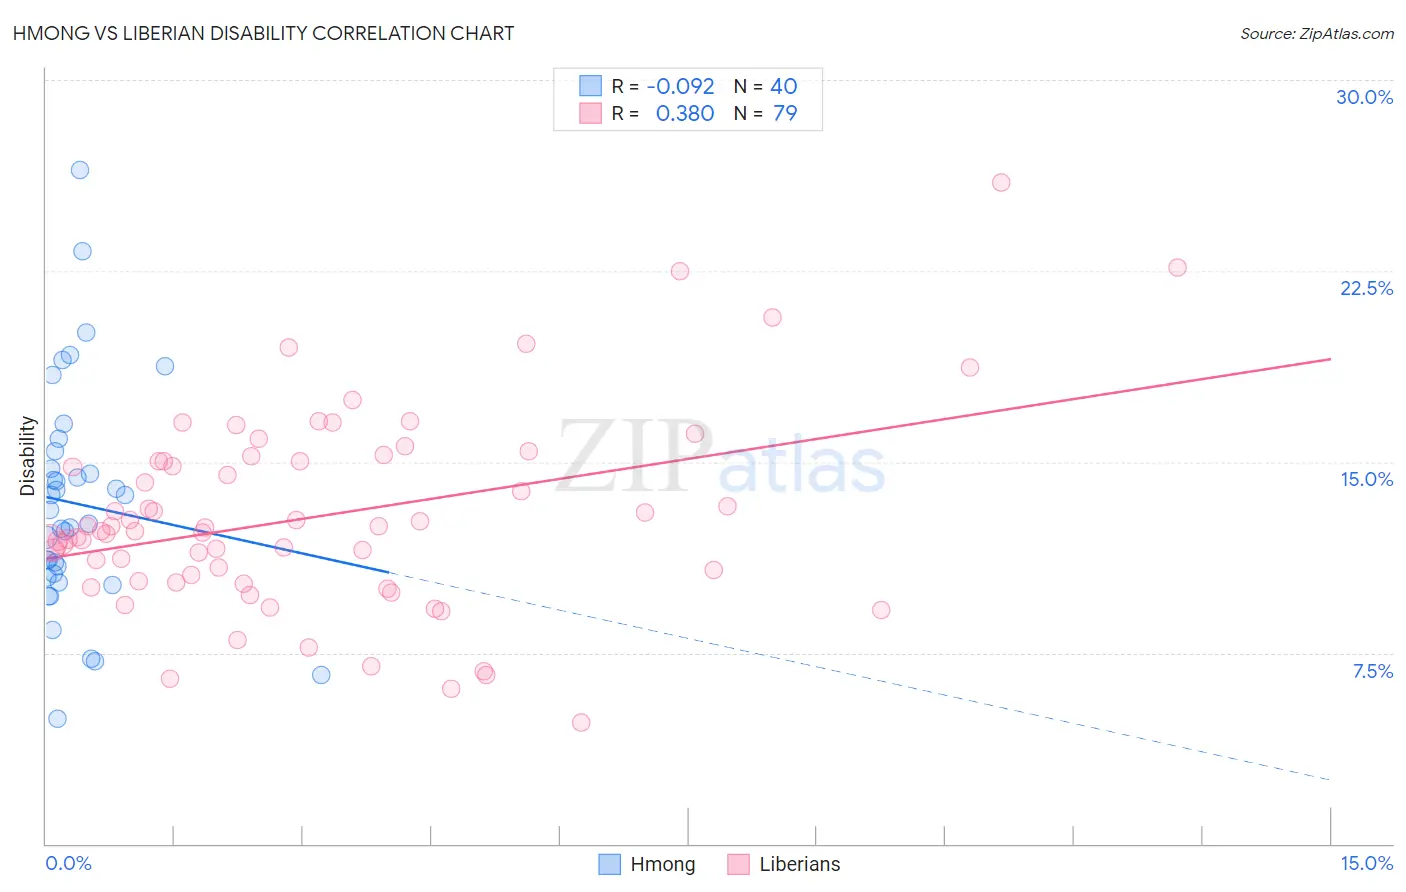
Hmong vs Liberian Disability Correlation Chart
The statistical analysis conducted on geographies consisting of 24,681,537 people shows a slight negative correlation between the proportion of Hmong and percentage of population with a disability in the United States with a correlation coefficient (R) of -0.092 and weighted average of 12.8%. Similarly, the statistical analysis conducted on geographies consisting of 118,083,063 people shows a mild positive correlation between the proportion of Liberians and percentage of population with a disability in the United States with a correlation coefficient (R) of 0.380 and weighted average of 12.2%, a difference of 4.5%.
Disability Correlation Summary
| Measurement | Hmong | Liberian |
| Minimum | 4.9% | 4.8% |
| Maximum | 26.4% | 26.0% |
| Range | 21.5% | 21.2% |
| Mean | 13.4% | 12.9% |
| Median | 12.8% | 12.3% |
| Interquartile 25% (IQ1) | 10.5% | 10.3% |
| Interquartile 75% (IQ3) | 15.1% | 15.0% |
| Interquartile Range (IQR) | 4.5% | 4.7% |
| Standard Deviation (Sample) | 4.4% | 3.9% |
| Standard Deviation (Population) | 4.4% | 3.9% |
Similar Demographics by Disability
Demographics Similar to Hmong by Disability
In terms of disability, the demographic groups most similar to Hmong are Dutch (12.8%, a difference of 0.050%), Sioux (12.8%, a difference of 0.15%), German (12.8%, a difference of 0.22%), Nepalese (12.8%, a difference of 0.23%), and Fijian (12.8%, a difference of 0.31%).
| Demographics | Rating | Rank | Disability |
| Immigrants | Dominican Republic | 0.1 /100 | #269 | Tragic 12.6% |
| Portuguese | 0.1 /100 | #270 | Tragic 12.6% |
| Immigrants | Yemen | 0.1 /100 | #271 | Tragic 12.6% |
| Dominicans | 0.0 /100 | #272 | Tragic 12.7% |
| Finns | 0.0 /100 | #273 | Tragic 12.7% |
| Nepalese | 0.0 /100 | #274 | Tragic 12.8% |
| Sioux | 0.0 /100 | #275 | Tragic 12.8% |
| Hmong | 0.0 /100 | #276 | Tragic 12.8% |
| Dutch | 0.0 /100 | #277 | Tragic 12.8% |
| Germans | 0.0 /100 | #278 | Tragic 12.8% |
| Fijians | 0.0 /100 | #279 | Tragic 12.8% |
| Spanish | 0.0 /100 | #280 | Tragic 12.8% |
| Immigrants | Portugal | 0.0 /100 | #281 | Tragic 12.9% |
| Scottish | 0.0 /100 | #282 | Tragic 12.9% |
| Irish | 0.0 /100 | #283 | Tragic 12.9% |
Demographics Similar to Liberians by Disability
In terms of disability, the demographic groups most similar to Liberians are British (12.2%, a difference of 0.020%), Basque (12.2%, a difference of 0.020%), Swiss (12.2%, a difference of 0.030%), Indonesian (12.2%, a difference of 0.060%), and Polish (12.2%, a difference of 0.10%).
| Demographics | Rating | Rank | Disability |
| Norwegians | 1.9 /100 | #238 | Tragic 12.2% |
| Swedes | 1.8 /100 | #239 | Tragic 12.2% |
| Hungarians | 1.7 /100 | #240 | Tragic 12.2% |
| Yugoslavians | 1.7 /100 | #241 | Tragic 12.2% |
| Poles | 1.7 /100 | #242 | Tragic 12.2% |
| British | 1.5 /100 | #243 | Tragic 12.2% |
| Basques | 1.5 /100 | #244 | Tragic 12.2% |
| Liberians | 1.5 /100 | #245 | Tragic 12.2% |
| Swiss | 1.5 /100 | #246 | Tragic 12.2% |
| Indonesians | 1.4 /100 | #247 | Tragic 12.2% |
| Guamanians/Chamorros | 1.4 /100 | #248 | Tragic 12.3% |
| Carpatho Rusyns | 1.4 /100 | #249 | Tragic 12.3% |
| Sub-Saharan Africans | 1.4 /100 | #250 | Tragic 12.3% |
| Europeans | 1.4 /100 | #251 | Tragic 12.3% |
| Bermudans | 1.1 /100 | #252 | Tragic 12.3% |