Aleut vs Immigrants from Eastern Europe Female Unemployment

COMPARE

Aleut
Race
Ancestry
AfghanAfricanAlaska NativeAlaskan AthabascanAlbanianAleutAlsatianAmericanApacheArabArapahoArgentineanArmenianAssyrian/Chaldean/SyriacAustralianAustrianBahamianBangladeshiBarbadianBasqueBelgianBelizeanBermudanBhutaneseBlackfeetBolivianBrazilianBritishBritish West IndianBulgarianBurmeseCajunCambodianCanadianCape VerdeanCarpatho RusynCelticCentral AmericanCentral American IndianCherokeeCheyenneChickasawChileanChineseChippewaChoctawColombianColvilleComancheCosta RicanCreeCreekCroatianCrowCubanCypriotCzechCzechoslovakianDanishDelawareDominicanDutchDutch West IndianEastern EuropeanEcuadorianEgyptianEnglishEstonianEthiopianEuropeanFijianFilipinoFinnishFrenchFrench American IndianFrench CanadianGermanGerman RussianGhanaianGreekGuamanian/ChamorroGuatemalanGuyaneseHaitianHmongHonduranHopiHoumaHungarianIcelanderIndian (Asian)IndonesianInupiatIranianIraqiIrishIroquoisIsraeliItalianJamaicanJapaneseJordanianKenyanKiowaKoreanLaotianLatvianLebaneseLiberianLithuanianLumbeeLuxembourgerMacedonianMalaysianMalteseMarshalleseMenomineeMexicanMexican American IndianMongolianMoroccanNative HawaiianNavajoNepaleseNew ZealanderNicaraguanNigerianNorthern EuropeanNorwegianOkinawanOsageOttawaPaiutePakistaniPalestinianPanamanianParaguayanPennsylvania GermanPeruvianPimaPolishPortuguesePotawatomiPuebloPuerto RicanPuget Sound SalishRomanianRussianSalvadoranSamoanScandinavianScotch-IrishScottishSeminoleSenegaleseSerbianShoshoneSierra LeoneanSiouxSlavicSlovakSloveneSomaliSouth AfricanSouth AmericanSouth American IndianSoviet UnionSpaniardSpanishSpanish AmericanSpanish American IndianSri LankanSubsaharan AfricanSudaneseSwedishSwissSyrianTaiwaneseThaiTlingit-HaidaTohono O'OdhamTonganTrinidadian and TobagonianTsimshianTurkishU.S. Virgin IslanderUgandanUkrainianUruguayanUteVenezuelanVietnameseWelshWest IndianYakamaYaquiYugoslavianYumanYup'ikZimbabwean
Immigration
NonimmigrantsImmigrantsAfghanistanAfricaAlbaniaArgentinaArmeniaAsiaAustraliaAustriaBahamasBangladeshBarbadosBelarusBelgiumBelizeBoliviaBosnia and HerzegovinaBrazilBulgariaBurma/MyanmarCabo VerdeCambodiaCameroonCanadaCaribbeanCentral AmericaChileChinaColombiaCongoCosta RicaCroatiaCubaCzechoslovakiaDenmarkDominicaDominican RepublicEastern AfricaEastern AsiaEcuadorEgyptEl SalvadorEnglandEritreaEthiopiaEuropeFijiFranceGermanyGhanaGreeceGrenadaGuatemalaGuyanaHaitiHondurasHong KongHungaryIndiaIndonesiaIranIraqIrelandIsraelItalyJamaicaJapanJordanKazakhstanKenyaKoreaKuwaitLaosLatin AmericaLatviaLebanonLiberiaLithuaniaMalaysiaMexicoMicronesiaMiddle AfricaMoldovaMoroccoNepalNetherlandsNicaraguaNigeriaNorth AmericaNorth MacedoniaNorthern AfricaNorthern EuropeNorwayOceaniaPakistanPanamaPeruPhilippinesPolandPortugalRomaniaRussiaSaudi ArabiaScotlandSenegalSerbiaSierra LeoneSingaporeSomaliaSouth AfricaSouth AmericaSouth Central AsiaSouth Eastern AsiaSouthern EuropeSpainSri LankaSt. Vincent and the GrenadinesSudanSwedenSwitzerlandSyriaTaiwanThailandTrinidad and TobagoTurkeyUgandaUkraineUruguayUzbekistanVenezuelaVietnamWest IndiesWestern AfricaWestern AsiaWestern EuropeYemenZaireZimbabweAzores
Immigrants from Eastern Europe
Race
Ancestry
AfghanAfricanAlaska NativeAlaskan AthabascanAlbanianAlsatianAmericanApacheArabArapahoArgentineanArmenianAssyrian/Chaldean/SyriacAustralianAustrianBahamianBangladeshiBarbadianBasqueBelgianBelizeanBermudanBhutaneseBlackfeetBolivianBrazilianBritishBritish West IndianBulgarianBurmeseCajunCambodianCanadianCape VerdeanCarpatho RusynCelticCentral AmericanCentral American IndianCherokeeCheyenneChickasawChileanChineseChippewaChoctawColombianColvilleComancheCosta RicanCreeCreekCroatianCrowCubanCypriotCzechCzechoslovakianDanishDelawareDominicanDutchDutch West IndianEastern EuropeanEcuadorianEgyptianEnglishEstonianEthiopianEuropeanFijianFilipinoFinnishFrenchFrench American IndianFrench CanadianGermanGerman RussianGhanaianGreekGuamanian/ChamorroGuatemalanGuyaneseHaitianHmongHonduranHopiHoumaHungarianIcelanderIndian (Asian)IndonesianInupiatIranianIraqiIrishIroquoisIsraeliItalianJamaicanJapaneseJordanianKenyanKiowaKoreanLaotianLatvianLebaneseLiberianLithuanianLumbeeLuxembourgerMacedonianMalaysianMalteseMarshalleseMenomineeMexicanMexican American IndianMongolianMoroccanNative HawaiianNavajoNepaleseNew ZealanderNicaraguanNigerianNorthern EuropeanNorwegianOkinawanOsageOttawaPaiutePakistaniPalestinianPanamanianParaguayanPennsylvania GermanPeruvianPimaPolishPortuguesePotawatomiPuebloPuerto RicanPuget Sound SalishRomanianRussianSalvadoranSamoanScandinavianScotch-IrishScottishSeminoleSenegaleseSerbianShoshoneSierra LeoneanSiouxSlavicSlovakSloveneSomaliSouth AfricanSouth AmericanSouth American IndianSoviet UnionSpaniardSpanishSpanish AmericanSpanish American IndianSri LankanSubsaharan AfricanSudaneseSwedishSwissSyrianTaiwaneseThaiTlingit-HaidaTohono O'OdhamTonganTrinidadian and TobagonianTsimshianTurkishU.S. Virgin IslanderUgandanUkrainianUruguayanUteVenezuelanVietnameseWelshWest IndianYakamaYaquiYugoslavianYumanYup'ikZimbabwean
Immigration
NonimmigrantsImmigrantsAfghanistanAfricaAlbaniaArgentinaArmeniaAsiaAustraliaAustriaBahamasBangladeshBarbadosBelarusBelgiumBelizeBoliviaBosnia and HerzegovinaBrazilBulgariaBurma/MyanmarCabo VerdeCambodiaCameroonCanadaCaribbeanCentral AmericaChileChinaColombiaCongoCosta RicaCroatiaCubaCzechoslovakiaDenmarkDominicaDominican RepublicEastern AfricaEastern AsiaEastern EuropeEcuadorEgyptEl SalvadorEnglandEritreaEthiopiaEuropeFijiFranceGermanyGhanaGreeceGrenadaGuatemalaGuyanaHaitiHondurasHong KongHungaryIndiaIndonesiaIranIraqIrelandIsraelItalyJamaicaJapanJordanKazakhstanKenyaKoreaKuwaitLaosLatin AmericaLatviaLebanonLiberiaLithuaniaMalaysiaMexicoMicronesiaMiddle AfricaMoldovaMoroccoNepalNetherlandsNicaraguaNigeriaNorth AmericaNorth MacedoniaNorthern AfricaNorthern EuropeNorwayOceaniaPakistanPanamaPeruPhilippinesPolandPortugalRomaniaRussiaSaudi ArabiaScotlandSenegalSerbiaSierra LeoneSingaporeSomaliaSouth AfricaSouth AmericaSouth Central AsiaSouth Eastern AsiaSouthern EuropeSpainSri LankaSt. Vincent and the GrenadinesSudanSwedenSwitzerlandSyriaTaiwanThailandTrinidad and TobagoTurkeyUgandaUkraineUruguayUzbekistanVenezuelaVietnamWest IndiesWestern AfricaWestern AsiaWestern EuropeYemenZaireZimbabweAzores
Female Unemployment
Income
Poverty
Unemployment
Labor Participation
Family Structure
Vehicle Availability
Education Level
Disability

Female Unemployment Comparison

Aleuts

Immigrants from Eastern Europe

Tragic
Excellent
5.5%
FEMALE UNEMPLOYMENT
3.0/ 100
METRIC RATING
239th/ 347
METRIC RANK
5.1%
FEMALE UNEMPLOYMENT
81.5/ 100
METRIC RATING
141st/ 347
METRIC RANK

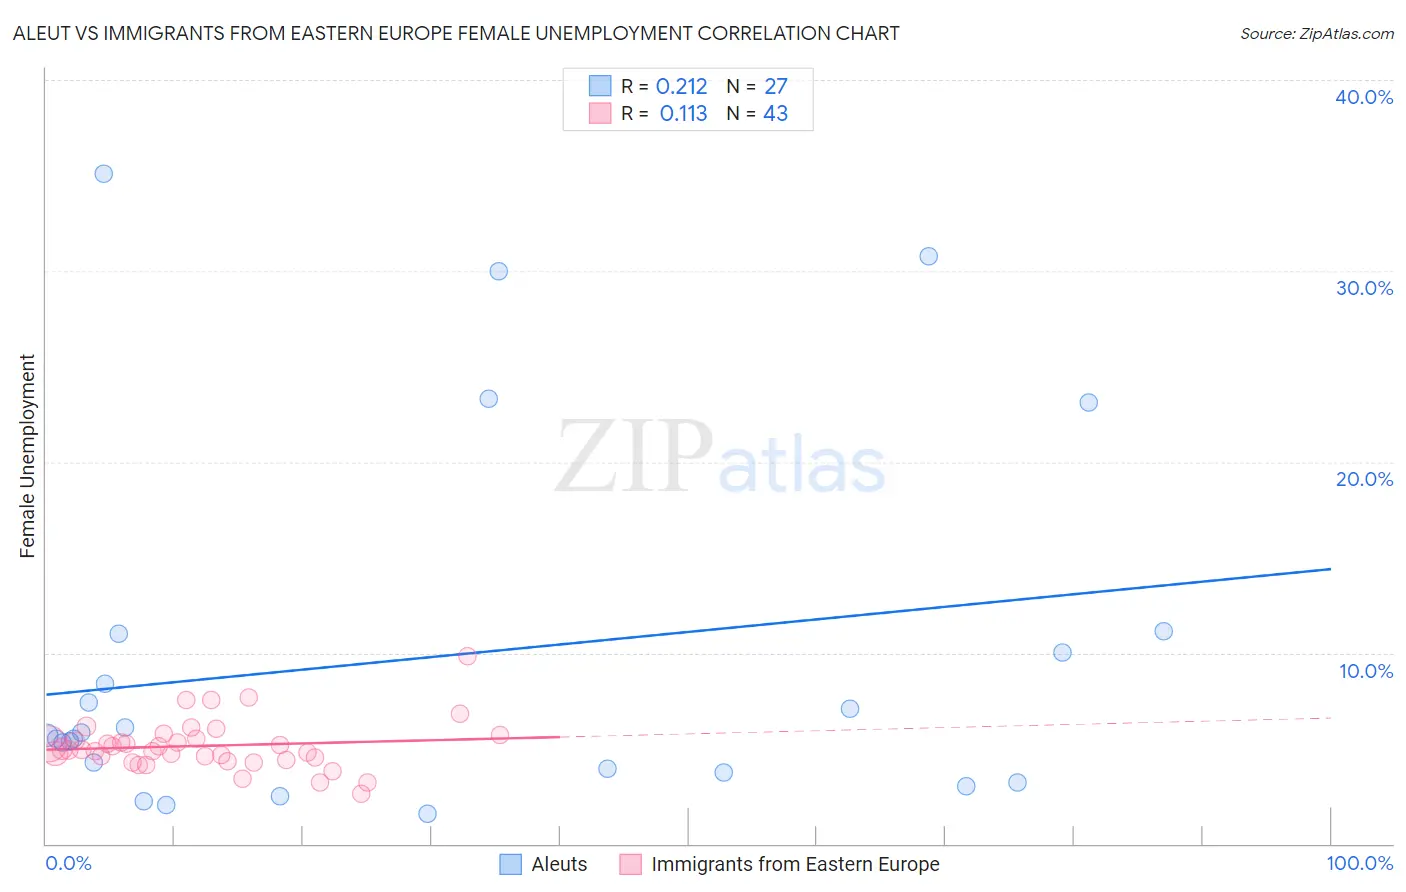
Aleut vs Immigrants from Eastern Europe Female Unemployment Correlation Chart

The statistical analysis conducted on geographies consisting of 61,655,077 people shows a weak positive correlation between the proportion of Aleuts and unemploymnet rate among females in the United States with a correlation coefficient (R) of 0.212 and weighted average of 5.5%. Similarly, the statistical analysis conducted on geographies consisting of 471,678,219 people shows a poor positive correlation between the proportion of Immigrants from Eastern Europe and unemploymnet rate among females in the United States with a correlation coefficient (R) of 0.113 and weighted average of 5.1%, a difference of 7.6%.
Aleut vs Immigrants from Eastern Europe Female Unemployment

Female Unemployment Correlation Summary

MeasurementAleutImmigrants from Eastern Europe
Minimum1.6%2.6%
Maximum35.1%9.8%
Range33.5%7.2%
Mean9.7%5.1%
Median5.7%4.9%
Interquartile 25% (IQ1)3.7%4.4%
Interquartile 75% (IQ3)11.0%5.5%
Interquartile Range (IQR)7.3%1.1%
Standard Deviation (Sample)9.7%1.3%
Standard Deviation (Population)9.5%1.3%

Similar Demographics by Female Unemployment

Demographics Similar to Aleuts by Female Unemployment

In terms of female unemployment, the demographic groups most similar to Aleuts are Immigrants from South America (5.5%, a difference of 0.040%), South American Indian (5.5%, a difference of 0.080%), Sierra Leonean (5.5%, a difference of 0.10%), Immigrants from Panama (5.5%, a difference of 0.12%), and Immigrants from Cambodia (5.5%, a difference of 0.14%).
DemographicsRating | RankFemale Unemployment
Liberians
3.9
/100
|
#232
Tragic
5.5%
Moroccans
3.4
/100
|
#233
Tragic
5.5%
Immigrants | Lebanon
3.3
/100
|
#234
Tragic
5.5%
Immigrants | Iran
3.3
/100
|
#235
Tragic
5.5%
Immigrants | Cambodia
3.3
/100
|
#236
Tragic
5.5%
Immigrants | Panama
3.2
/100
|
#237
Tragic
5.5%
Sierra Leoneans
3.2
/100
|
#238
Tragic
5.5%
Aleuts
3.0
/100
|
#239
Tragic
5.5%
Immigrants | South America
2.9
/100
|
#240
Tragic
5.5%
South American Indians
2.8
/100
|
#241
Tragic
5.5%
Marshallese
2.3
/100
|
#242
Tragic
5.6%
Spanish Americans
2.2
/100
|
#243
Tragic
5.6%
Immigrants | Liberia
1.5
/100
|
#244
Tragic
5.6%
Guamanians/Chamorros
1.4
/100
|
#245
Tragic
5.6%
Japanese
1.2
/100
|
#246
Tragic
5.6%

Demographics Similar to Immigrants from Eastern Europe by Female Unemployment

In terms of female unemployment, the demographic groups most similar to Immigrants from Eastern Europe are Palestinian (5.1%, a difference of 0.080%), Immigrants from Kazakhstan (5.1%, a difference of 0.090%), Immigrants from Jordan (5.1%, a difference of 0.11%), Immigrants from France (5.1%, a difference of 0.12%), and Immigrants from Eastern Asia (5.1%, a difference of 0.16%).
DemographicsRating | RankFemale Unemployment
Immigrants | Eritrea
84.6
/100
|
#134
Excellent
5.1%
Immigrants | Latvia
84.6
/100
|
#135
Excellent
5.1%
Indians (Asian)
84.2
/100
|
#136
Excellent
5.1%
Pakistanis
83.8
/100
|
#137
Excellent
5.1%
Chickasaw
83.2
/100
|
#138
Excellent
5.1%
Immigrants | Eastern Asia
83.0
/100
|
#139
Excellent
5.1%
Immigrants | France
82.7
/100
|
#140
Excellent
5.1%
Immigrants | Eastern Europe
81.5
/100
|
#141
Excellent
5.1%
Palestinians
80.8
/100
|
#142
Excellent
5.1%
Immigrants | Kazakhstan
80.7
/100
|
#143
Excellent
5.1%
Immigrants | Jordan
80.4
/100
|
#144
Excellent
5.1%
Immigrants | Oceania
79.5
/100
|
#145
Good
5.2%
Immigrants | Norway
79.4
/100
|
#146
Good
5.2%
Argentineans
79.2
/100
|
#147
Good
5.2%
Immigrants | Argentina
78.7
/100
|
#148
Good
5.2%