Albanian vs Immigrants from Brazil Hearing Disability
COMPARE
Albanian
Immigrants from Brazil
Hearing Disability
Hearing Disability Comparison
Albanians
Immigrants from Brazil
2.9%
HEARING DISABILITY
66.6/ 100
METRIC RATING
161st/ 347
METRIC RANK
2.9%
HEARING DISABILITY
84.6/ 100
METRIC RATING
136th/ 347
METRIC RANK
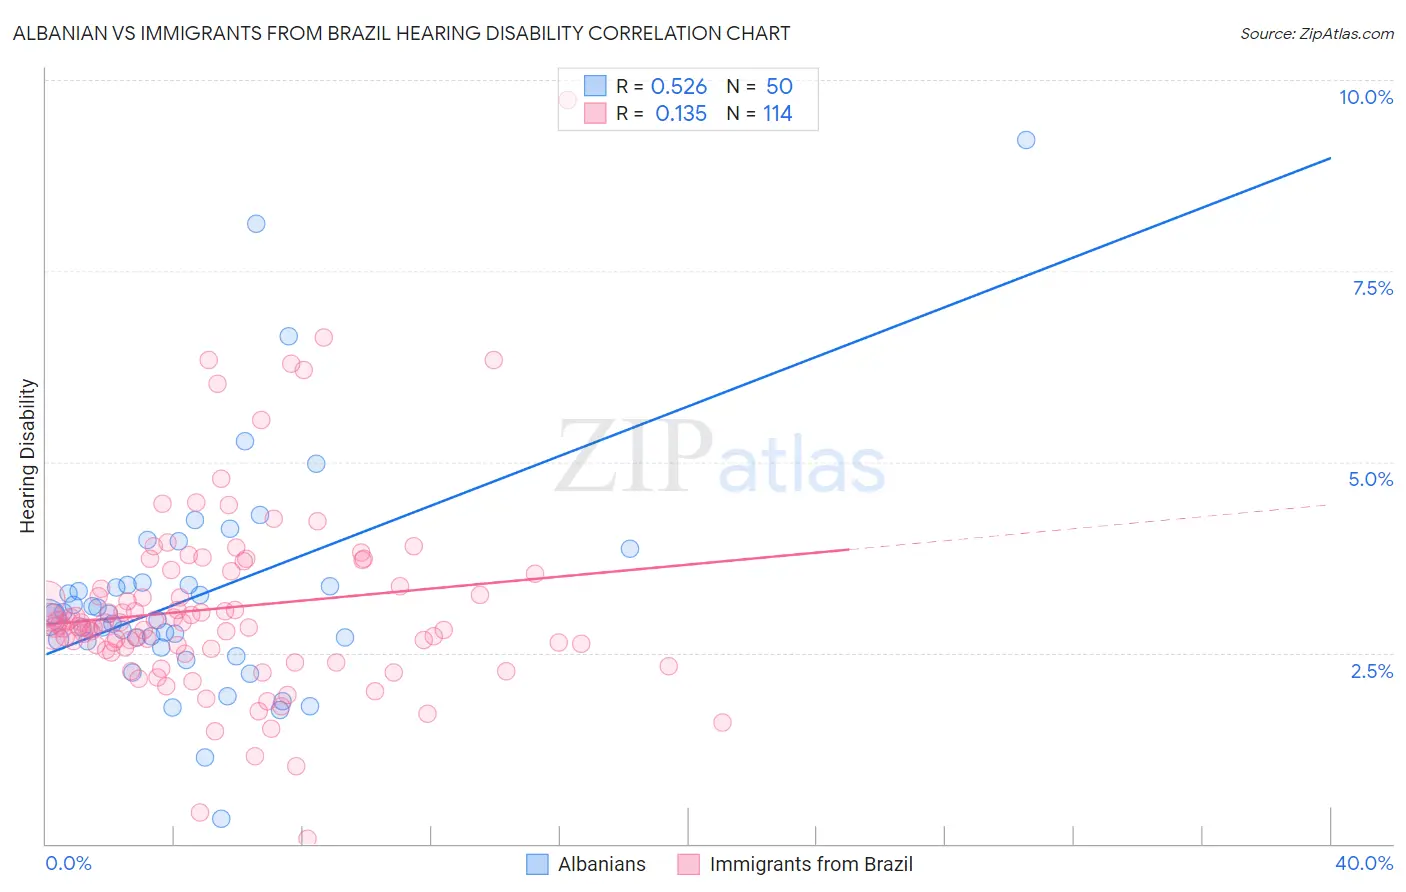
Albanian vs Immigrants from Brazil Hearing Disability Correlation Chart
The statistical analysis conducted on geographies consisting of 193,249,073 people shows a substantial positive correlation between the proportion of Albanians and percentage of population with hearing disability in the United States with a correlation coefficient (R) of 0.526 and weighted average of 2.9%. Similarly, the statistical analysis conducted on geographies consisting of 342,924,003 people shows a poor positive correlation between the proportion of Immigrants from Brazil and percentage of population with hearing disability in the United States with a correlation coefficient (R) of 0.135 and weighted average of 2.9%, a difference of 2.5%.
Hearing Disability Correlation Summary
| Measurement | Albanian | Immigrants from Brazil |
| Minimum | 0.33% | 0.070% |
| Maximum | 9.2% | 9.7% |
| Range | 8.9% | 9.7% |
| Mean | 3.3% | 3.1% |
| Median | 3.0% | 2.9% |
| Interquartile 25% (IQ1) | 2.6% | 2.5% |
| Interquartile 75% (IQ3) | 3.4% | 3.5% |
| Interquartile Range (IQR) | 0.75% | 0.99% |
| Standard Deviation (Sample) | 1.5% | 1.3% |
| Standard Deviation (Population) | 1.5% | 1.3% |
Similar Demographics by Hearing Disability
Demographics Similar to Albanians by Hearing Disability
In terms of hearing disability, the demographic groups most similar to Albanians are Immigrants from Japan (2.9%, a difference of 0.030%), Immigrants from Fiji (2.9%, a difference of 0.060%), Immigrants from Australia (2.9%, a difference of 0.090%), Immigrants from Central America (3.0%, a difference of 0.17%), and Immigrants from Cambodia (3.0%, a difference of 0.19%).
| Demographics | Rating | Rank | Hearing Disability |
| Immigrants | Lebanon | 71.5 /100 | #154 | Good 2.9% |
| Costa Ricans | 71.4 /100 | #155 | Good 2.9% |
| Immigrants | Poland | 70.2 /100 | #156 | Good 2.9% |
| Immigrants | Kazakhstan | 69.6 /100 | #157 | Good 2.9% |
| Immigrants | Burma/Myanmar | 69.5 /100 | #158 | Good 2.9% |
| Immigrants | Australia | 67.4 /100 | #159 | Good 2.9% |
| Immigrants | Fiji | 67.1 /100 | #160 | Good 2.9% |
| Albanians | 66.6 /100 | #161 | Good 2.9% |
| Immigrants | Japan | 66.3 /100 | #162 | Good 2.9% |
| Immigrants | Central America | 64.9 /100 | #163 | Good 3.0% |
| Immigrants | Cambodia | 64.8 /100 | #164 | Good 3.0% |
| Immigrants | Zimbabwe | 64.2 /100 | #165 | Good 3.0% |
| Immigrants | South Eastern Asia | 62.9 /100 | #166 | Good 3.0% |
| Immigrants | Eastern Europe | 58.1 /100 | #167 | Average 3.0% |
| Immigrants | Greece | 57.9 /100 | #168 | Average 3.0% |
Demographics Similar to Immigrants from Brazil by Hearing Disability
In terms of hearing disability, the demographic groups most similar to Immigrants from Brazil are Soviet Union (2.9%, a difference of 0.030%), Sri Lankan (2.9%, a difference of 0.10%), Immigrants from Costa Rica (2.9%, a difference of 0.10%), Bermudan (2.9%, a difference of 0.15%), and Ugandan (2.9%, a difference of 0.17%).
| Demographics | Rating | Rank | Hearing Disability |
| Immigrants | Uganda | 86.6 /100 | #129 | Excellent 2.9% |
| Immigrants | Vietnam | 86.5 /100 | #130 | Excellent 2.9% |
| Immigrants | Kenya | 86.1 /100 | #131 | Excellent 2.9% |
| Chileans | 85.8 /100 | #132 | Excellent 2.9% |
| Immigrants | Syria | 85.8 /100 | #133 | Excellent 2.9% |
| Ugandans | 85.5 /100 | #134 | Excellent 2.9% |
| Soviet Union | 84.8 /100 | #135 | Excellent 2.9% |
| Immigrants | Brazil | 84.6 /100 | #136 | Excellent 2.9% |
| Sri Lankans | 84.1 /100 | #137 | Excellent 2.9% |
| Immigrants | Costa Rica | 84.0 /100 | #138 | Excellent 2.9% |
| Bermudans | 83.8 /100 | #139 | Excellent 2.9% |
| Immigrants | Jordan | 83.7 /100 | #140 | Excellent 2.9% |
| Sub-Saharan Africans | 83.3 /100 | #141 | Excellent 2.9% |
| Laotians | 81.1 /100 | #142 | Excellent 2.9% |
| Immigrants | Bahamas | 80.9 /100 | #143 | Excellent 2.9% |