Thai vs Immigrants from Brazil Hearing Disability
COMPARE
Thai
Immigrants from Brazil
Hearing Disability
Hearing Disability Comparison
Thais
Immigrants from Brazil
2.5%
HEARING DISABILITY
99.8/ 100
METRIC RATING
19th/ 347
METRIC RANK
2.9%
HEARING DISABILITY
84.6/ 100
METRIC RATING
136th/ 347
METRIC RANK
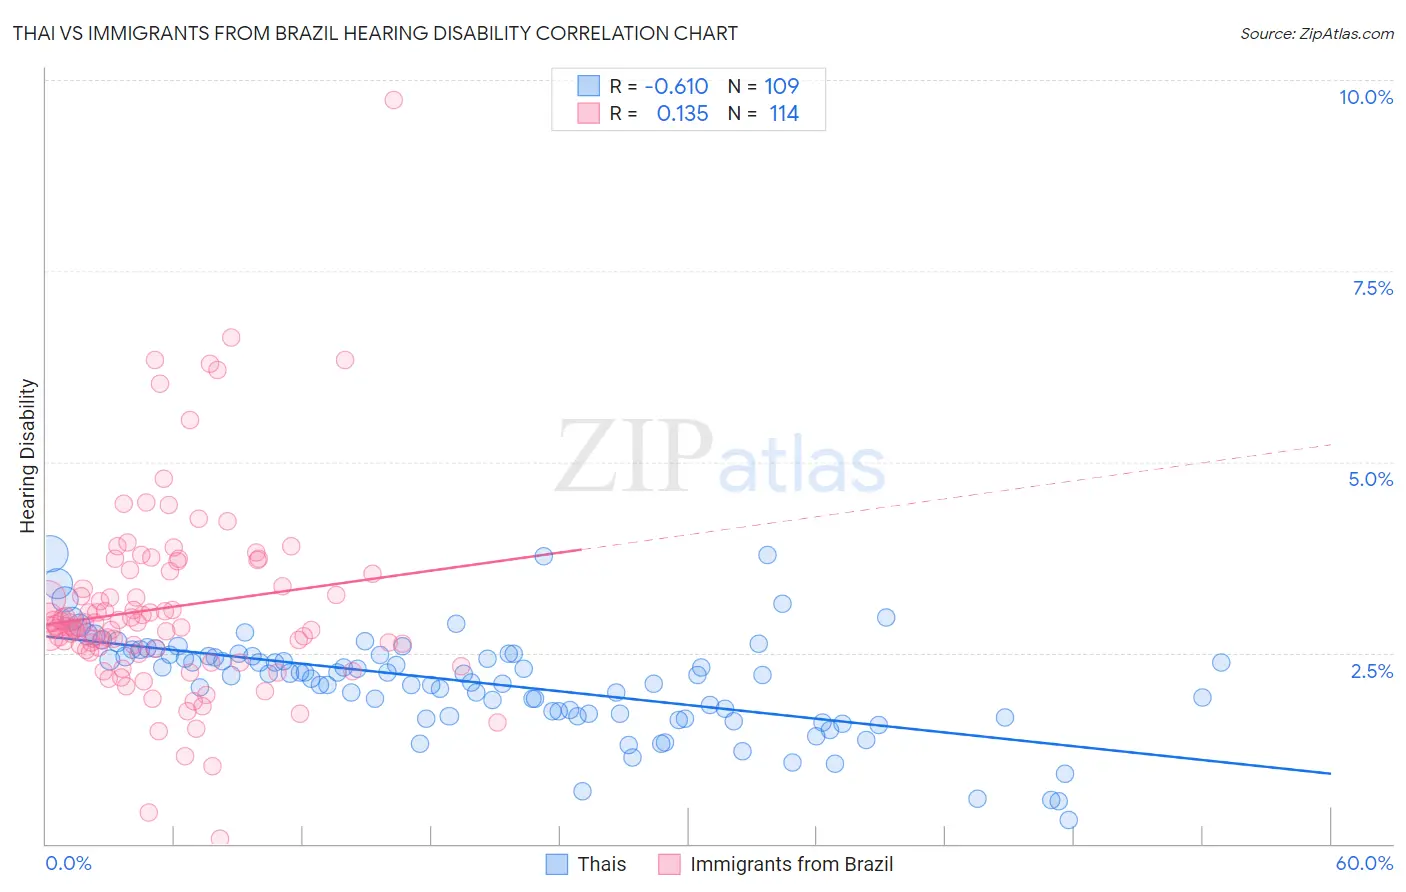
Thai vs Immigrants from Brazil Hearing Disability Correlation Chart
The statistical analysis conducted on geographies consisting of 475,566,624 people shows a significant negative correlation between the proportion of Thais and percentage of population with hearing disability in the United States with a correlation coefficient (R) of -0.610 and weighted average of 2.5%. Similarly, the statistical analysis conducted on geographies consisting of 342,924,003 people shows a poor positive correlation between the proportion of Immigrants from Brazil and percentage of population with hearing disability in the United States with a correlation coefficient (R) of 0.135 and weighted average of 2.9%, a difference of 12.9%.
Hearing Disability Correlation Summary
| Measurement | Thai | Immigrants from Brazil |
| Minimum | 0.30% | 0.070% |
| Maximum | 3.8% | 9.7% |
| Range | 3.5% | 9.7% |
| Mean | 2.1% | 3.1% |
| Median | 2.2% | 2.9% |
| Interquartile 25% (IQ1) | 1.7% | 2.5% |
| Interquartile 75% (IQ3) | 2.5% | 3.5% |
| Interquartile Range (IQR) | 0.79% | 0.99% |
| Standard Deviation (Sample) | 0.65% | 1.3% |
| Standard Deviation (Population) | 0.65% | 1.3% |
Similar Demographics by Hearing Disability
Demographics Similar to Thais by Hearing Disability
In terms of hearing disability, the demographic groups most similar to Thais are Dominican (2.5%, a difference of 0.030%), Immigrants from Bolivia (2.5%, a difference of 0.050%), Ghanaian (2.5%, a difference of 0.11%), Immigrants from Sierra Leone (2.6%, a difference of 0.16%), and Immigrants from Nigeria (2.6%, a difference of 0.65%).
| Demographics | Rating | Rank | Hearing Disability |
| Trinidadians and Tobagonians | 99.9 /100 | #12 | Exceptional 2.5% |
| Sierra Leoneans | 99.9 /100 | #13 | Exceptional 2.5% |
| Ecuadorians | 99.9 /100 | #14 | Exceptional 2.5% |
| Barbadians | 99.9 /100 | #15 | Exceptional 2.5% |
| Immigrants | West Indies | 99.9 /100 | #16 | Exceptional 2.5% |
| Immigrants | India | 99.9 /100 | #17 | Exceptional 2.5% |
| Dominicans | 99.8 /100 | #18 | Exceptional 2.5% |
| Thais | 99.8 /100 | #19 | Exceptional 2.5% |
| Immigrants | Bolivia | 99.8 /100 | #20 | Exceptional 2.5% |
| Ghanaians | 99.8 /100 | #21 | Exceptional 2.5% |
| Immigrants | Sierra Leone | 99.8 /100 | #22 | Exceptional 2.6% |
| Immigrants | Nigeria | 99.8 /100 | #23 | Exceptional 2.6% |
| Immigrants | Ghana | 99.8 /100 | #24 | Exceptional 2.6% |
| Immigrants | El Salvador | 99.7 /100 | #25 | Exceptional 2.6% |
| Immigrants | Senegal | 99.7 /100 | #26 | Exceptional 2.6% |
Demographics Similar to Immigrants from Brazil by Hearing Disability
In terms of hearing disability, the demographic groups most similar to Immigrants from Brazil are Soviet Union (2.9%, a difference of 0.030%), Sri Lankan (2.9%, a difference of 0.10%), Immigrants from Costa Rica (2.9%, a difference of 0.10%), Bermudan (2.9%, a difference of 0.15%), and Ugandan (2.9%, a difference of 0.17%).
| Demographics | Rating | Rank | Hearing Disability |
| Immigrants | Uganda | 86.6 /100 | #129 | Excellent 2.9% |
| Immigrants | Vietnam | 86.5 /100 | #130 | Excellent 2.9% |
| Immigrants | Kenya | 86.1 /100 | #131 | Excellent 2.9% |
| Chileans | 85.8 /100 | #132 | Excellent 2.9% |
| Immigrants | Syria | 85.8 /100 | #133 | Excellent 2.9% |
| Ugandans | 85.5 /100 | #134 | Excellent 2.9% |
| Soviet Union | 84.8 /100 | #135 | Excellent 2.9% |
| Immigrants | Brazil | 84.6 /100 | #136 | Excellent 2.9% |
| Sri Lankans | 84.1 /100 | #137 | Excellent 2.9% |
| Immigrants | Costa Rica | 84.0 /100 | #138 | Excellent 2.9% |
| Bermudans | 83.8 /100 | #139 | Excellent 2.9% |
| Immigrants | Jordan | 83.7 /100 | #140 | Excellent 2.9% |
| Sub-Saharan Africans | 83.3 /100 | #141 | Excellent 2.9% |
| Laotians | 81.1 /100 | #142 | Excellent 2.9% |
| Immigrants | Bahamas | 80.9 /100 | #143 | Excellent 2.9% |