Albanian vs Immigrants from Eastern Asia Hearing Disability
COMPARE
Albanian
Immigrants from Eastern Asia
Hearing Disability
Hearing Disability Comparison
Albanians
Immigrants from Eastern Asia
2.9%
HEARING DISABILITY
66.6/ 100
METRIC RATING
161st/ 347
METRIC RANK
2.7%
HEARING DISABILITY
99.0/ 100
METRIC RATING
53rd/ 347
METRIC RANK
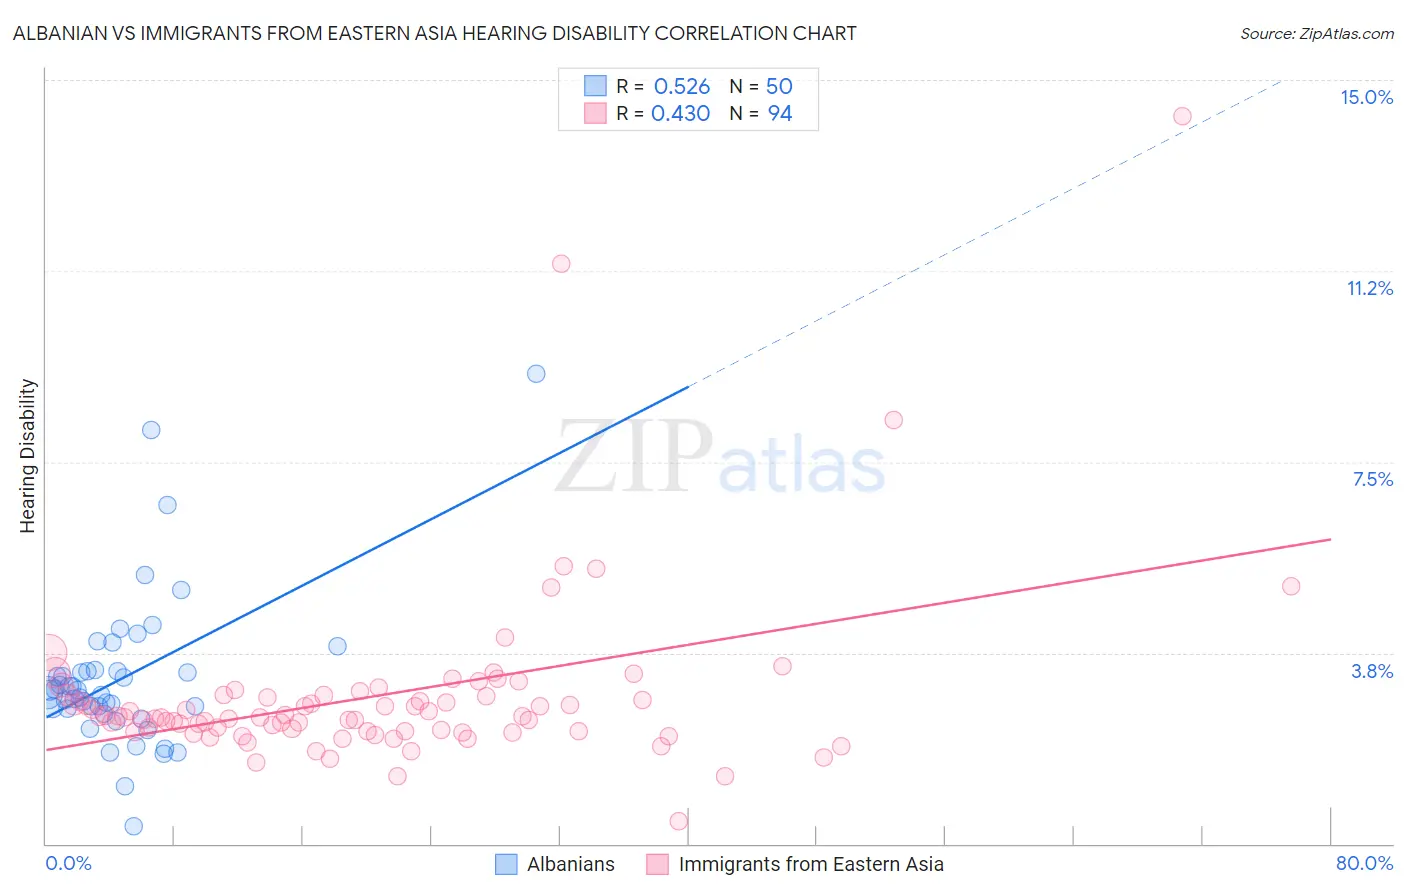
Albanian vs Immigrants from Eastern Asia Hearing Disability Correlation Chart
The statistical analysis conducted on geographies consisting of 193,249,073 people shows a substantial positive correlation between the proportion of Albanians and percentage of population with hearing disability in the United States with a correlation coefficient (R) of 0.526 and weighted average of 2.9%. Similarly, the statistical analysis conducted on geographies consisting of 499,587,634 people shows a moderate positive correlation between the proportion of Immigrants from Eastern Asia and percentage of population with hearing disability in the United States with a correlation coefficient (R) of 0.430 and weighted average of 2.7%, a difference of 10.3%.
Hearing Disability Correlation Summary
| Measurement | Albanian | Immigrants from Eastern Asia |
| Minimum | 0.33% | 0.45% |
| Maximum | 9.2% | 14.3% |
| Range | 8.9% | 13.8% |
| Mean | 3.3% | 2.9% |
| Median | 3.0% | 2.5% |
| Interquartile 25% (IQ1) | 2.6% | 2.2% |
| Interquartile 75% (IQ3) | 3.4% | 2.9% |
| Interquartile Range (IQR) | 0.75% | 0.71% |
| Standard Deviation (Sample) | 1.5% | 1.8% |
| Standard Deviation (Population) | 1.5% | 1.8% |
Similar Demographics by Hearing Disability
Demographics Similar to Albanians by Hearing Disability
In terms of hearing disability, the demographic groups most similar to Albanians are Immigrants from Japan (2.9%, a difference of 0.030%), Immigrants from Fiji (2.9%, a difference of 0.060%), Immigrants from Australia (2.9%, a difference of 0.090%), Immigrants from Central America (3.0%, a difference of 0.17%), and Immigrants from Cambodia (3.0%, a difference of 0.19%).
| Demographics | Rating | Rank | Hearing Disability |
| Immigrants | Lebanon | 71.5 /100 | #154 | Good 2.9% |
| Costa Ricans | 71.4 /100 | #155 | Good 2.9% |
| Immigrants | Poland | 70.2 /100 | #156 | Good 2.9% |
| Immigrants | Kazakhstan | 69.6 /100 | #157 | Good 2.9% |
| Immigrants | Burma/Myanmar | 69.5 /100 | #158 | Good 2.9% |
| Immigrants | Australia | 67.4 /100 | #159 | Good 2.9% |
| Immigrants | Fiji | 67.1 /100 | #160 | Good 2.9% |
| Albanians | 66.6 /100 | #161 | Good 2.9% |
| Immigrants | Japan | 66.3 /100 | #162 | Good 2.9% |
| Immigrants | Central America | 64.9 /100 | #163 | Good 3.0% |
| Immigrants | Cambodia | 64.8 /100 | #164 | Good 3.0% |
| Immigrants | Zimbabwe | 64.2 /100 | #165 | Good 3.0% |
| Immigrants | South Eastern Asia | 62.9 /100 | #166 | Good 3.0% |
| Immigrants | Eastern Europe | 58.1 /100 | #167 | Average 3.0% |
| Immigrants | Greece | 57.9 /100 | #168 | Average 3.0% |
Demographics Similar to Immigrants from Eastern Asia by Hearing Disability
In terms of hearing disability, the demographic groups most similar to Immigrants from Eastern Asia are Ethiopian (2.7%, a difference of 0.030%), Jamaican (2.7%, a difference of 0.070%), Immigrants from Ethiopia (2.7%, a difference of 0.10%), Immigrants from Nicaragua (2.7%, a difference of 0.12%), and South American (2.7%, a difference of 0.16%).
| Demographics | Rating | Rank | Hearing Disability |
| Immigrants | Dominica | 99.3 /100 | #46 | Exceptional 2.6% |
| Immigrants | Israel | 99.3 /100 | #47 | Exceptional 2.6% |
| Immigrants | Singapore | 99.3 /100 | #48 | Exceptional 2.6% |
| Immigrants | South America | 99.2 /100 | #49 | Exceptional 2.7% |
| Paraguayans | 99.2 /100 | #50 | Exceptional 2.7% |
| Immigrants | Hong Kong | 99.2 /100 | #51 | Exceptional 2.7% |
| Jamaicans | 99.0 /100 | #52 | Exceptional 2.7% |
| Immigrants | Eastern Asia | 99.0 /100 | #53 | Exceptional 2.7% |
| Ethiopians | 99.0 /100 | #54 | Exceptional 2.7% |
| Immigrants | Ethiopia | 99.0 /100 | #55 | Exceptional 2.7% |
| Immigrants | Nicaragua | 99.0 /100 | #56 | Exceptional 2.7% |
| South Americans | 99.0 /100 | #57 | Exceptional 2.7% |
| Immigrants | Peru | 98.6 /100 | #58 | Exceptional 2.7% |
| Immigrants | Eritrea | 98.5 /100 | #59 | Exceptional 2.7% |
| Immigrants | Egypt | 98.5 /100 | #60 | Exceptional 2.7% |