Immigrants from North America vs Immigrants from Brazil Hearing Disability
COMPARE
Immigrants from North America
Immigrants from Brazil
Hearing Disability
Hearing Disability Comparison
Immigrants from North America
Immigrants from Brazil
3.5%
HEARING DISABILITY
0.1/ 100
METRIC RATING
262nd/ 347
METRIC RANK
2.9%
HEARING DISABILITY
84.6/ 100
METRIC RATING
136th/ 347
METRIC RANK
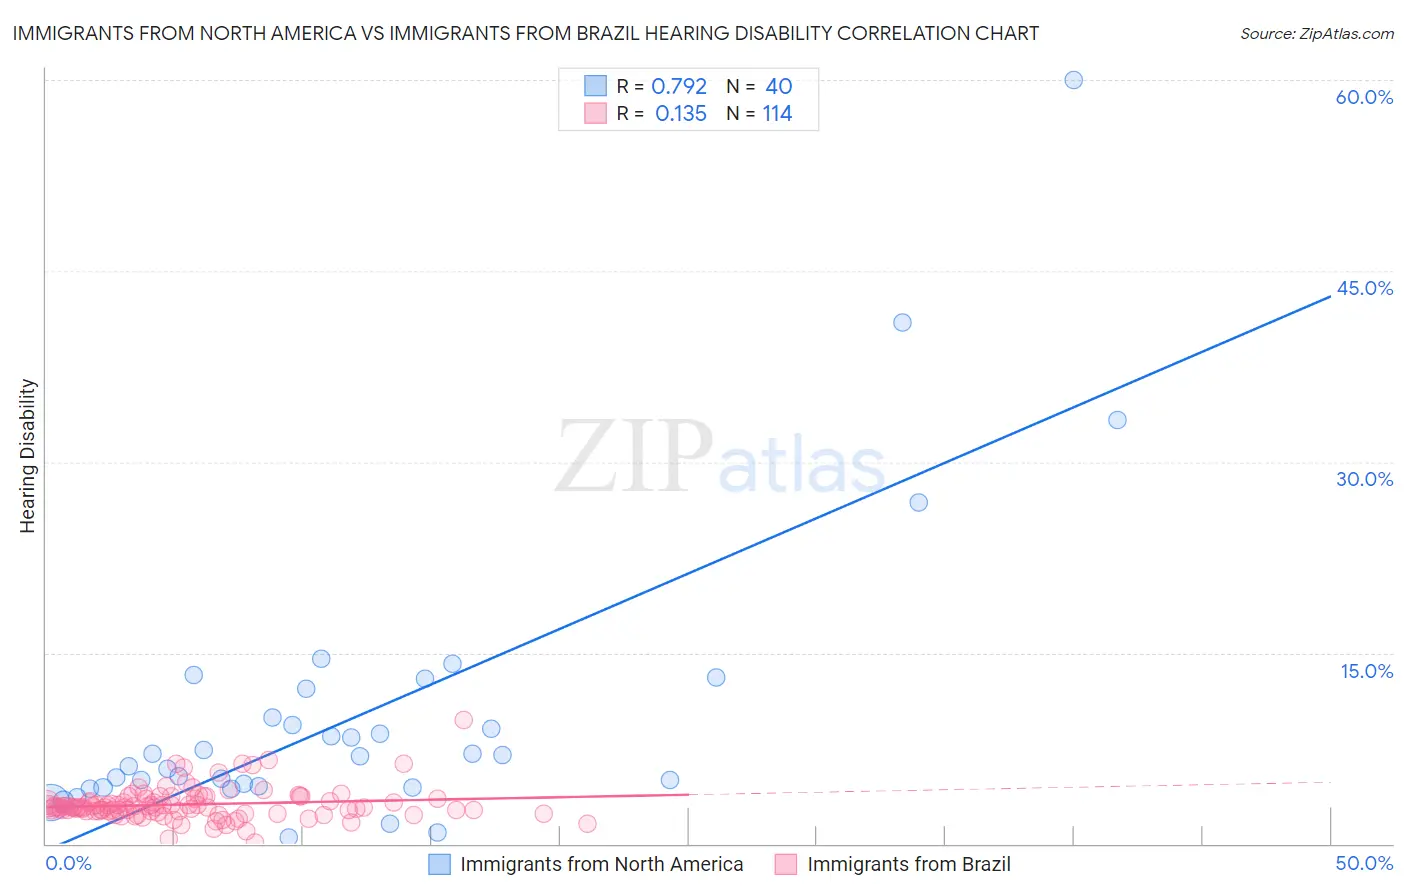
Immigrants from North America vs Immigrants from Brazil Hearing Disability Correlation Chart
The statistical analysis conducted on geographies consisting of 462,279,927 people shows a strong positive correlation between the proportion of Immigrants from North America and percentage of population with hearing disability in the United States with a correlation coefficient (R) of 0.792 and weighted average of 3.5%. Similarly, the statistical analysis conducted on geographies consisting of 342,924,003 people shows a poor positive correlation between the proportion of Immigrants from Brazil and percentage of population with hearing disability in the United States with a correlation coefficient (R) of 0.135 and weighted average of 2.9%, a difference of 20.5%.
Hearing Disability Correlation Summary
| Measurement | Immigrants from North America | Immigrants from Brazil |
| Minimum | 0.49% | 0.070% |
| Maximum | 60.0% | 9.7% |
| Range | 59.5% | 9.7% |
| Mean | 10.2% | 3.1% |
| Median | 7.0% | 2.9% |
| Interquartile 25% (IQ1) | 4.5% | 2.5% |
| Interquartile 75% (IQ3) | 11.0% | 3.5% |
| Interquartile Range (IQR) | 6.6% | 0.99% |
| Standard Deviation (Sample) | 11.5% | 1.3% |
| Standard Deviation (Population) | 11.3% | 1.3% |
Similar Demographics by Hearing Disability
Demographics Similar to Immigrants from North America by Hearing Disability
In terms of hearing disability, the demographic groups most similar to Immigrants from North America are Immigrants from Canada (3.5%, a difference of 0.040%), Hawaiian (3.5%, a difference of 0.11%), Portuguese (3.5%, a difference of 0.15%), Slovene (3.5%, a difference of 0.23%), and Immigrants from Germany (3.5%, a difference of 0.26%).
| Demographics | Rating | Rank | Hearing Disability |
| Poles | 0.2 /100 | #255 | Tragic 3.4% |
| Hmong | 0.2 /100 | #256 | Tragic 3.4% |
| Yaqui | 0.2 /100 | #257 | Tragic 3.4% |
| Northern Europeans | 0.2 /100 | #258 | Tragic 3.4% |
| Slovenes | 0.1 /100 | #259 | Tragic 3.5% |
| Portuguese | 0.1 /100 | #260 | Tragic 3.5% |
| Hawaiians | 0.1 /100 | #261 | Tragic 3.5% |
| Immigrants | North America | 0.1 /100 | #262 | Tragic 3.5% |
| Immigrants | Canada | 0.1 /100 | #263 | Tragic 3.5% |
| Immigrants | Germany | 0.1 /100 | #264 | Tragic 3.5% |
| British | 0.1 /100 | #265 | Tragic 3.5% |
| Belgians | 0.1 /100 | #266 | Tragic 3.5% |
| Canadians | 0.1 /100 | #267 | Tragic 3.5% |
| Spaniards | 0.1 /100 | #268 | Tragic 3.5% |
| Ute | 0.1 /100 | #269 | Tragic 3.5% |
Demographics Similar to Immigrants from Brazil by Hearing Disability
In terms of hearing disability, the demographic groups most similar to Immigrants from Brazil are Soviet Union (2.9%, a difference of 0.030%), Sri Lankan (2.9%, a difference of 0.10%), Immigrants from Costa Rica (2.9%, a difference of 0.10%), Bermudan (2.9%, a difference of 0.15%), and Ugandan (2.9%, a difference of 0.17%).
| Demographics | Rating | Rank | Hearing Disability |
| Immigrants | Uganda | 86.6 /100 | #129 | Excellent 2.9% |
| Immigrants | Vietnam | 86.5 /100 | #130 | Excellent 2.9% |
| Immigrants | Kenya | 86.1 /100 | #131 | Excellent 2.9% |
| Chileans | 85.8 /100 | #132 | Excellent 2.9% |
| Immigrants | Syria | 85.8 /100 | #133 | Excellent 2.9% |
| Ugandans | 85.5 /100 | #134 | Excellent 2.9% |
| Soviet Union | 84.8 /100 | #135 | Excellent 2.9% |
| Immigrants | Brazil | 84.6 /100 | #136 | Excellent 2.9% |
| Sri Lankans | 84.1 /100 | #137 | Excellent 2.9% |
| Immigrants | Costa Rica | 84.0 /100 | #138 | Excellent 2.9% |
| Bermudans | 83.8 /100 | #139 | Excellent 2.9% |
| Immigrants | Jordan | 83.7 /100 | #140 | Excellent 2.9% |
| Sub-Saharan Africans | 83.3 /100 | #141 | Excellent 2.9% |
| Laotians | 81.1 /100 | #142 | Excellent 2.9% |
| Immigrants | Bahamas | 80.9 /100 | #143 | Excellent 2.9% |