Albanian vs Bangladeshi Hearing Disability
COMPARE
Albanian
Bangladeshi
Hearing Disability
Hearing Disability Comparison
Albanians
Bangladeshis
2.9%
HEARING DISABILITY
66.6/ 100
METRIC RATING
161st/ 347
METRIC RANK
3.2%
HEARING DISABILITY
8.1/ 100
METRIC RATING
215th/ 347
METRIC RANK
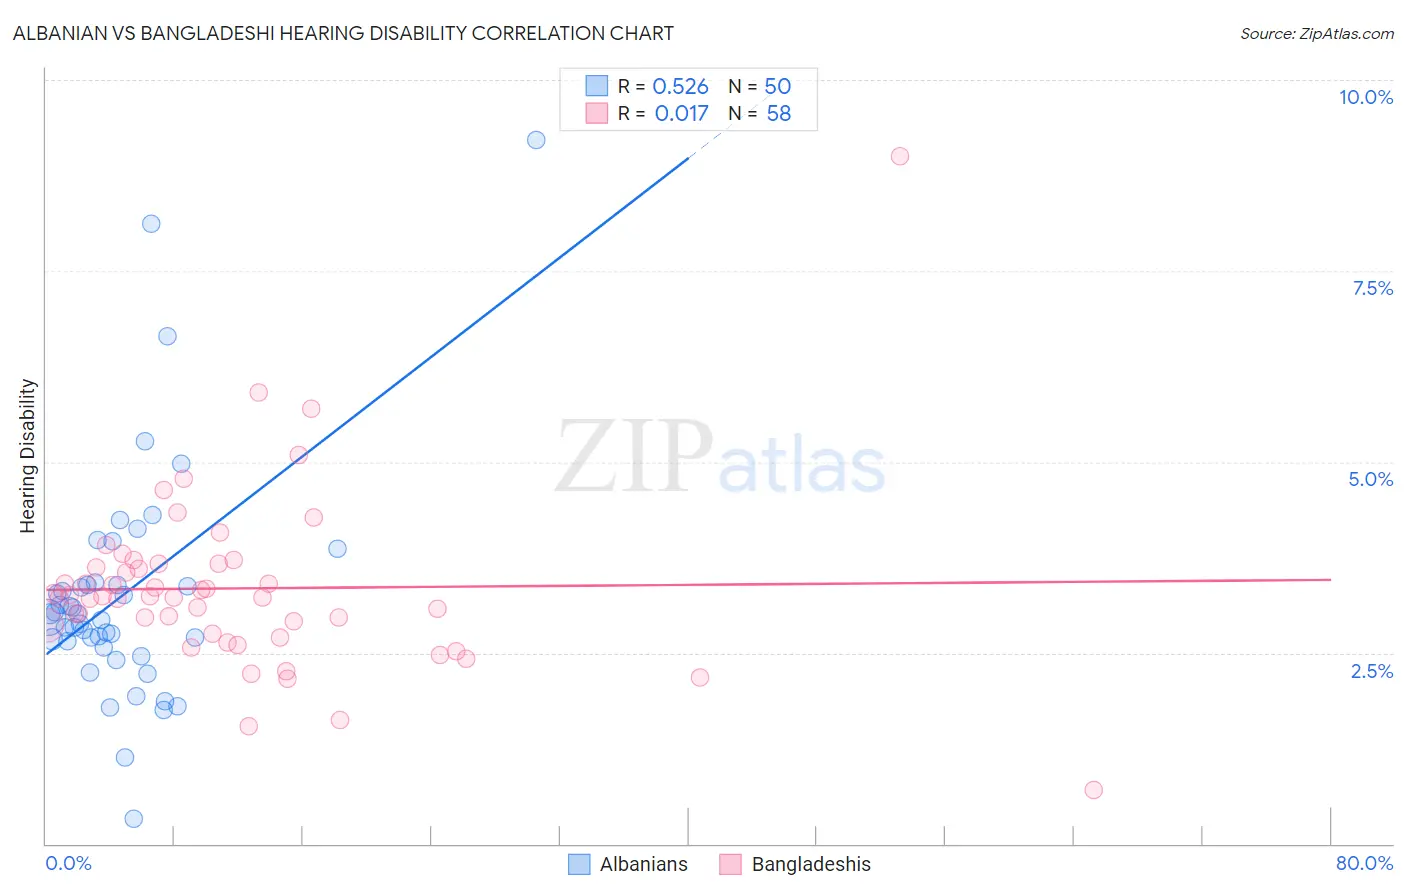
Albanian vs Bangladeshi Hearing Disability Correlation Chart
The statistical analysis conducted on geographies consisting of 193,249,073 people shows a substantial positive correlation between the proportion of Albanians and percentage of population with hearing disability in the United States with a correlation coefficient (R) of 0.526 and weighted average of 2.9%. Similarly, the statistical analysis conducted on geographies consisting of 141,366,446 people shows no correlation between the proportion of Bangladeshis and percentage of population with hearing disability in the United States with a correlation coefficient (R) of 0.017 and weighted average of 3.2%, a difference of 7.4%.
Hearing Disability Correlation Summary
| Measurement | Albanian | Bangladeshi |
| Minimum | 0.33% | 0.71% |
| Maximum | 9.2% | 9.0% |
| Range | 8.9% | 8.3% |
| Mean | 3.3% | 3.3% |
| Median | 3.0% | 3.2% |
| Interquartile 25% (IQ1) | 2.6% | 2.8% |
| Interquartile 75% (IQ3) | 3.4% | 3.7% |
| Interquartile Range (IQR) | 0.75% | 0.90% |
| Standard Deviation (Sample) | 1.5% | 1.2% |
| Standard Deviation (Population) | 1.5% | 1.2% |
Similar Demographics by Hearing Disability
Demographics Similar to Albanians by Hearing Disability
In terms of hearing disability, the demographic groups most similar to Albanians are Immigrants from Japan (2.9%, a difference of 0.030%), Immigrants from Fiji (2.9%, a difference of 0.060%), Immigrants from Australia (2.9%, a difference of 0.090%), Immigrants from Central America (3.0%, a difference of 0.17%), and Immigrants from Cambodia (3.0%, a difference of 0.19%).
| Demographics | Rating | Rank | Hearing Disability |
| Immigrants | Lebanon | 71.5 /100 | #154 | Good 2.9% |
| Costa Ricans | 71.4 /100 | #155 | Good 2.9% |
| Immigrants | Poland | 70.2 /100 | #156 | Good 2.9% |
| Immigrants | Kazakhstan | 69.6 /100 | #157 | Good 2.9% |
| Immigrants | Burma/Myanmar | 69.5 /100 | #158 | Good 2.9% |
| Immigrants | Australia | 67.4 /100 | #159 | Good 2.9% |
| Immigrants | Fiji | 67.1 /100 | #160 | Good 2.9% |
| Albanians | 66.6 /100 | #161 | Good 2.9% |
| Immigrants | Japan | 66.3 /100 | #162 | Good 2.9% |
| Immigrants | Central America | 64.9 /100 | #163 | Good 3.0% |
| Immigrants | Cambodia | 64.8 /100 | #164 | Good 3.0% |
| Immigrants | Zimbabwe | 64.2 /100 | #165 | Good 3.0% |
| Immigrants | South Eastern Asia | 62.9 /100 | #166 | Good 3.0% |
| Immigrants | Eastern Europe | 58.1 /100 | #167 | Average 3.0% |
| Immigrants | Greece | 57.9 /100 | #168 | Average 3.0% |
Demographics Similar to Bangladeshis by Hearing Disability
In terms of hearing disability, the demographic groups most similar to Bangladeshis are Australian (3.2%, a difference of 0.010%), Immigrants from Norway (3.2%, a difference of 0.24%), Russian (3.2%, a difference of 0.32%), Immigrants from Northern Europe (3.2%, a difference of 0.35%), and New Zealander (3.2%, a difference of 0.41%).
| Demographics | Rating | Rank | Hearing Disability |
| Immigrants | Latvia | 12.7 /100 | #208 | Poor 3.1% |
| Immigrants | Hungary | 12.5 /100 | #209 | Poor 3.1% |
| Cape Verdeans | 12.2 /100 | #210 | Poor 3.1% |
| Romanians | 12.1 /100 | #211 | Poor 3.1% |
| Pakistanis | 11.1 /100 | #212 | Poor 3.1% |
| Immigrants | Iraq | 10.5 /100 | #213 | Poor 3.1% |
| Australians | 8.1 /100 | #214 | Tragic 3.2% |
| Bangladeshis | 8.1 /100 | #215 | Tragic 3.2% |
| Immigrants | Norway | 7.3 /100 | #216 | Tragic 3.2% |
| Russians | 7.1 /100 | #217 | Tragic 3.2% |
| Immigrants | Northern Europe | 7.0 /100 | #218 | Tragic 3.2% |
| New Zealanders | 6.8 /100 | #219 | Tragic 3.2% |
| Malaysians | 6.6 /100 | #220 | Tragic 3.2% |
| Immigrants | Laos | 6.6 /100 | #221 | Tragic 3.2% |
| Immigrants | Oceania | 6.5 /100 | #222 | Tragic 3.2% |