Albanian vs Immigrants from Russia Hearing Disability
COMPARE
Albanian
Immigrants from Russia
Hearing Disability
Hearing Disability Comparison
Albanians
Immigrants from Russia
2.9%
HEARING DISABILITY
66.6/ 100
METRIC RATING
161st/ 347
METRIC RANK
2.9%
HEARING DISABILITY
77.7/ 100
METRIC RATING
148th/ 347
METRIC RANK
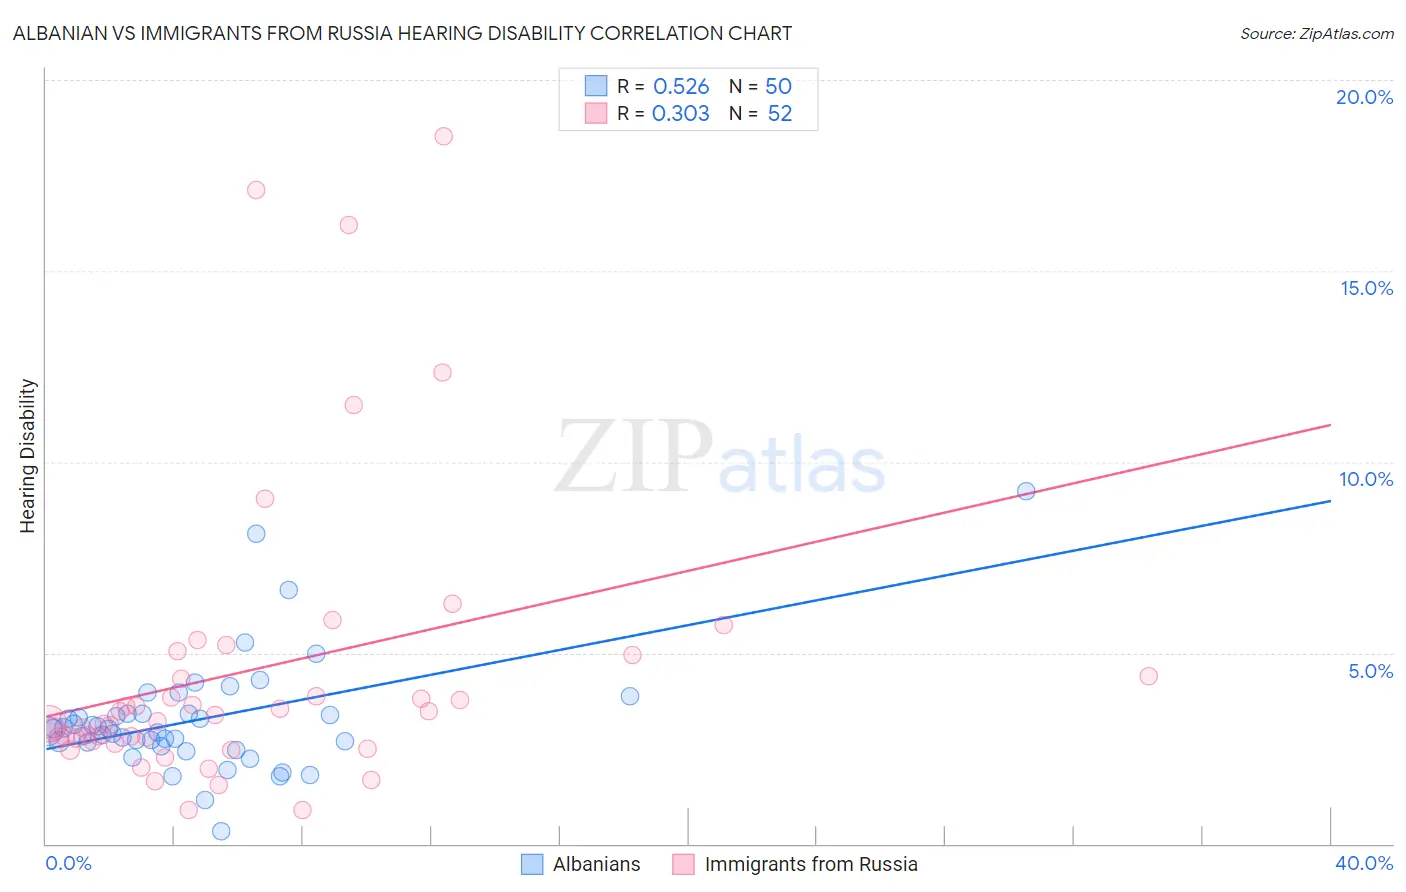
Albanian vs Immigrants from Russia Hearing Disability Correlation Chart
The statistical analysis conducted on geographies consisting of 193,249,073 people shows a substantial positive correlation between the proportion of Albanians and percentage of population with hearing disability in the United States with a correlation coefficient (R) of 0.526 and weighted average of 2.9%. Similarly, the statistical analysis conducted on geographies consisting of 347,834,739 people shows a mild positive correlation between the proportion of Immigrants from Russia and percentage of population with hearing disability in the United States with a correlation coefficient (R) of 0.303 and weighted average of 2.9%, a difference of 1.3%.
Hearing Disability Correlation Summary
| Measurement | Albanian | Immigrants from Russia |
| Minimum | 0.33% | 0.87% |
| Maximum | 9.2% | 18.5% |
| Range | 8.9% | 17.7% |
| Mean | 3.3% | 4.5% |
| Median | 3.0% | 3.3% |
| Interquartile 25% (IQ1) | 2.6% | 2.7% |
| Interquartile 75% (IQ3) | 3.4% | 4.7% |
| Interquartile Range (IQR) | 0.75% | 1.9% |
| Standard Deviation (Sample) | 1.5% | 3.9% |
| Standard Deviation (Population) | 1.5% | 3.8% |
Demographics Similar to Albanians and Immigrants from Russia by Hearing Disability
In terms of hearing disability, the demographic groups most similar to Albanians are Immigrants from Japan (2.9%, a difference of 0.030%), Immigrants from Fiji (2.9%, a difference of 0.060%), Immigrants from Australia (2.9%, a difference of 0.090%), Immigrants from Central America (3.0%, a difference of 0.17%), and Immigrants from Cambodia (3.0%, a difference of 0.19%). Similarly, the demographic groups most similar to Immigrants from Russia are Immigrants from Panama (2.9%, a difference of 0.11%), Tongan (2.9%, a difference of 0.13%), Brazilian (2.9%, a difference of 0.15%), Immigrants from Congo (2.9%, a difference of 0.17%), and Immigrants from Bulgaria (2.9%, a difference of 0.21%).
| Demographics | Rating | Rank | Hearing Disability |
| Immigrants | Bulgaria | 79.2 /100 | #144 | Good 2.9% |
| Immigrants | Congo | 78.9 /100 | #145 | Good 2.9% |
| Brazilians | 78.7 /100 | #146 | Good 2.9% |
| Tongans | 78.6 /100 | #147 | Good 2.9% |
| Immigrants | Russia | 77.7 /100 | #148 | Good 2.9% |
| Immigrants | Panama | 76.9 /100 | #149 | Good 2.9% |
| Palestinians | 73.6 /100 | #150 | Good 2.9% |
| Immigrants | France | 73.1 /100 | #151 | Good 2.9% |
| Immigrants | Lithuania | 73.0 /100 | #152 | Good 2.9% |
| Sudanese | 72.1 /100 | #153 | Good 2.9% |
| Immigrants | Lebanon | 71.5 /100 | #154 | Good 2.9% |
| Costa Ricans | 71.4 /100 | #155 | Good 2.9% |
| Immigrants | Poland | 70.2 /100 | #156 | Good 2.9% |
| Immigrants | Kazakhstan | 69.6 /100 | #157 | Good 2.9% |
| Immigrants | Burma/Myanmar | 69.5 /100 | #158 | Good 2.9% |
| Immigrants | Australia | 67.4 /100 | #159 | Good 2.9% |
| Immigrants | Fiji | 67.1 /100 | #160 | Good 2.9% |
| Albanians | 66.6 /100 | #161 | Good 2.9% |
| Immigrants | Japan | 66.3 /100 | #162 | Good 2.9% |
| Immigrants | Central America | 64.9 /100 | #163 | Good 3.0% |
| Immigrants | Cambodia | 64.8 /100 | #164 | Good 3.0% |