Albanian vs Immigrants from Bahamas Hearing Disability
COMPARE
Albanian
Immigrants from Bahamas
Hearing Disability
Hearing Disability Comparison
Albanians
Immigrants from Bahamas
2.9%
HEARING DISABILITY
66.6/ 100
METRIC RATING
161st/ 347
METRIC RANK
2.9%
HEARING DISABILITY
80.9/ 100
METRIC RATING
143rd/ 347
METRIC RANK
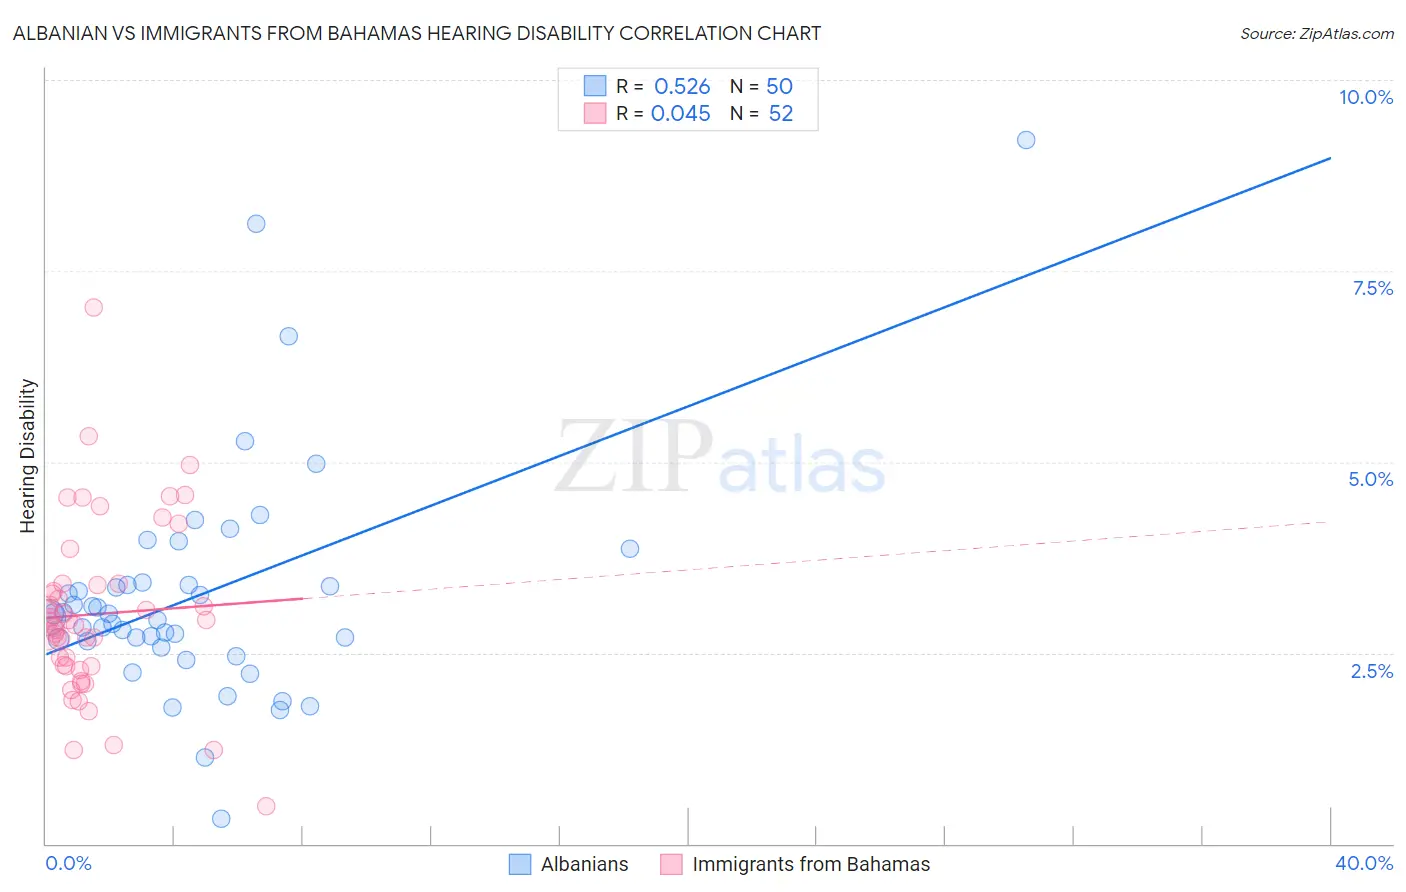
Albanian vs Immigrants from Bahamas Hearing Disability Correlation Chart
The statistical analysis conducted on geographies consisting of 193,249,073 people shows a substantial positive correlation between the proportion of Albanians and percentage of population with hearing disability in the United States with a correlation coefficient (R) of 0.526 and weighted average of 2.9%. Similarly, the statistical analysis conducted on geographies consisting of 104,634,972 people shows no correlation between the proportion of Immigrants from Bahamas and percentage of population with hearing disability in the United States with a correlation coefficient (R) of 0.045 and weighted average of 2.9%, a difference of 1.8%.
Hearing Disability Correlation Summary
| Measurement | Albanian | Immigrants from Bahamas |
| Minimum | 0.33% | 0.49% |
| Maximum | 9.2% | 7.0% |
| Range | 8.9% | 6.5% |
| Mean | 3.3% | 3.0% |
| Median | 3.0% | 2.9% |
| Interquartile 25% (IQ1) | 2.6% | 2.3% |
| Interquartile 75% (IQ3) | 3.4% | 3.4% |
| Interquartile Range (IQR) | 0.75% | 1.1% |
| Standard Deviation (Sample) | 1.5% | 1.2% |
| Standard Deviation (Population) | 1.5% | 1.1% |
Demographics Similar to Albanians and Immigrants from Bahamas by Hearing Disability
In terms of hearing disability, the demographic groups most similar to Albanians are Immigrants from Japan (2.9%, a difference of 0.030%), Immigrants from Fiji (2.9%, a difference of 0.060%), Immigrants from Australia (2.9%, a difference of 0.090%), Immigrants from Burma/Myanmar (2.9%, a difference of 0.32%), and Immigrants from Kazakhstan (2.9%, a difference of 0.33%). Similarly, the demographic groups most similar to Immigrants from Bahamas are Laotian (2.9%, a difference of 0.020%), Immigrants from Bulgaria (2.9%, a difference of 0.27%), Immigrants from Congo (2.9%, a difference of 0.31%), Brazilian (2.9%, a difference of 0.33%), and Tongan (2.9%, a difference of 0.35%).
| Demographics | Rating | Rank | Hearing Disability |
| Laotians | 81.1 /100 | #142 | Excellent 2.9% |
| Immigrants | Bahamas | 80.9 /100 | #143 | Excellent 2.9% |
| Immigrants | Bulgaria | 79.2 /100 | #144 | Good 2.9% |
| Immigrants | Congo | 78.9 /100 | #145 | Good 2.9% |
| Brazilians | 78.7 /100 | #146 | Good 2.9% |
| Tongans | 78.6 /100 | #147 | Good 2.9% |
| Immigrants | Russia | 77.7 /100 | #148 | Good 2.9% |
| Immigrants | Panama | 76.9 /100 | #149 | Good 2.9% |
| Palestinians | 73.6 /100 | #150 | Good 2.9% |
| Immigrants | France | 73.1 /100 | #151 | Good 2.9% |
| Immigrants | Lithuania | 73.0 /100 | #152 | Good 2.9% |
| Sudanese | 72.1 /100 | #153 | Good 2.9% |
| Immigrants | Lebanon | 71.5 /100 | #154 | Good 2.9% |
| Costa Ricans | 71.4 /100 | #155 | Good 2.9% |
| Immigrants | Poland | 70.2 /100 | #156 | Good 2.9% |
| Immigrants | Kazakhstan | 69.6 /100 | #157 | Good 2.9% |
| Immigrants | Burma/Myanmar | 69.5 /100 | #158 | Good 2.9% |
| Immigrants | Australia | 67.4 /100 | #159 | Good 2.9% |
| Immigrants | Fiji | 67.1 /100 | #160 | Good 2.9% |
| Albanians | 66.6 /100 | #161 | Good 2.9% |
| Immigrants | Japan | 66.3 /100 | #162 | Good 2.9% |