Syrian vs Immigrants from Brazil Hearing Disability
COMPARE
Syrian
Immigrants from Brazil
Hearing Disability
Hearing Disability Comparison
Syrians
Immigrants from Brazil
3.1%
HEARING DISABILITY
19.2/ 100
METRIC RATING
199th/ 347
METRIC RANK
2.9%
HEARING DISABILITY
84.6/ 100
METRIC RATING
136th/ 347
METRIC RANK
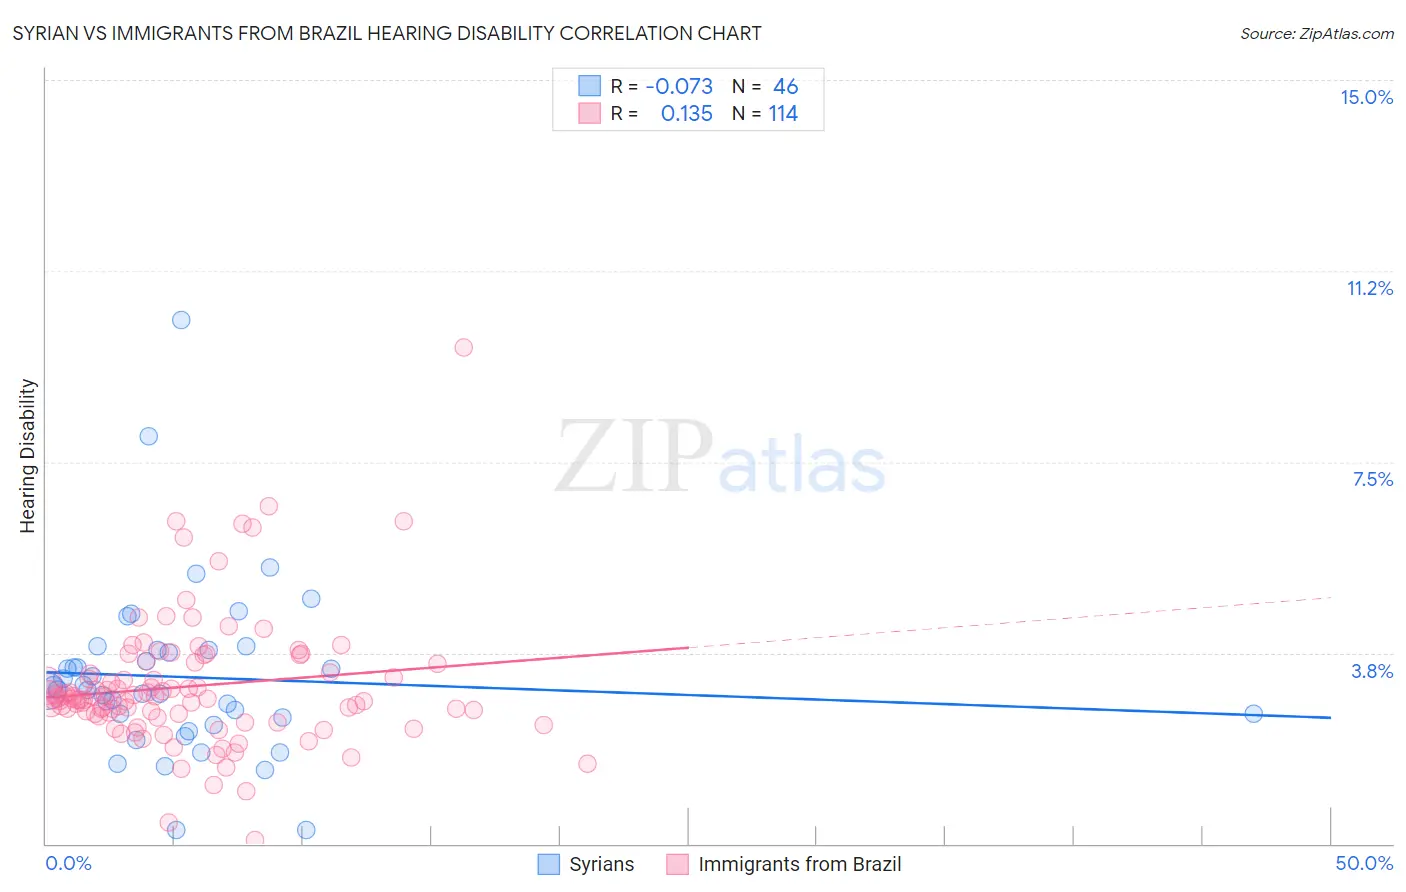
Syrian vs Immigrants from Brazil Hearing Disability Correlation Chart
The statistical analysis conducted on geographies consisting of 266,258,902 people shows a slight negative correlation between the proportion of Syrians and percentage of population with hearing disability in the United States with a correlation coefficient (R) of -0.073 and weighted average of 3.1%. Similarly, the statistical analysis conducted on geographies consisting of 342,924,003 people shows a poor positive correlation between the proportion of Immigrants from Brazil and percentage of population with hearing disability in the United States with a correlation coefficient (R) of 0.135 and weighted average of 2.9%, a difference of 7.7%.
Hearing Disability Correlation Summary
| Measurement | Syrian | Immigrants from Brazil |
| Minimum | 0.27% | 0.070% |
| Maximum | 10.3% | 9.7% |
| Range | 10.0% | 9.7% |
| Mean | 3.3% | 3.1% |
| Median | 3.0% | 2.9% |
| Interquartile 25% (IQ1) | 2.5% | 2.5% |
| Interquartile 75% (IQ3) | 3.8% | 3.5% |
| Interquartile Range (IQR) | 1.3% | 0.99% |
| Standard Deviation (Sample) | 1.7% | 1.3% |
| Standard Deviation (Population) | 1.7% | 1.3% |
Similar Demographics by Hearing Disability
Demographics Similar to Syrians by Hearing Disability
In terms of hearing disability, the demographic groups most similar to Syrians are Immigrants from North Macedonia (3.1%, a difference of 0.010%), Iraqi (3.1%, a difference of 0.030%), Immigrants from Croatia (3.1%, a difference of 0.18%), Immigrants from Bosnia and Herzegovina (3.1%, a difference of 0.20%), and Immigrants from Thailand (3.1%, a difference of 0.43%).
| Demographics | Rating | Rank | Hearing Disability |
| Koreans | 27.6 /100 | #192 | Fair 3.1% |
| Macedonians | 27.0 /100 | #193 | Fair 3.1% |
| South Africans | 24.5 /100 | #194 | Fair 3.1% |
| Spanish American Indians | 24.1 /100 | #195 | Fair 3.1% |
| Immigrants | Europe | 22.9 /100 | #196 | Fair 3.1% |
| Immigrants | Bosnia and Herzegovina | 20.6 /100 | #197 | Fair 3.1% |
| Immigrants | Croatia | 20.5 /100 | #198 | Fair 3.1% |
| Syrians | 19.2 /100 | #199 | Poor 3.1% |
| Immigrants | North Macedonia | 19.1 /100 | #200 | Poor 3.1% |
| Iraqis | 19.0 /100 | #201 | Poor 3.1% |
| Immigrants | Thailand | 16.4 /100 | #202 | Poor 3.1% |
| Immigrants | Denmark | 16.2 /100 | #203 | Poor 3.1% |
| Immigrants | Czechoslovakia | 15.9 /100 | #204 | Poor 3.1% |
| Alsatians | 15.9 /100 | #205 | Poor 3.1% |
| Eastern Europeans | 15.5 /100 | #206 | Poor 3.1% |
Demographics Similar to Immigrants from Brazil by Hearing Disability
In terms of hearing disability, the demographic groups most similar to Immigrants from Brazil are Soviet Union (2.9%, a difference of 0.030%), Sri Lankan (2.9%, a difference of 0.10%), Immigrants from Costa Rica (2.9%, a difference of 0.10%), Bermudan (2.9%, a difference of 0.15%), and Ugandan (2.9%, a difference of 0.17%).
| Demographics | Rating | Rank | Hearing Disability |
| Immigrants | Uganda | 86.6 /100 | #129 | Excellent 2.9% |
| Immigrants | Vietnam | 86.5 /100 | #130 | Excellent 2.9% |
| Immigrants | Kenya | 86.1 /100 | #131 | Excellent 2.9% |
| Chileans | 85.8 /100 | #132 | Excellent 2.9% |
| Immigrants | Syria | 85.8 /100 | #133 | Excellent 2.9% |
| Ugandans | 85.5 /100 | #134 | Excellent 2.9% |
| Soviet Union | 84.8 /100 | #135 | Excellent 2.9% |
| Immigrants | Brazil | 84.6 /100 | #136 | Excellent 2.9% |
| Sri Lankans | 84.1 /100 | #137 | Excellent 2.9% |
| Immigrants | Costa Rica | 84.0 /100 | #138 | Excellent 2.9% |
| Bermudans | 83.8 /100 | #139 | Excellent 2.9% |
| Immigrants | Jordan | 83.7 /100 | #140 | Excellent 2.9% |
| Sub-Saharan Africans | 83.3 /100 | #141 | Excellent 2.9% |
| Laotians | 81.1 /100 | #142 | Excellent 2.9% |
| Immigrants | Bahamas | 80.9 /100 | #143 | Excellent 2.9% |