German Russian vs Jamaican Male Disability
COMPARE
German Russian
Jamaican
Male Disability
Male Disability Comparison
German Russians
Jamaicans
12.0%
MALE DISABILITY
0.5/ 100
METRIC RATING
251st/ 347
METRIC RANK
11.5%
MALE DISABILITY
10.9/ 100
METRIC RATING
203rd/ 347
METRIC RANK
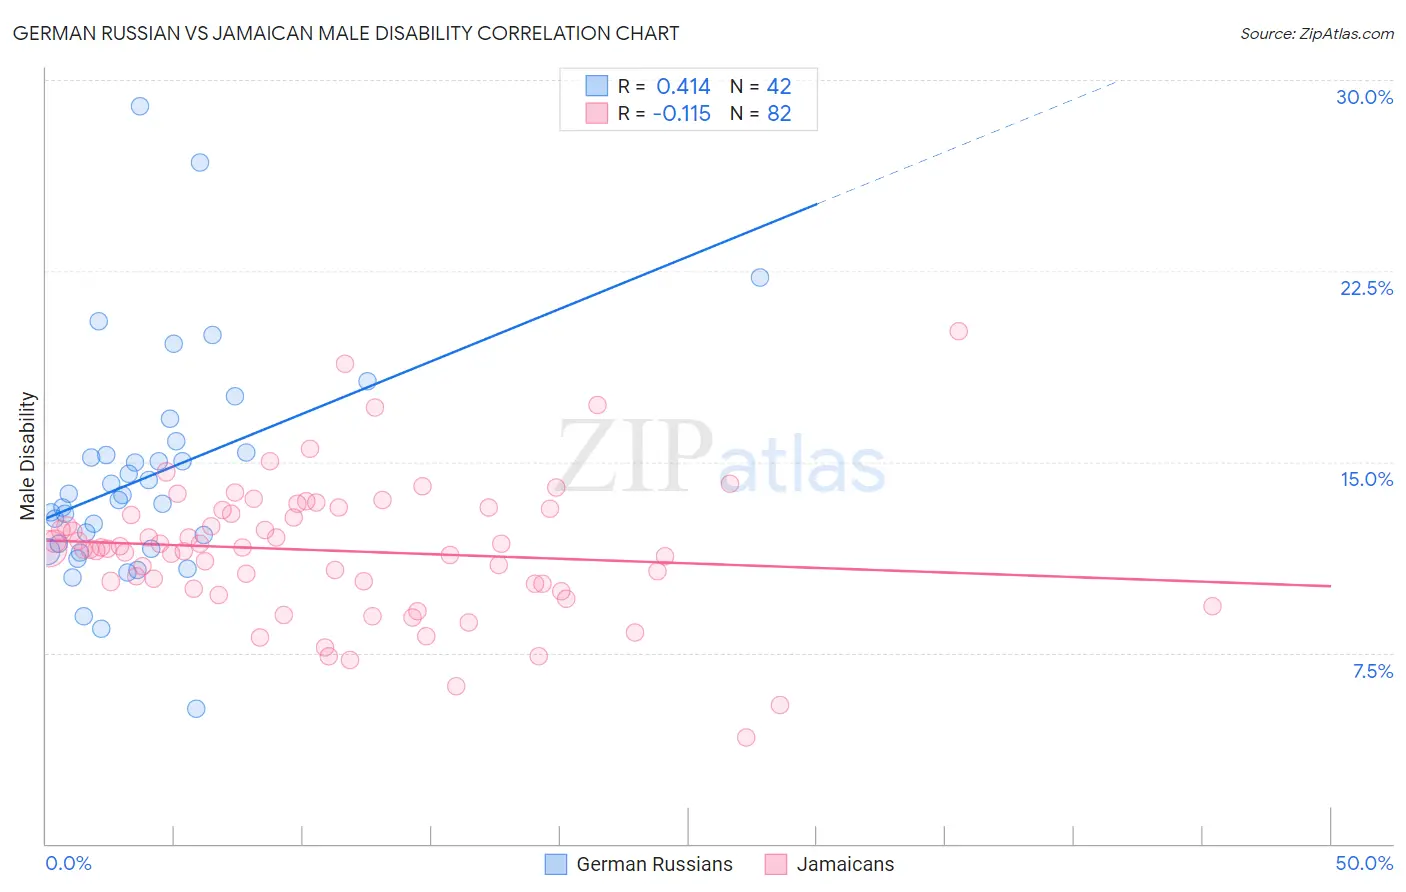
German Russian vs Jamaican Male Disability Correlation Chart
The statistical analysis conducted on geographies consisting of 96,458,633 people shows a moderate positive correlation between the proportion of German Russians and percentage of males with a disability in the United States with a correlation coefficient (R) of 0.414 and weighted average of 12.0%. Similarly, the statistical analysis conducted on geographies consisting of 367,937,563 people shows a poor negative correlation between the proportion of Jamaicans and percentage of males with a disability in the United States with a correlation coefficient (R) of -0.115 and weighted average of 11.5%, a difference of 4.2%.
Male Disability Correlation Summary
| Measurement | German Russian | Jamaican |
| Minimum | 5.3% | 4.2% |
| Maximum | 29.0% | 20.1% |
| Range | 23.7% | 15.9% |
| Mean | 14.4% | 11.5% |
| Median | 13.6% | 11.6% |
| Interquartile 25% (IQ1) | 11.6% | 10.2% |
| Interquartile 75% (IQ3) | 15.4% | 13.1% |
| Interquartile Range (IQR) | 3.8% | 2.9% |
| Standard Deviation (Sample) | 4.5% | 2.7% |
| Standard Deviation (Population) | 4.4% | 2.7% |
Similar Demographics by Male Disability
Demographics Similar to German Russians by Male Disability
In terms of male disability, the demographic groups most similar to German Russians are Bangladeshi (12.0%, a difference of 0.010%), Immigrants from Yemen (12.0%, a difference of 0.060%), Slovene (12.0%, a difference of 0.070%), Guamanian/Chamorro (12.0%, a difference of 0.070%), and British (12.1%, a difference of 0.26%).
| Demographics | Rating | Rank | Male Disability |
| Immigrants | Laos | 1.0 /100 | #244 | Tragic 11.9% |
| Immigrants | Liberia | 1.0 /100 | #245 | Tragic 11.9% |
| Danes | 0.9 /100 | #246 | Tragic 11.9% |
| Hungarians | 0.8 /100 | #247 | Tragic 12.0% |
| Poles | 0.7 /100 | #248 | Tragic 12.0% |
| Immigrants | Yemen | 0.5 /100 | #249 | Tragic 12.0% |
| Bangladeshis | 0.5 /100 | #250 | Tragic 12.0% |
| German Russians | 0.5 /100 | #251 | Tragic 12.0% |
| Slovenes | 0.5 /100 | #252 | Tragic 12.0% |
| Guamanians/Chamorros | 0.5 /100 | #253 | Tragic 12.0% |
| British | 0.4 /100 | #254 | Tragic 12.1% |
| Chinese | 0.4 /100 | #255 | Tragic 12.1% |
| Swiss | 0.3 /100 | #256 | Tragic 12.1% |
| Europeans | 0.3 /100 | #257 | Tragic 12.1% |
| Basques | 0.3 /100 | #258 | Tragic 12.1% |
Demographics Similar to Jamaicans by Male Disability
In terms of male disability, the demographic groups most similar to Jamaicans are Immigrants from Cambodia (11.5%, a difference of 0.010%), Serbian (11.5%, a difference of 0.020%), Ukrainian (11.5%, a difference of 0.030%), Immigrants from Somalia (11.5%, a difference of 0.060%), and Icelander (11.6%, a difference of 0.10%).
| Demographics | Rating | Rank | Male Disability |
| West Indians | 18.4 /100 | #196 | Poor 11.4% |
| Somalis | 18.2 /100 | #197 | Poor 11.4% |
| Immigrants | Jamaica | 16.3 /100 | #198 | Poor 11.5% |
| Lebanese | 15.4 /100 | #199 | Poor 11.5% |
| Immigrants | Iraq | 13.0 /100 | #200 | Poor 11.5% |
| Immigrants | Panama | 13.0 /100 | #201 | Poor 11.5% |
| Immigrants | Mexico | 12.6 /100 | #202 | Poor 11.5% |
| Jamaicans | 10.9 /100 | #203 | Poor 11.5% |
| Immigrants | Cambodia | 10.8 /100 | #204 | Poor 11.5% |
| Serbians | 10.7 /100 | #205 | Poor 11.5% |
| Ukrainians | 10.6 /100 | #206 | Poor 11.5% |
| Immigrants | Somalia | 10.4 /100 | #207 | Poor 11.5% |
| Icelanders | 10.1 /100 | #208 | Poor 11.6% |
| Spanish American Indians | 10.1 /100 | #209 | Poor 11.6% |
| Ute | 9.4 /100 | #210 | Tragic 11.6% |