Alaskan Athabascan vs Jamaican Associate's Degree
COMPARE
Alaskan Athabascan
Jamaican
Associate's Degree
Associate's Degree Comparison
Alaskan Athabascans
Jamaicans
36.5%
ASSOCIATE'S DEGREE
0.0/ 100
METRIC RATING
328th/ 347
METRIC RANK
42.1%
ASSOCIATE'S DEGREE
0.7/ 100
METRIC RATING
249th/ 347
METRIC RANK
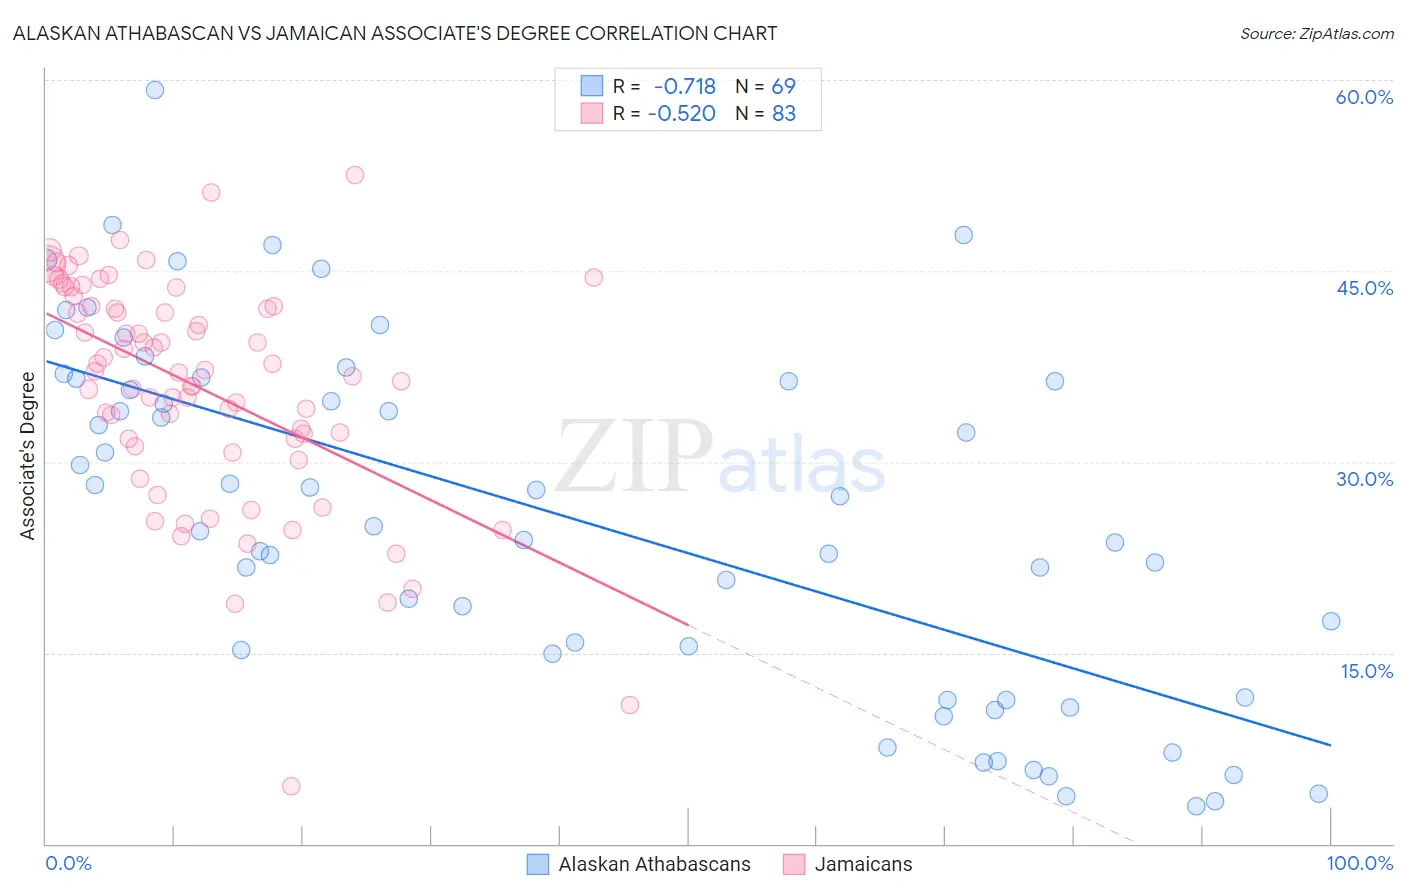
Alaskan Athabascan vs Jamaican Associate's Degree Correlation Chart
The statistical analysis conducted on geographies consisting of 45,819,945 people shows a strong negative correlation between the proportion of Alaskan Athabascans and percentage of population with at least associate's degree education in the United States with a correlation coefficient (R) of -0.718 and weighted average of 36.5%. Similarly, the statistical analysis conducted on geographies consisting of 368,030,405 people shows a substantial negative correlation between the proportion of Jamaicans and percentage of population with at least associate's degree education in the United States with a correlation coefficient (R) of -0.520 and weighted average of 42.1%, a difference of 15.5%.
Associate's Degree Correlation Summary
| Measurement | Alaskan Athabascan | Jamaican |
| Minimum | 3.0% | 4.5% |
| Maximum | 59.2% | 52.5% |
| Range | 56.2% | 48.0% |
| Mean | 25.6% | 36.0% |
| Median | 24.9% | 37.1% |
| Interquartile 25% (IQ1) | 13.2% | 31.8% |
| Interquartile 75% (IQ3) | 36.5% | 42.2% |
| Interquartile Range (IQR) | 23.3% | 10.4% |
| Standard Deviation (Sample) | 13.9% | 8.8% |
| Standard Deviation (Population) | 13.8% | 8.8% |
Similar Demographics by Associate's Degree
Demographics Similar to Alaskan Athabascans by Associate's Degree
In terms of associate's degree, the demographic groups most similar to Alaskan Athabascans are Dutch West Indian (36.5%, a difference of 0.010%), Kiowa (36.5%, a difference of 0.030%), Paiute (36.4%, a difference of 0.29%), Menominee (36.7%, a difference of 0.59%), and Apache (36.2%, a difference of 0.60%).
| Demographics | Rating | Rank | Associate's Degree |
| Immigrants | Yemen | 0.0 /100 | #321 | Tragic 37.3% |
| Pennsylvania Germans | 0.0 /100 | #322 | Tragic 37.2% |
| Immigrants | Cabo Verde | 0.0 /100 | #323 | Tragic 36.8% |
| Arapaho | 0.0 /100 | #324 | Tragic 36.7% |
| Menominee | 0.0 /100 | #325 | Tragic 36.7% |
| Kiowa | 0.0 /100 | #326 | Tragic 36.5% |
| Dutch West Indians | 0.0 /100 | #327 | Tragic 36.5% |
| Alaskan Athabascans | 0.0 /100 | #328 | Tragic 36.5% |
| Paiute | 0.0 /100 | #329 | Tragic 36.4% |
| Apache | 0.0 /100 | #330 | Tragic 36.2% |
| Immigrants | Azores | 0.0 /100 | #331 | Tragic 35.6% |
| Immigrants | Central America | 0.0 /100 | #332 | Tragic 35.0% |
| Mexicans | 0.0 /100 | #333 | Tragic 35.0% |
| Natives/Alaskans | 0.0 /100 | #334 | Tragic 34.9% |
| Spanish American Indians | 0.0 /100 | #335 | Tragic 34.9% |
Demographics Similar to Jamaicans by Associate's Degree
In terms of associate's degree, the demographic groups most similar to Jamaicans are U.S. Virgin Islander (42.1%, a difference of 0.010%), Immigrants from Bahamas (42.1%, a difference of 0.030%), Immigrants from Ecuador (42.2%, a difference of 0.14%), Immigrants from Fiji (42.2%, a difference of 0.23%), and Delaware (42.3%, a difference of 0.32%).
| Demographics | Rating | Rank | Associate's Degree |
| Immigrants | West Indies | 1.0 /100 | #242 | Tragic 42.4% |
| Guyanese | 1.0 /100 | #243 | Tragic 42.3% |
| Immigrants | Liberia | 0.9 /100 | #244 | Tragic 42.3% |
| Immigrants | Cambodia | 0.9 /100 | #245 | Tragic 42.3% |
| Delaware | 0.9 /100 | #246 | Tragic 42.3% |
| Immigrants | Fiji | 0.8 /100 | #247 | Tragic 42.2% |
| Immigrants | Ecuador | 0.8 /100 | #248 | Tragic 42.2% |
| Jamaicans | 0.7 /100 | #249 | Tragic 42.1% |
| U.S. Virgin Islanders | 0.7 /100 | #250 | Tragic 42.1% |
| Immigrants | Bahamas | 0.7 /100 | #251 | Tragic 42.1% |
| French American Indians | 0.6 /100 | #252 | Tragic 42.0% |
| Indonesians | 0.6 /100 | #253 | Tragic 41.9% |
| Cubans | 0.6 /100 | #254 | Tragic 41.9% |
| Immigrants | Guyana | 0.5 /100 | #255 | Tragic 41.8% |
| Immigrants | Congo | 0.5 /100 | #256 | Tragic 41.8% |