African vs Trinidadian and Tobagonian Disability Age 35 to 64
COMPARE
African
Trinidadian and Tobagonian
Disability Age 35 to 64
Disability Age 35 to 64 Comparison
Africans
Trinidadians and Tobagonians
13.6%
DISABILITY AGE 35 TO 64
0.0/ 100
METRIC RATING
296th/ 347
METRIC RANK
11.4%
DISABILITY AGE 35 TO 64
40.8/ 100
METRIC RATING
181st/ 347
METRIC RANK
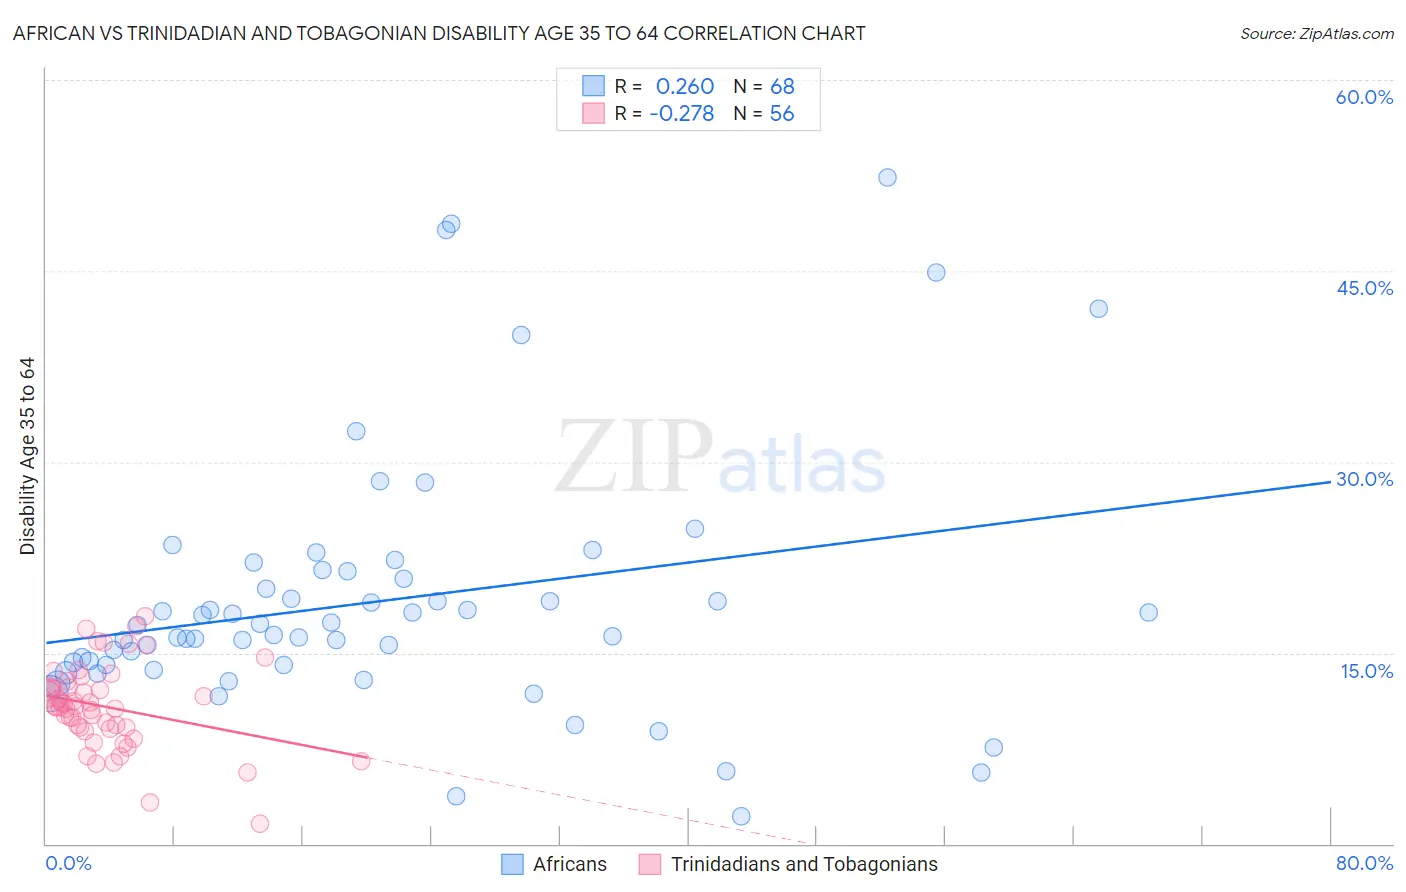
African vs Trinidadian and Tobagonian Disability Age 35 to 64 Correlation Chart
The statistical analysis conducted on geographies consisting of 469,523,166 people shows a weak positive correlation between the proportion of Africans and percentage of population with a disability between the ages 34 and 64 in the United States with a correlation coefficient (R) of 0.260 and weighted average of 13.6%. Similarly, the statistical analysis conducted on geographies consisting of 219,688,298 people shows a weak negative correlation between the proportion of Trinidadians and Tobagonians and percentage of population with a disability between the ages 34 and 64 in the United States with a correlation coefficient (R) of -0.278 and weighted average of 11.4%, a difference of 19.6%.
Disability Age 35 to 64 Correlation Summary
| Measurement | African | Trinidadian and Tobagonian |
| Minimum | 2.2% | 1.6% |
| Maximum | 52.4% | 17.9% |
| Range | 50.2% | 16.3% |
| Mean | 19.1% | 10.8% |
| Median | 16.8% | 10.8% |
| Interquartile 25% (IQ1) | 14.0% | 9.1% |
| Interquartile 75% (IQ3) | 21.1% | 12.3% |
| Interquartile Range (IQR) | 7.1% | 3.2% |
| Standard Deviation (Sample) | 10.1% | 3.3% |
| Standard Deviation (Population) | 10.0% | 3.3% |
Similar Demographics by Disability Age 35 to 64
Demographics Similar to Africans by Disability Age 35 to 64
In terms of disability age 35 to 64, the demographic groups most similar to Africans are Yakama (13.6%, a difference of 0.22%), Bangladeshi (13.6%, a difference of 0.35%), Cheyenne (13.6%, a difference of 0.38%), Spanish American (13.7%, a difference of 0.58%), and Delaware (13.7%, a difference of 0.66%).
| Demographics | Rating | Rank | Disability Age 35 to 64 |
| Indonesians | 0.0 /100 | #289 | Tragic 13.2% |
| Immigrants | Liberia | 0.0 /100 | #290 | Tragic 13.2% |
| Immigrants | Congo | 0.0 /100 | #291 | Tragic 13.3% |
| Puget Sound Salish | 0.0 /100 | #292 | Tragic 13.3% |
| Ute | 0.0 /100 | #293 | Tragic 13.4% |
| Yaqui | 0.0 /100 | #294 | Tragic 13.5% |
| Yakama | 0.0 /100 | #295 | Tragic 13.6% |
| Africans | 0.0 /100 | #296 | Tragic 13.6% |
| Bangladeshis | 0.0 /100 | #297 | Tragic 13.6% |
| Cheyenne | 0.0 /100 | #298 | Tragic 13.6% |
| Spanish Americans | 0.0 /100 | #299 | Tragic 13.7% |
| Delaware | 0.0 /100 | #300 | Tragic 13.7% |
| French American Indians | 0.0 /100 | #301 | Tragic 13.7% |
| Aleuts | 0.0 /100 | #302 | Tragic 13.8% |
| Sioux | 0.0 /100 | #303 | Tragic 13.9% |
Demographics Similar to Trinidadians and Tobagonians by Disability Age 35 to 64
In terms of disability age 35 to 64, the demographic groups most similar to Trinidadians and Tobagonians are Immigrants from Caribbean (11.3%, a difference of 0.060%), Immigrants from Barbados (11.3%, a difference of 0.070%), Icelander (11.4%, a difference of 0.090%), Polish (11.3%, a difference of 0.10%), and Immigrants from Oceania (11.4%, a difference of 0.10%).
| Demographics | Rating | Rank | Disability Age 35 to 64 |
| Immigrants | Fiji | 50.0 /100 | #174 | Average 11.3% |
| Czechs | 47.9 /100 | #175 | Average 11.3% |
| Ugandans | 43.7 /100 | #176 | Average 11.3% |
| Immigrants | Eastern Africa | 42.2 /100 | #177 | Average 11.3% |
| Poles | 42.0 /100 | #178 | Average 11.3% |
| Immigrants | Barbados | 41.6 /100 | #179 | Average 11.3% |
| Immigrants | Caribbean | 41.5 /100 | #180 | Average 11.3% |
| Trinidadians and Tobagonians | 40.8 /100 | #181 | Average 11.4% |
| Icelanders | 39.7 /100 | #182 | Fair 11.4% |
| Immigrants | Oceania | 39.5 /100 | #183 | Fair 11.4% |
| Kenyans | 39.2 /100 | #184 | Fair 11.4% |
| Danes | 36.8 /100 | #185 | Fair 11.4% |
| Slovenes | 36.6 /100 | #186 | Fair 11.4% |
| Immigrants | Bosnia and Herzegovina | 35.2 /100 | #187 | Fair 11.4% |
| Northern Europeans | 34.9 /100 | #188 | Fair 11.4% |