Swedish vs Nigerian Disability Age 5 to 17
COMPARE
Swedish
Nigerian
Disability Age 5 to 17
Disability Age 5 to 17 Comparison
Swedes
Nigerians
5.8%
DISABILITY AGE 5 TO 17
8.1/ 100
METRIC RATING
215th/ 347
METRIC RANK
5.8%
DISABILITY AGE 5 TO 17
7.5/ 100
METRIC RATING
216th/ 347
METRIC RANK
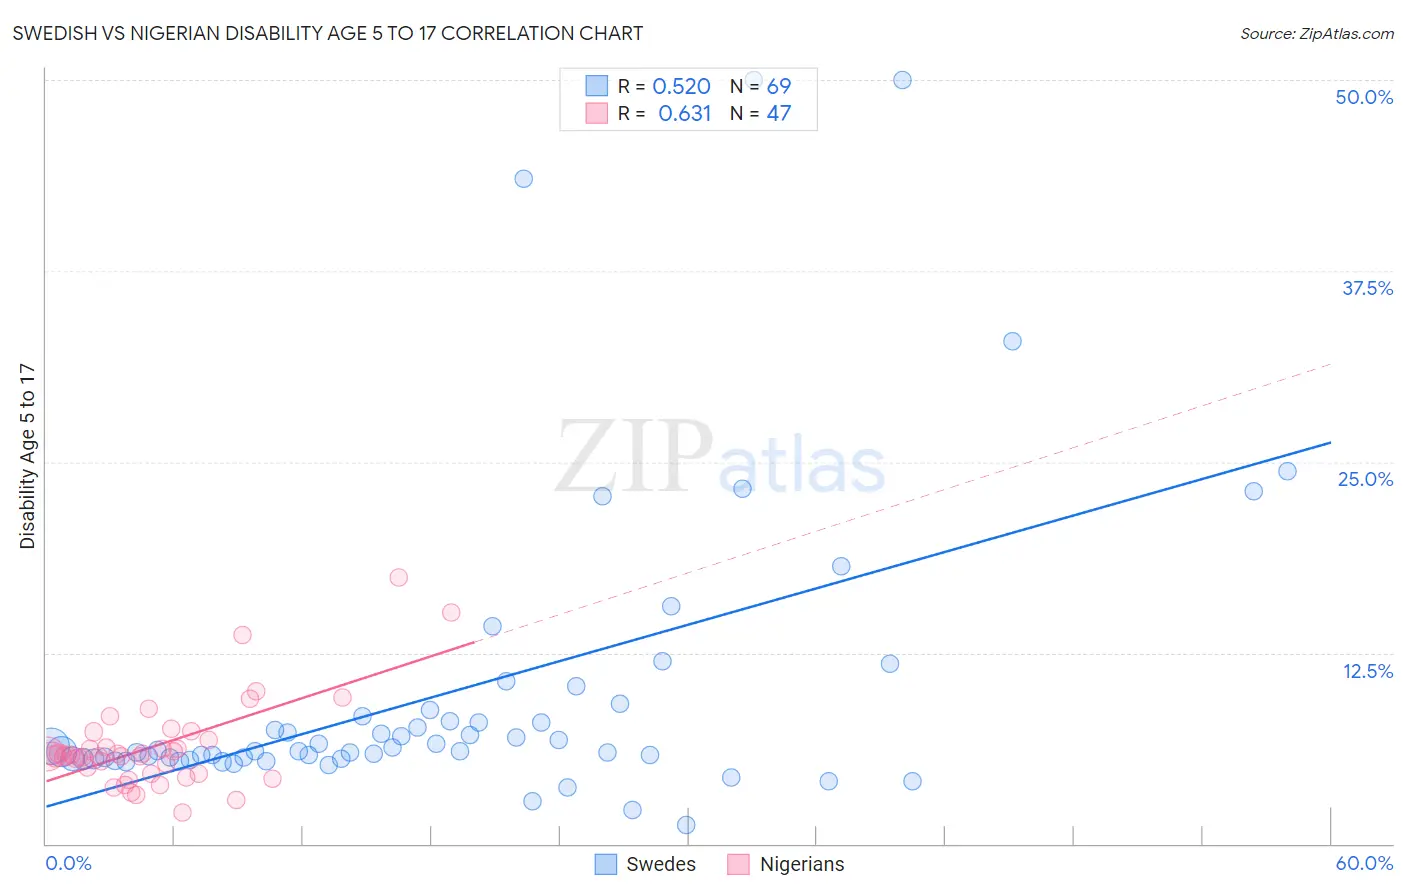
Swedish vs Nigerian Disability Age 5 to 17 Correlation Chart
The statistical analysis conducted on geographies consisting of 528,112,319 people shows a substantial positive correlation between the proportion of Swedes and percentage of population with a disability between the ages 5 and 17 in the United States with a correlation coefficient (R) of 0.520 and weighted average of 5.8%. Similarly, the statistical analysis conducted on geographies consisting of 330,899,838 people shows a significant positive correlation between the proportion of Nigerians and percentage of population with a disability between the ages 5 and 17 in the United States with a correlation coefficient (R) of 0.631 and weighted average of 5.8%, a difference of 0.090%.
Disability Age 5 to 17 Correlation Summary
| Measurement | Swedish | Nigerian |
| Minimum | 1.3% | 2.1% |
| Maximum | 50.0% | 17.5% |
| Range | 48.7% | 15.4% |
| Mean | 9.9% | 6.4% |
| Median | 6.1% | 5.8% |
| Interquartile 25% (IQ1) | 5.6% | 4.6% |
| Interquartile 75% (IQ3) | 8.5% | 6.8% |
| Interquartile Range (IQR) | 3.0% | 2.2% |
| Standard Deviation (Sample) | 9.9% | 2.9% |
| Standard Deviation (Population) | 9.8% | 2.9% |
Demographics Similar to Swedes and Nigerians by Disability Age 5 to 17
In terms of disability age 5 to 17, the demographic groups most similar to Swedes are Immigrants from Cameroon (5.8%, a difference of 0.040%), Immigrants from Morocco (5.8%, a difference of 0.040%), Immigrants from Panama (5.8%, a difference of 0.090%), Czech (5.8%, a difference of 0.12%), and Yugoslavian (5.8%, a difference of 0.16%). Similarly, the demographic groups most similar to Nigerians are Czech (5.8%, a difference of 0.030%), Immigrants from Sierra Leone (5.8%, a difference of 0.080%), Sierra Leonean (5.8%, a difference of 0.090%), Belgian (5.8%, a difference of 0.10%), and Immigrants from Cameroon (5.8%, a difference of 0.13%).
| Demographics | Rating | Rank | Disability Age 5 to 17 |
| Trinidadians and Tobagonians | 10.8 /100 | #205 | Poor 5.7% |
| Immigrants | Africa | 10.8 /100 | #206 | Poor 5.7% |
| Moroccans | 10.4 /100 | #207 | Poor 5.7% |
| Kenyans | 10.0 /100 | #208 | Poor 5.8% |
| Immigrants | Uganda | 9.7 /100 | #209 | Tragic 5.8% |
| Immigrants | Haiti | 9.5 /100 | #210 | Tragic 5.8% |
| Yugoslavians | 9.1 /100 | #211 | Tragic 5.8% |
| Immigrants | Panama | 8.7 /100 | #212 | Tragic 5.8% |
| Immigrants | Cameroon | 8.3 /100 | #213 | Tragic 5.8% |
| Immigrants | Morocco | 8.3 /100 | #214 | Tragic 5.8% |
| Swedes | 8.1 /100 | #215 | Tragic 5.8% |
| Nigerians | 7.5 /100 | #216 | Tragic 5.8% |
| Czechs | 7.4 /100 | #217 | Tragic 5.8% |
| Immigrants | Sierra Leone | 7.1 /100 | #218 | Tragic 5.8% |
| Sierra Leoneans | 7.0 /100 | #219 | Tragic 5.8% |
| Belgians | 6.9 /100 | #220 | Tragic 5.8% |
| Lithuanians | 6.7 /100 | #221 | Tragic 5.8% |
| Immigrants | Sudan | 6.7 /100 | #222 | Tragic 5.8% |
| Alsatians | 6.0 /100 | #223 | Tragic 5.8% |
| Mexicans | 5.7 /100 | #224 | Tragic 5.8% |
| Guamanians/Chamorros | 5.6 /100 | #225 | Tragic 5.8% |