Navajo vs Nigerian Disability Age 5 to 17
COMPARE
Navajo
Nigerian
Disability Age 5 to 17
Disability Age 5 to 17 Comparison
Navajo
Nigerians
5.4%
DISABILITY AGE 5 TO 17
90.9/ 100
METRIC RATING
137th/ 347
METRIC RANK
5.8%
DISABILITY AGE 5 TO 17
7.5/ 100
METRIC RATING
216th/ 347
METRIC RANK
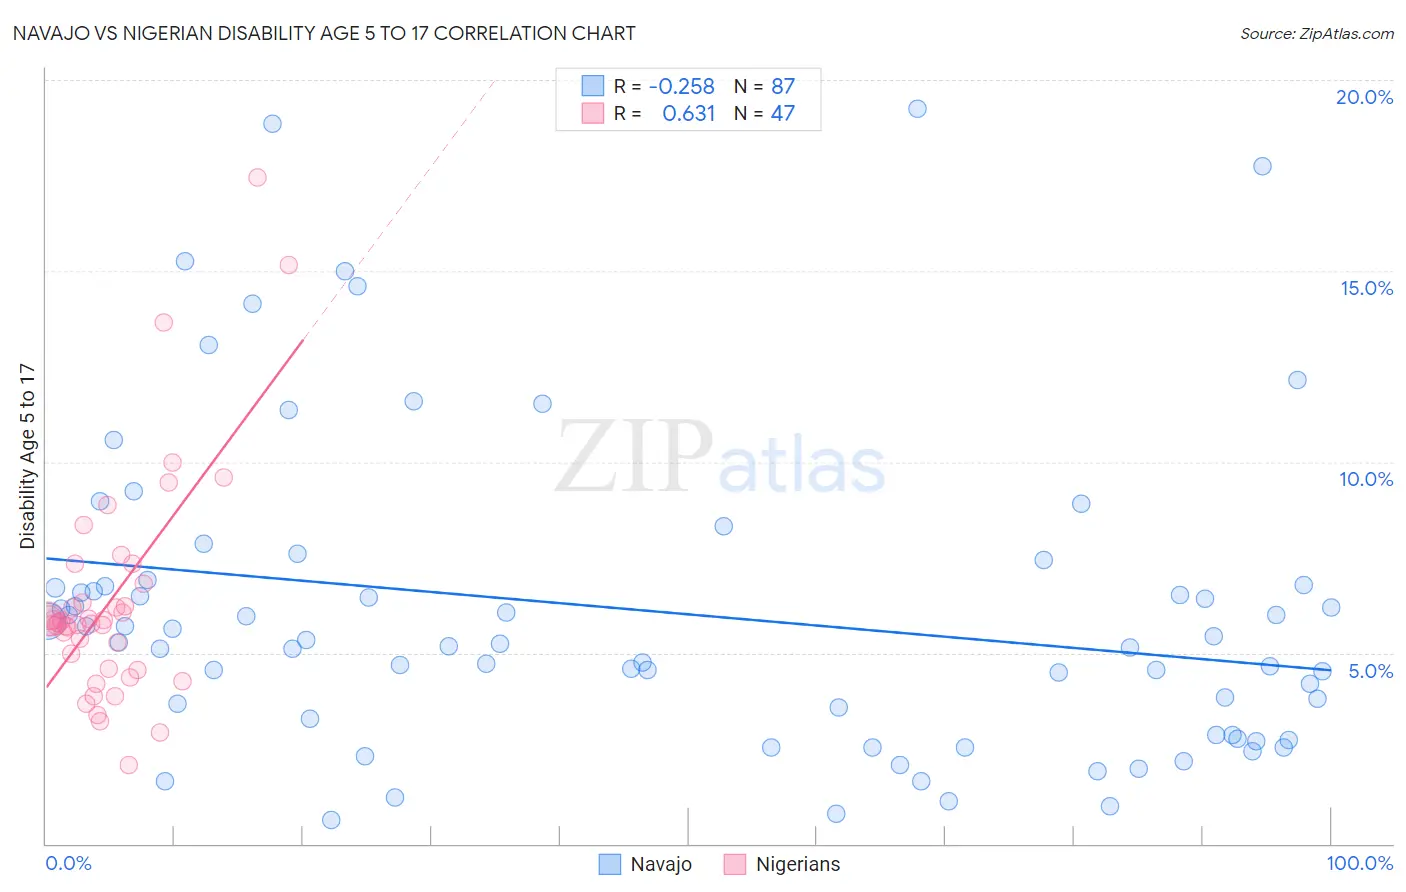
Navajo vs Nigerian Disability Age 5 to 17 Correlation Chart
The statistical analysis conducted on geographies consisting of 223,670,452 people shows a weak negative correlation between the proportion of Navajo and percentage of population with a disability between the ages 5 and 17 in the United States with a correlation coefficient (R) of -0.258 and weighted average of 5.4%. Similarly, the statistical analysis conducted on geographies consisting of 330,899,838 people shows a significant positive correlation between the proportion of Nigerians and percentage of population with a disability between the ages 5 and 17 in the United States with a correlation coefficient (R) of 0.631 and weighted average of 5.8%, a difference of 6.1%.
Disability Age 5 to 17 Correlation Summary
| Measurement | Navajo | Nigerian |
| Minimum | 0.63% | 2.1% |
| Maximum | 19.3% | 17.5% |
| Range | 18.6% | 15.4% |
| Mean | 6.1% | 6.4% |
| Median | 5.3% | 5.8% |
| Interquartile 25% (IQ1) | 2.8% | 4.6% |
| Interquartile 75% (IQ3) | 6.8% | 6.8% |
| Interquartile Range (IQR) | 3.9% | 2.2% |
| Standard Deviation (Sample) | 4.1% | 2.9% |
| Standard Deviation (Population) | 4.1% | 2.9% |
Similar Demographics by Disability Age 5 to 17
Demographics Similar to Navajo by Disability Age 5 to 17
In terms of disability age 5 to 17, the demographic groups most similar to Navajo are Immigrants from Oceania (5.4%, a difference of 0.0%), Belizean (5.4%, a difference of 0.010%), Immigrants from Netherlands (5.4%, a difference of 0.060%), Immigrants from Denmark (5.4%, a difference of 0.080%), and Immigrants from Belize (5.4%, a difference of 0.13%).
| Demographics | Rating | Rank | Disability Age 5 to 17 |
| Immigrants | Bulgaria | 94.0 /100 | #130 | Exceptional 5.4% |
| Arabs | 92.9 /100 | #131 | Exceptional 5.4% |
| Immigrants | Colombia | 92.9 /100 | #132 | Exceptional 5.4% |
| Venezuelans | 92.7 /100 | #133 | Exceptional 5.4% |
| Yuman | 92.3 /100 | #134 | Exceptional 5.4% |
| Immigrants | Belize | 91.7 /100 | #135 | Exceptional 5.4% |
| Immigrants | Denmark | 91.4 /100 | #136 | Exceptional 5.4% |
| Navajo | 90.9 /100 | #137 | Exceptional 5.4% |
| Immigrants | Oceania | 90.8 /100 | #138 | Exceptional 5.4% |
| Belizeans | 90.8 /100 | #139 | Exceptional 5.4% |
| Immigrants | Netherlands | 90.5 /100 | #140 | Exceptional 5.4% |
| South American Indians | 89.3 /100 | #141 | Excellent 5.5% |
| Colombians | 88.0 /100 | #142 | Excellent 5.5% |
| Immigrants | Hungary | 87.9 /100 | #143 | Excellent 5.5% |
| Pakistanis | 87.3 /100 | #144 | Excellent 5.5% |
Demographics Similar to Nigerians by Disability Age 5 to 17
In terms of disability age 5 to 17, the demographic groups most similar to Nigerians are Czech (5.8%, a difference of 0.030%), Immigrants from Sierra Leone (5.8%, a difference of 0.080%), Swedish (5.8%, a difference of 0.090%), Sierra Leonean (5.8%, a difference of 0.090%), and Belgian (5.8%, a difference of 0.10%).
| Demographics | Rating | Rank | Disability Age 5 to 17 |
| Immigrants | Uganda | 9.7 /100 | #209 | Tragic 5.8% |
| Immigrants | Haiti | 9.5 /100 | #210 | Tragic 5.8% |
| Yugoslavians | 9.1 /100 | #211 | Tragic 5.8% |
| Immigrants | Panama | 8.7 /100 | #212 | Tragic 5.8% |
| Immigrants | Cameroon | 8.3 /100 | #213 | Tragic 5.8% |
| Immigrants | Morocco | 8.3 /100 | #214 | Tragic 5.8% |
| Swedes | 8.1 /100 | #215 | Tragic 5.8% |
| Nigerians | 7.5 /100 | #216 | Tragic 5.8% |
| Czechs | 7.4 /100 | #217 | Tragic 5.8% |
| Immigrants | Sierra Leone | 7.1 /100 | #218 | Tragic 5.8% |
| Sierra Leoneans | 7.0 /100 | #219 | Tragic 5.8% |
| Belgians | 6.9 /100 | #220 | Tragic 5.8% |
| Lithuanians | 6.7 /100 | #221 | Tragic 5.8% |
| Immigrants | Sudan | 6.7 /100 | #222 | Tragic 5.8% |
| Alsatians | 6.0 /100 | #223 | Tragic 5.8% |