African vs Spanish American Self-Care Disability
COMPARE
African
Spanish American
Self-Care Disability
Self-Care Disability Comparison
Africans
Spanish Americans
2.7%
SELF-CARE DISABILITY
0.0/ 100
METRIC RATING
289th/ 347
METRIC RANK
2.8%
SELF-CARE DISABILITY
0.0/ 100
METRIC RATING
313th/ 347
METRIC RANK
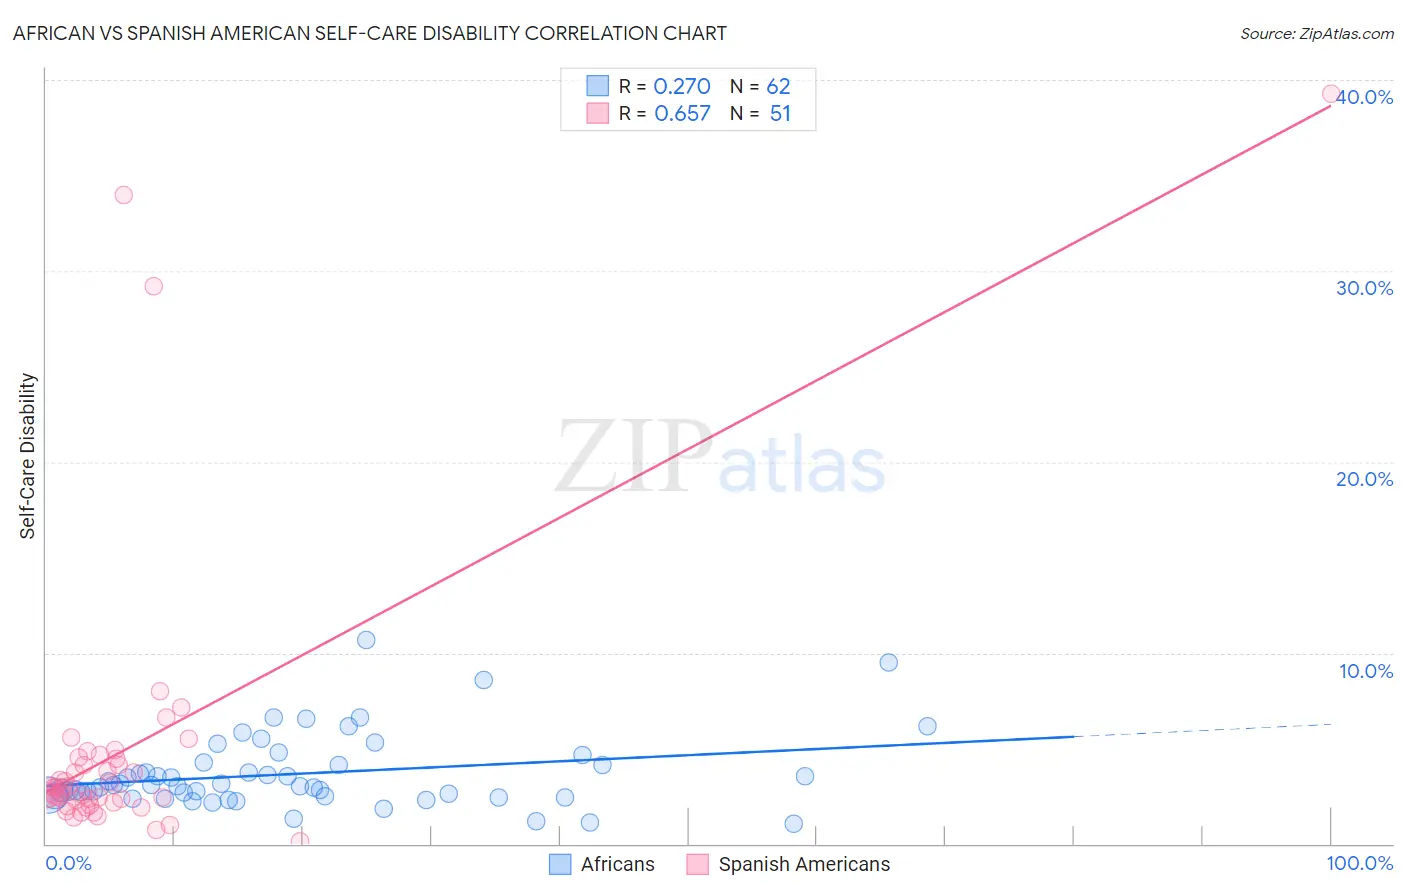
African vs Spanish American Self-Care Disability Correlation Chart
The statistical analysis conducted on geographies consisting of 469,231,301 people shows a weak positive correlation between the proportion of Africans and percentage of population with self-care disability in the United States with a correlation coefficient (R) of 0.270 and weighted average of 2.7%. Similarly, the statistical analysis conducted on geographies consisting of 103,142,959 people shows a significant positive correlation between the proportion of Spanish Americans and percentage of population with self-care disability in the United States with a correlation coefficient (R) of 0.657 and weighted average of 2.8%, a difference of 3.8%.
Self-Care Disability Correlation Summary
| Measurement | African | Spanish American |
| Minimum | 1.1% | 0.12% |
| Maximum | 10.7% | 39.3% |
| Range | 9.6% | 39.1% |
| Mean | 3.7% | 4.9% |
| Median | 3.0% | 2.9% |
| Interquartile 25% (IQ1) | 2.5% | 2.2% |
| Interquartile 75% (IQ3) | 4.2% | 4.4% |
| Interquartile Range (IQR) | 1.6% | 2.3% |
| Standard Deviation (Sample) | 1.9% | 7.6% |
| Standard Deviation (Population) | 1.9% | 7.5% |
Similar Demographics by Self-Care Disability
Demographics Similar to Africans by Self-Care Disability
In terms of self-care disability, the demographic groups most similar to Africans are Immigrants from Barbados (2.7%, a difference of 0.10%), Immigrants from Jamaica (2.7%, a difference of 0.14%), Cuban (2.7%, a difference of 0.15%), Guyanese (2.7%, a difference of 0.41%), and French American Indian (2.7%, a difference of 0.47%).
| Demographics | Rating | Rank | Self-Care Disability |
| Apache | 0.0 /100 | #282 | Tragic 2.7% |
| Delaware | 0.0 /100 | #283 | Tragic 2.7% |
| Fijians | 0.0 /100 | #284 | Tragic 2.7% |
| Jamaicans | 0.0 /100 | #285 | Tragic 2.7% |
| French American Indians | 0.0 /100 | #286 | Tragic 2.7% |
| Immigrants | Jamaica | 0.0 /100 | #287 | Tragic 2.7% |
| Immigrants | Barbados | 0.0 /100 | #288 | Tragic 2.7% |
| Africans | 0.0 /100 | #289 | Tragic 2.7% |
| Cubans | 0.0 /100 | #290 | Tragic 2.7% |
| Guyanese | 0.0 /100 | #291 | Tragic 2.7% |
| Central American Indians | 0.0 /100 | #292 | Tragic 2.7% |
| Belizeans | 0.0 /100 | #293 | Tragic 2.7% |
| Blackfeet | 0.0 /100 | #294 | Tragic 2.7% |
| Barbadians | 0.0 /100 | #295 | Tragic 2.7% |
| Immigrants | Portugal | 0.0 /100 | #296 | Tragic 2.8% |
Demographics Similar to Spanish Americans by Self-Care Disability
In terms of self-care disability, the demographic groups most similar to Spanish Americans are Immigrants from Caribbean (2.8%, a difference of 0.030%), Creek (2.8%, a difference of 0.22%), Puget Sound Salish (2.8%, a difference of 0.23%), British West Indian (2.8%, a difference of 0.30%), and Bangladeshi (2.8%, a difference of 0.40%).
| Demographics | Rating | Rank | Self-Care Disability |
| Aleuts | 0.0 /100 | #306 | Tragic 2.8% |
| Natives/Alaskans | 0.0 /100 | #307 | Tragic 2.8% |
| Immigrants | Grenada | 0.0 /100 | #308 | Tragic 2.8% |
| Bangladeshis | 0.0 /100 | #309 | Tragic 2.8% |
| British West Indians | 0.0 /100 | #310 | Tragic 2.8% |
| Puget Sound Salish | 0.0 /100 | #311 | Tragic 2.8% |
| Immigrants | Caribbean | 0.0 /100 | #312 | Tragic 2.8% |
| Spanish Americans | 0.0 /100 | #313 | Tragic 2.8% |
| Creek | 0.0 /100 | #314 | Tragic 2.8% |
| Immigrants | Cuba | 0.0 /100 | #315 | Tragic 2.8% |
| Menominee | 0.0 /100 | #316 | Tragic 2.8% |
| Immigrants | Dominica | 0.0 /100 | #317 | Tragic 2.8% |
| Assyrians/Chaldeans/Syriacs | 0.0 /100 | #318 | Tragic 2.8% |
| Spanish American Indians | 0.0 /100 | #319 | Tragic 2.9% |
| Chickasaw | 0.0 /100 | #320 | Tragic 2.9% |