Immigrants from Sri Lanka vs Immigrants from Hong Kong Self-Care Disability
COMPARE
Immigrants from Sri Lanka
Immigrants from Hong Kong
Self-Care Disability
Self-Care Disability Comparison
Immigrants from Sri Lanka
Immigrants from Hong Kong
2.2%
SELF-CARE DISABILITY
99.9/ 100
METRIC RATING
26th/ 347
METRIC RANK
2.4%
SELF-CARE DISABILITY
93.1/ 100
METRIC RATING
115th/ 347
METRIC RANK
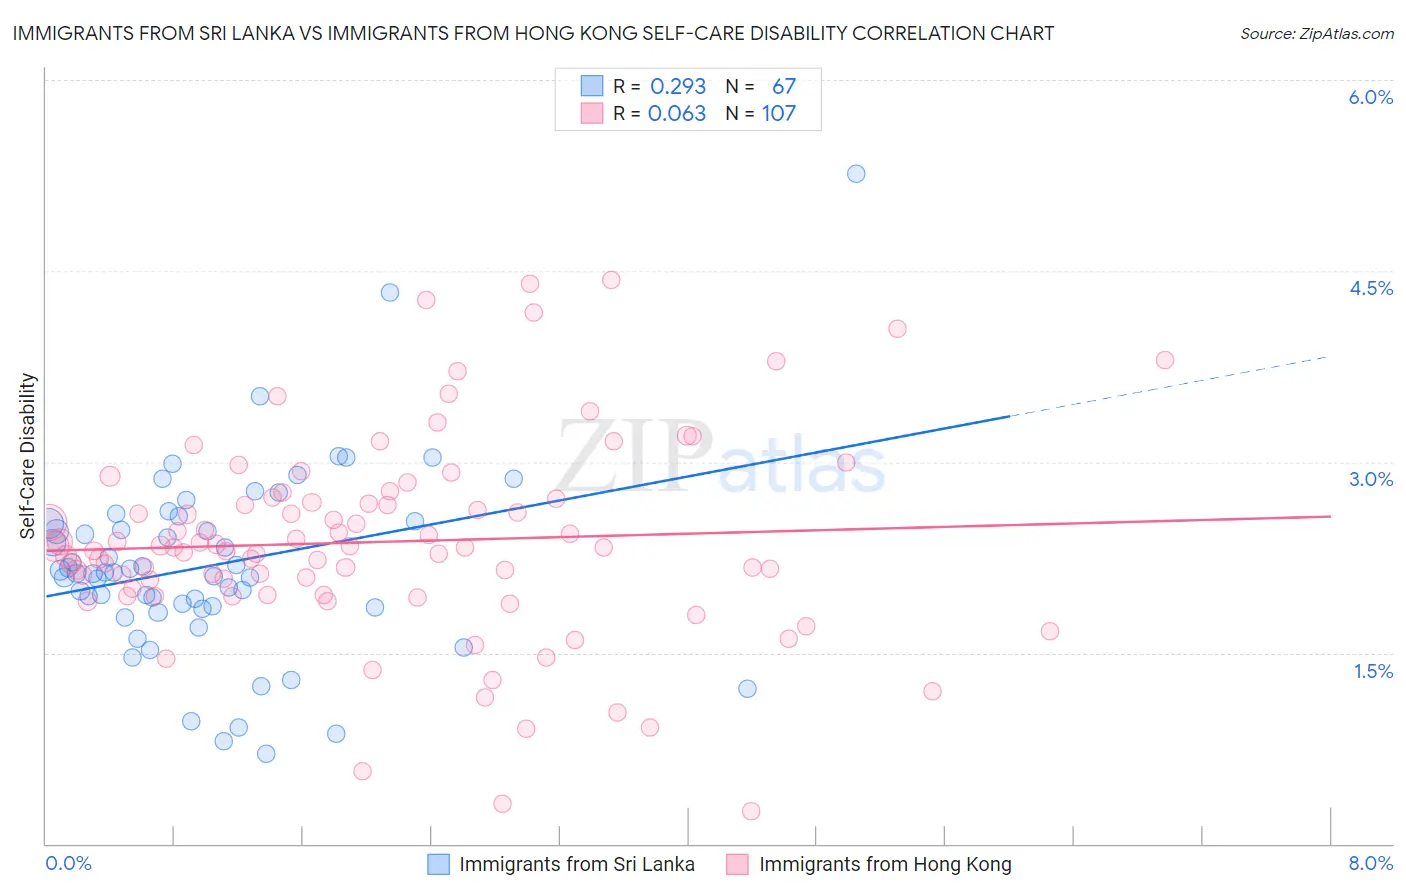
Immigrants from Sri Lanka vs Immigrants from Hong Kong Self-Care Disability Correlation Chart
The statistical analysis conducted on geographies consisting of 149,648,116 people shows a weak positive correlation between the proportion of Immigrants from Sri Lanka and percentage of population with self-care disability in the United States with a correlation coefficient (R) of 0.293 and weighted average of 2.2%. Similarly, the statistical analysis conducted on geographies consisting of 253,791,593 people shows a slight positive correlation between the proportion of Immigrants from Hong Kong and percentage of population with self-care disability in the United States with a correlation coefficient (R) of 0.063 and weighted average of 2.4%, a difference of 6.5%.
Self-Care Disability Correlation Summary
| Measurement | Immigrants from Sri Lanka | Immigrants from Hong Kong |
| Minimum | 0.71% | 0.25% |
| Maximum | 5.3% | 4.4% |
| Range | 4.6% | 4.2% |
| Mean | 2.2% | 2.4% |
| Median | 2.1% | 2.3% |
| Interquartile 25% (IQ1) | 1.9% | 2.0% |
| Interquartile 75% (IQ3) | 2.5% | 2.7% |
| Interquartile Range (IQR) | 0.68% | 0.75% |
| Standard Deviation (Sample) | 0.75% | 0.79% |
| Standard Deviation (Population) | 0.74% | 0.78% |
Similar Demographics by Self-Care Disability
Demographics Similar to Immigrants from Sri Lanka by Self-Care Disability
In terms of self-care disability, the demographic groups most similar to Immigrants from Sri Lanka are Venezuelan (2.2%, a difference of 0.010%), Turkish (2.2%, a difference of 0.070%), Inupiat (2.2%, a difference of 0.17%), Cypriot (2.2%, a difference of 0.18%), and Immigrants from Zimbabwe (2.3%, a difference of 0.26%).
| Demographics | Rating | Rank | Self-Care Disability |
| Immigrants | Eritrea | 100.0 /100 | #19 | Exceptional 2.2% |
| Tongans | 100.0 /100 | #20 | Exceptional 2.2% |
| Bulgarians | 100.0 /100 | #21 | Exceptional 2.2% |
| Immigrants | Venezuela | 100.0 /100 | #22 | Exceptional 2.2% |
| Cambodians | 100.0 /100 | #23 | Exceptional 2.2% |
| Cypriots | 100.0 /100 | #24 | Exceptional 2.2% |
| Turks | 100.0 /100 | #25 | Exceptional 2.2% |
| Immigrants | Sri Lanka | 99.9 /100 | #26 | Exceptional 2.2% |
| Venezuelans | 99.9 /100 | #27 | Exceptional 2.2% |
| Inupiat | 99.9 /100 | #28 | Exceptional 2.2% |
| Immigrants | Zimbabwe | 99.9 /100 | #29 | Exceptional 2.3% |
| Paraguayans | 99.9 /100 | #30 | Exceptional 2.3% |
| Danes | 99.9 /100 | #31 | Exceptional 2.3% |
| Burmese | 99.9 /100 | #32 | Exceptional 2.3% |
| Immigrants | Korea | 99.9 /100 | #33 | Exceptional 2.3% |
Demographics Similar to Immigrants from Hong Kong by Self-Care Disability
In terms of self-care disability, the demographic groups most similar to Immigrants from Hong Kong are Immigrants from North Macedonia (2.4%, a difference of 0.0%), South American (2.4%, a difference of 0.010%), Northern European (2.4%, a difference of 0.050%), Scandinavian (2.4%, a difference of 0.070%), and Serbian (2.4%, a difference of 0.090%).
| Demographics | Rating | Rank | Self-Care Disability |
| Greeks | 94.1 /100 | #108 | Exceptional 2.4% |
| Slovenes | 94.1 /100 | #109 | Exceptional 2.4% |
| Immigrants | Africa | 93.7 /100 | #110 | Exceptional 2.4% |
| Serbians | 93.6 /100 | #111 | Exceptional 2.4% |
| Scandinavians | 93.5 /100 | #112 | Exceptional 2.4% |
| South Americans | 93.2 /100 | #113 | Exceptional 2.4% |
| Immigrants | North Macedonia | 93.1 /100 | #114 | Exceptional 2.4% |
| Immigrants | Hong Kong | 93.1 /100 | #115 | Exceptional 2.4% |
| Northern Europeans | 92.9 /100 | #116 | Exceptional 2.4% |
| Taiwanese | 92.5 /100 | #117 | Exceptional 2.4% |
| Immigrants | Canada | 92.0 /100 | #118 | Exceptional 2.4% |
| Immigrants | Sierra Leone | 91.8 /100 | #119 | Exceptional 2.4% |
| Uruguayans | 91.5 /100 | #120 | Exceptional 2.4% |
| Peruvians | 91.3 /100 | #121 | Exceptional 2.4% |
| Belgians | 90.9 /100 | #122 | Exceptional 2.4% |