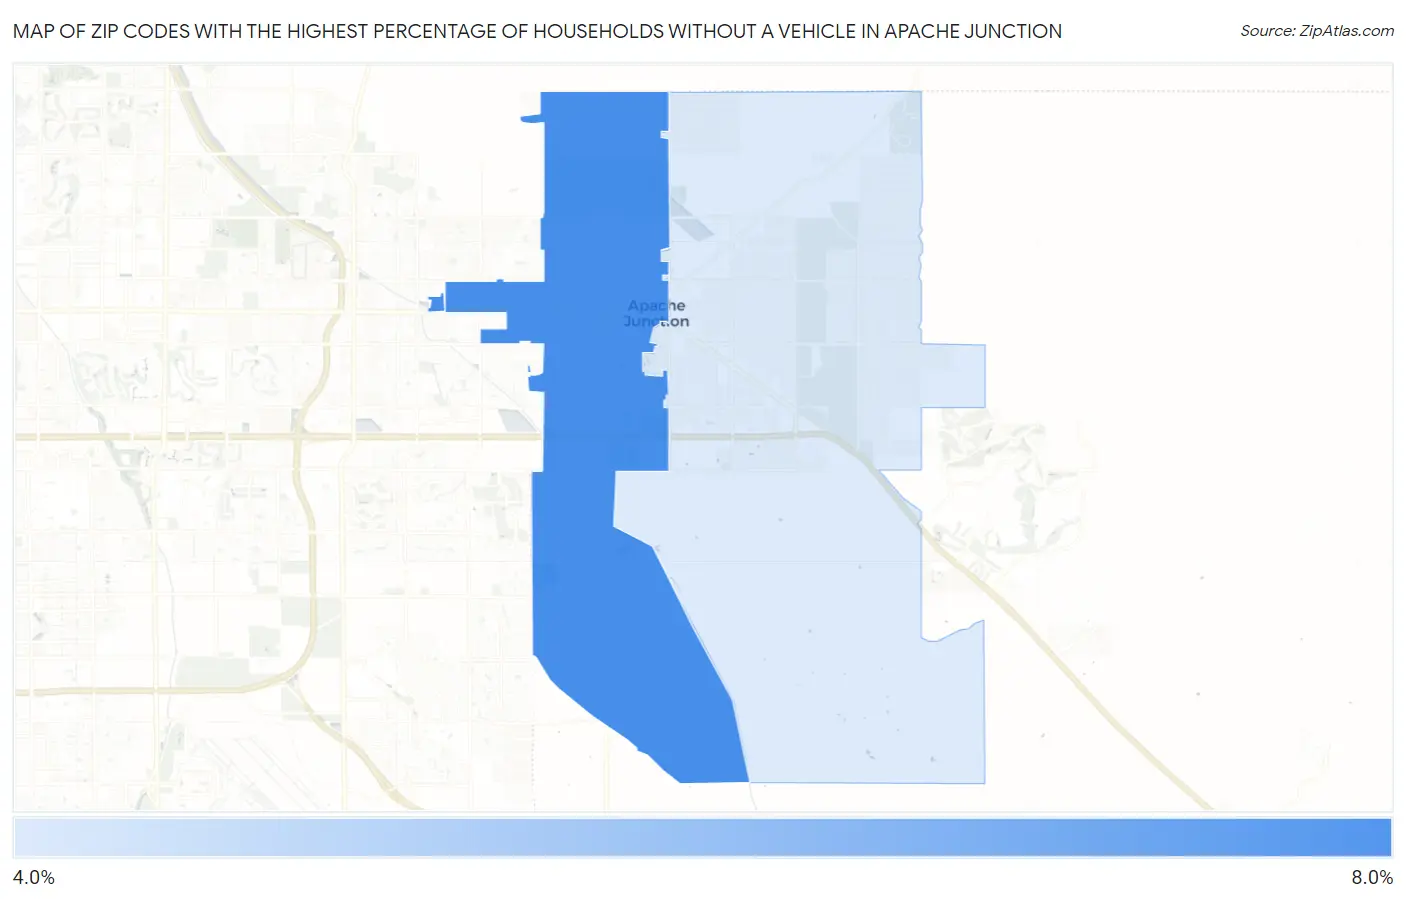
Zip Codes with the Highest Percentage of Households Without a Vehicle in Apache Junction, AZ
RELATED REPORTS & OPTIONS
Households without a Cars
Apache Junction
Compare Zip Codes
Map of Zip Codes with the Highest Percentage of Households Without a Vehicle in Apache Junction
4.4%
6.2%
Zip Codes with the Highest Percentage of Households Without a Vehicle in Apache Junction, AZ
| Zip Code | Housholds Without a Car | vs State | vs National | |
| 1. | 85120 | 6.2% | 5.5%(+0.700)#137 | 8.3%(-2.10)#9,999 |
| 2. | 85119 | 4.4% | 5.5%(-1.10)#197 | 8.3%(-3.90)#14,511 |
1
Common Questions
What are the Top Zip Codes with the Highest Percentage of Households Without a Vehicle in Apache Junction, AZ?
Top Zip Codes with the Highest Percentage of Households Without a Vehicle in Apache Junction, AZ are:
What zip code has the Highest Percentage of Households Without a Vehicle in Apache Junction, AZ?
85120 has the Highest Percentage of Households Without a Vehicle in Apache Junction, AZ with 6.2%.
What is the Percentage of Households Without a Vehicle in Apache Junction, AZ?
Percentage of Households Without a Vehicle in Apache Junction is 6.4%.
What is the Percentage of Households Without a Vehicle in Arizona?
Percentage of Households Without a Vehicle in Arizona is 5.5%.
What is the Percentage of Households Without a Vehicle in the United States?
Percentage of Households Without a Vehicle in the United States is 8.3%.