Zip Codes with the Highest Percentage of Households Without a Vehicle in Green Valley, AZ
RELATED REPORTS & OPTIONS
Households without a Cars
Green Valley
Compare Zip Codes
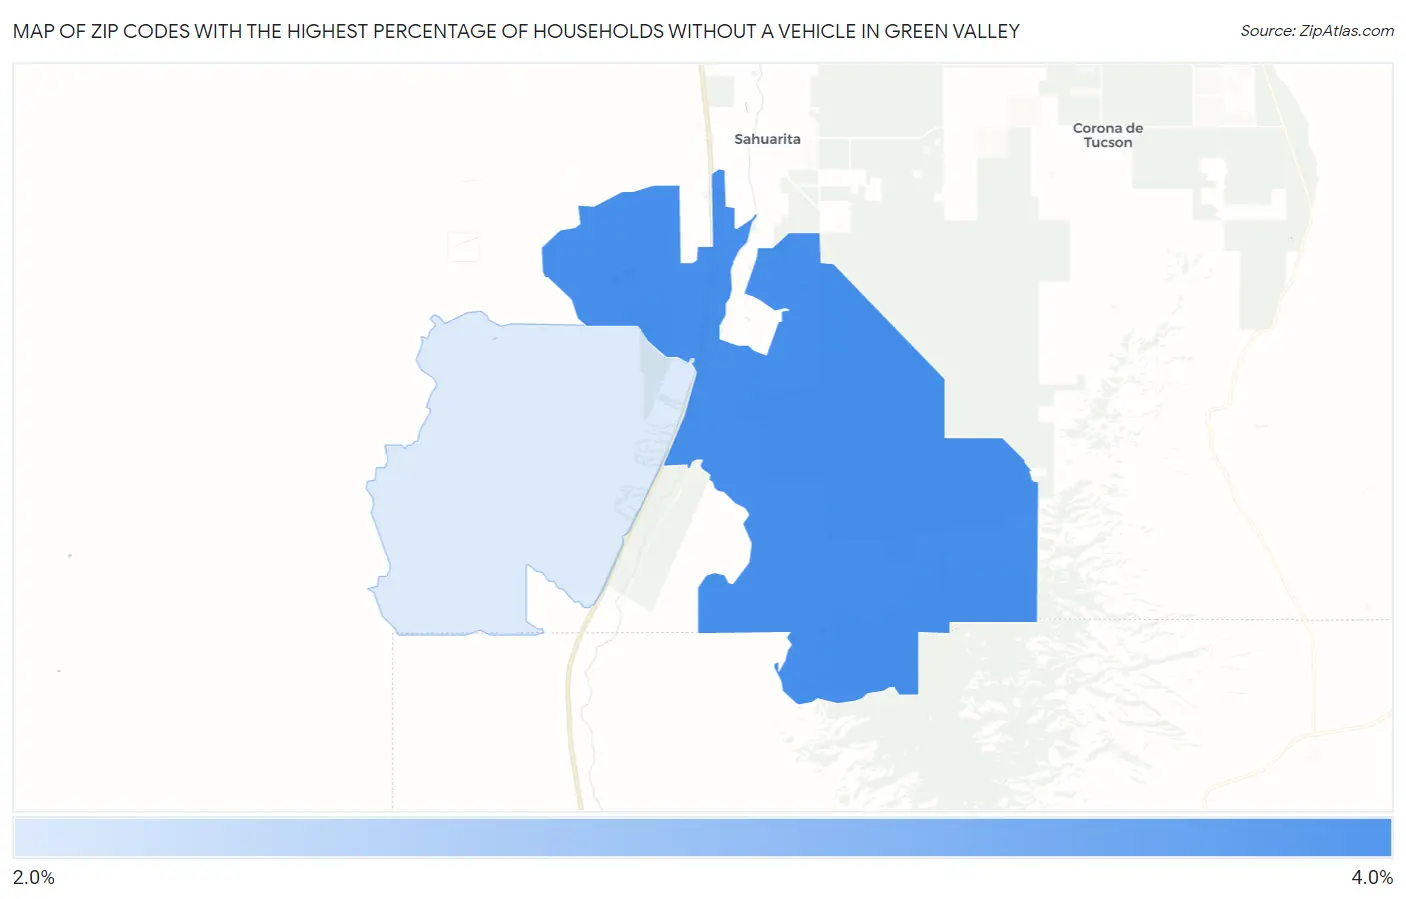
Map of Zip Codes with the Highest Percentage of Households Without a Vehicle in Green Valley
2.8%
3.8%
Zip Codes with the Highest Percentage of Households Without a Vehicle in Green Valley, AZ
| Zip Code | Housholds Without a Car | vs State | vs National | |
| 1. | 85614 | 3.8% | 5.5%(-1.70)#217 | 8.3%(-4.50)#16,368 |
| 2. | 85622 | 2.8% | 5.5%(-2.70)#258 | 8.3%(-5.50)#19,857 |
1
Common Questions
What are the Top Zip Codes with the Highest Percentage of Households Without a Vehicle in Green Valley, AZ?
Top Zip Codes with the Highest Percentage of Households Without a Vehicle in Green Valley, AZ are:
What zip code has the Highest Percentage of Households Without a Vehicle in Green Valley, AZ?
85614 has the Highest Percentage of Households Without a Vehicle in Green Valley, AZ with 3.8%.
What is the Percentage of Households Without a Vehicle in Green Valley, AZ?
Percentage of Households Without a Vehicle in Green Valley is 3.8%.
What is the Percentage of Households Without a Vehicle in Arizona?
Percentage of Households Without a Vehicle in Arizona is 5.5%.
What is the Percentage of Households Without a Vehicle in the United States?
Percentage of Households Without a Vehicle in the United States is 8.3%.