Zip Codes with the Highest Percentage of Population Employed in Sales & Related in Hot Springs National Park, AR
RELATED REPORTS & OPTIONS
Sales & Related
Hot Springs National Park
Compare Zip Codes
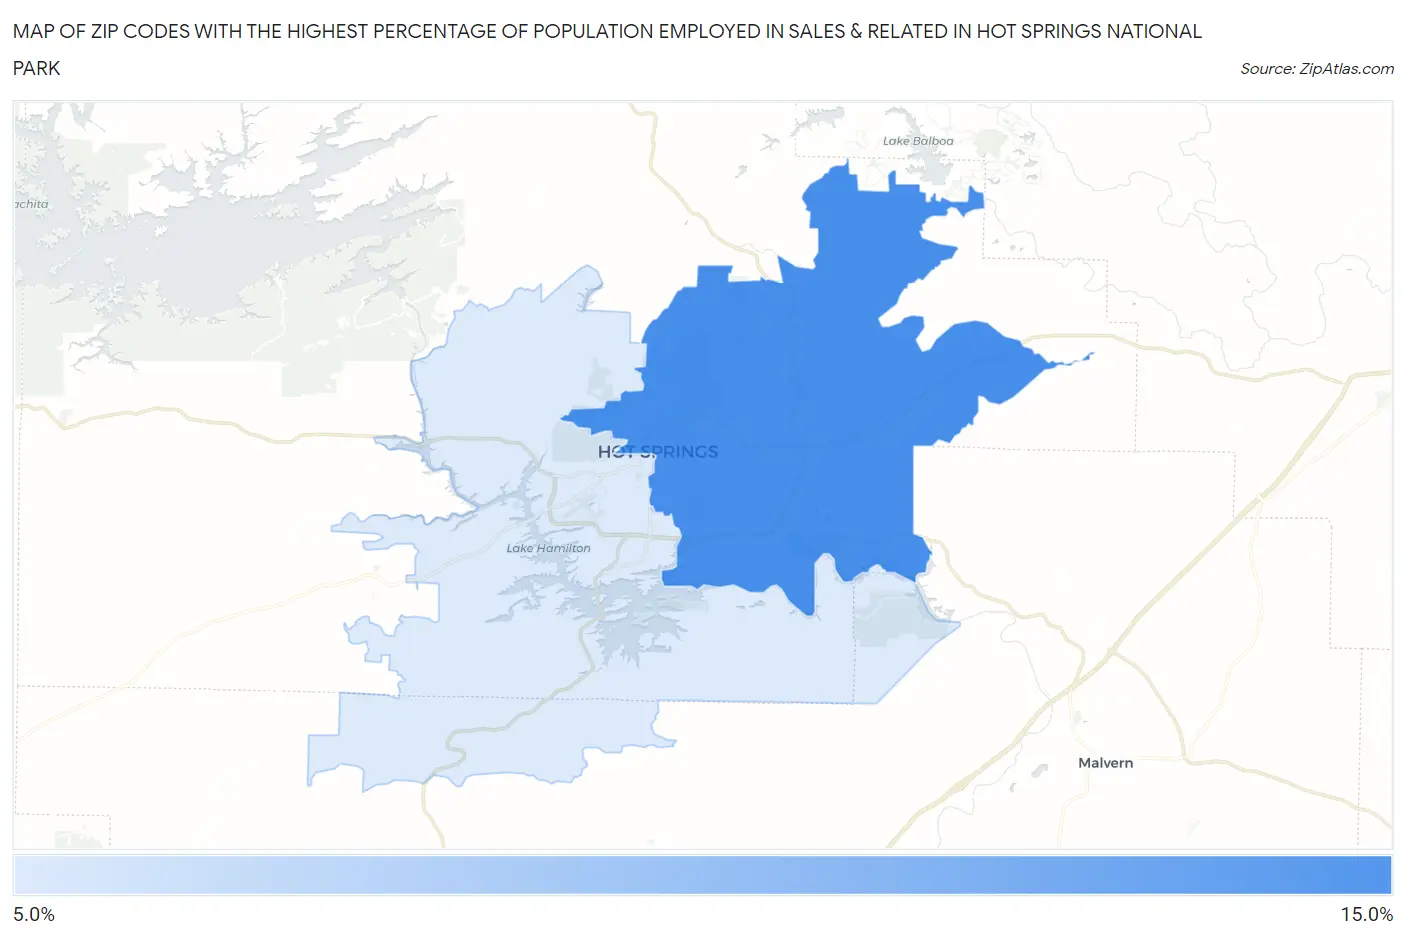
Map of Zip Codes with the Highest Percentage of Population Employed in Sales & Related in Hot Springs National Park
12.0%
12.1%
Zip Codes with the Highest Percentage of Population Employed in Sales & Related in Hot Springs National Park, AR
| Zip Code | % Employed | vs State | vs National | |
| 1. | 71901 | 12.1% | 9.8%(+2.25)#124 | 9.6%(+2.47)#5,929 |
| 2. | 71913 | 12.0% | 9.8%(+2.18)#126 | 9.6%(+2.41)#6,032 |
1
Common Questions
What are the Top Zip Codes with the Highest Percentage of Population Employed in Sales & Related in Hot Springs National Park, AR?
Top Zip Codes with the Highest Percentage of Population Employed in Sales & Related in Hot Springs National Park, AR are:
What zip code has the Highest Percentage of Population Employed in Sales & Related in Hot Springs National Park, AR?
71901 has the Highest Percentage of Population Employed in Sales & Related in Hot Springs National Park, AR with 12.1%.
What is the Percentage of Population Employed in Sales & Related in Arkansas?
Percentage of Population Employed in Sales & Related in Arkansas is 9.8%.
What is the Percentage of Population Employed in Sales & Related in the United States?
Percentage of Population Employed in Sales & Related in the United States is 9.6%.