Zip Codes with the Most Immigrants from South Eastern Asia in Anniston, AL
RELATED REPORTS & OPTIONS
South Eastern Asia
Anniston
Compare Zip Codes
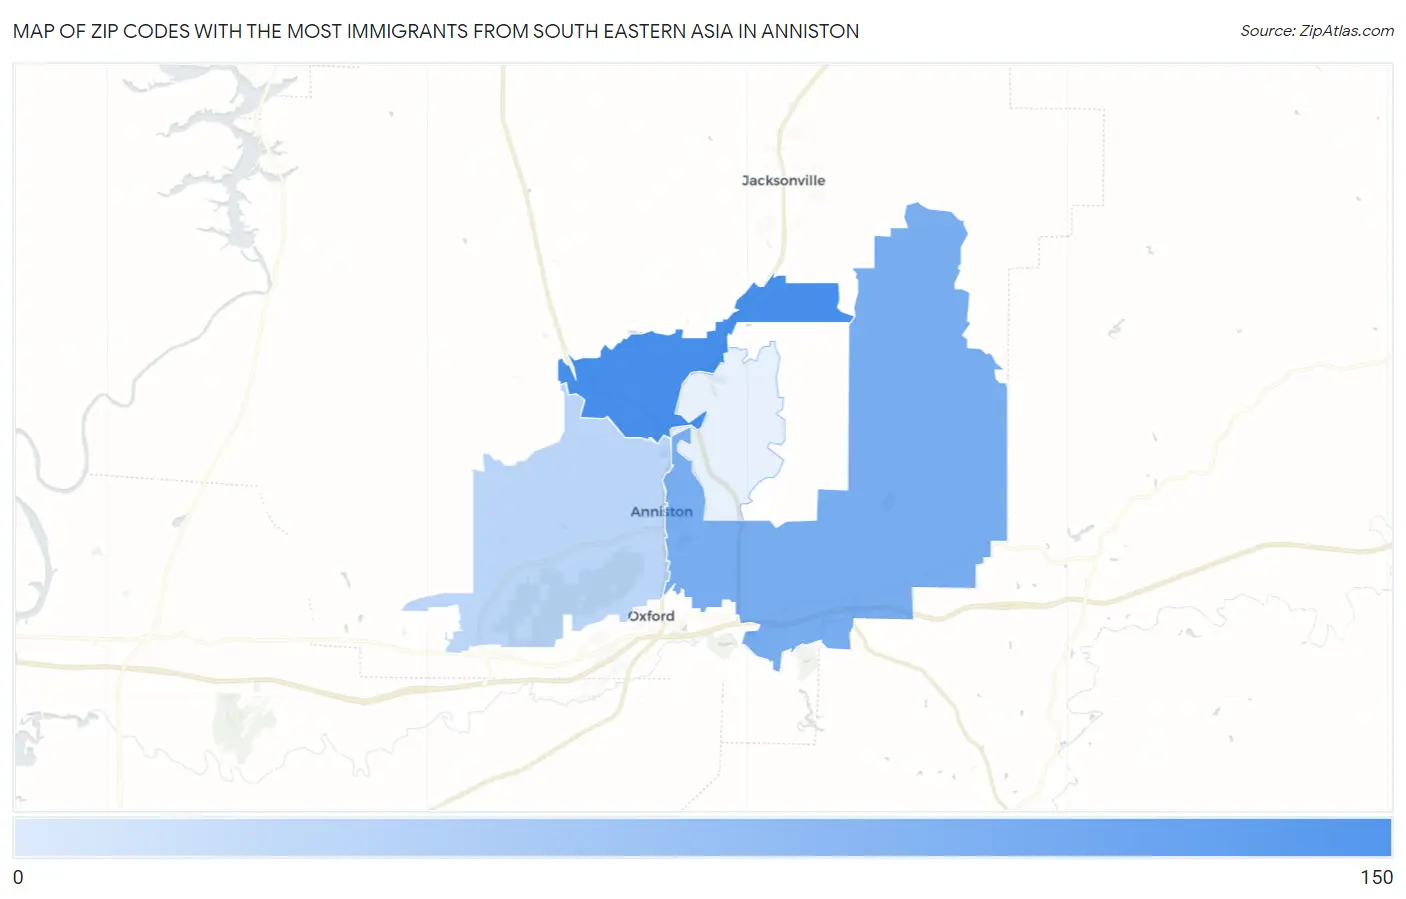
Map of Zip Codes with the Most Immigrants from South Eastern Asia in Anniston
2
110
Zip Codes with the Most Immigrants from South Eastern Asia in Anniston, AL
| Zip Code | South Eastern Asia | vs State | vs National | |
| 1. | 36206 | 110 | 15,007(0.73%)#38 | 4,292,058(0.00%)#5,659 |
| 2. | 36207 | 24 | 15,007(0.16%)#121 | 4,292,058(0.00%)#9,785 |
| 3. | 36201 | 2 | 15,007(0.01%)#211 | 4,292,058(0.00%)#14,254 |
1
Common Questions
What are the Top 3 Zip Codes with the Most Immigrants from South Eastern Asia in Anniston, AL?
Top 3 Zip Codes with the Most Immigrants from South Eastern Asia in Anniston, AL are:
What zip code has the Most Immigrants from South Eastern Asia in Anniston, AL?
36206 has the Most Immigrants from South Eastern Asia in Anniston, AL with 110.
What is the Total Immigrants from South Eastern Asia in Anniston, AL?
Total Immigrants from South Eastern Asia in Anniston is 15.
What is the Total Immigrants from South Eastern Asia in Alabama?
Total Immigrants from South Eastern Asia in Alabama is 15,007.
What is the Total Immigrants from South Eastern Asia in the United States?
Total Immigrants from South Eastern Asia in the United States is 4,292,058.