Zip Codes with the Highest Percentage of Immigrants from Eastern Asia in Anniston, AL
RELATED REPORTS & OPTIONS
Eastern Asia
Anniston
Compare Zip Codes
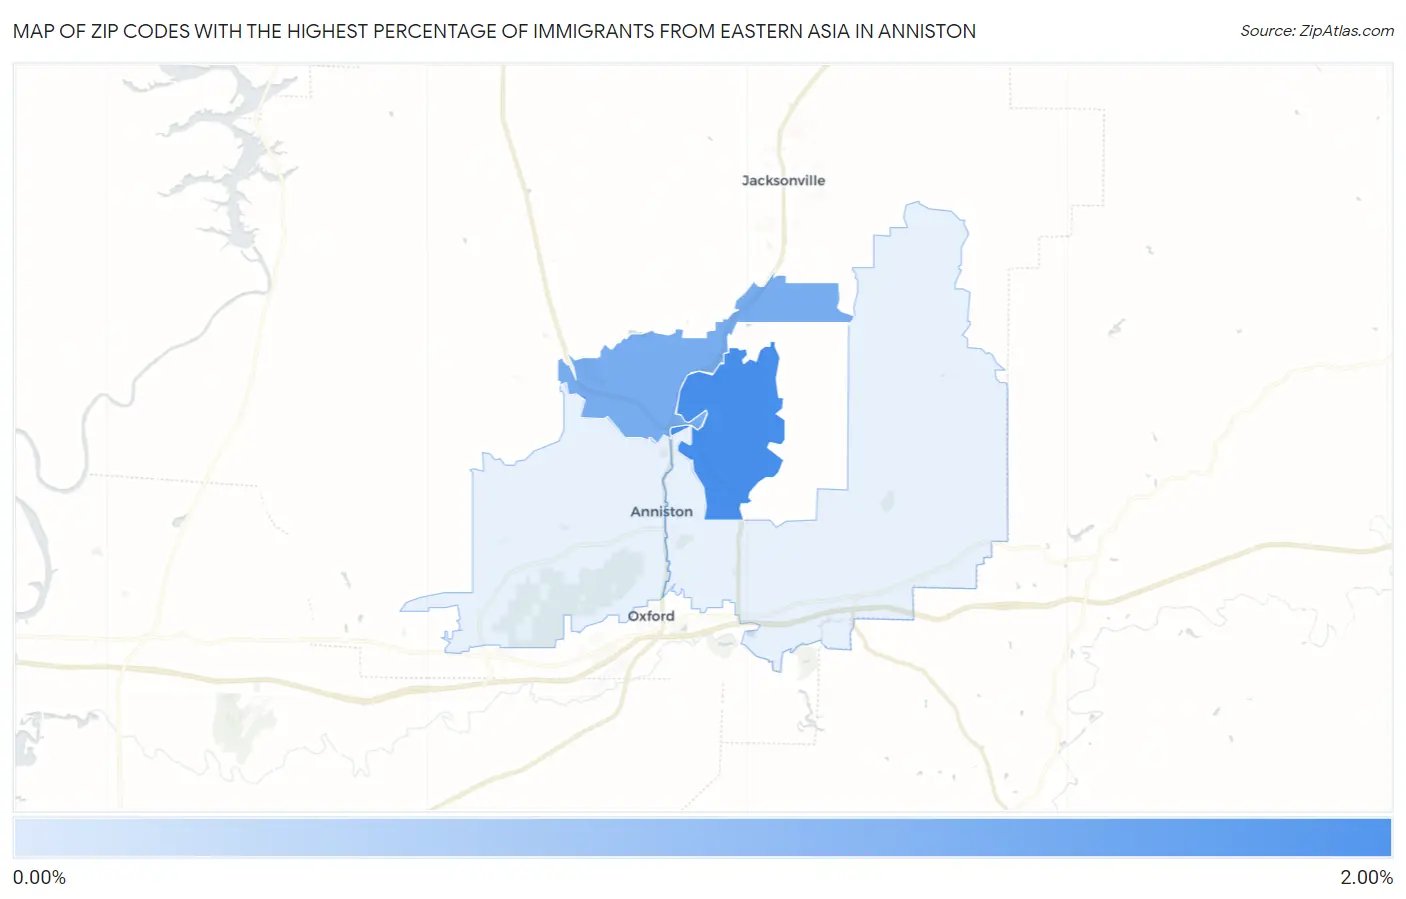
Map of Zip Codes with the Highest Percentage of Immigrants from Eastern Asia in Anniston
1.16%
1.71%
Zip Codes with the Highest Percentage of Immigrants from Eastern Asia in Anniston, AL
| Zip Code | Eastern Asia | vs State | vs National | |
| 1. | 36205 | 1.71% | 0.42%(+1.29)#14 | 1.28%(+0.439)#2,338 |
| 2. | 36206 | 1.16% | 0.42%(+0.732)#23 | 1.28%(-0.120)#3,411 |
1
Common Questions
What are the Top 3 Zip Codes with the Highest Percentage of Immigrants from Eastern Asia in Anniston, AL?
Top 3 Zip Codes with the Highest Percentage of Immigrants from Eastern Asia in Anniston, AL are:
What zip code has the Highest Percentage of Immigrants from Eastern Asia in Anniston, AL?
36205 has the Highest Percentage of Immigrants from Eastern Asia in Anniston, AL with 1.71%.
What is the Percentage of Immigrants from Eastern Asia in Anniston, AL?
Percentage of Immigrants from Eastern Asia in Anniston is 0.088%.
What is the Percentage of Immigrants from Eastern Asia in Alabama?
Percentage of Immigrants from Eastern Asia in Alabama is 0.42%.
What is the Percentage of Immigrants from Eastern Asia in the United States?
Percentage of Immigrants from Eastern Asia in the United States is 1.28%.