Waitsburg, WA Map & Demographics
Waitsburg Map
Waitsburg Overview
$34,054
PER CAPITA INCOME
$60,521
AVG FAMILY INCOME
$64,050
AVG HOUSEHOLD INCOME
50.9%
WAGE / INCOME GAP [ % ]
49.1¢/ $1
WAGE / INCOME GAP [ $ ]
0.41
INEQUALITY / GINI INDEX
956
TOTAL POPULATION
488
MALE POPULATION
468
FEMALE POPULATION
104.27
MALES / 100 FEMALES
95.90
FEMALES / 100 MALES
44.4
MEDIAN AGE
2.8
AVG FAMILY SIZE
2.4
AVG HOUSEHOLD SIZE
415
LABOR FORCE [ PEOPLE ]
53.5%
PERCENT IN LABOR FORCE
6.4%
UNEMPLOYMENT RATE
Waitsburg Zip Codes
Waitsburg Area Codes
Income in Waitsburg
Income Overview in Waitsburg
Per Capita Income in Waitsburg is $34,054, while median incomes of families and households are $60,521 and $64,050 respectively.
| Characteristic | Number | Measure |
| Per Capita Income | 956 | $34,054 |
| Median Family Income | 267 | $60,521 |
| Mean Family Income | 267 | $84,461 |
| Median Household Income | 397 | $64,050 |
| Mean Household Income | 397 | $78,489 |
| Income Deficit | 267 | $0 |
| Wage / Income Gap (%) | 956 | 50.87% |
| Wage / Income Gap ($) | 956 | 49.13¢ per $1 |
| Gini / Inequality Index | 956 | 0.41 |
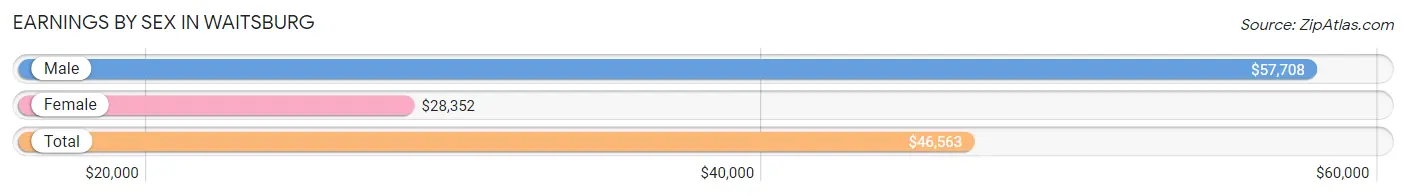
Earnings by Sex in Waitsburg
Average Earnings in Waitsburg are $46,563, $57,708 for men and $28,352 for women, a difference of 50.9%.
| Sex | Number | Average Earnings |
| Male | 265 (56.1%) | $57,708 |
| Female | 207 (43.9%) | $28,352 |
| Total | 472 (100.0%) | $46,563 |
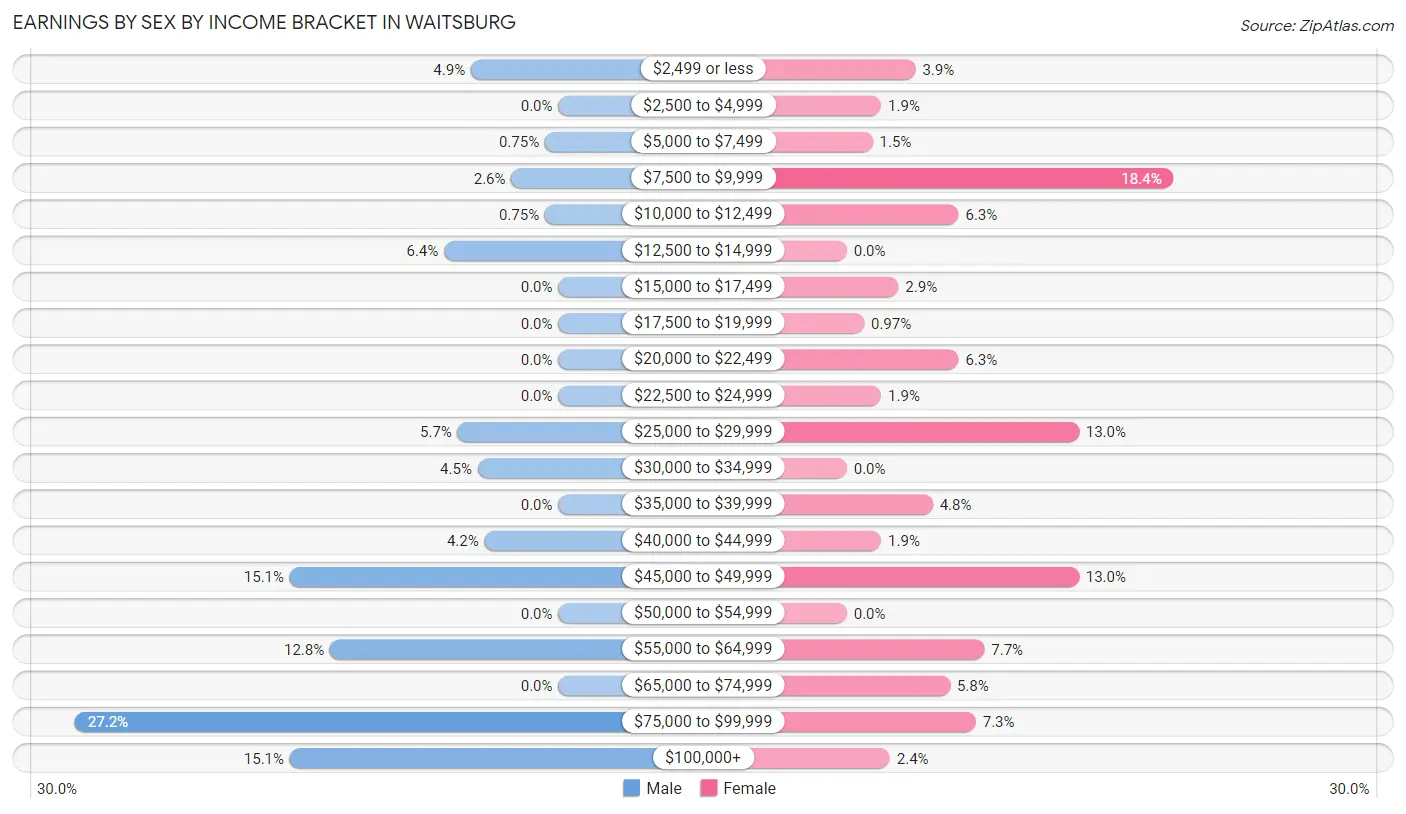
Earnings by Sex by Income Bracket in Waitsburg
The most common earnings brackets in Waitsburg are $75,000 to $99,999 for men (72 | 27.2%) and $7,500 to $9,999 for women (38 | 18.4%).
| Income | Male | Female |
| $2,499 or less | 13 (4.9%) | 8 (3.9%) |
| $2,500 to $4,999 | 0 (0.0%) | 4 (1.9%) |
| $5,000 to $7,499 | 2 (0.7%) | 3 (1.5%) |
| $7,500 to $9,999 | 7 (2.6%) | 38 (18.4%) |
| $10,000 to $12,499 | 2 (0.7%) | 13 (6.3%) |
| $12,500 to $14,999 | 17 (6.4%) | 0 (0.0%) |
| $15,000 to $17,499 | 0 (0.0%) | 6 (2.9%) |
| $17,500 to $19,999 | 0 (0.0%) | 2 (1.0%) |
| $20,000 to $22,499 | 0 (0.0%) | 13 (6.3%) |
| $22,500 to $24,999 | 0 (0.0%) | 4 (1.9%) |
| $25,000 to $29,999 | 15 (5.7%) | 27 (13.0%) |
| $30,000 to $34,999 | 12 (4.5%) | 0 (0.0%) |
| $35,000 to $39,999 | 0 (0.0%) | 10 (4.8%) |
| $40,000 to $44,999 | 11 (4.2%) | 4 (1.9%) |
| $45,000 to $49,999 | 40 (15.1%) | 27 (13.0%) |
| $50,000 to $54,999 | 0 (0.0%) | 0 (0.0%) |
| $55,000 to $64,999 | 34 (12.8%) | 16 (7.7%) |
| $65,000 to $74,999 | 0 (0.0%) | 12 (5.8%) |
| $75,000 to $99,999 | 72 (27.2%) | 15 (7.2%) |
| $100,000+ | 40 (15.1%) | 5 (2.4%) |
| Total | 265 (100.0%) | 207 (100.0%) |
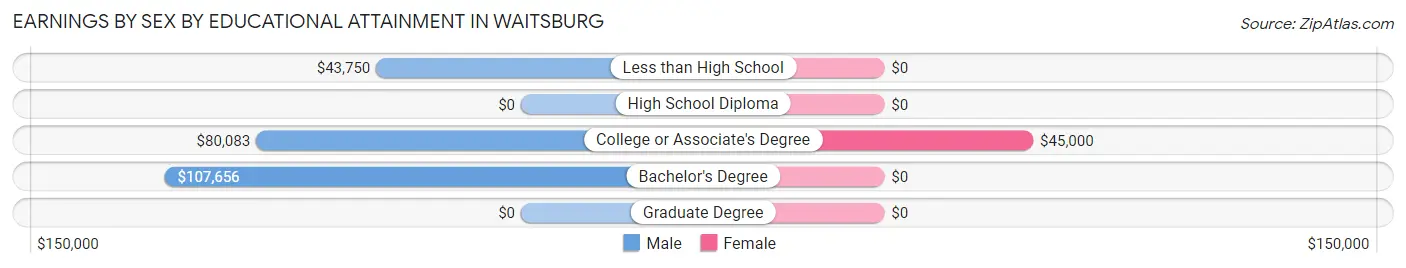
Earnings by Sex by Educational Attainment in Waitsburg
Average earnings in Waitsburg are $79,167 for men and $29,659 for women, a difference of 62.5%. Men with an educational attainment of bachelor's degree enjoy the highest average annual earnings of $107,656, while those with less than high school education earn the least with $43,750. Women with an educational attainment of college or associate's degree earn the most with the average annual earnings of $45,000, while those with college or associate's degree education have the smallest earnings of $45,000.
| Educational Attainment | Male Income | Female Income |
| Less than High School | $43,750 | $0 |
| High School Diploma | - | - |
| College or Associate's Degree | $80,083 | $45,000 |
| Bachelor's Degree | $107,656 | $0 |
| Graduate Degree | - | - |
| Total | $79,167 | $29,659 |
Family Income in Waitsburg
Family Income Brackets in Waitsburg
According to the Waitsburg family income data, there are 51 families falling into the $50,000 to $74,999 income range, which is the most common income bracket and makes up 19.1% of all families. Conversely, the $10,000 to $14,999 income bracket is the least frequent group with only 4 families (1.5%) belonging to this category.
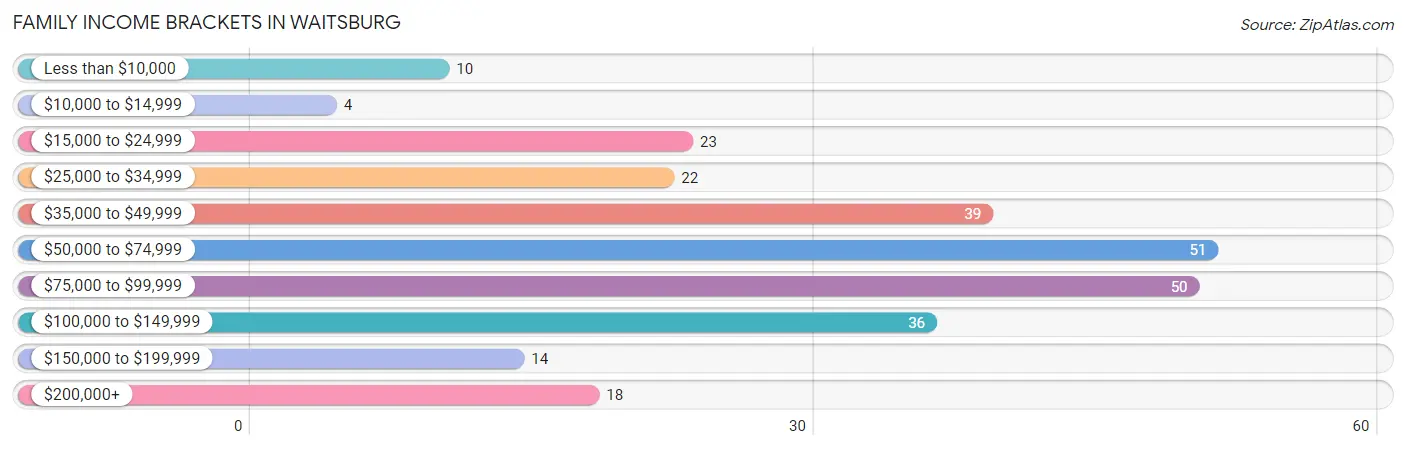
| Income Bracket | # Families | % Families |
| Less than $10,000 | 10 | 3.7% |
| $10,000 to $14,999 | 4 | 1.5% |
| $15,000 to $24,999 | 23 | 8.6% |
| $25,000 to $34,999 | 22 | 8.2% |
| $35,000 to $49,999 | 39 | 14.6% |
| $50,000 to $74,999 | 51 | 19.1% |
| $75,000 to $99,999 | 50 | 18.7% |
| $100,000 to $149,999 | 36 | 13.5% |
| $150,000 to $199,999 | 14 | 5.2% |
| $200,000+ | 18 | 6.7% |
Family Income by Famaliy Size in Waitsburg
4-person families (20 | 7.5%) account for the highest median family income in Waitsburg with $136,667 per family, while 4-person families (20 | 7.5%) have the highest median income of $34,167 per family member.
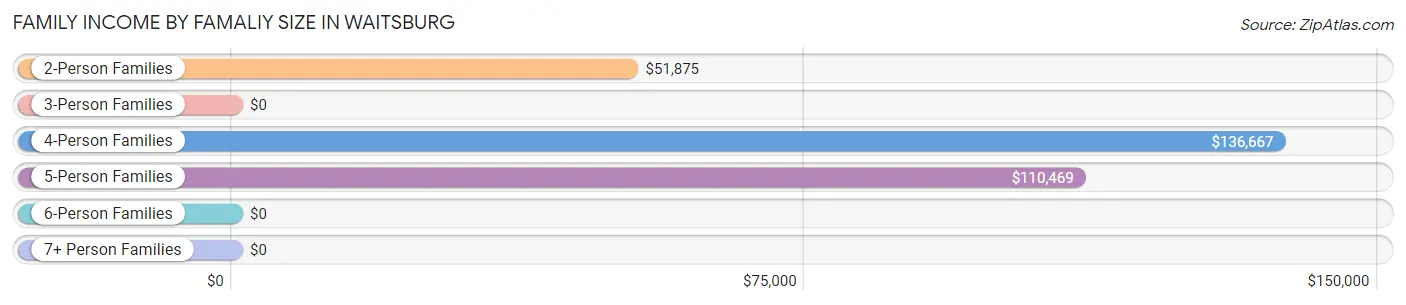
| Income Bracket | # Families | Median Income |
| 2-Person Families | 143 (53.6%) | $51,875 |
| 3-Person Families | 62 (23.2%) | $0 |
| 4-Person Families | 20 (7.5%) | $136,667 |
| 5-Person Families | 19 (7.1%) | $110,469 |
| 6-Person Families | 23 (8.6%) | $0 |
| 7+ Person Families | 0 (0.0%) | $0 |
| Total | 267 (100.0%) | $60,521 |
Family Income by Number of Earners in Waitsburg
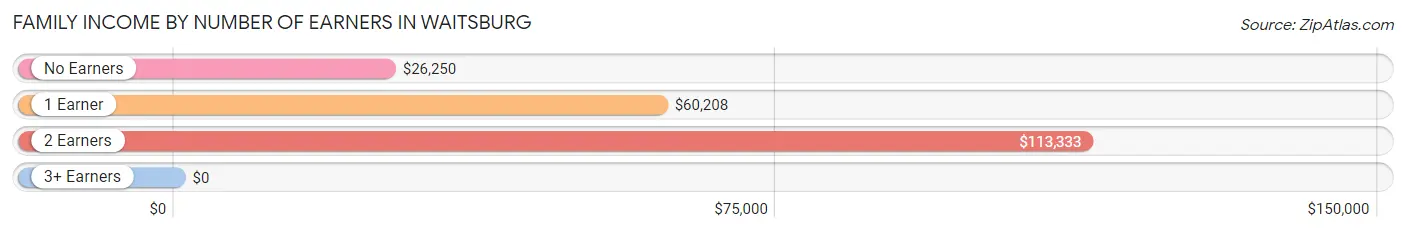
| Number of Earners | # Families | Median Income |
| No Earners | 59 (22.1%) | $26,250 |
| 1 Earner | 86 (32.2%) | $60,208 |
| 2 Earners | 94 (35.2%) | $113,333 |
| 3+ Earners | 28 (10.5%) | $0 |
| Total | 267 (100.0%) | $60,521 |
Household Income in Waitsburg
Household Income Brackets in Waitsburg
With 79 households falling in the category, the $50,000 to $74,999 income range is the most frequent in Waitsburg, accounting for 19.9% of all households. In contrast, only 13 households (3.3%) fall into the less than $10,000 income bracket, making it the least populous group.
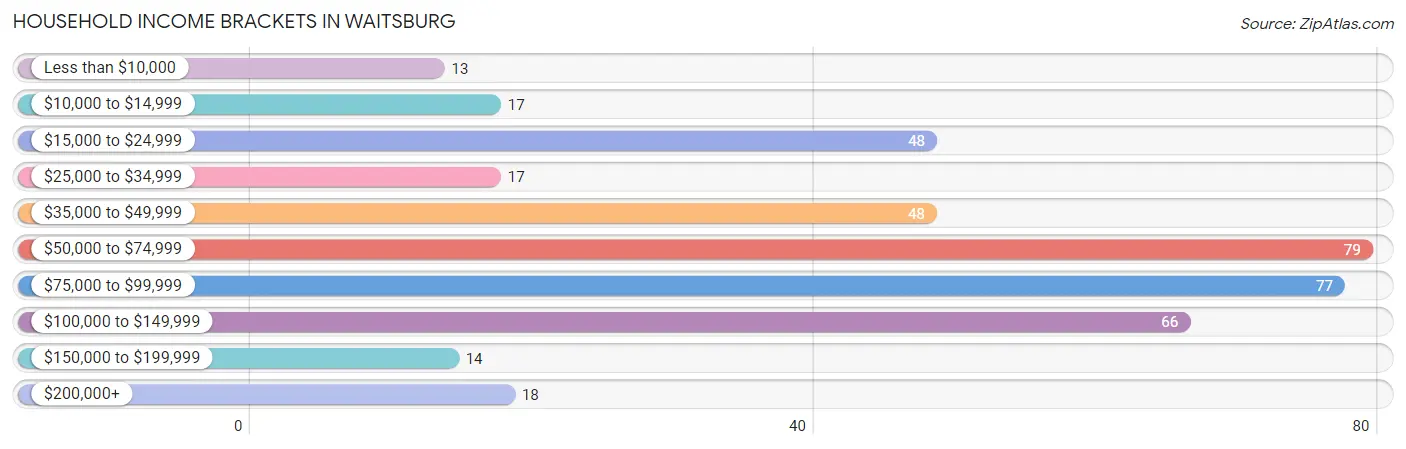
| Income Bracket | # Households | % Households |
| Less than $10,000 | 13 | 3.3% |
| $10,000 to $14,999 | 17 | 4.3% |
| $15,000 to $24,999 | 48 | 12.1% |
| $25,000 to $34,999 | 17 | 4.3% |
| $35,000 to $49,999 | 48 | 12.1% |
| $50,000 to $74,999 | 79 | 19.9% |
| $75,000 to $99,999 | 77 | 19.4% |
| $100,000 to $149,999 | 66 | 16.6% |
| $150,000 to $199,999 | 14 | 3.5% |
| $200,000+ | 18 | 4.5% |
Household Income by Householder Age in Waitsburg
The median household income in Waitsburg is $64,050, with the highest median household income of $83,750 found in the 25 to 44 years age bracket for the primary householder. A total of 104 households (26.2%) fall into this category. Meanwhile, the 15 to 24 years age bracket for the primary householder has the lowest median household income of $0, with 21 households (5.3%) in this group.
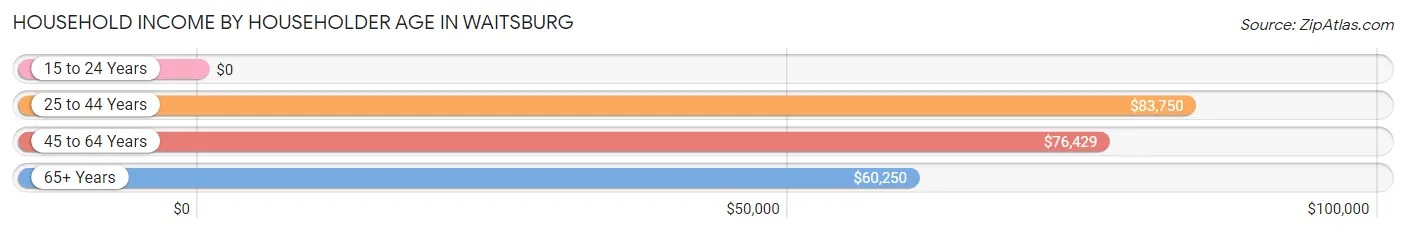
| Income Bracket | # Households | Median Income |
| 15 to 24 Years | 21 (5.3%) | $0 |
| 25 to 44 Years | 104 (26.2%) | $83,750 |
| 45 to 64 Years | 138 (34.8%) | $76,429 |
| 65+ Years | 134 (33.8%) | $60,250 |
| Total | 397 (100.0%) | $64,050 |
Poverty in Waitsburg
Income Below Poverty by Sex and Age in Waitsburg
With 9.2% poverty level for males and 13.0% for females among the residents of Waitsburg, 6 to 11 year old males and 45 to 54 year old females are the most vulnerable to poverty, with 18 males (27.7%) and 27 females (34.6%) in their respective age groups living below the poverty level.
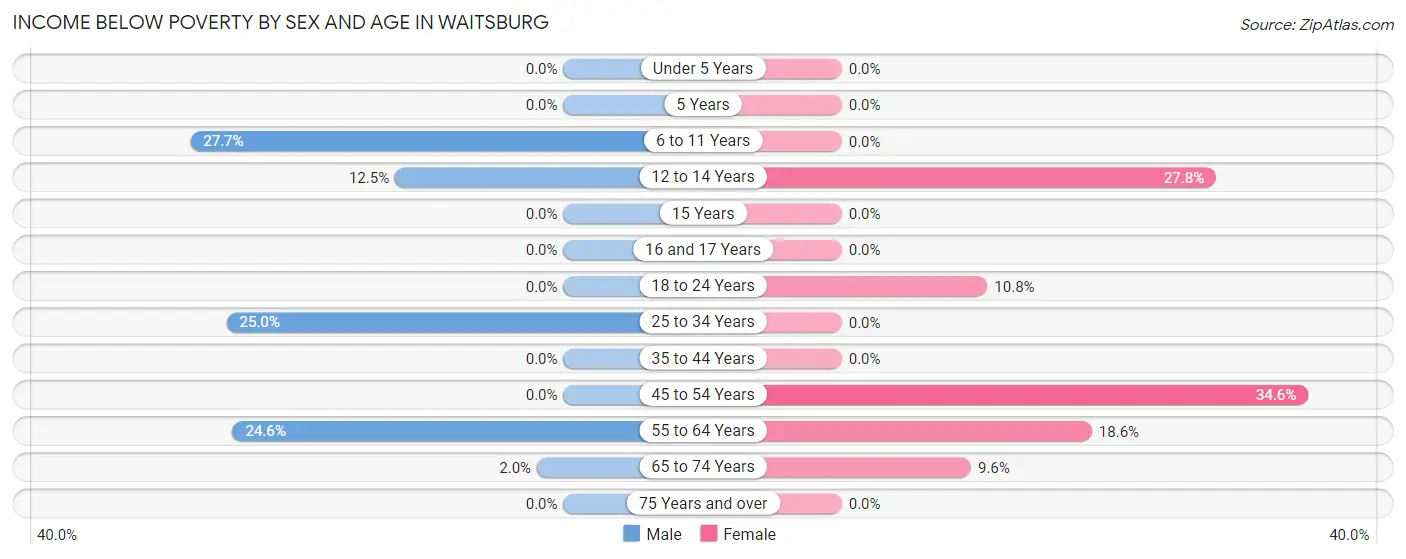
| Age Bracket | Male | Female |
| Under 5 Years | 0 (0.0%) | 0 (0.0%) |
| 5 Years | 0 (0.0%) | 0 (0.0%) |
| 6 to 11 Years | 18 (27.7%) | 0 (0.0%) |
| 12 to 14 Years | 4 (12.5%) | 10 (27.8%) |
| 15 Years | 0 (0.0%) | 0 (0.0%) |
| 16 and 17 Years | 0 (0.0%) | 0 (0.0%) |
| 18 to 24 Years | 0 (0.0%) | 4 (10.8%) |
| 25 to 34 Years | 8 (25.0%) | 0 (0.0%) |
| 35 to 44 Years | 0 (0.0%) | 0 (0.0%) |
| 45 to 54 Years | 0 (0.0%) | 27 (34.6%) |
| 55 to 64 Years | 14 (24.6%) | 13 (18.6%) |
| 65 to 74 Years | 1 (2.0%) | 7 (9.6%) |
| 75 Years and over | 0 (0.0%) | 0 (0.0%) |
| Total | 45 (9.2%) | 61 (13.0%) |
Income Above Poverty by Sex and Age in Waitsburg
According to the poverty statistics in Waitsburg, males aged under 5 years and females aged under 5 years are the age groups that are most secure financially, with 100.0% of males and 100.0% of females in these age groups living above the poverty line.
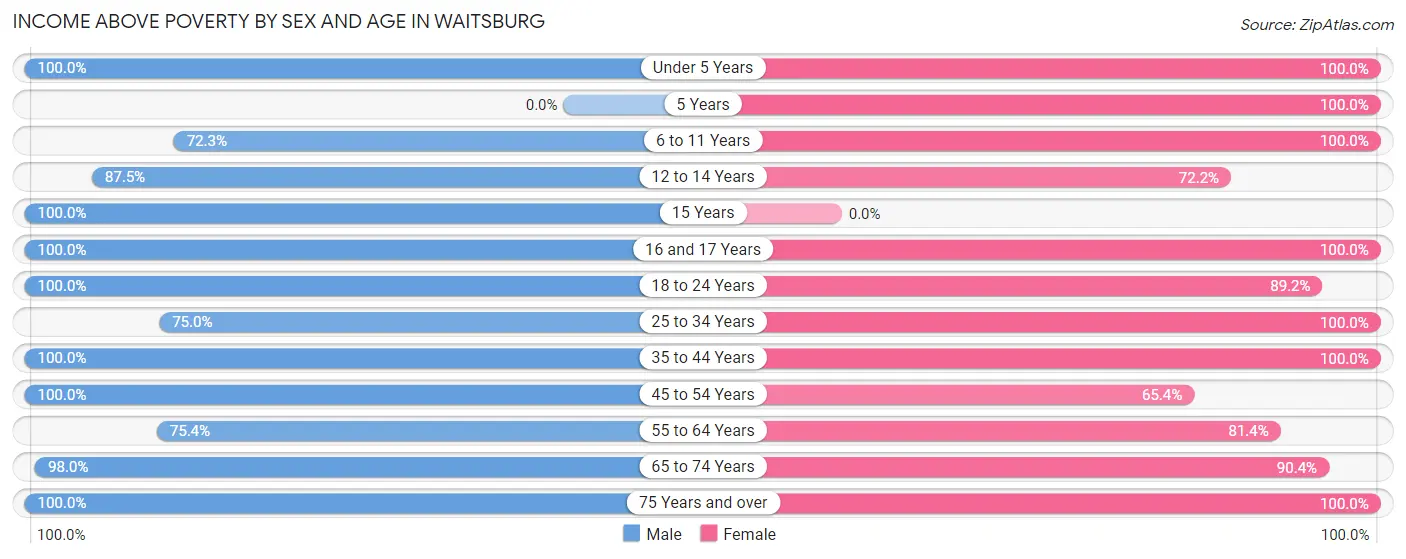
| Age Bracket | Male | Female |
| Under 5 Years | 8 (100.0%) | 15 (100.0%) |
| 5 Years | 0 (0.0%) | 12 (100.0%) |
| 6 to 11 Years | 47 (72.3%) | 12 (100.0%) |
| 12 to 14 Years | 28 (87.5%) | 26 (72.2%) |
| 15 Years | 1 (100.0%) | 0 (0.0%) |
| 16 and 17 Years | 13 (100.0%) | 8 (100.0%) |
| 18 to 24 Years | 55 (100.0%) | 33 (89.2%) |
| 25 to 34 Years | 24 (75.0%) | 58 (100.0%) |
| 35 to 44 Years | 87 (100.0%) | 29 (100.0%) |
| 45 to 54 Years | 55 (100.0%) | 51 (65.4%) |
| 55 to 64 Years | 43 (75.4%) | 57 (81.4%) |
| 65 to 74 Years | 50 (98.0%) | 66 (90.4%) |
| 75 Years and over | 32 (100.0%) | 40 (100.0%) |
| Total | 443 (90.8%) | 407 (87.0%) |
Income Below Poverty Among Married-Couple Families in Waitsburg
The poverty statistics for married-couple families in Waitsburg show that 1.0% or 2 of the total 196 families live below the poverty line. Families with no children have the highest poverty rate of 2.0%, comprising of 2 families. On the other hand, families with 1 or 2 children have the lowest poverty rate of 0.0%, which includes 0 families.
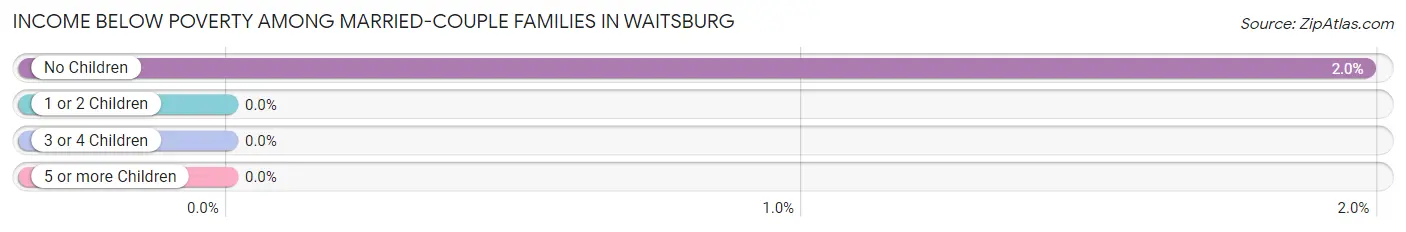
| Children | Above Poverty | Below Poverty |
| No Children | 99 (98.0%) | 2 (2.0%) |
| 1 or 2 Children | 56 (100.0%) | 0 (0.0%) |
| 3 or 4 Children | 39 (100.0%) | 0 (0.0%) |
| 5 or more Children | 0 (0.0%) | 0 (0.0%) |
| Total | 194 (99.0%) | 2 (1.0%) |
Income Below Poverty Among Single-Parent Households in Waitsburg
According to the poverty data in Waitsburg, 100.0% or 8 single-father households and 33.3% or 21 single-mother households are living below the poverty line. Among single-father households, those with 1 or 2 children have the highest poverty rate, with 8 households (100.0%) experiencing poverty. Likewise, among single-mother households, those with 1 or 2 children have the highest poverty rate, with 21 households (50.0%) falling below the poverty line.
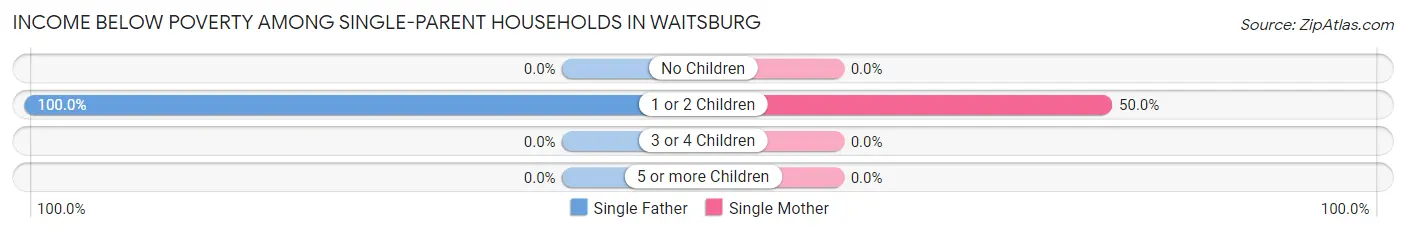
| Children | Single Father | Single Mother |
| No Children | 0 (0.0%) | 0 (0.0%) |
| 1 or 2 Children | 8 (100.0%) | 21 (50.0%) |
| 3 or 4 Children | 0 (0.0%) | 0 (0.0%) |
| 5 or more Children | 0 (0.0%) | 0 (0.0%) |
| Total | 8 (100.0%) | 21 (33.3%) |
Income Below Poverty Among Married-Couple vs Single-Parent Households in Waitsburg
The poverty data for Waitsburg shows that 2 of the married-couple family households (1.0%) and 29 of the single-parent households (40.8%) are living below the poverty level. Within the married-couple family households, those with no children have the highest poverty rate, with 2 households (2.0%) falling below the poverty line. Among the single-parent households, those with 1 or 2 children have the highest poverty rate, with 29 household (58.0%) living below poverty.
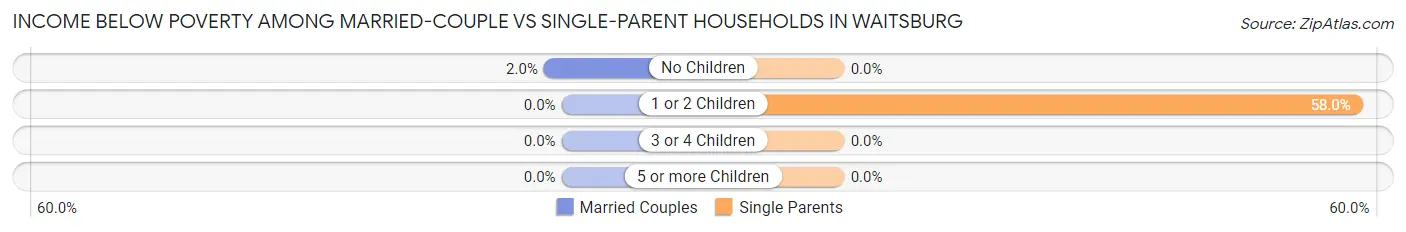
| Children | Married-Couple Families | Single-Parent Households |
| No Children | 2 (2.0%) | 0 (0.0%) |
| 1 or 2 Children | 0 (0.0%) | 29 (58.0%) |
| 3 or 4 Children | 0 (0.0%) | 0 (0.0%) |
| 5 or more Children | 0 (0.0%) | 0 (0.0%) |
| Total | 2 (1.0%) | 29 (40.8%) |
Race in Waitsburg
The most populous races in Waitsburg are White / Caucasian (803 | 84.0%), Hispanic or Latino (114 | 11.9%), and Some other Race (75 | 7.9%).
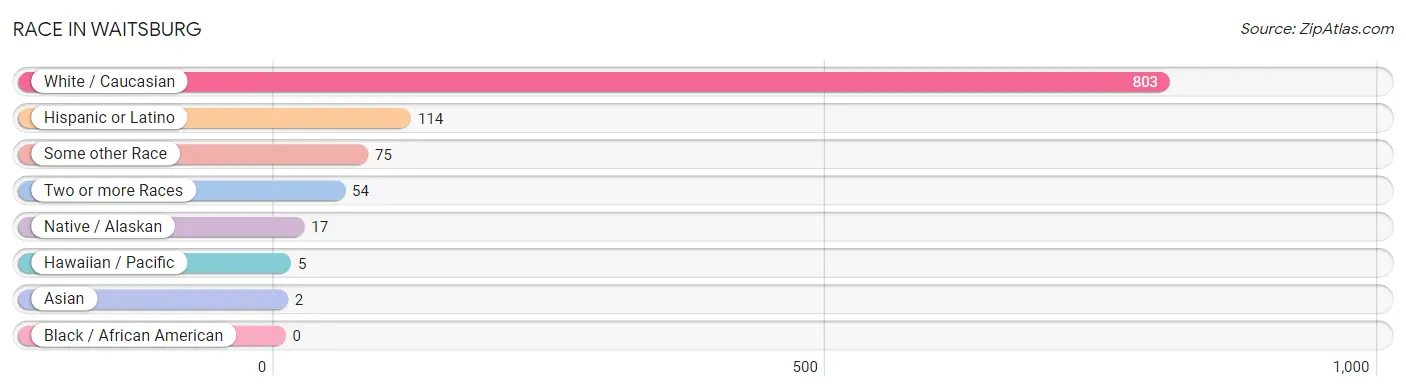
| Race | # Population | % Population |
| Asian | 2 | 0.2% |
| Black / African American | 0 | 0.0% |
| Hawaiian / Pacific | 5 | 0.5% |
| Hispanic or Latino | 114 | 11.9% |
| Native / Alaskan | 17 | 1.8% |
| White / Caucasian | 803 | 84.0% |
| Two or more Races | 54 | 5.7% |
| Some other Race | 75 | 7.9% |
| Total | 956 | 100.0% |
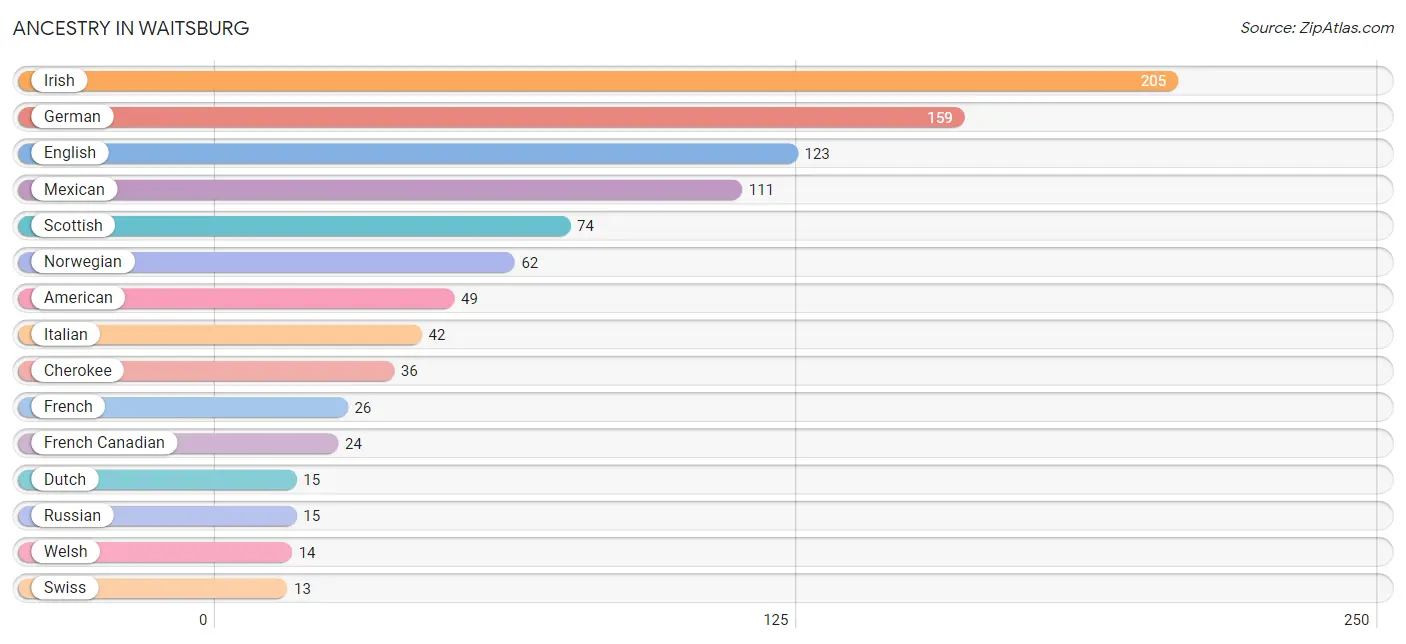
Ancestry in Waitsburg
The most populous ancestries reported in Waitsburg are Irish (205 | 21.4%), German (159 | 16.6%), English (123 | 12.9%), Mexican (111 | 11.6%), and Scottish (74 | 7.7%), together accounting for 70.3% of all Waitsburg residents.
| Ancestry | # Population | % Population |
| American | 49 | 5.1% |
| Belgian | 2 | 0.2% |
| Cherokee | 36 | 3.8% |
| Colombian | 3 | 0.3% |
| Dutch | 15 | 1.6% |
| English | 123 | 12.9% |
| European | 3 | 0.3% |
| Finnish | 10 | 1.1% |
| French | 26 | 2.7% |
| French Canadian | 24 | 2.5% |
| German | 159 | 16.6% |
| Indian (Asian) | 2 | 0.2% |
| Irish | 205 | 21.4% |
| Iroquois | 1 | 0.1% |
| Italian | 42 | 4.4% |
| Korean | 8 | 0.8% |
| Mexican | 111 | 11.6% |
| Native Hawaiian | 5 | 0.5% |
| Norwegian | 62 | 6.5% |
| Polish | 2 | 0.2% |
| Russian | 15 | 1.6% |
| Scandinavian | 8 | 0.8% |
| Scotch-Irish | 5 | 0.5% |
| Scottish | 74 | 7.7% |
| Slovak | 9 | 0.9% |
| South American | 3 | 0.3% |
| Swedish | 12 | 1.3% |
| Swiss | 13 | 1.4% |
| Ukrainian | 2 | 0.2% |
| Welsh | 14 | 1.5% | View All 30 Rows |
Immigrants in Waitsburg
The most numerous immigrant groups reported in Waitsburg came from Latin America (37 | 3.9%), Central America (34 | 3.6%), Mexico (34 | 3.6%), Colombia (3 | 0.3%), and South America (3 | 0.3%), together accounting for 11.6% of all Waitsburg residents.
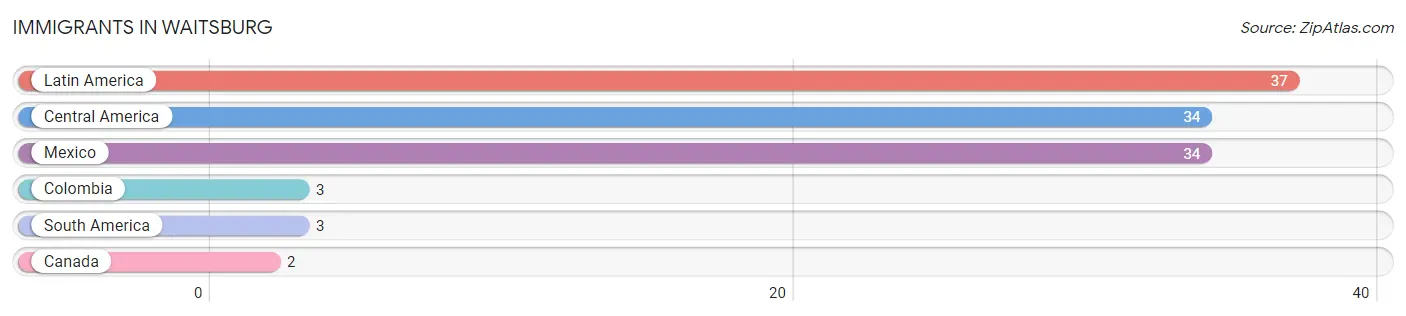
| Immigration Origin | # Population | % Population |
| Canada | 2 | 0.2% |
| Central America | 34 | 3.6% |
| Colombia | 3 | 0.3% |
| Latin America | 37 | 3.9% |
| Mexico | 34 | 3.6% |
| South America | 3 | 0.3% | View All 6 Rows |
Sex and Age in Waitsburg
Sex and Age in Waitsburg
The most populous age groups in Waitsburg are 10 to 14 Years (72 | 14.7%) for men and 30 to 34 Years (53 | 11.3%) for women.
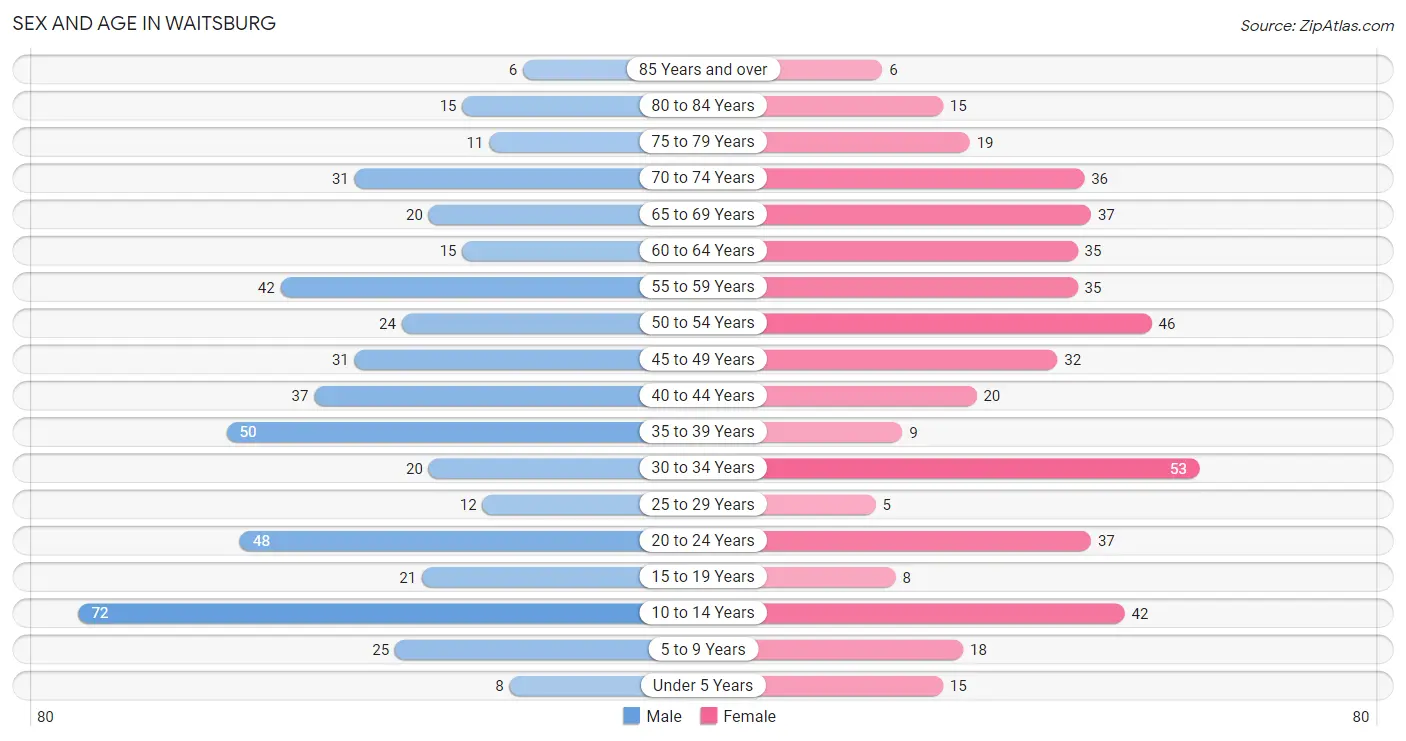
| Age Bracket | Male | Female |
| Under 5 Years | 8 (1.6%) | 15 (3.2%) |
| 5 to 9 Years | 25 (5.1%) | 18 (3.8%) |
| 10 to 14 Years | 72 (14.7%) | 42 (9.0%) |
| 15 to 19 Years | 21 (4.3%) | 8 (1.7%) |
| 20 to 24 Years | 48 (9.8%) | 37 (7.9%) |
| 25 to 29 Years | 12 (2.5%) | 5 (1.1%) |
| 30 to 34 Years | 20 (4.1%) | 53 (11.3%) |
| 35 to 39 Years | 50 (10.2%) | 9 (1.9%) |
| 40 to 44 Years | 37 (7.6%) | 20 (4.3%) |
| 45 to 49 Years | 31 (6.4%) | 32 (6.8%) |
| 50 to 54 Years | 24 (4.9%) | 46 (9.8%) |
| 55 to 59 Years | 42 (8.6%) | 35 (7.5%) |
| 60 to 64 Years | 15 (3.1%) | 35 (7.5%) |
| 65 to 69 Years | 20 (4.1%) | 37 (7.9%) |
| 70 to 74 Years | 31 (6.4%) | 36 (7.7%) |
| 75 to 79 Years | 11 (2.2%) | 19 (4.1%) |
| 80 to 84 Years | 15 (3.1%) | 15 (3.2%) |
| 85 Years and over | 6 (1.2%) | 6 (1.3%) |
| Total | 488 (100.0%) | 468 (100.0%) |
Families and Households in Waitsburg
Median Family Size in Waitsburg
The median family size in Waitsburg is 2.76 persons per family, with single male/father families (8 | 3.0%) accounting for the largest median family size of 3.25 persons per family. On the other hand, single female/mother families (63 | 23.6%) represent the smallest median family size with 2.05 persons per family.
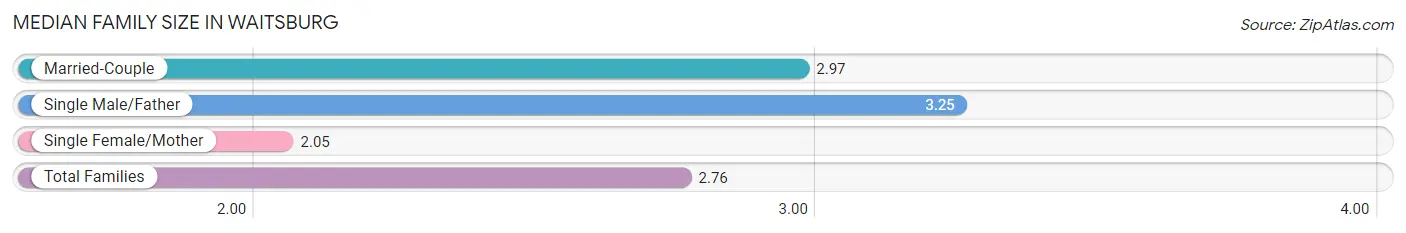
| Family Type | # Families | Family Size |
| Married-Couple | 196 (73.4%) | 2.97 |
| Single Male/Father | 8 (3.0%) | 3.25 |
| Single Female/Mother | 63 (23.6%) | 2.05 |
| Total Families | 267 (100.0%) | 2.76 |
Median Household Size in Waitsburg
The median household size in Waitsburg is 2.41 persons per household, with single male/father households (8 | 2.0%) accounting for the largest median household size of 4.5 persons per household. non-family households (130 | 32.8%) represent the smallest median household size with 1.22 persons per household.
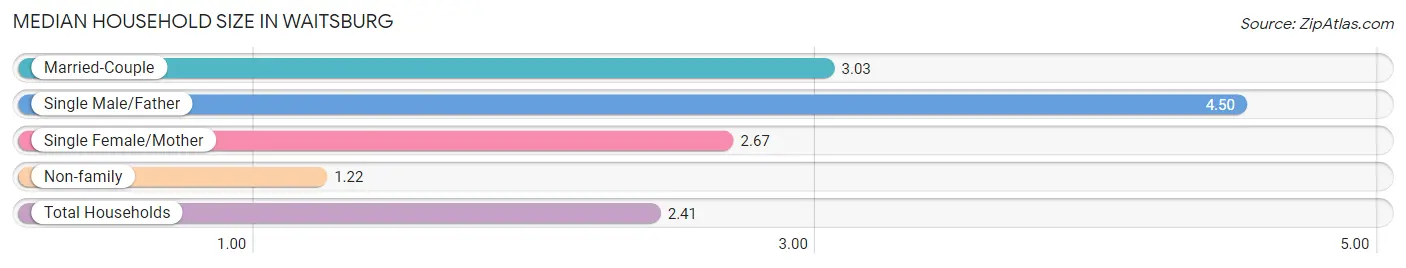
| Household Type | # Households | Household Size |
| Married-Couple | 196 (49.4%) | 3.03 |
| Single Male/Father | 8 (2.0%) | 4.50 |
| Single Female/Mother | 63 (15.9%) | 2.67 |
| Non-family | 130 (32.8%) | 1.22 |
| Total Households | 397 (100.0%) | 2.41 |
Household Size by Marriage Status in Waitsburg
Out of a total of 397 households in Waitsburg, 267 (67.2%) are family households, while 130 (32.8%) are nonfamily households. The most numerous type of family households are 2-person households, comprising 113, and the most common type of nonfamily households are 1-person households, comprising 102.
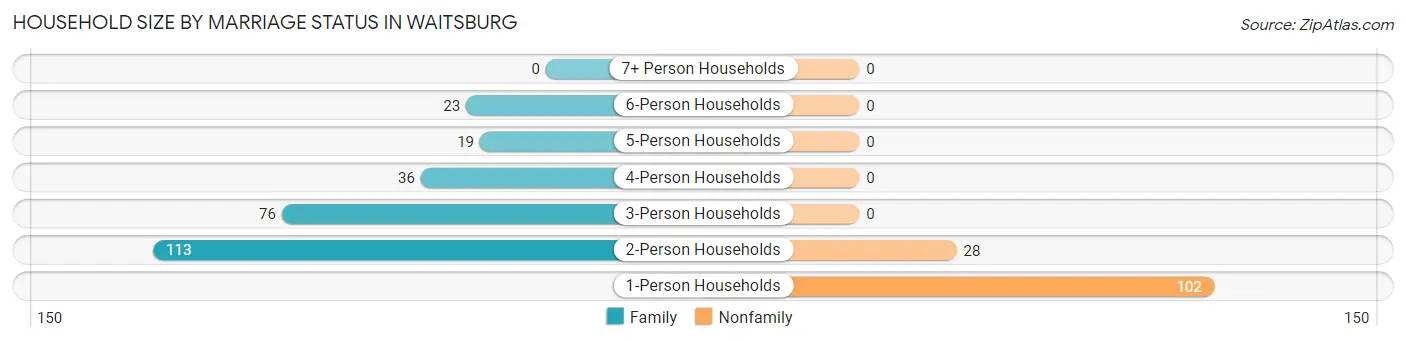
| Household Size | Family Households | Nonfamily Households |
| 1-Person Households | - | 102 (25.7%) |
| 2-Person Households | 113 (28.5%) | 28 (7.0%) |
| 3-Person Households | 76 (19.1%) | 0 (0.0%) |
| 4-Person Households | 36 (9.1%) | 0 (0.0%) |
| 5-Person Households | 19 (4.8%) | 0 (0.0%) |
| 6-Person Households | 23 (5.8%) | 0 (0.0%) |
| 7+ Person Households | 0 (0.0%) | 0 (0.0%) |
| Total | 267 (67.2%) | 130 (32.8%) |
Female Fertility in Waitsburg
Fertility by Age in Waitsburg
Average fertility rate in Waitsburg is 85.0 births per 1,000 women. Women in the age bracket of 20 to 34 years have the highest fertility rate with 137.0 births per 1,000 women. Women in the age bracket of 20 to 34 years acount for 92.9% of all women with births.
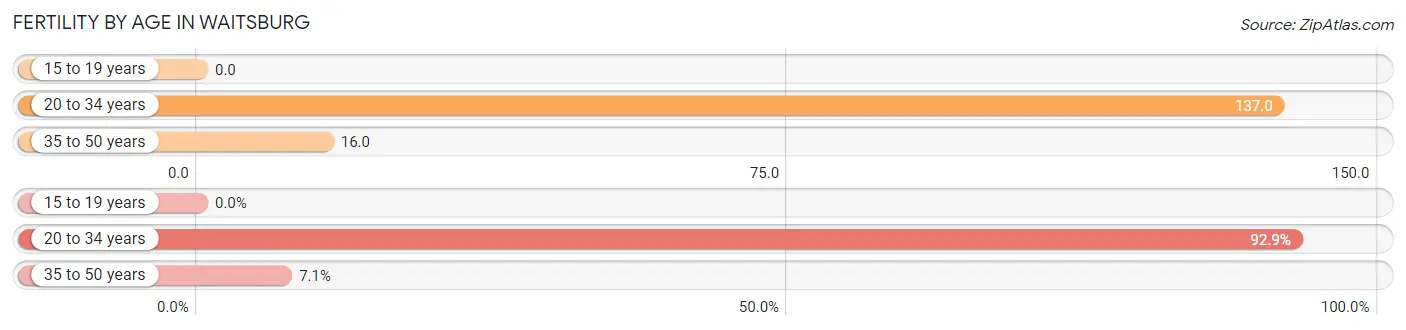
| Age Bracket | Women with Births | Births / 1,000 Women |
| 15 to 19 years | 0 (0.0%) | 0.0 |
| 20 to 34 years | 13 (92.9%) | 137.0 |
| 35 to 50 years | 1 (7.1%) | 16.0 |
| Total | 14 (100.0%) | 85.0 |
Fertility by Age by Marriage Status in Waitsburg
92.9% of women with births (14) in Waitsburg are married. The highest percentage of unmarried women with births falls into 35 to 50 years age bracket with 100.0% of them unmarried at the time of birth, while the lowest percentage of unmarried women with births belong to 20 to 34 years age bracket with 0.0% of them unmarried.
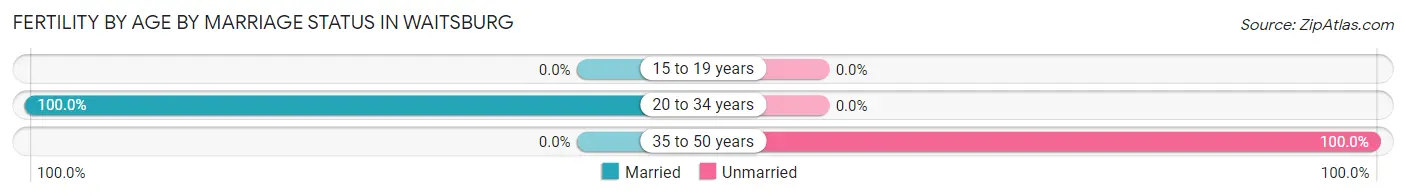
| Age Bracket | Married | Unmarried |
| 15 to 19 years | 0 (0.0%) | 0 (0.0%) |
| 20 to 34 years | 13 (100.0%) | 0 (0.0%) |
| 35 to 50 years | 0 (0.0%) | 1 (100.0%) |
| Total | 13 (92.9%) | 1 (7.1%) |
Fertility by Education in Waitsburg
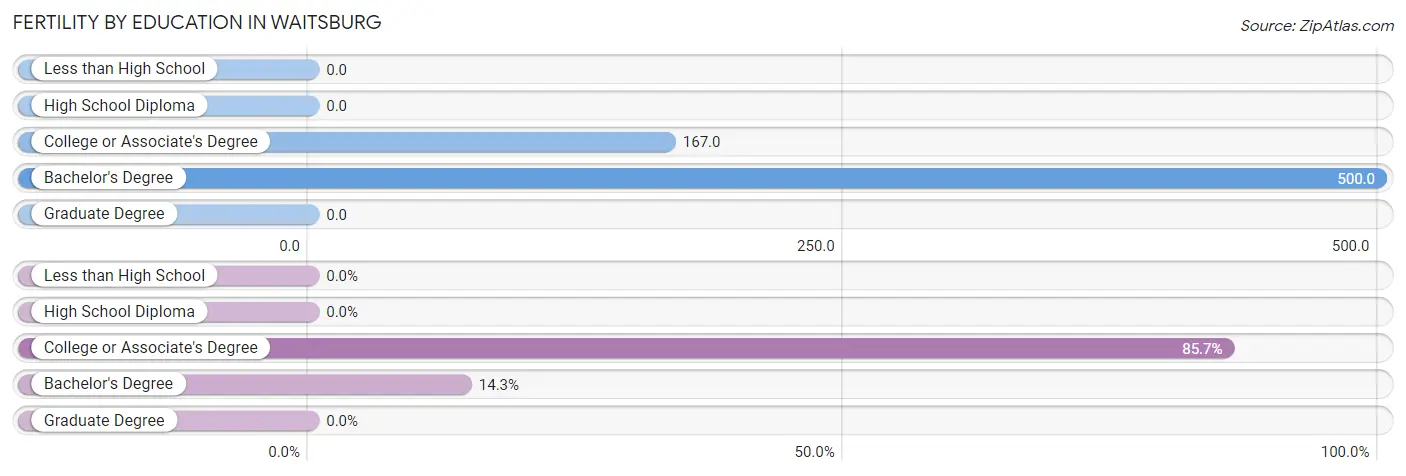
| Educational Attainment | Women with Births | Births / 1,000 Women |
| Less than High School | 0 (0.0%) | 0.0 |
| High School Diploma | 0 (0.0%) | 0.0 |
| College or Associate's Degree | 12 (85.7%) | 167.0 |
| Bachelor's Degree | 2 (14.3%) | 500.0 |
| Graduate Degree | 0 (0.0%) | 0.0 |
| Total | 14 (100.0%) | 85.0 |
Fertility by Education by Marriage Status in Waitsburg
7.1% of women with births in Waitsburg are unmarried. Women with the educational attainment of bachelor's degree are most likely to be married with 100.0% of them married at childbirth, while women with the educational attainment of college or associate's degree are least likely to be married with 8.3% of them unmarried at childbirth.
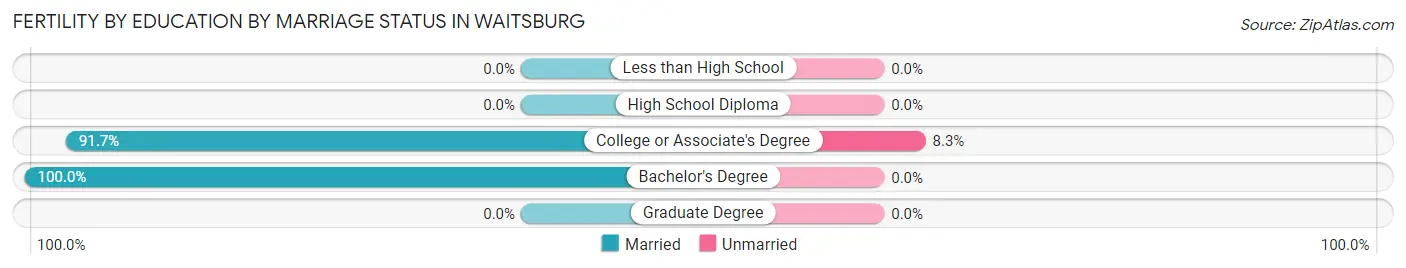
| Educational Attainment | Married | Unmarried |
| Less than High School | 0 (0.0%) | 0 (0.0%) |
| High School Diploma | 0 (0.0%) | 0 (0.0%) |
| College or Associate's Degree | 11 (91.7%) | 1 (8.3%) |
| Bachelor's Degree | 2 (100.0%) | 0 (0.0%) |
| Graduate Degree | 0 (0.0%) | 0 (0.0%) |
| Total | 13 (92.9%) | 1 (7.1%) |
Employment Characteristics in Waitsburg
Employment by Class of Employer in Waitsburg
Among the 376 employed individuals in Waitsburg, private company employees (189 | 50.3%), state government employees (68 | 18.1%), and federal government employees (52 | 13.8%) make up the most common classes of employment.
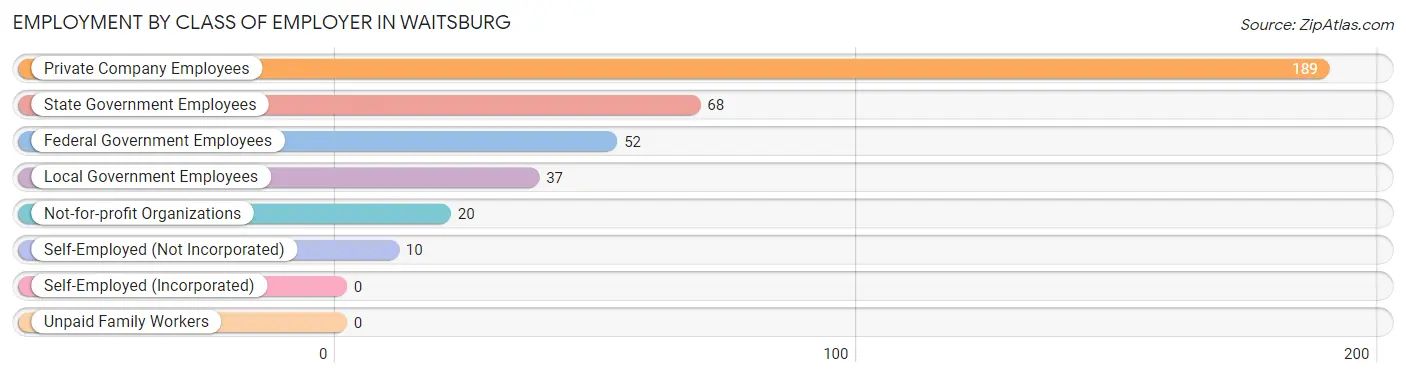
| Employer Class | # Employees | % Employees |
| Private Company Employees | 189 | 50.3% |
| Self-Employed (Incorporated) | 0 | 0.0% |
| Self-Employed (Not Incorporated) | 10 | 2.7% |
| Not-for-profit Organizations | 20 | 5.3% |
| Local Government Employees | 37 | 9.8% |
| State Government Employees | 68 | 18.1% |
| Federal Government Employees | 52 | 13.8% |
| Unpaid Family Workers | 0 | 0.0% |
| Total | 376 | 100.0% |
Employment Status by Age in Waitsburg
According to the labor force statistics for Waitsburg, out of the total population over 16 years of age (775), 53.5% or 415 individuals are in the labor force, with 6.4% or 27 of them unemployed. The age group with the highest labor force participation rate is 35 to 44 years, with 91.4% or 106 individuals in the labor force. Within the labor force, the 16 to 19 years age range has the highest percentage of unemployed individuals, with 53.3% or 8 of them being unemployed.
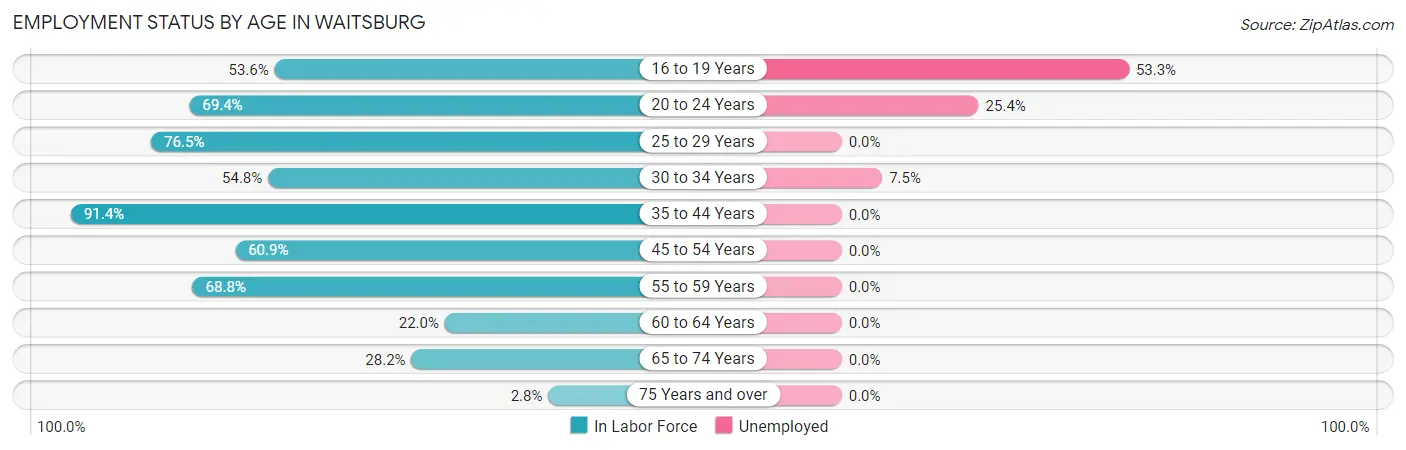
| Age Bracket | In Labor Force | Unemployed |
| 16 to 19 Years | 15 (53.6%) | 8 (53.3%) |
| 20 to 24 Years | 59 (69.4%) | 15 (25.4%) |
| 25 to 29 Years | 13 (76.5%) | 0 (0.0%) |
| 30 to 34 Years | 40 (54.8%) | 3 (7.5%) |
| 35 to 44 Years | 106 (91.4%) | 0 (0.0%) |
| 45 to 54 Years | 81 (60.9%) | 0 (0.0%) |
| 55 to 59 Years | 53 (68.8%) | 0 (0.0%) |
| 60 to 64 Years | 11 (22.0%) | 0 (0.0%) |
| 65 to 74 Years | 35 (28.2%) | 0 (0.0%) |
| 75 Years and over | 2 (2.8%) | 0 (0.0%) |
| Total | 415 (53.5%) | 27 (6.4%) |
Employment Status by Educational Attainment in Waitsburg
According to labor force statistics for Waitsburg, 65.2% of individuals (304) out of the total population between 25 and 64 years of age (466) are in the labor force, with 1.0% or 3 of them being unemployed. The group with the highest labor force participation rate are those with the educational attainment of bachelor's degree or higher, with 96.6% or 57 individuals in the labor force. Within the labor force, individuals with high school diploma education have the highest percentage of unemployment, with 33.3% or 3 of them being unemployed.
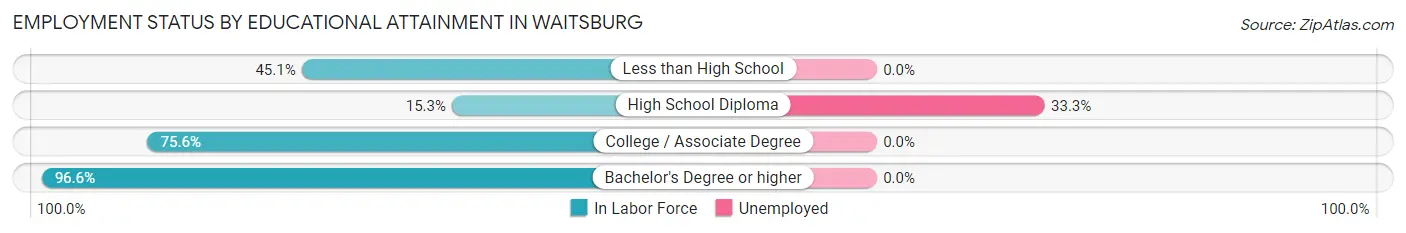
| Educational Attainment | In Labor Force | Unemployed |
| Less than High School | 37 (45.1%) | 0 (0.0%) |
| High School Diploma | 9 (15.3%) | 20 (33.3%) |
| College / Associate Degree | 201 (75.6%) | 0 (0.0%) |
| Bachelor's Degree or higher | 57 (96.6%) | 0 (0.0%) |
| Total | 304 (65.2%) | 5 (1.0%) |
Employment Occupations by Sex in Waitsburg
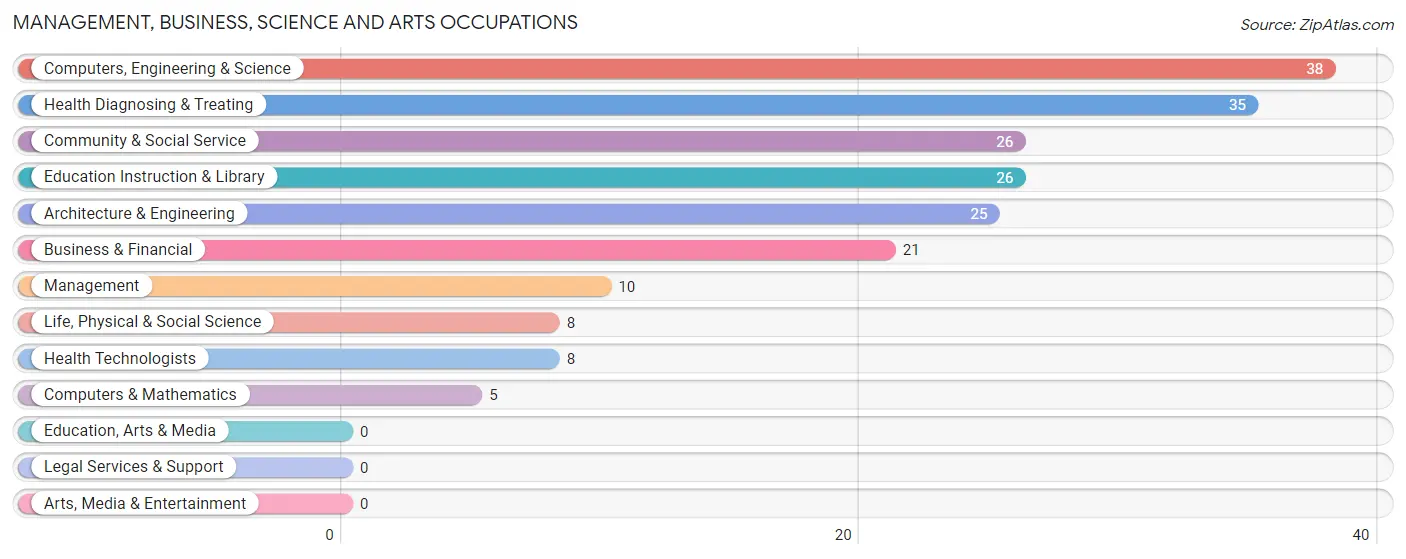
Management, Business, Science and Arts Occupations
The most common Management, Business, Science and Arts occupations in Waitsburg are Computers, Engineering & Science (38 | 9.9%), Health Diagnosing & Treating (35 | 9.1%), Community & Social Service (26 | 6.8%), Education Instruction & Library (26 | 6.8%), and Architecture & Engineering (25 | 6.5%).
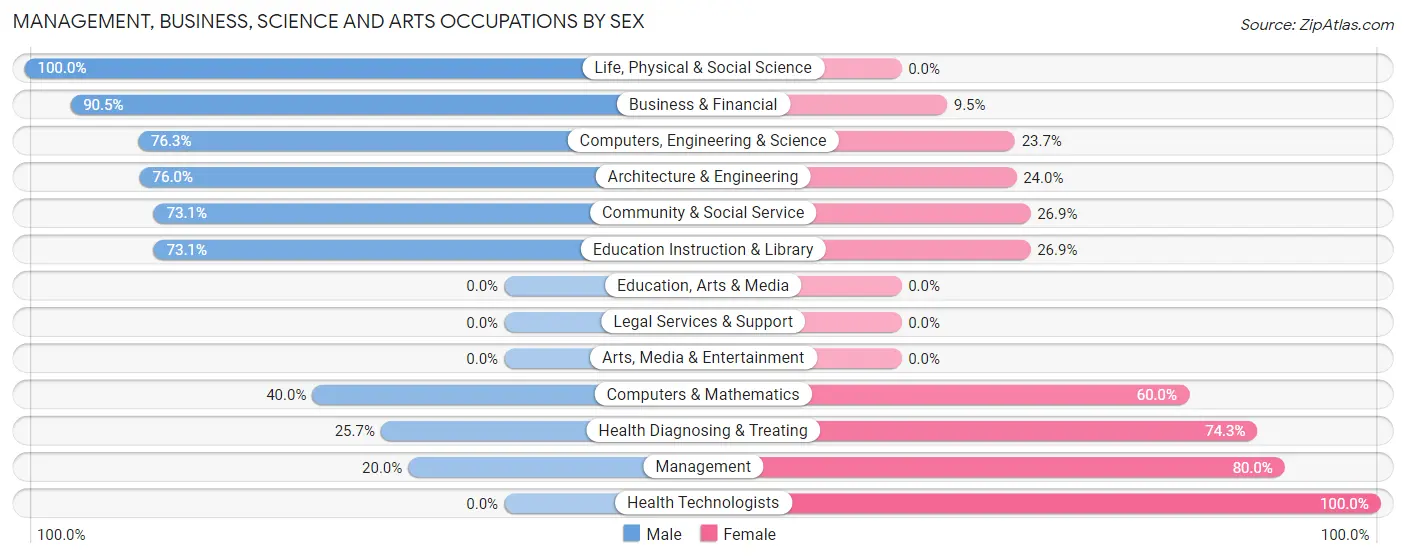
Management, Business, Science and Arts Occupations by Sex
Within the Management, Business, Science and Arts occupations in Waitsburg, the most male-oriented occupations are Life, Physical & Social Science (100.0%), Business & Financial (90.5%), and Computers, Engineering & Science (76.3%), while the most female-oriented occupations are Health Technologists (100.0%), Management (80.0%), and Health Diagnosing & Treating (74.3%).
| Occupation | Male | Female |
| Management | 2 (20.0%) | 8 (80.0%) |
| Business & Financial | 19 (90.5%) | 2 (9.5%) |
| Computers, Engineering & Science | 29 (76.3%) | 9 (23.7%) |
| Computers & Mathematics | 2 (40.0%) | 3 (60.0%) |
| Architecture & Engineering | 19 (76.0%) | 6 (24.0%) |
| Life, Physical & Social Science | 8 (100.0%) | 0 (0.0%) |
| Community & Social Service | 19 (73.1%) | 7 (26.9%) |
| Education, Arts & Media | 0 (0.0%) | 0 (0.0%) |
| Legal Services & Support | 0 (0.0%) | 0 (0.0%) |
| Education Instruction & Library | 19 (73.1%) | 7 (26.9%) |
| Arts, Media & Entertainment | 0 (0.0%) | 0 (0.0%) |
| Health Diagnosing & Treating | 9 (25.7%) | 26 (74.3%) |
| Health Technologists | 0 (0.0%) | 8 (100.0%) |
| Total (Category) | 78 (60.0%) | 52 (40.0%) |
| Total (Overall) | 231 (60.3%) | 152 (39.7%) |
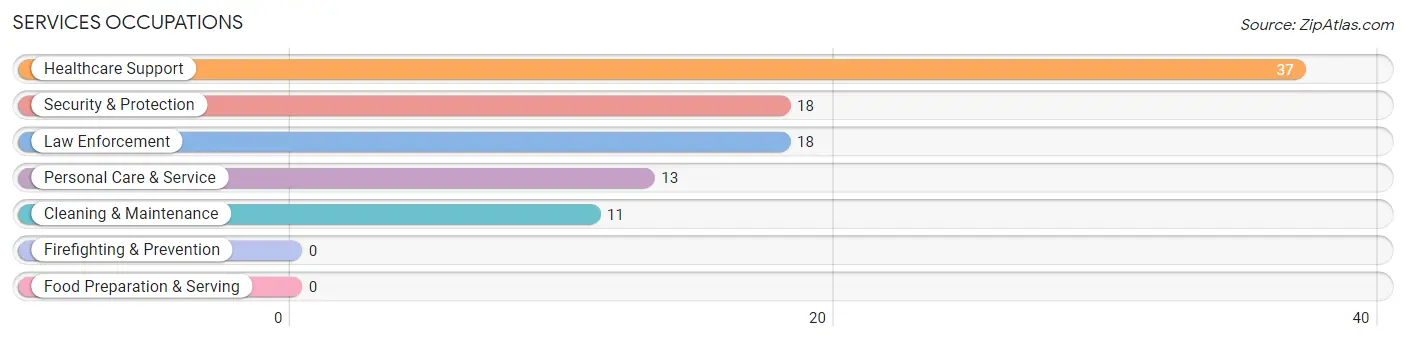
Services Occupations
The most common Services occupations in Waitsburg are Healthcare Support (37 | 9.7%), Security & Protection (18 | 4.7%), Law Enforcement (18 | 4.7%), Personal Care & Service (13 | 3.4%), and Cleaning & Maintenance (11 | 2.9%).
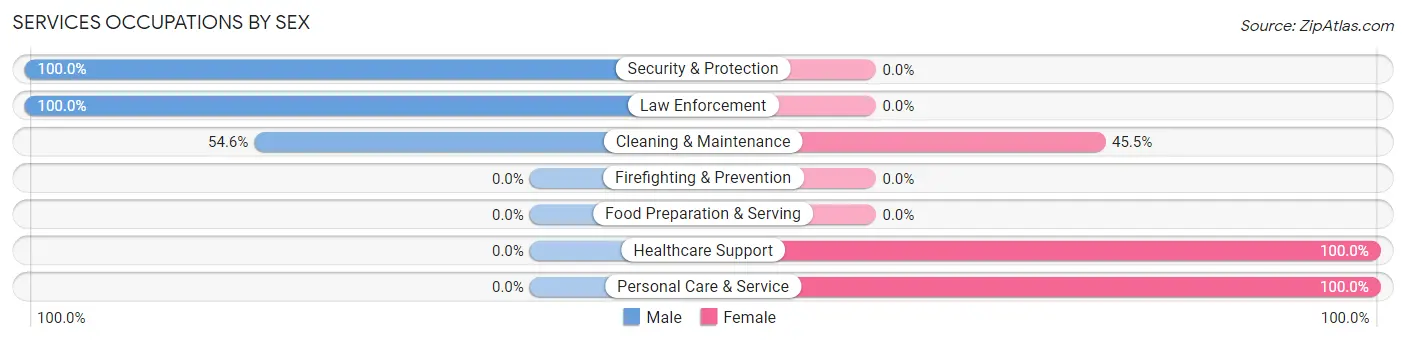
Services Occupations by Sex
Within the Services occupations in Waitsburg, the most male-oriented occupations are Security & Protection (100.0%), Law Enforcement (100.0%), and Cleaning & Maintenance (54.5%), while the most female-oriented occupations are Healthcare Support (100.0%), Personal Care & Service (100.0%), and Cleaning & Maintenance (45.5%).
| Occupation | Male | Female |
| Healthcare Support | 0 (0.0%) | 37 (100.0%) |
| Security & Protection | 18 (100.0%) | 0 (0.0%) |
| Firefighting & Prevention | 0 (0.0%) | 0 (0.0%) |
| Law Enforcement | 18 (100.0%) | 0 (0.0%) |
| Food Preparation & Serving | 0 (0.0%) | 0 (0.0%) |
| Cleaning & Maintenance | 6 (54.5%) | 5 (45.5%) |
| Personal Care & Service | 0 (0.0%) | 13 (100.0%) |
| Total (Category) | 24 (30.4%) | 55 (69.6%) |
| Total (Overall) | 231 (60.3%) | 152 (39.7%) |
Sales and Office Occupations
The most common Sales and Office occupations in Waitsburg are Office & Administration (36 | 9.4%), and Sales & Related (16 | 4.2%).
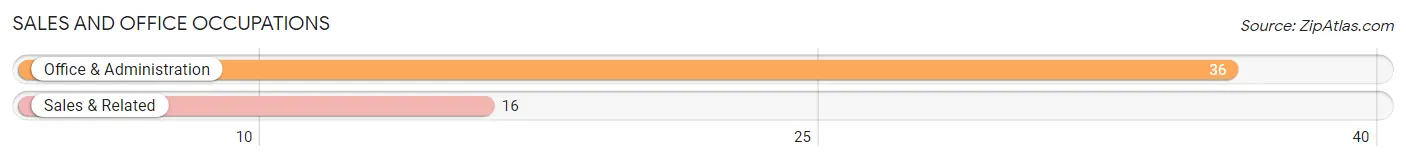
Sales and Office Occupations by Sex
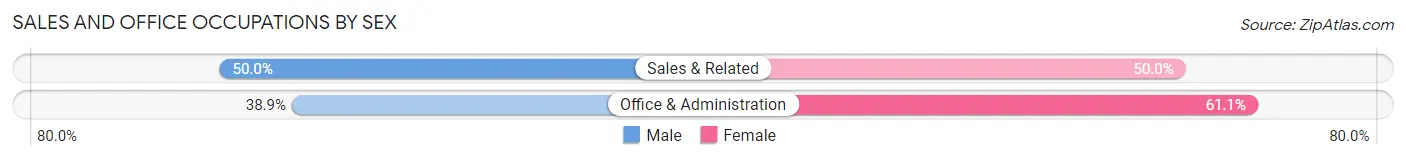
| Occupation | Male | Female |
| Sales & Related | 8 (50.0%) | 8 (50.0%) |
| Office & Administration | 14 (38.9%) | 22 (61.1%) |
| Total (Category) | 22 (42.3%) | 30 (57.7%) |
| Total (Overall) | 231 (60.3%) | 152 (39.7%) |
Natural Resources, Construction and Maintenance Occupations
The most common Natural Resources, Construction and Maintenance occupations in Waitsburg are Construction & Extraction (25 | 6.5%), and Installation, Maintenance & Repair (7 | 1.8%).
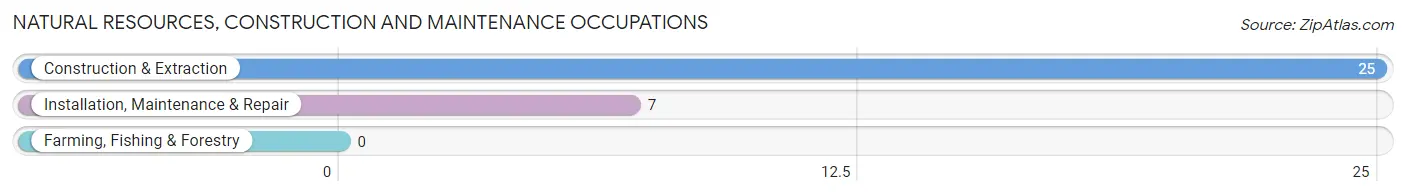
Natural Resources, Construction and Maintenance Occupations by Sex
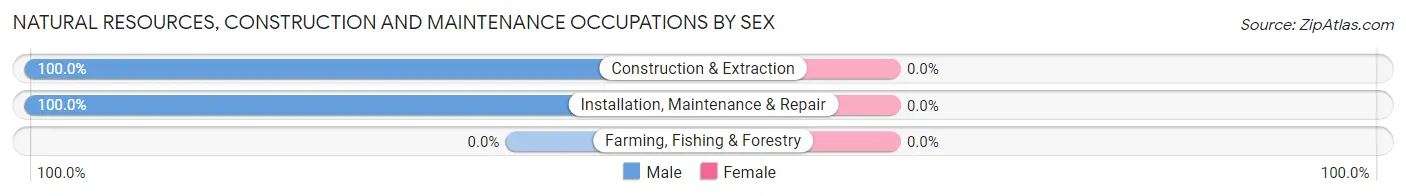
| Occupation | Male | Female |
| Farming, Fishing & Forestry | 0 (0.0%) | 0 (0.0%) |
| Construction & Extraction | 25 (100.0%) | 0 (0.0%) |
| Installation, Maintenance & Repair | 7 (100.0%) | 0 (0.0%) |
| Total (Category) | 32 (100.0%) | 0 (0.0%) |
| Total (Overall) | 231 (60.3%) | 152 (39.7%) |
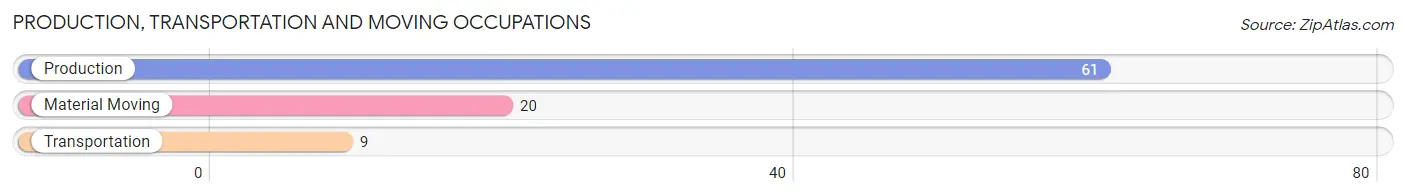
Production, Transportation and Moving Occupations
The most common Production, Transportation and Moving occupations in Waitsburg are Production (61 | 15.9%), Material Moving (20 | 5.2%), and Transportation (9 | 2.4%).
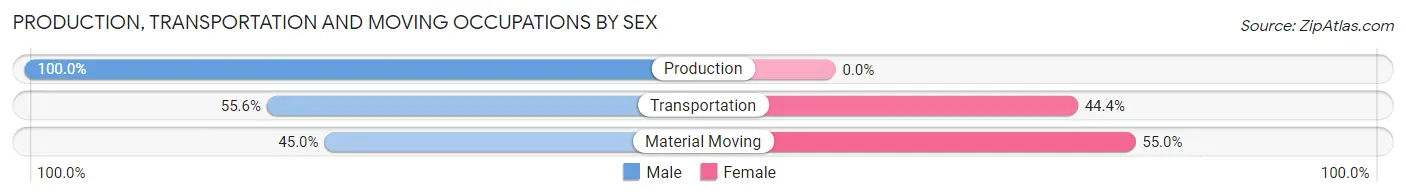
Production, Transportation and Moving Occupations by Sex
| Occupation | Male | Female |
| Production | 61 (100.0%) | 0 (0.0%) |
| Transportation | 5 (55.6%) | 4 (44.4%) |
| Material Moving | 9 (45.0%) | 11 (55.0%) |
| Total (Category) | 75 (83.3%) | 15 (16.7%) |
| Total (Overall) | 231 (60.3%) | 152 (39.7%) |
Employment Industries by Sex in Waitsburg
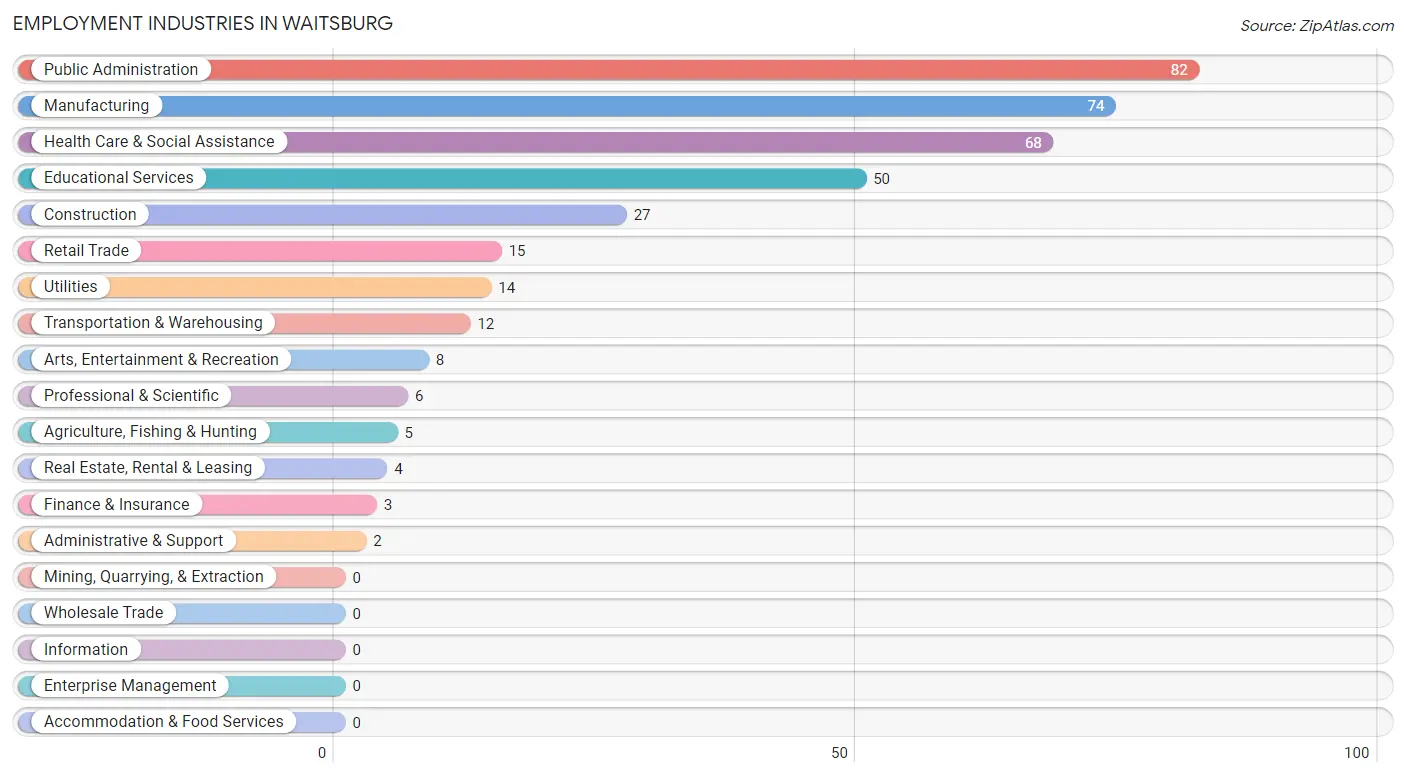
Employment Industries in Waitsburg
The major employment industries in Waitsburg include Public Administration (82 | 21.4%), Manufacturing (74 | 19.3%), Health Care & Social Assistance (68 | 17.7%), Educational Services (50 | 13.1%), and Construction (27 | 7.0%).
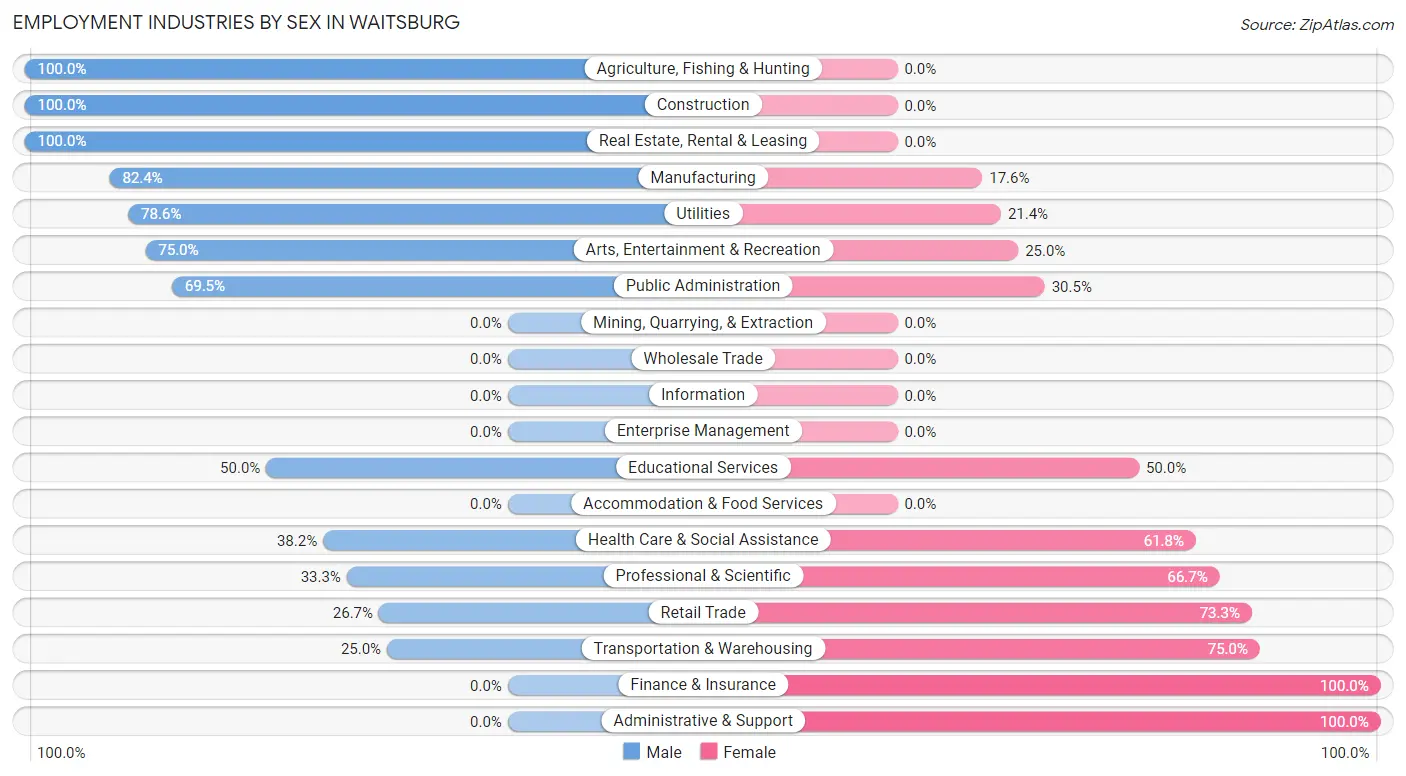
Employment Industries by Sex in Waitsburg
The Waitsburg industries that see more men than women are Agriculture, Fishing & Hunting (100.0%), Construction (100.0%), and Real Estate, Rental & Leasing (100.0%), whereas the industries that tend to have a higher number of women are Finance & Insurance (100.0%), Administrative & Support (100.0%), and Transportation & Warehousing (75.0%).
| Industry | Male | Female |
| Agriculture, Fishing & Hunting | 5 (100.0%) | 0 (0.0%) |
| Mining, Quarrying, & Extraction | 0 (0.0%) | 0 (0.0%) |
| Construction | 27 (100.0%) | 0 (0.0%) |
| Manufacturing | 61 (82.4%) | 13 (17.6%) |
| Wholesale Trade | 0 (0.0%) | 0 (0.0%) |
| Retail Trade | 4 (26.7%) | 11 (73.3%) |
| Transportation & Warehousing | 3 (25.0%) | 9 (75.0%) |
| Utilities | 11 (78.6%) | 3 (21.4%) |
| Information | 0 (0.0%) | 0 (0.0%) |
| Finance & Insurance | 0 (0.0%) | 3 (100.0%) |
| Real Estate, Rental & Leasing | 4 (100.0%) | 0 (0.0%) |
| Professional & Scientific | 2 (33.3%) | 4 (66.7%) |
| Enterprise Management | 0 (0.0%) | 0 (0.0%) |
| Administrative & Support | 0 (0.0%) | 2 (100.0%) |
| Educational Services | 25 (50.0%) | 25 (50.0%) |
| Health Care & Social Assistance | 26 (38.2%) | 42 (61.8%) |
| Arts, Entertainment & Recreation | 6 (75.0%) | 2 (25.0%) |
| Accommodation & Food Services | 0 (0.0%) | 0 (0.0%) |
| Public Administration | 57 (69.5%) | 25 (30.5%) |
| Total | 231 (60.3%) | 152 (39.7%) |
Education in Waitsburg
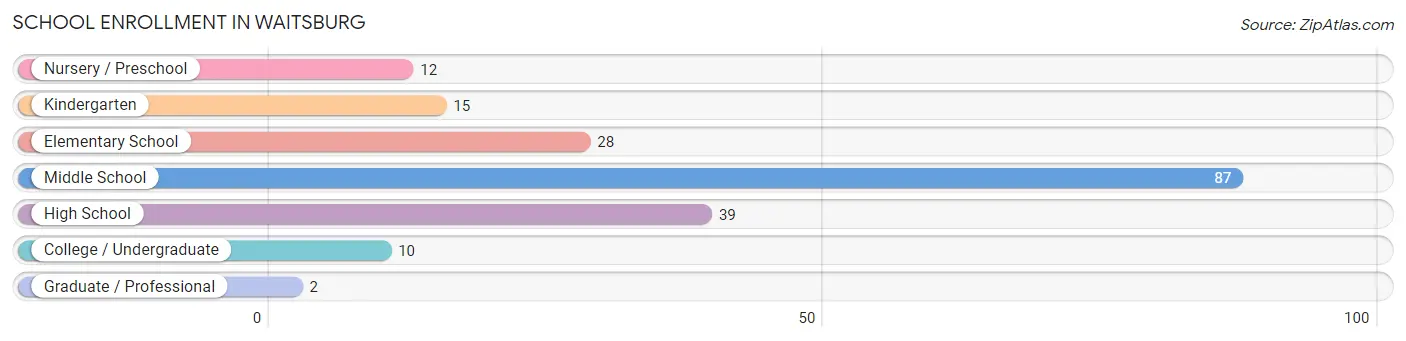
School Enrollment in Waitsburg
The most common levels of schooling among the 193 students in Waitsburg are middle school (87 | 45.1%), high school (39 | 20.2%), and elementary school (28 | 14.5%).
| School Level | # Students | % Students |
| Nursery / Preschool | 12 | 6.2% |
| Kindergarten | 15 | 7.8% |
| Elementary School | 28 | 14.5% |
| Middle School | 87 | 45.1% |
| High School | 39 | 20.2% |
| College / Undergraduate | 10 | 5.2% |
| Graduate / Professional | 2 | 1.0% |
| Total | 193 | 100.0% |
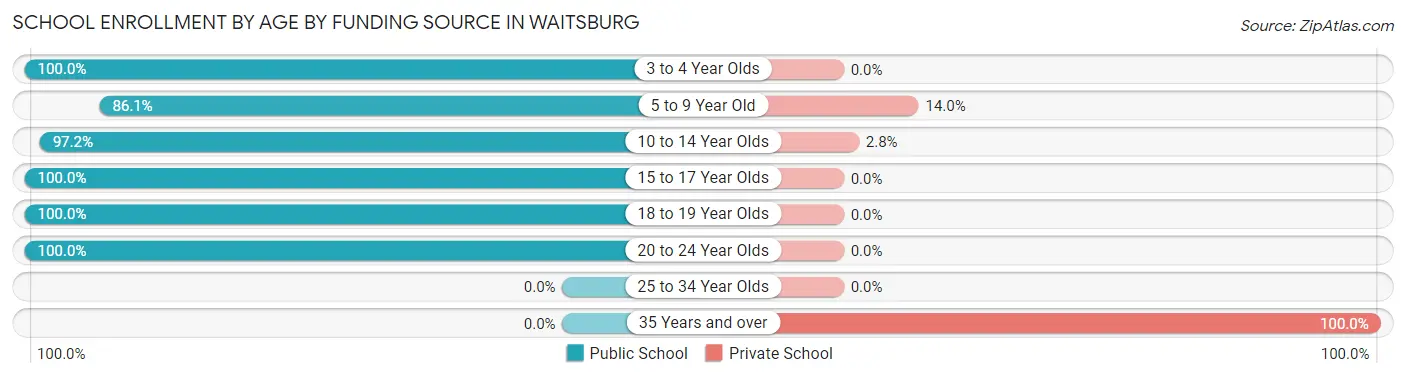
School Enrollment by Age by Funding Source in Waitsburg
Out of a total of 193 students who are enrolled in schools in Waitsburg, 11 (5.7%) attend a private institution, while the remaining 182 (94.3%) are enrolled in public schools. The age group of 35 years and over has the highest likelihood of being enrolled in private schools, with 2 (100.0% in the age bracket) enrolled. Conversely, the age group of 3 to 4 year olds has the lowest likelihood of being enrolled in a private school, with 6 (100.0% in the age bracket) attending a public institution.
| Age Bracket | Public School | Private School |
| 3 to 4 Year Olds | 6 (100.0%) | 0 (0.0%) |
| 5 to 9 Year Old | 37 (86.1%) | 6 (14.0%) |
| 10 to 14 Year Olds | 103 (97.2%) | 3 (2.8%) |
| 15 to 17 Year Olds | 22 (100.0%) | 0 (0.0%) |
| 18 to 19 Year Olds | 4 (100.0%) | 0 (0.0%) |
| 20 to 24 Year Olds | 10 (100.0%) | 0 (0.0%) |
| 25 to 34 Year Olds | 0 (0.0%) | 0 (0.0%) |
| 35 Years and over | 0 (0.0%) | 2 (100.0%) |
| Total | 182 (94.3%) | 11 (5.7%) |
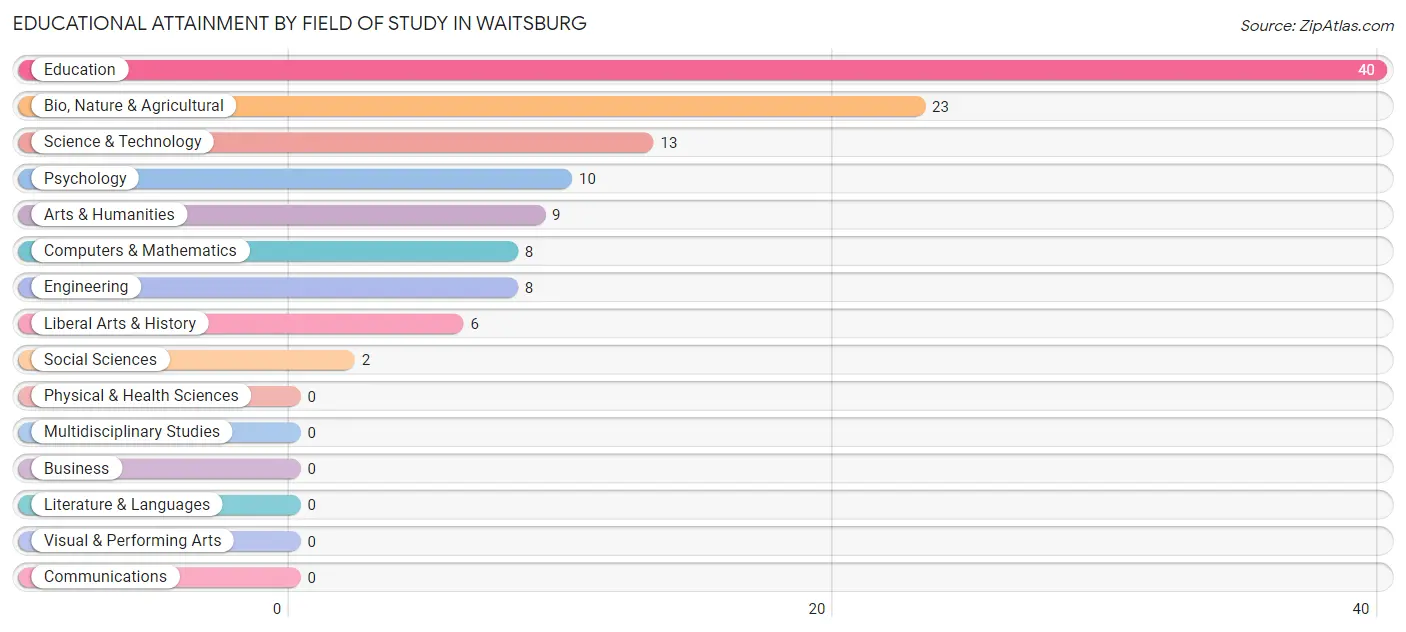
Educational Attainment by Field of Study in Waitsburg
Education (40 | 33.6%), bio, nature & agricultural (23 | 19.3%), science & technology (13 | 10.9%), psychology (10 | 8.4%), and arts & humanities (9 | 7.6%) are the most common fields of study among 119 individuals in Waitsburg who have obtained a bachelor's degree or higher.
| Field of Study | # Graduates | % Graduates |
| Computers & Mathematics | 8 | 6.7% |
| Bio, Nature & Agricultural | 23 | 19.3% |
| Physical & Health Sciences | 0 | 0.0% |
| Psychology | 10 | 8.4% |
| Social Sciences | 2 | 1.7% |
| Engineering | 8 | 6.7% |
| Multidisciplinary Studies | 0 | 0.0% |
| Science & Technology | 13 | 10.9% |
| Business | 0 | 0.0% |
| Education | 40 | 33.6% |
| Literature & Languages | 0 | 0.0% |
| Liberal Arts & History | 6 | 5.0% |
| Visual & Performing Arts | 0 | 0.0% |
| Communications | 0 | 0.0% |
| Arts & Humanities | 9 | 7.6% |
| Total | 119 | 100.0% |
Transportation & Commute in Waitsburg
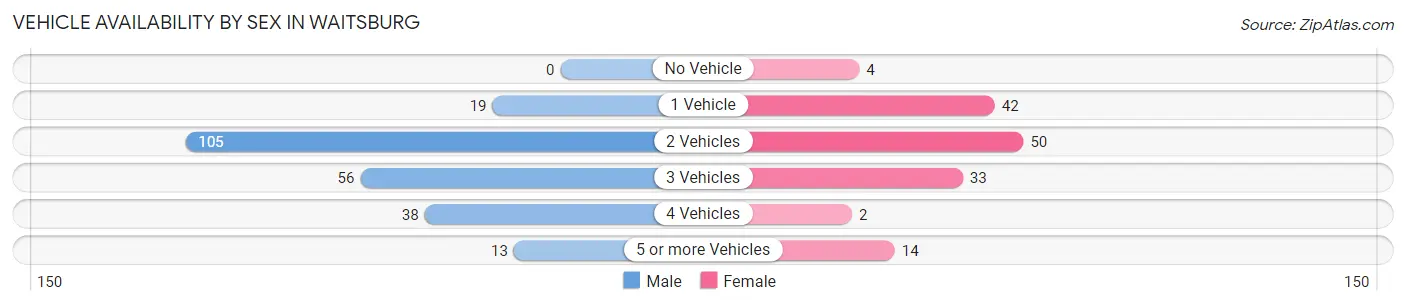
Vehicle Availability by Sex in Waitsburg
The most prevalent vehicle ownership categories in Waitsburg are males with 2 vehicles (105, accounting for 45.5%) and females with 2 vehicles (50, making up 72.4%).
| Vehicles Available | Male | Female |
| No Vehicle | 0 (0.0%) | 4 (2.8%) |
| 1 Vehicle | 19 (8.2%) | 42 (29.0%) |
| 2 Vehicles | 105 (45.5%) | 50 (34.5%) |
| 3 Vehicles | 56 (24.2%) | 33 (22.8%) |
| 4 Vehicles | 38 (16.5%) | 2 (1.4%) |
| 5 or more Vehicles | 13 (5.6%) | 14 (9.7%) |
| Total | 231 (100.0%) | 145 (100.0%) |
Commute Time in Waitsburg
The most frequently occuring commute durations in Waitsburg are 30 to 34 minutes (82 commuters, 25.0%), 20 to 24 minutes (55 commuters, 16.8%), and 45 to 59 minutes (43 commuters, 13.1%).
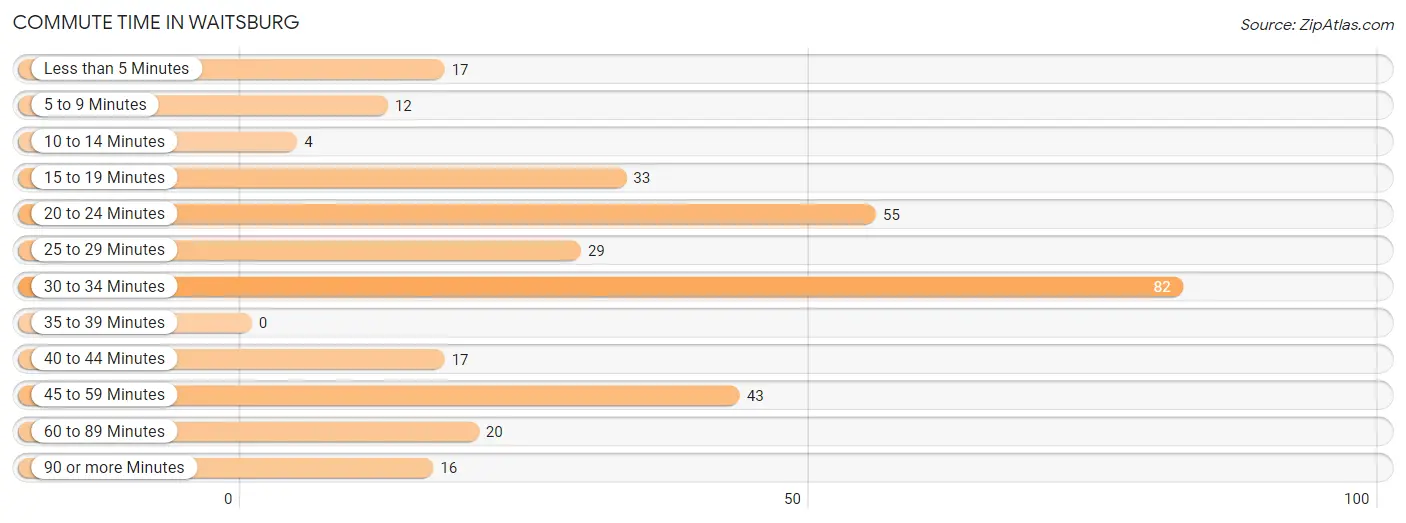
| Commute Time | # Commuters | % Commuters |
| Less than 5 Minutes | 17 | 5.2% |
| 5 to 9 Minutes | 12 | 3.7% |
| 10 to 14 Minutes | 4 | 1.2% |
| 15 to 19 Minutes | 33 | 10.1% |
| 20 to 24 Minutes | 55 | 16.8% |
| 25 to 29 Minutes | 29 | 8.8% |
| 30 to 34 Minutes | 82 | 25.0% |
| 35 to 39 Minutes | 0 | 0.0% |
| 40 to 44 Minutes | 17 | 5.2% |
| 45 to 59 Minutes | 43 | 13.1% |
| 60 to 89 Minutes | 20 | 6.1% |
| 90 or more Minutes | 16 | 4.9% |
Commute Time by Sex in Waitsburg
The most common commute times in Waitsburg are 20 to 24 minutes (43 commuters, 22.1%) for males and 30 to 34 minutes (44 commuters, 33.1%) for females.
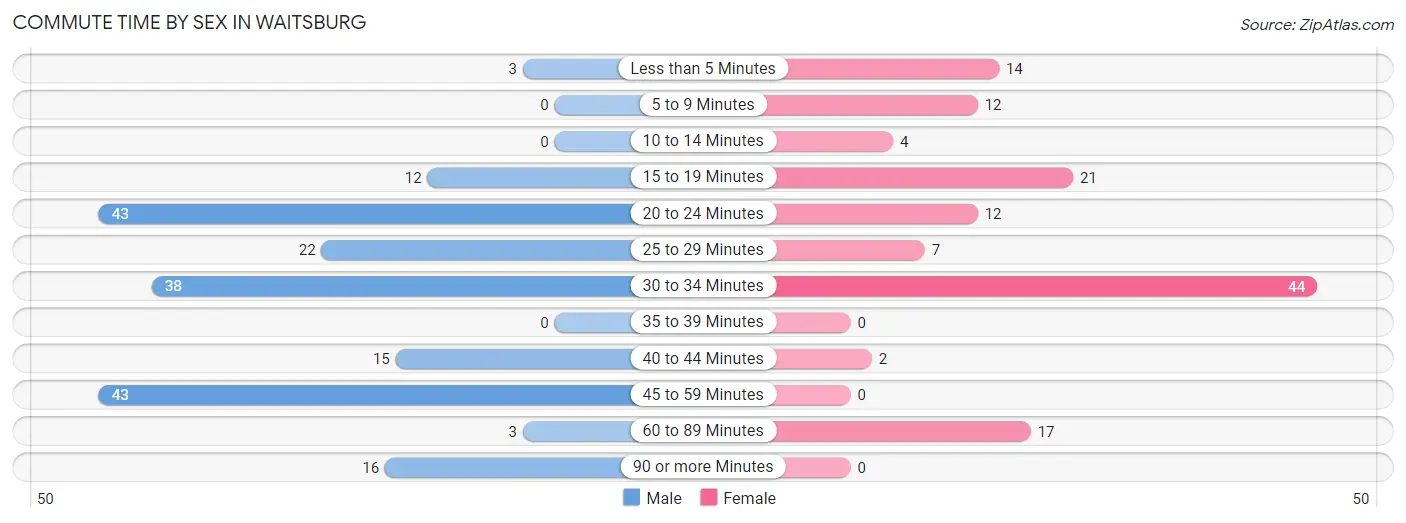
| Commute Time | Male | Female |
| Less than 5 Minutes | 3 (1.5%) | 14 (10.5%) |
| 5 to 9 Minutes | 0 (0.0%) | 12 (9.0%) |
| 10 to 14 Minutes | 0 (0.0%) | 4 (3.0%) |
| 15 to 19 Minutes | 12 (6.1%) | 21 (15.8%) |
| 20 to 24 Minutes | 43 (22.1%) | 12 (9.0%) |
| 25 to 29 Minutes | 22 (11.3%) | 7 (5.3%) |
| 30 to 34 Minutes | 38 (19.5%) | 44 (33.1%) |
| 35 to 39 Minutes | 0 (0.0%) | 0 (0.0%) |
| 40 to 44 Minutes | 15 (7.7%) | 2 (1.5%) |
| 45 to 59 Minutes | 43 (22.1%) | 0 (0.0%) |
| 60 to 89 Minutes | 3 (1.5%) | 17 (12.8%) |
| 90 or more Minutes | 16 (8.2%) | 0 (0.0%) |
Time of Departure to Work by Sex in Waitsburg
The most frequent times of departure to work in Waitsburg are 6:00 AM to 6:29 AM (68, 34.9%) for males and 7:00 AM to 7:29 AM (33, 24.8%) for females.
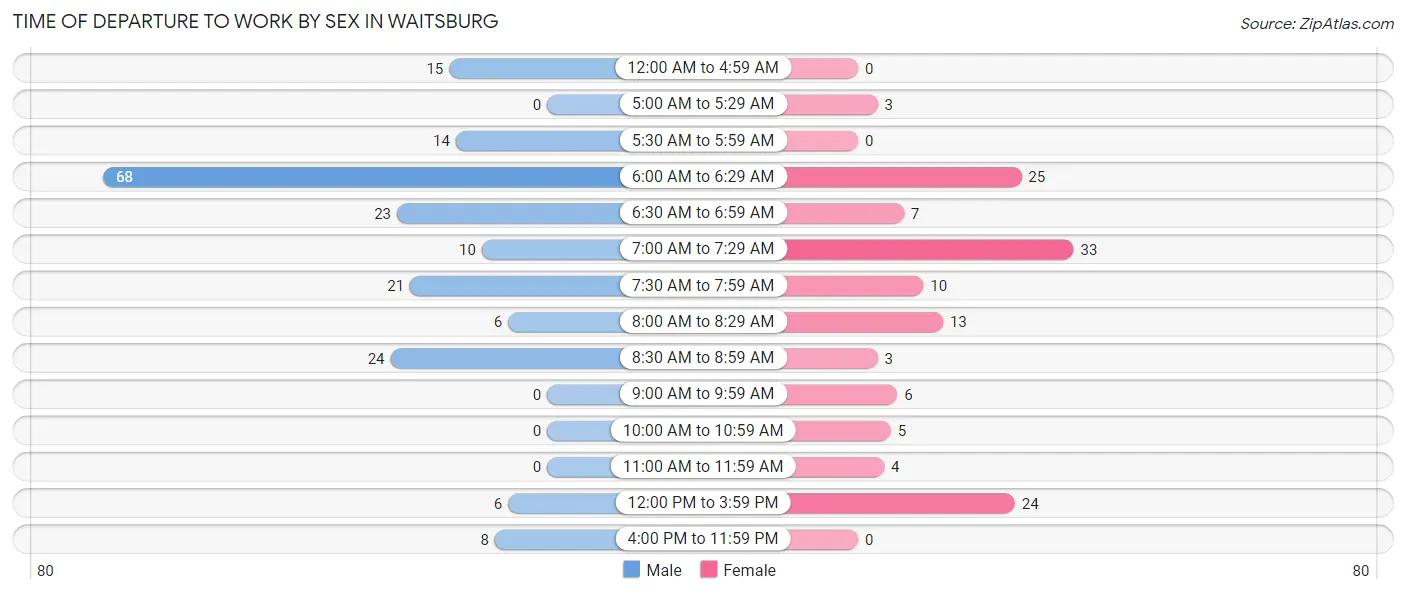
| Time of Departure | Male | Female |
| 12:00 AM to 4:59 AM | 15 (7.7%) | 0 (0.0%) |
| 5:00 AM to 5:29 AM | 0 (0.0%) | 3 (2.3%) |
| 5:30 AM to 5:59 AM | 14 (7.2%) | 0 (0.0%) |
| 6:00 AM to 6:29 AM | 68 (34.9%) | 25 (18.8%) |
| 6:30 AM to 6:59 AM | 23 (11.8%) | 7 (5.3%) |
| 7:00 AM to 7:29 AM | 10 (5.1%) | 33 (24.8%) |
| 7:30 AM to 7:59 AM | 21 (10.8%) | 10 (7.5%) |
| 8:00 AM to 8:29 AM | 6 (3.1%) | 13 (9.8%) |
| 8:30 AM to 8:59 AM | 24 (12.3%) | 3 (2.3%) |
| 9:00 AM to 9:59 AM | 0 (0.0%) | 6 (4.5%) |
| 10:00 AM to 10:59 AM | 0 (0.0%) | 5 (3.8%) |
| 11:00 AM to 11:59 AM | 0 (0.0%) | 4 (3.0%) |
| 12:00 PM to 3:59 PM | 6 (3.1%) | 24 (18.0%) |
| 4:00 PM to 11:59 PM | 8 (4.1%) | 0 (0.0%) |
| Total | 195 (100.0%) | 133 (100.0%) |
Housing Occupancy in Waitsburg
Occupancy by Ownership in Waitsburg
Of the total 397 dwellings in Waitsburg, owner-occupied units account for 286 (72.0%), while renter-occupied units make up 111 (28.0%).
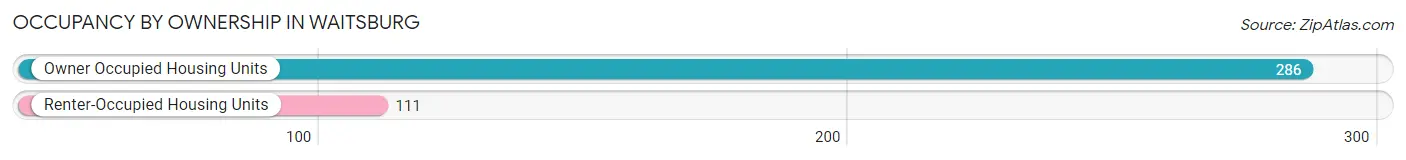
| Occupancy | # Housing Units | % Housing Units |
| Owner Occupied Housing Units | 286 | 72.0% |
| Renter-Occupied Housing Units | 111 | 28.0% |
| Total Occupied Housing Units | 397 | 100.0% |
Occupancy by Household Size in Waitsburg
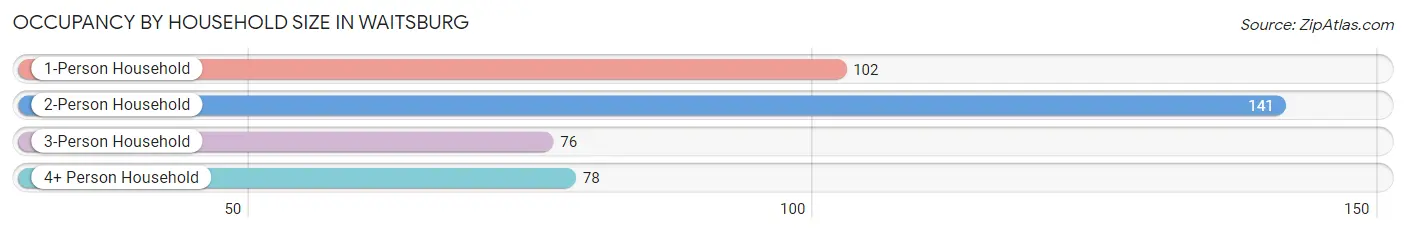
| Household Size | # Housing Units | % Housing Units |
| 1-Person Household | 102 | 25.7% |
| 2-Person Household | 141 | 35.5% |
| 3-Person Household | 76 | 19.1% |
| 4+ Person Household | 78 | 19.7% |
| Total Housing Units | 397 | 100.0% |
Occupancy by Ownership by Household Size in Waitsburg
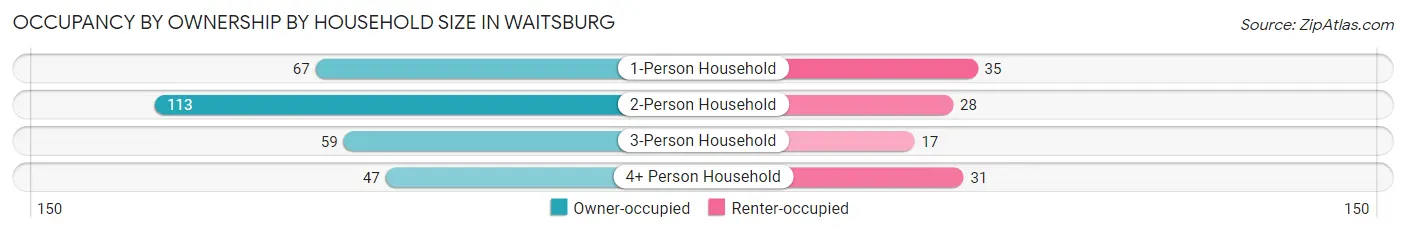
| Household Size | Owner-occupied | Renter-occupied |
| 1-Person Household | 67 (65.7%) | 35 (34.3%) |
| 2-Person Household | 113 (80.1%) | 28 (19.9%) |
| 3-Person Household | 59 (77.6%) | 17 (22.4%) |
| 4+ Person Household | 47 (60.3%) | 31 (39.7%) |
| Total Housing Units | 286 (72.0%) | 111 (28.0%) |
Occupancy by Educational Attainment in Waitsburg
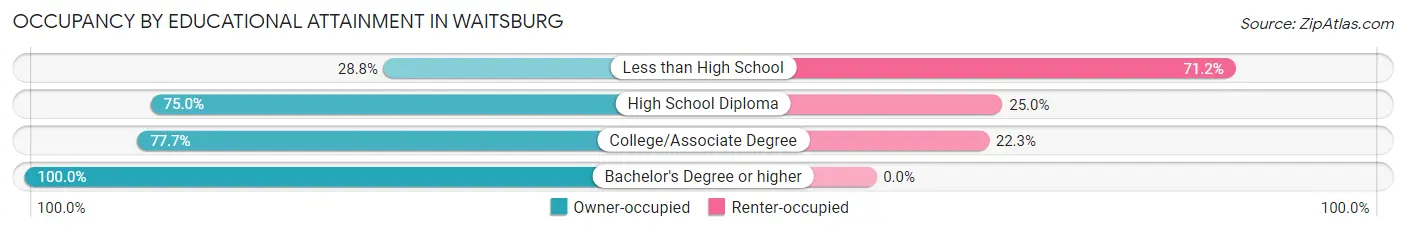
| Household Size | Owner-occupied | Renter-occupied |
| Less than High School | 21 (28.8%) | 52 (71.2%) |
| High School Diploma | 39 (75.0%) | 13 (25.0%) |
| College/Associate Degree | 160 (77.7%) | 46 (22.3%) |
| Bachelor's Degree or higher | 66 (100.0%) | 0 (0.0%) |
Occupancy by Age of Householder in Waitsburg
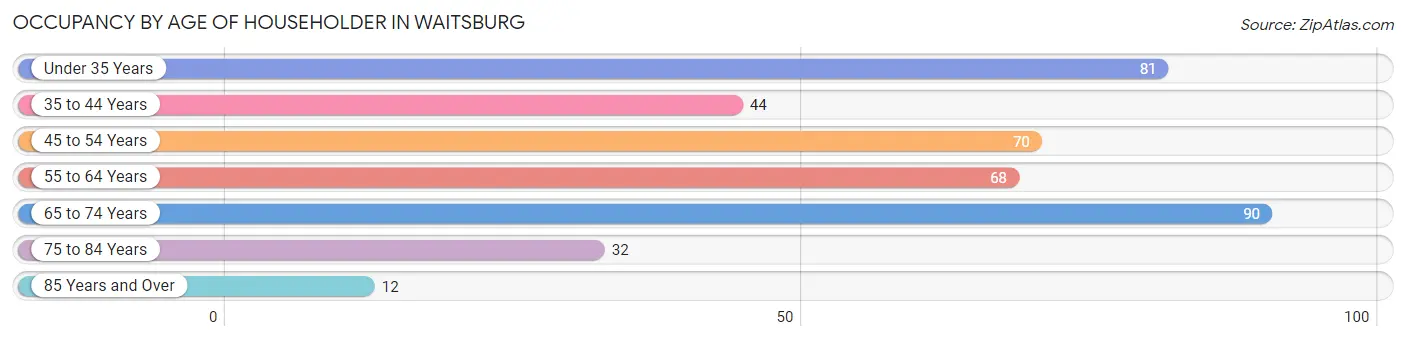
| Age Bracket | # Households | % Households |
| Under 35 Years | 81 | 20.4% |
| 35 to 44 Years | 44 | 11.1% |
| 45 to 54 Years | 70 | 17.6% |
| 55 to 64 Years | 68 | 17.1% |
| 65 to 74 Years | 90 | 22.7% |
| 75 to 84 Years | 32 | 8.1% |
| 85 Years and Over | 12 | 3.0% |
| Total | 397 | 100.0% |
Housing Finances in Waitsburg
Median Income by Occupancy in Waitsburg
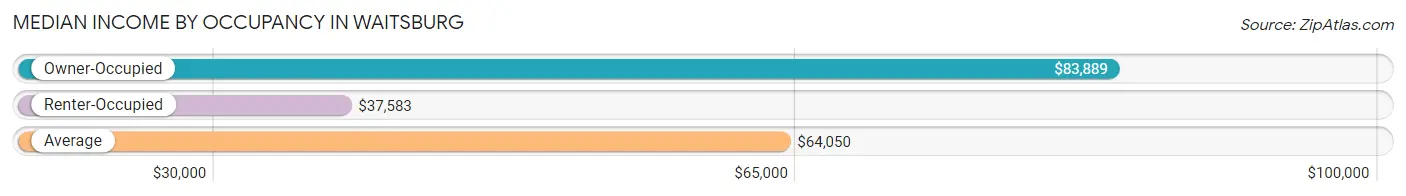
| Occupancy Type | # Households | Median Income |
| Owner-Occupied | 286 (72.0%) | $83,889 |
| Renter-Occupied | 111 (28.0%) | $37,583 |
| Average | 397 (100.0%) | $64,050 |
Occupancy by Householder Income Bracket in Waitsburg
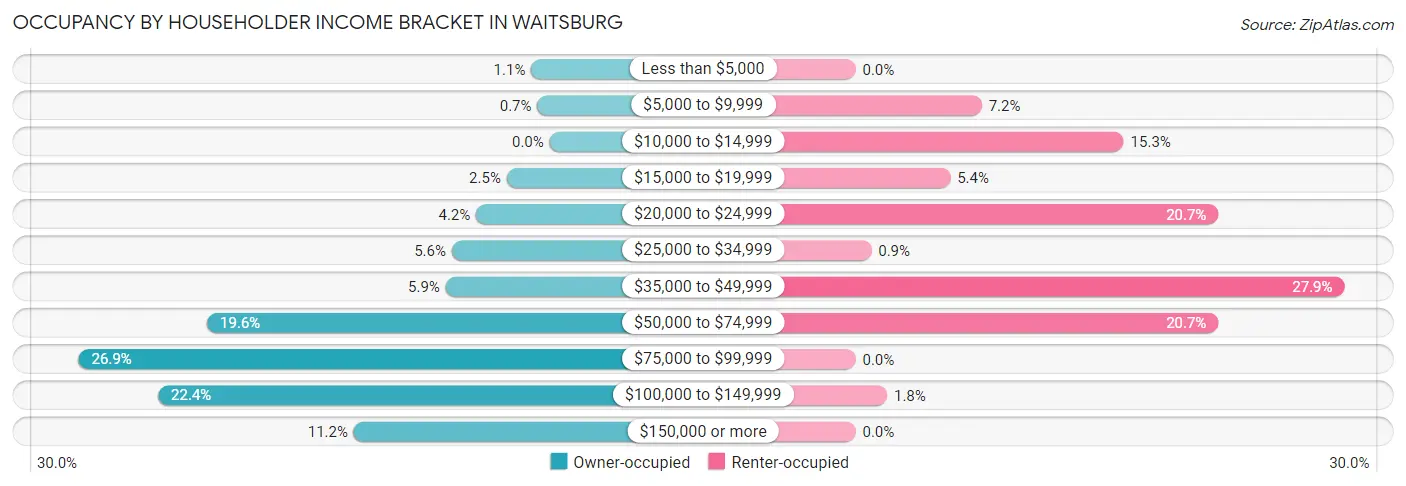
| Income Bracket | Owner-occupied | Renter-occupied |
| Less than $5,000 | 3 (1.1%) | 0 (0.0%) |
| $5,000 to $9,999 | 2 (0.7%) | 8 (7.2%) |
| $10,000 to $14,999 | 0 (0.0%) | 17 (15.3%) |
| $15,000 to $19,999 | 7 (2.5%) | 6 (5.4%) |
| $20,000 to $24,999 | 12 (4.2%) | 23 (20.7%) |
| $25,000 to $34,999 | 16 (5.6%) | 1 (0.9%) |
| $35,000 to $49,999 | 17 (5.9%) | 31 (27.9%) |
| $50,000 to $74,999 | 56 (19.6%) | 23 (20.7%) |
| $75,000 to $99,999 | 77 (26.9%) | 0 (0.0%) |
| $100,000 to $149,999 | 64 (22.4%) | 2 (1.8%) |
| $150,000 or more | 32 (11.2%) | 0 (0.0%) |
| Total | 286 (100.0%) | 111 (100.0%) |
Monthly Housing Cost Tiers in Waitsburg
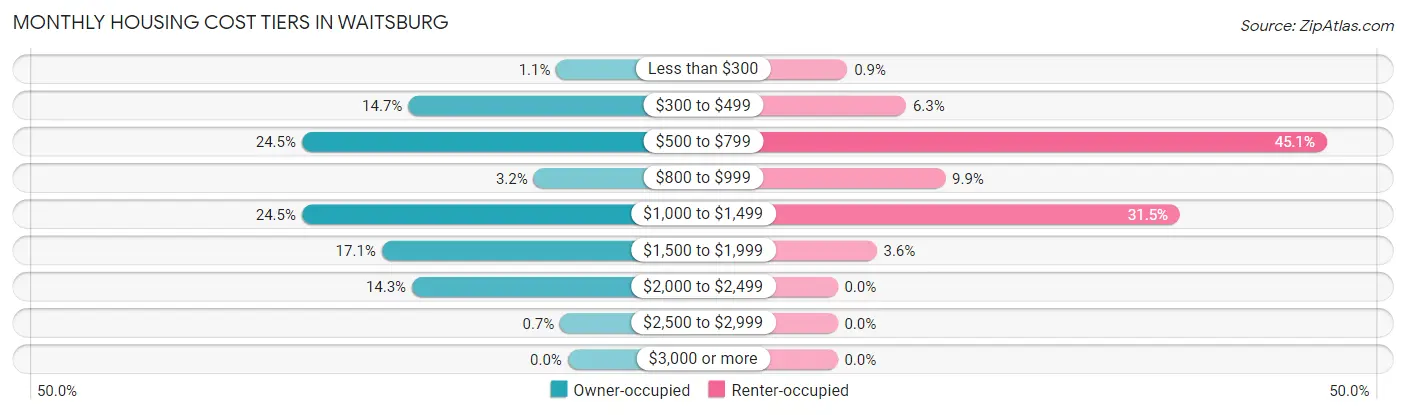
| Monthly Cost | Owner-occupied | Renter-occupied |
| Less than $300 | 3 (1.1%) | 1 (0.9%) |
| $300 to $499 | 42 (14.7%) | 7 (6.3%) |
| $500 to $799 | 70 (24.5%) | 50 (45.1%) |
| $800 to $999 | 9 (3.2%) | 11 (9.9%) |
| $1,000 to $1,499 | 70 (24.5%) | 35 (31.5%) |
| $1,500 to $1,999 | 49 (17.1%) | 4 (3.6%) |
| $2,000 to $2,499 | 41 (14.3%) | 0 (0.0%) |
| $2,500 to $2,999 | 2 (0.7%) | 0 (0.0%) |
| $3,000 or more | 0 (0.0%) | 0 (0.0%) |
| Total | 286 (100.0%) | 111 (100.0%) |
Physical Housing Characteristics in Waitsburg
Housing Structures in Waitsburg
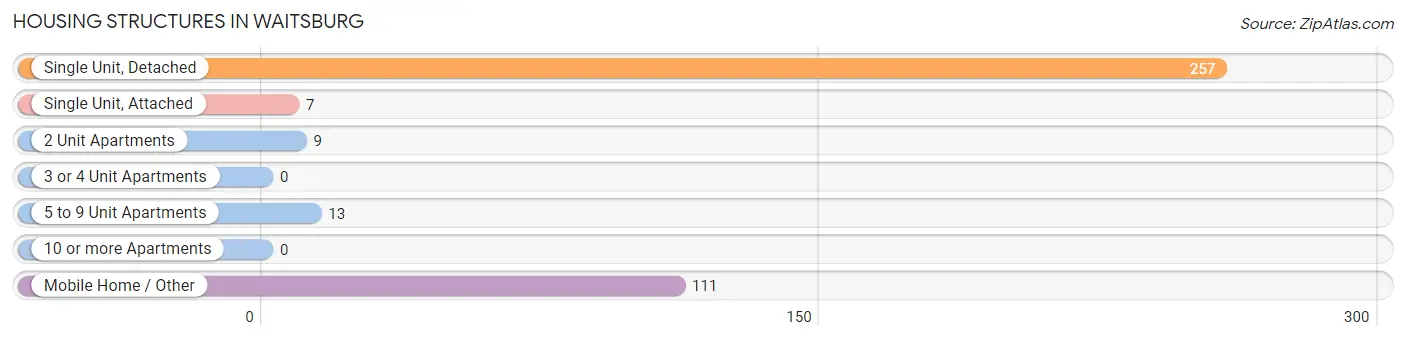
| Structure Type | # Housing Units | % Housing Units |
| Single Unit, Detached | 257 | 64.7% |
| Single Unit, Attached | 7 | 1.8% |
| 2 Unit Apartments | 9 | 2.3% |
| 3 or 4 Unit Apartments | 0 | 0.0% |
| 5 to 9 Unit Apartments | 13 | 3.3% |
| 10 or more Apartments | 0 | 0.0% |
| Mobile Home / Other | 111 | 28.0% |
| Total | 397 | 100.0% |
Housing Structures by Occupancy in Waitsburg
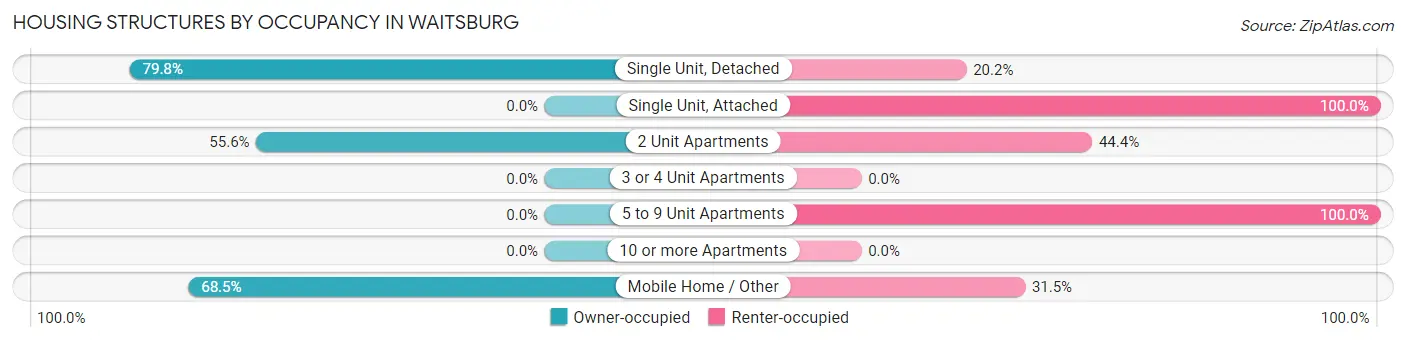
| Structure Type | Owner-occupied | Renter-occupied |
| Single Unit, Detached | 205 (79.8%) | 52 (20.2%) |
| Single Unit, Attached | 0 (0.0%) | 7 (100.0%) |
| 2 Unit Apartments | 5 (55.6%) | 4 (44.4%) |
| 3 or 4 Unit Apartments | 0 (0.0%) | 0 (0.0%) |
| 5 to 9 Unit Apartments | 0 (0.0%) | 13 (100.0%) |
| 10 or more Apartments | 0 (0.0%) | 0 (0.0%) |
| Mobile Home / Other | 76 (68.5%) | 35 (31.5%) |
| Total | 286 (72.0%) | 111 (28.0%) |
Housing Structures by Number of Rooms in Waitsburg
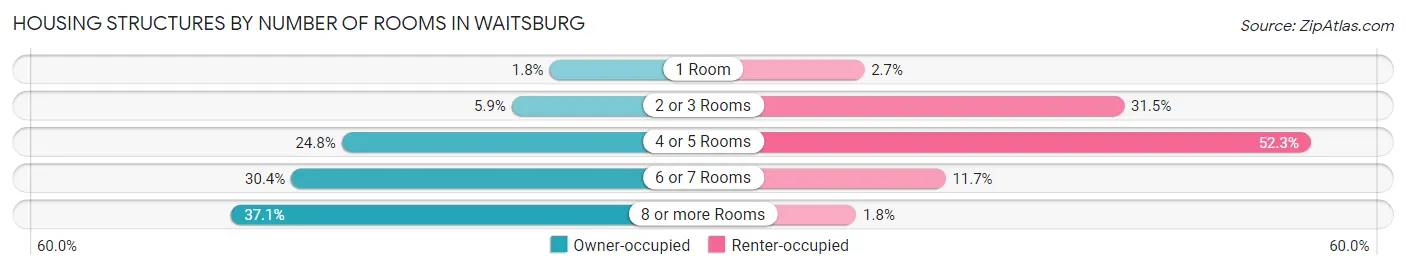
| Number of Rooms | Owner-occupied | Renter-occupied |
| 1 Room | 5 (1.8%) | 3 (2.7%) |
| 2 or 3 Rooms | 17 (5.9%) | 35 (31.5%) |
| 4 or 5 Rooms | 71 (24.8%) | 58 (52.2%) |
| 6 or 7 Rooms | 87 (30.4%) | 13 (11.7%) |
| 8 or more Rooms | 106 (37.1%) | 2 (1.8%) |
| Total | 286 (100.0%) | 111 (100.0%) |
Housing Structure by Heating Type in Waitsburg
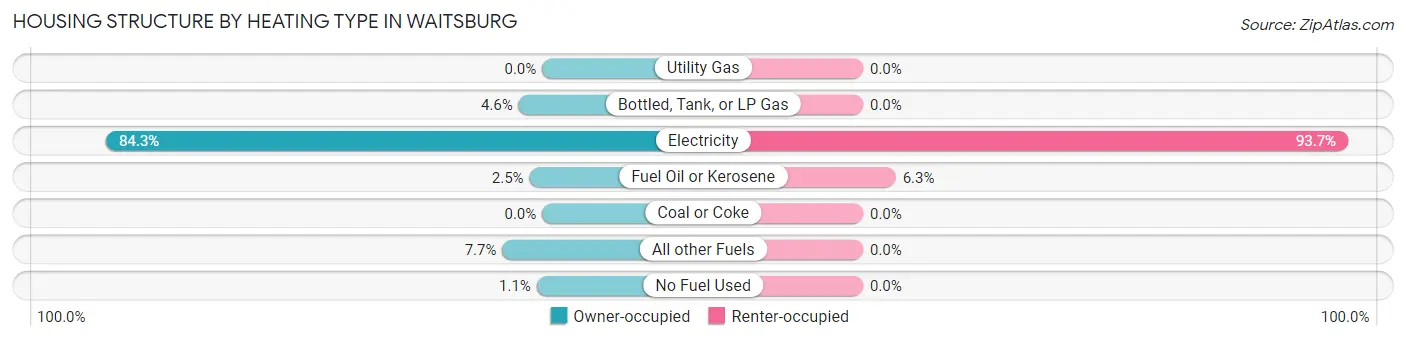
| Heating Type | Owner-occupied | Renter-occupied |
| Utility Gas | 0 (0.0%) | 0 (0.0%) |
| Bottled, Tank, or LP Gas | 13 (4.5%) | 0 (0.0%) |
| Electricity | 241 (84.3%) | 104 (93.7%) |
| Fuel Oil or Kerosene | 7 (2.5%) | 7 (6.3%) |
| Coal or Coke | 0 (0.0%) | 0 (0.0%) |
| All other Fuels | 22 (7.7%) | 0 (0.0%) |
| No Fuel Used | 3 (1.1%) | 0 (0.0%) |
| Total | 286 (100.0%) | 111 (100.0%) |
Household Vehicle Usage in Waitsburg
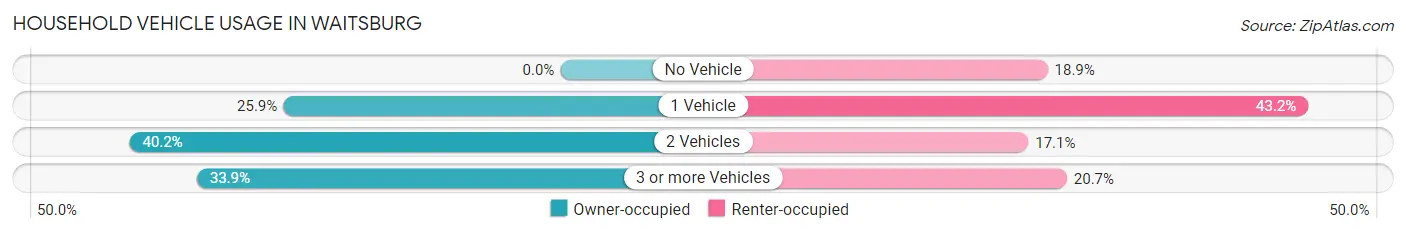
| Vehicles per Household | Owner-occupied | Renter-occupied |
| No Vehicle | 0 (0.0%) | 21 (18.9%) |
| 1 Vehicle | 74 (25.9%) | 48 (43.2%) |
| 2 Vehicles | 115 (40.2%) | 19 (17.1%) |
| 3 or more Vehicles | 97 (33.9%) | 23 (20.7%) |
| Total | 286 (100.0%) | 111 (100.0%) |
Real Estate & Mortgages in Waitsburg
Real Estate and Mortgage Overview in Waitsburg
| Characteristic | Without Mortgage | With Mortgage |
| Housing Units | 113 | 173 |
| Median Property Value | $223,500 | $246,500 |
| Median Household Income | $71,023 | $18 |
| Monthly Housing Costs | $533 | $0 |
| Real Estate Taxes | $1,818 | $3 |
Property Value by Mortgage Status in Waitsburg
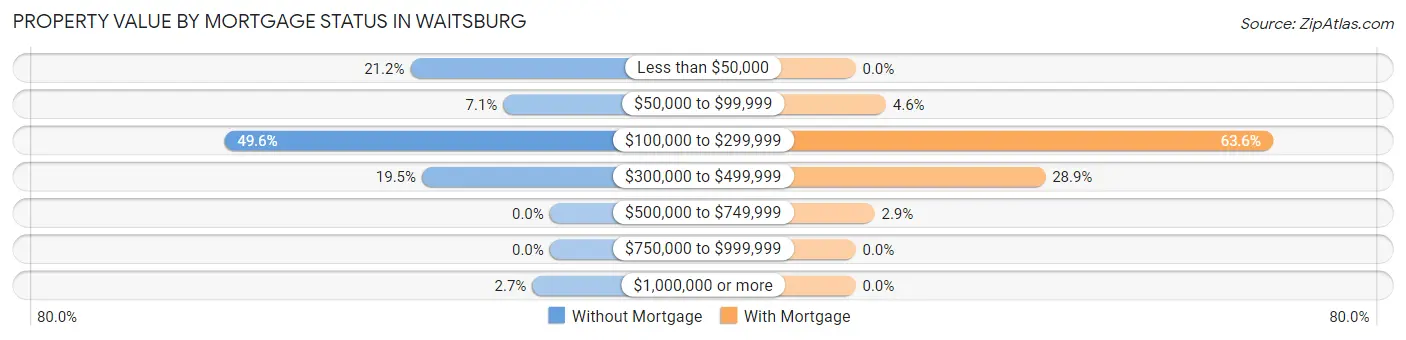
| Property Value | Without Mortgage | With Mortgage |
| Less than $50,000 | 24 (21.2%) | 0 (0.0%) |
| $50,000 to $99,999 | 8 (7.1%) | 8 (4.6%) |
| $100,000 to $299,999 | 56 (49.6%) | 110 (63.6%) |
| $300,000 to $499,999 | 22 (19.5%) | 50 (28.9%) |
| $500,000 to $749,999 | 0 (0.0%) | 5 (2.9%) |
| $750,000 to $999,999 | 0 (0.0%) | 0 (0.0%) |
| $1,000,000 or more | 3 (2.6%) | 0 (0.0%) |
| Total | 113 (100.0%) | 173 (100.0%) |
Household Income by Mortgage Status in Waitsburg
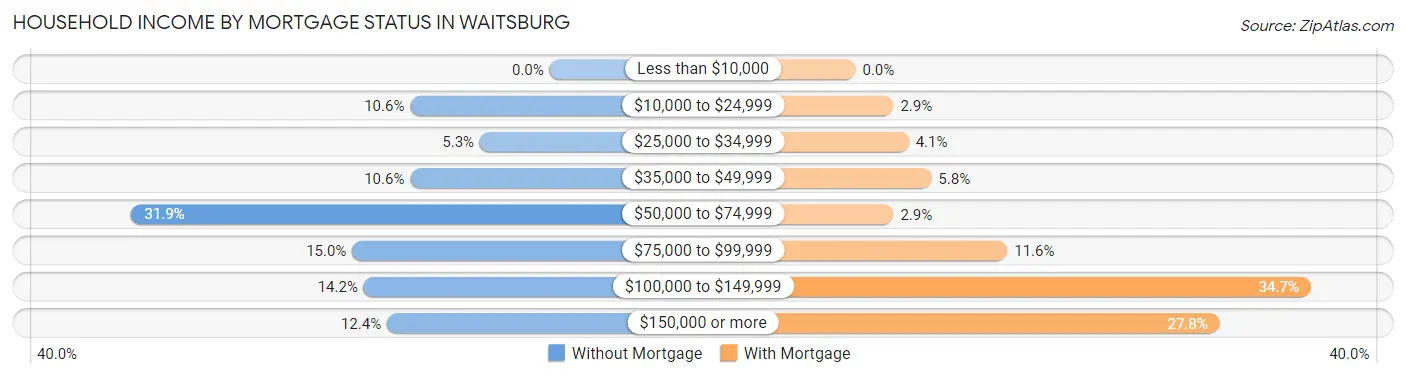
| Household Income | Without Mortgage | With Mortgage |
| Less than $10,000 | 0 (0.0%) | 0 (0.0%) |
| $10,000 to $24,999 | 12 (10.6%) | 5 (2.9%) |
| $25,000 to $34,999 | 6 (5.3%) | 7 (4.1%) |
| $35,000 to $49,999 | 12 (10.6%) | 10 (5.8%) |
| $50,000 to $74,999 | 36 (31.9%) | 5 (2.9%) |
| $75,000 to $99,999 | 17 (15.0%) | 20 (11.6%) |
| $100,000 to $149,999 | 16 (14.2%) | 60 (34.7%) |
| $150,000 or more | 14 (12.4%) | 48 (27.8%) |
| Total | 113 (100.0%) | 173 (100.0%) |
Property Value to Household Income Ratio in Waitsburg
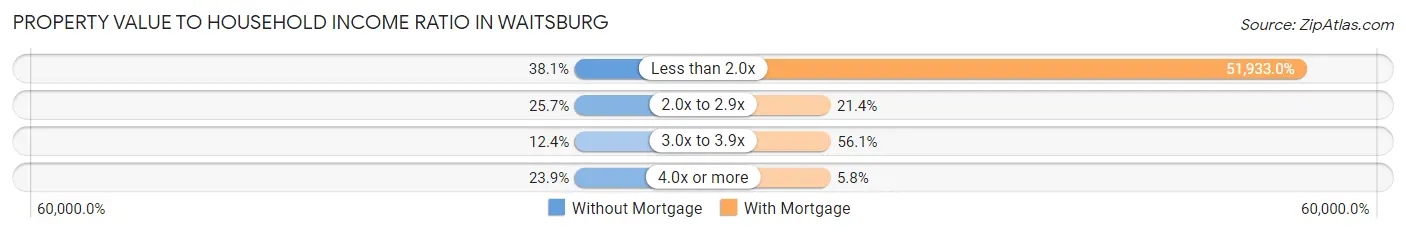
| Value-to-Income Ratio | Without Mortgage | With Mortgage |
| Less than 2.0x | 43 (38.1%) | 89,844 (51,933.0%) |
| 2.0x to 2.9x | 29 (25.7%) | 37 (21.4%) |
| 3.0x to 3.9x | 14 (12.4%) | 97 (56.1%) |
| 4.0x or more | 27 (23.9%) | 10 (5.8%) |
| Total | 113 (100.0%) | 173 (100.0%) |
Real Estate Taxes by Mortgage Status in Waitsburg
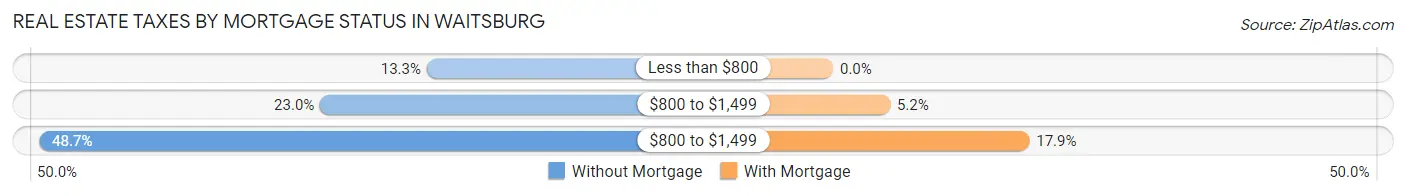
| Property Taxes | Without Mortgage | With Mortgage |
| Less than $800 | 15 (13.3%) | 0 (0.0%) |
| $800 to $1,499 | 26 (23.0%) | 9 (5.2%) |
| $800 to $1,499 | 55 (48.7%) | 31 (17.9%) |
| Total | 113 (100.0%) | 173 (100.0%) |
Health & Disability in Waitsburg
Health Insurance Coverage by Age in Waitsburg
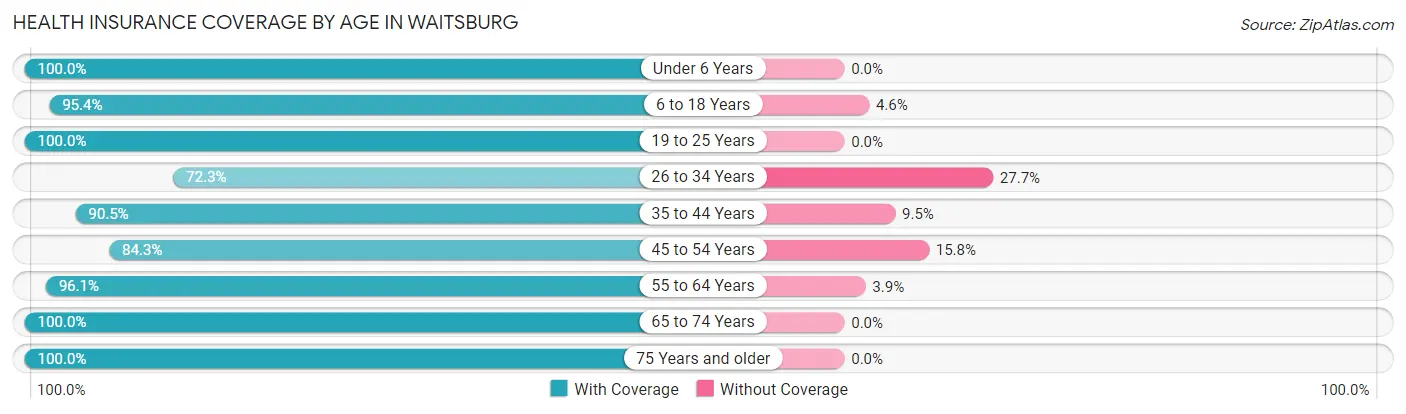
| Age Bracket | With Coverage | Without Coverage |
| Under 6 Years | 35 (100.0%) | 0 (0.0%) |
| 6 to 18 Years | 166 (95.4%) | 8 (4.6%) |
| 19 to 25 Years | 92 (100.0%) | 0 (0.0%) |
| 26 to 34 Years | 60 (72.3%) | 23 (27.7%) |
| 35 to 44 Years | 105 (90.5%) | 11 (9.5%) |
| 45 to 54 Years | 107 (84.3%) | 20 (15.8%) |
| 55 to 64 Years | 122 (96.1%) | 5 (3.9%) |
| 65 to 74 Years | 124 (100.0%) | 0 (0.0%) |
| 75 Years and older | 72 (100.0%) | 0 (0.0%) |
| Total | 883 (92.9%) | 67 (7.0%) |
Health Insurance Coverage by Citizenship Status in Waitsburg
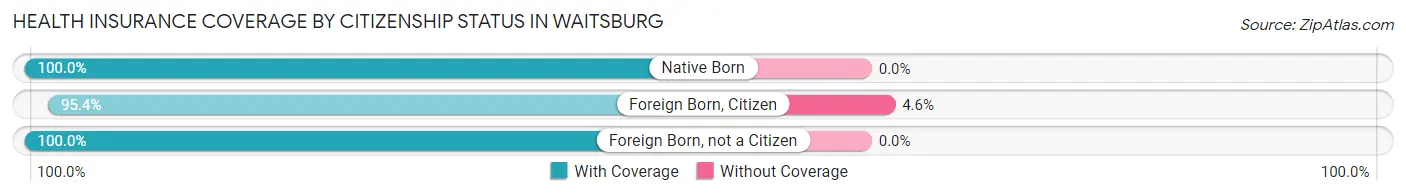
| Citizenship Status | With Coverage | Without Coverage |
| Native Born | 35 (100.0%) | 0 (0.0%) |
| Foreign Born, Citizen | 166 (95.4%) | 8 (4.6%) |
| Foreign Born, not a Citizen | 92 (100.0%) | 0 (0.0%) |
Health Insurance Coverage by Household Income in Waitsburg
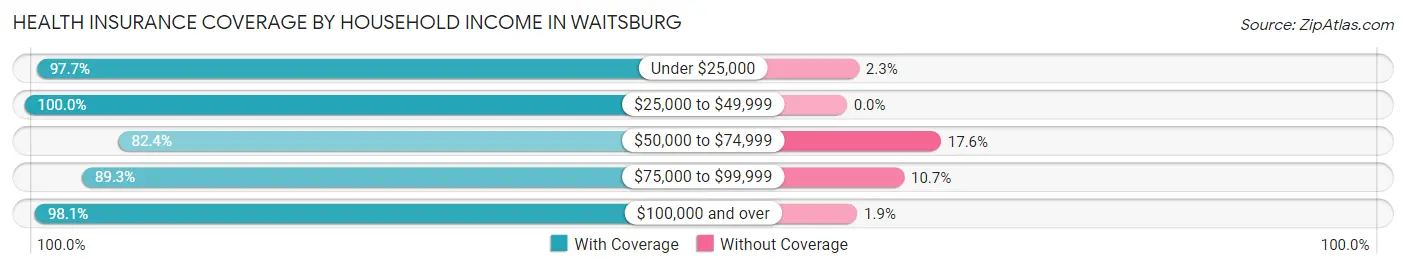
| Household Income | With Coverage | Without Coverage |
| Under $25,000 | 129 (97.7%) | 3 (2.3%) |
| $25,000 to $49,999 | 134 (100.0%) | 0 (0.0%) |
| $50,000 to $74,999 | 159 (82.4%) | 34 (17.6%) |
| $75,000 to $99,999 | 208 (89.3%) | 25 (10.7%) |
| $100,000 and over | 253 (98.1%) | 5 (1.9%) |
Public vs Private Health Insurance Coverage by Age in Waitsburg
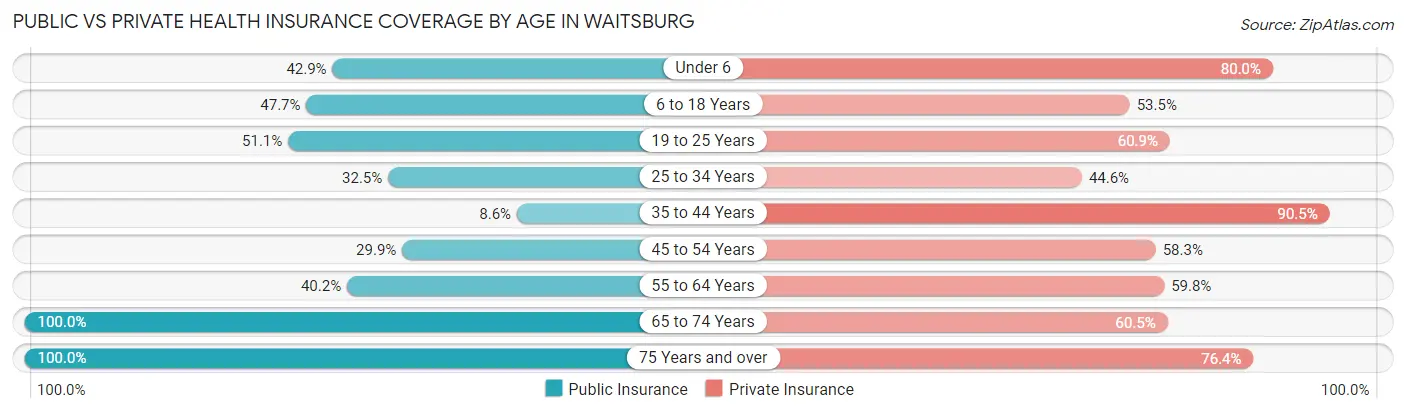
| Age Bracket | Public Insurance | Private Insurance |
| Under 6 | 15 (42.9%) | 28 (80.0%) |
| 6 to 18 Years | 83 (47.7%) | 93 (53.4%) |
| 19 to 25 Years | 47 (51.1%) | 56 (60.9%) |
| 25 to 34 Years | 27 (32.5%) | 37 (44.6%) |
| 35 to 44 Years | 10 (8.6%) | 105 (90.5%) |
| 45 to 54 Years | 38 (29.9%) | 74 (58.3%) |
| 55 to 64 Years | 51 (40.2%) | 76 (59.8%) |
| 65 to 74 Years | 124 (100.0%) | 75 (60.5%) |
| 75 Years and over | 72 (100.0%) | 55 (76.4%) |
| Total | 467 (49.2%) | 599 (63.0%) |
Disability Status by Sex by Age in Waitsburg
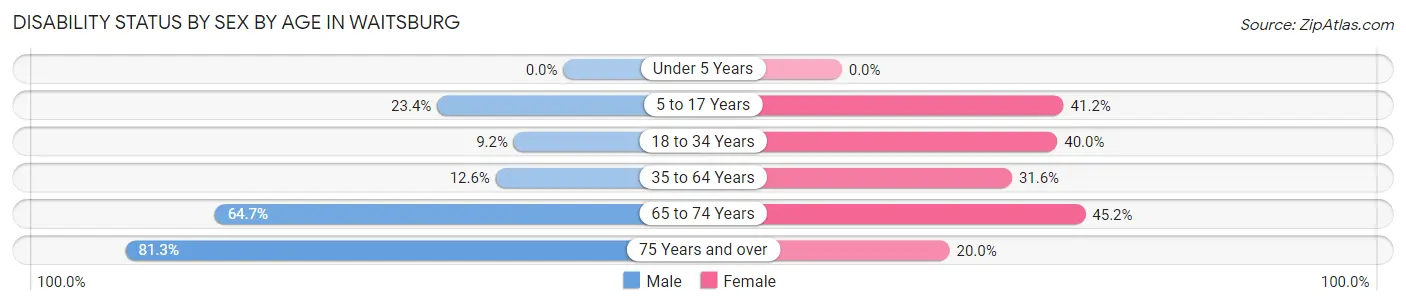
| Age Bracket | Male | Female |
| Under 5 Years | 0 (0.0%) | 0 (0.0%) |
| 5 to 17 Years | 26 (23.4%) | 28 (41.2%) |
| 18 to 34 Years | 8 (9.2%) | 38 (40.0%) |
| 35 to 64 Years | 25 (12.6%) | 54 (31.6%) |
| 65 to 74 Years | 33 (64.7%) | 33 (45.2%) |
| 75 Years and over | 26 (81.2%) | 8 (20.0%) |
Disability Class by Sex by Age in Waitsburg
Disability Class: Hearing Difficulty
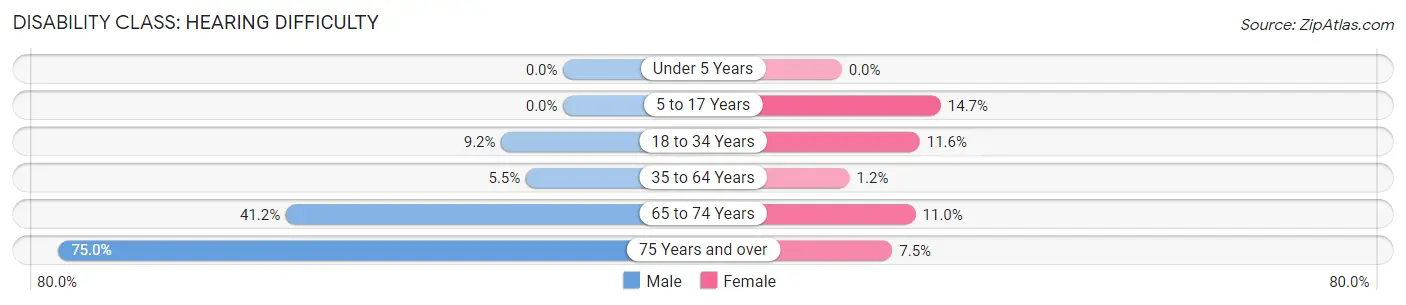
| Age Bracket | Male | Female |
| Under 5 Years | 0 (0.0%) | 0 (0.0%) |
| 5 to 17 Years | 0 (0.0%) | 10 (14.7%) |
| 18 to 34 Years | 8 (9.2%) | 11 (11.6%) |
| 35 to 64 Years | 11 (5.5%) | 2 (1.2%) |
| 65 to 74 Years | 21 (41.2%) | 8 (11.0%) |
| 75 Years and over | 24 (75.0%) | 3 (7.5%) |
Disability Class: Vision Difficulty
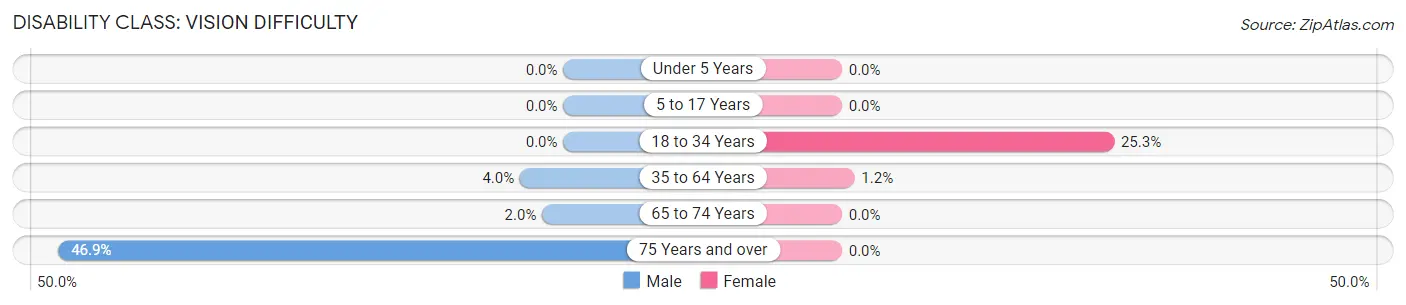
| Age Bracket | Male | Female |
| Under 5 Years | 0 (0.0%) | 0 (0.0%) |
| 5 to 17 Years | 0 (0.0%) | 0 (0.0%) |
| 18 to 34 Years | 0 (0.0%) | 24 (25.3%) |
| 35 to 64 Years | 8 (4.0%) | 2 (1.2%) |
| 65 to 74 Years | 1 (2.0%) | 0 (0.0%) |
| 75 Years and over | 15 (46.9%) | 0 (0.0%) |
Disability Class: Cognitive Difficulty
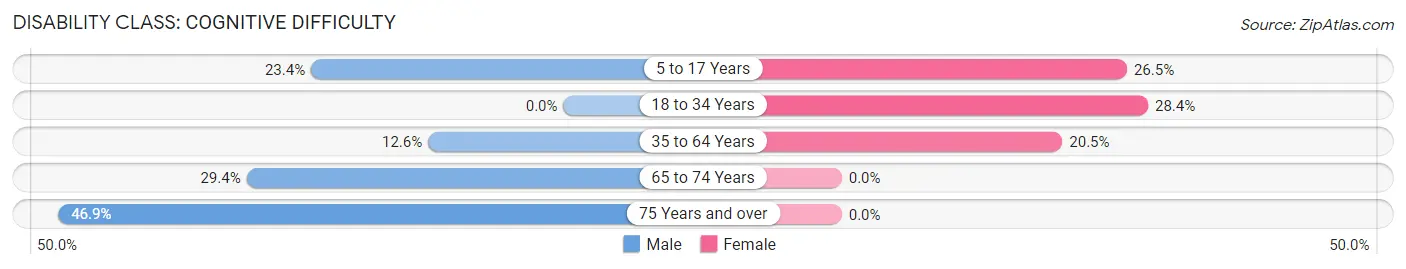
| Age Bracket | Male | Female |
| 5 to 17 Years | 26 (23.4%) | 18 (26.5%) |
| 18 to 34 Years | 0 (0.0%) | 27 (28.4%) |
| 35 to 64 Years | 25 (12.6%) | 35 (20.5%) |
| 65 to 74 Years | 15 (29.4%) | 0 (0.0%) |
| 75 Years and over | 15 (46.9%) | 0 (0.0%) |
Disability Class: Ambulatory Difficulty
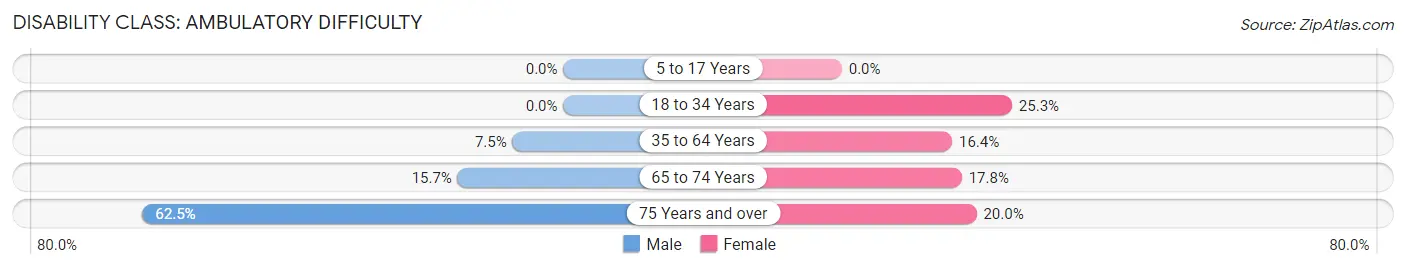
| Age Bracket | Male | Female |
| 5 to 17 Years | 0 (0.0%) | 0 (0.0%) |
| 18 to 34 Years | 0 (0.0%) | 24 (25.3%) |
| 35 to 64 Years | 15 (7.5%) | 28 (16.4%) |
| 65 to 74 Years | 8 (15.7%) | 13 (17.8%) |
| 75 Years and over | 20 (62.5%) | 8 (20.0%) |
Disability Class: Self-Care Difficulty
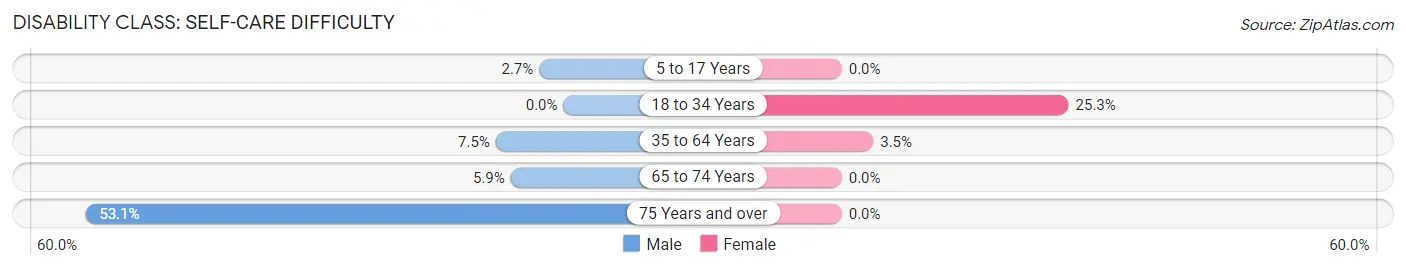
| Age Bracket | Male | Female |
| 5 to 17 Years | 3 (2.7%) | 0 (0.0%) |
| 18 to 34 Years | 0 (0.0%) | 24 (25.3%) |
| 35 to 64 Years | 15 (7.5%) | 6 (3.5%) |
| 65 to 74 Years | 3 (5.9%) | 0 (0.0%) |
| 75 Years and over | 17 (53.1%) | 0 (0.0%) |
Technology Access in Waitsburg
Computing Device Access in Waitsburg
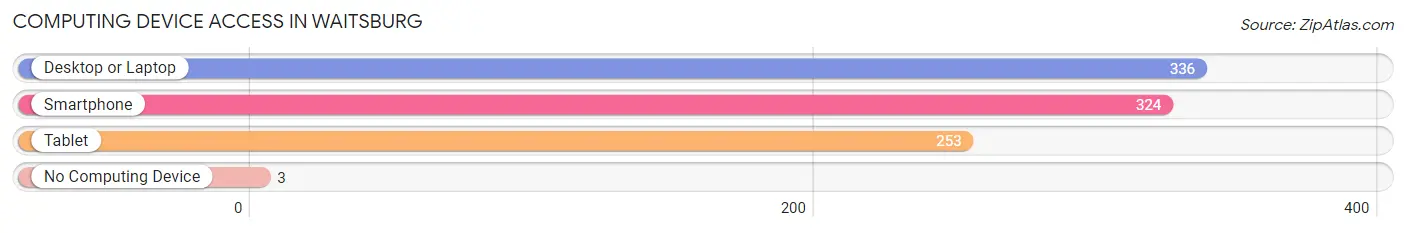
| Device Type | # Households | % Households |
| Desktop or Laptop | 336 | 84.6% |
| Smartphone | 324 | 81.6% |
| Tablet | 253 | 63.7% |
| No Computing Device | 3 | 0.8% |
| Total | 397 | 100.0% |
Internet Access in Waitsburg
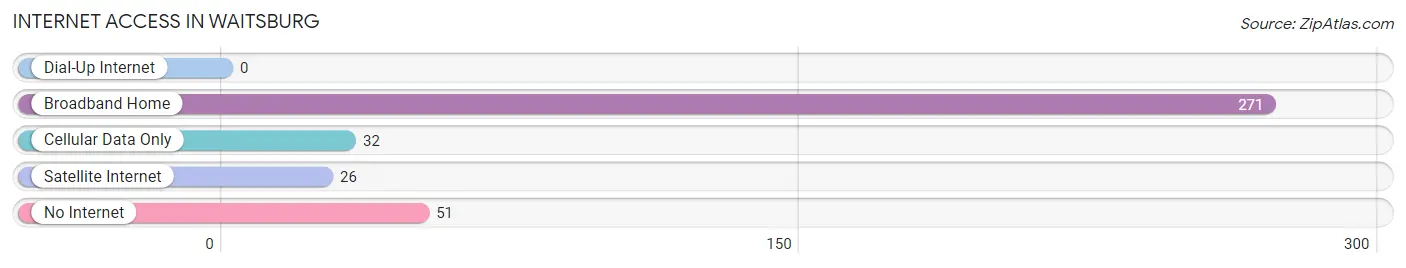
| Internet Type | # Households | % Households |
| Dial-Up Internet | 0 | 0.0% |
| Broadband Home | 271 | 68.3% |
| Cellular Data Only | 32 | 8.1% |
| Satellite Internet | 26 | 6.6% |
| No Internet | 51 | 12.9% |
| Total | 397 | 100.0% |
Waitsburg Summary
Waitsburg, Washington is a small town located in the southeastern corner of the state, in Walla Walla County. It is situated on the banks of the Touchet River, and is surrounded by rolling hills and farmland. The town has a population of just over 1,000 people, and is known for its small-town charm and friendly atmosphere.
History
Waitsburg was founded in 1859 by a group of settlers from the Oregon Trail. The town was named after the first settler, William Waite, who had a homestead in the area. The town quickly grew, and by the late 1800s, it had become a thriving agricultural center. The town was incorporated in 1883, and the first mayor was elected in 1884.
In the early 1900s, Waitsburg was a major producer of wheat, and the town was home to several flour mills. The town also had a thriving lumber industry, and several sawmills were located in the area. In the 1920s, the town was home to a large cannery, which canned fruits and vegetables for the local market.
Geography
Waitsburg is located in the southeastern corner of Washington, in Walla Walla County. The town is situated on the banks of the Touchet River, and is surrounded by rolling hills and farmland. The town is located at an elevation of 1,068 feet, and has a total area of 1.2 square miles.
The climate in Waitsburg is semi-arid, with hot summers and cold winters. The average annual temperature is around 50 degrees Fahrenheit, and the average annual precipitation is around 12 inches.
Economy
The economy of Waitsburg is largely based on agriculture. The town is home to several farms, and the surrounding area is known for its production of wheat, barley, and other grains. The town is also home to several wineries, and the local wine industry is a major contributor to the local economy.
In addition to agriculture, Waitsburg is home to several small businesses, including restaurants, shops, and other services. The town is also home to a small manufacturing sector, and several companies produce a variety of products, including furniture, clothing, and electronics.
Demographics
As of the 2010 census, Waitsburg had a population of 1,093 people. The racial makeup of the town was 94.3% White, 0.7% African American, 0.7% Native American, 0.7% Asian, 0.1% Pacific Islander, and 2.6% from other races. The median household income was $37,500, and the median family income was $45,000.
Waitsburg is a small town with a friendly atmosphere and a strong sense of community. The town is home to several churches, and the local school district is highly rated. The town is also home to several parks and recreational areas, and the local library is a popular destination for residents and visitors alike.
Common Questions
What is Per Capita Income in Waitsburg?
Per Capita income in Waitsburg is $34,054.
What is the Median Family Income in Waitsburg?
Median Family Income in Waitsburg is $60,521.
What is the Median Household income in Waitsburg?
Median Household Income in Waitsburg is $64,050.
What is Income or Wage Gap in Waitsburg?
Income or Wage Gap in Waitsburg is 50.9%.
Women in Waitsburg earn 49.1 cents for every dollar earned by a man.
What is Inequality or Gini Index in Waitsburg?
Inequality or Gini Index in Waitsburg is 0.41.
What is the Total Population of Waitsburg?
Total Population of Waitsburg is 956.
What is the Total Male Population of Waitsburg?
Total Male Population of Waitsburg is 488.
What is the Total Female Population of Waitsburg?
Total Female Population of Waitsburg is 468.
What is the Ratio of Males per 100 Females in Waitsburg?
There are 104.27 Males per 100 Females in Waitsburg.
What is the Ratio of Females per 100 Males in Waitsburg?
There are 95.90 Females per 100 Males in Waitsburg.
What is the Median Population Age in Waitsburg?
Median Population Age in Waitsburg is 44.4 Years.
What is the Average Family Size in Waitsburg
Average Family Size in Waitsburg is 2.8 People.
What is the Average Household Size in Waitsburg
Average Household Size in Waitsburg is 2.4 People.
How Large is the Labor Force in Waitsburg?
There are 415 People in the Labor Forcein in Waitsburg.
What is the Percentage of People in the Labor Force in Waitsburg?
53.5% of People are in the Labor Force in Waitsburg.
What is the Unemployment Rate in Waitsburg?
Unemployment Rate in Waitsburg is 6.4%.