Cherry Grove, WA Map & Demographics
Cherry Grove Map
Cherry Grove Overview
$58,388
PER CAPITA INCOME
$233,558
AVG FAMILY INCOME
0.37
INEQUALITY / GINI INDEX
456
TOTAL POPULATION
254
MALE POPULATION
202
FEMALE POPULATION
125.74
MALES / 100 FEMALES
79.53
FEMALES / 100 MALES
54.7
MEDIAN AGE
3.2
AVG FAMILY SIZE
3.0
AVG HOUSEHOLD SIZE
209
LABOR FORCE [ PEOPLE ]
49.4%
PERCENT IN LABOR FORCE
Income in Cherry Grove
Income Overview in Cherry Grove
| Characteristic | Number | Measure |
| Per Capita Income | 456 | $58,388 |
| Median Family Income | 133 | $233,558 |
| Mean Family Income | 133 | $194,659 |
| Median Household Income | 149 | $0 |
| Mean Household Income | 149 | $176,591 |
| Income Deficit | 133 | $0 |
| Wage / Income Gap (%) | 456 | 0.00% |
| Wage / Income Gap ($) | 456 | 100.00¢ per $1 |
| Gini / Inequality Index | 456 | 0.37 |
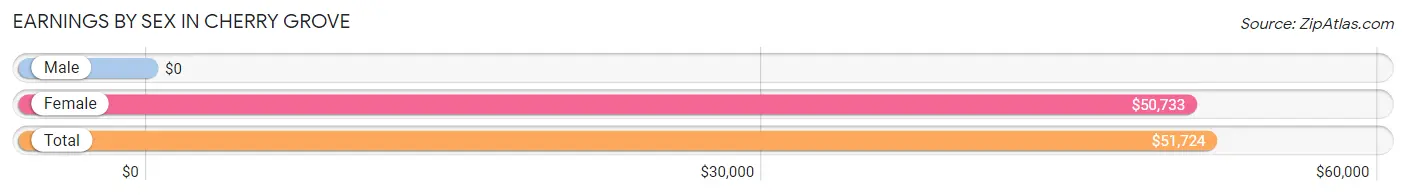
Earnings by Sex in Cherry Grove
| Sex | Number | Average Earnings |
| Male | 145 (65.9%) | $0 |
| Female | 75 (34.1%) | $50,733 |
| Total | 220 (100.0%) | $51,724 |
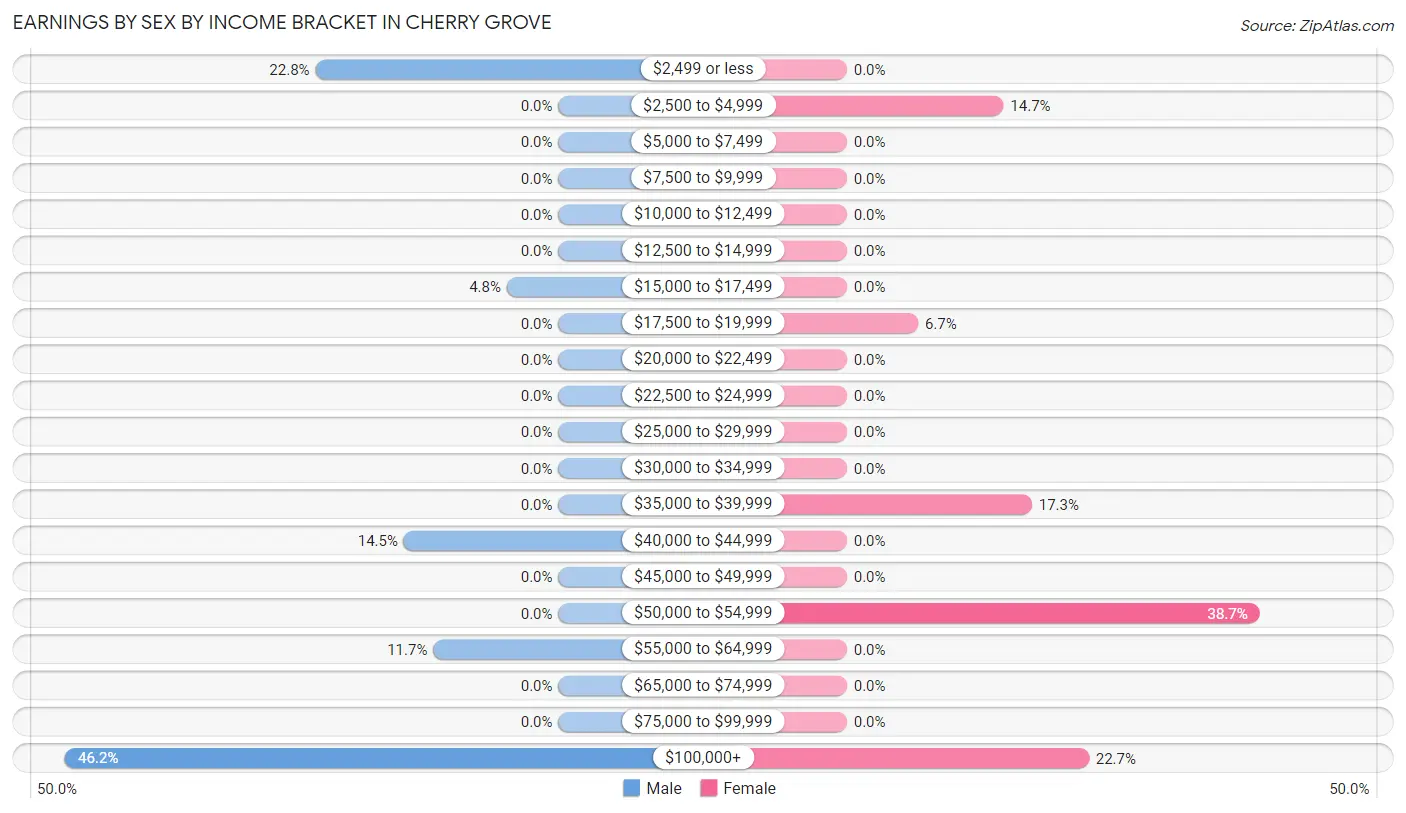
Earnings by Sex by Income Bracket in Cherry Grove
The most common earnings brackets in Cherry Grove are $100,000+ for men (67 | 46.2%) and $50,000 to $54,999 for women (29 | 38.7%).
| Income | Male | Female |
| $2,499 or less | 33 (22.8%) | 0 (0.0%) |
| $2,500 to $4,999 | 0 (0.0%) | 11 (14.7%) |
| $5,000 to $7,499 | 0 (0.0%) | 0 (0.0%) |
| $7,500 to $9,999 | 0 (0.0%) | 0 (0.0%) |
| $10,000 to $12,499 | 0 (0.0%) | 0 (0.0%) |
| $12,500 to $14,999 | 0 (0.0%) | 0 (0.0%) |
| $15,000 to $17,499 | 7 (4.8%) | 0 (0.0%) |
| $17,500 to $19,999 | 0 (0.0%) | 5 (6.7%) |
| $20,000 to $22,499 | 0 (0.0%) | 0 (0.0%) |
| $22,500 to $24,999 | 0 (0.0%) | 0 (0.0%) |
| $25,000 to $29,999 | 0 (0.0%) | 0 (0.0%) |
| $30,000 to $34,999 | 0 (0.0%) | 0 (0.0%) |
| $35,000 to $39,999 | 0 (0.0%) | 13 (17.3%) |
| $40,000 to $44,999 | 21 (14.5%) | 0 (0.0%) |
| $45,000 to $49,999 | 0 (0.0%) | 0 (0.0%) |
| $50,000 to $54,999 | 0 (0.0%) | 29 (38.7%) |
| $55,000 to $64,999 | 17 (11.7%) | 0 (0.0%) |
| $65,000 to $74,999 | 0 (0.0%) | 0 (0.0%) |
| $75,000 to $99,999 | 0 (0.0%) | 0 (0.0%) |
| $100,000+ | 67 (46.2%) | 17 (22.7%) |
| Total | 145 (100.0%) | 75 (100.0%) |
Earnings by Sex by Educational Attainment in Cherry Grove
| Educational Attainment | Male Income | Female Income |
| Less than High School | - | - |
| High School Diploma | - | - |
| College or Associate's Degree | - | - |
| Bachelor's Degree | - | - |
| Graduate Degree | - | - |
| Total | - | - |
Family Income in Cherry Grove
Family Income Brackets in Cherry Grove
According to the Cherry Grove family income data, there are 78 families falling into the $200,000+ income range, which is the most common income bracket and makes up 58.7% of all families.
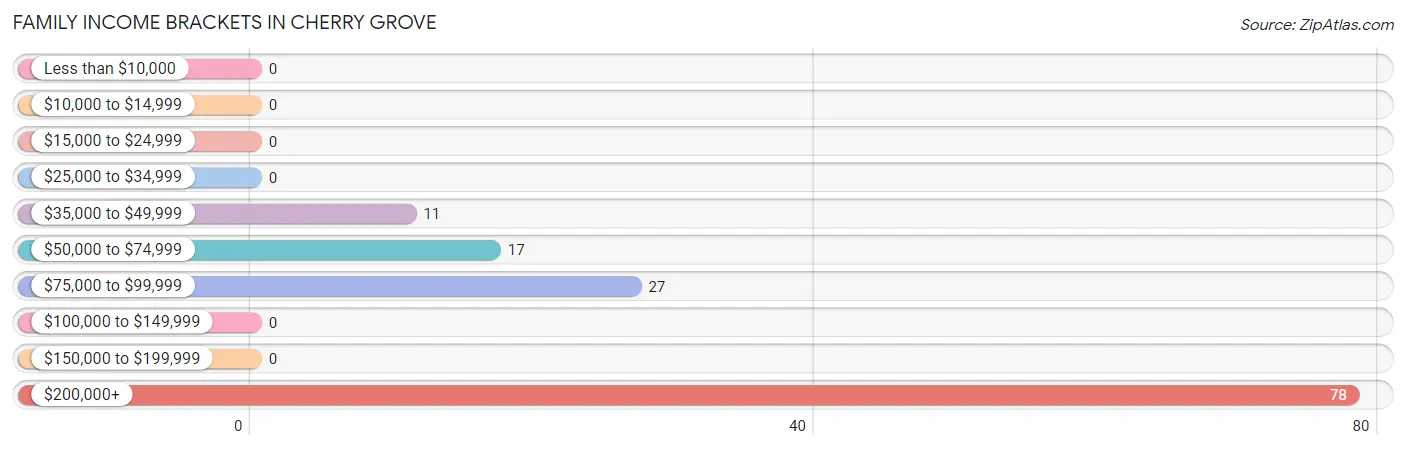
| Income Bracket | # Families | % Families |
| Less than $10,000 | 0 | 0.0% |
| $10,000 to $14,999 | 0 | 0.0% |
| $15,000 to $24,999 | 0 | 0.0% |
| $25,000 to $34,999 | 0 | 0.0% |
| $35,000 to $49,999 | 11 | 8.3% |
| $50,000 to $74,999 | 17 | 12.8% |
| $75,000 to $99,999 | 27 | 20.3% |
| $100,000 to $149,999 | 0 | 0.0% |
| $150,000 to $199,999 | 0 | 0.0% |
| $200,000+ | 78 | 58.6% |
Family Income by Famaliy Size in Cherry Grove
4-person families (76 | 57.1%) account for the highest median family income in Cherry Grove with $250,001 per family, while 4-person families (76 | 57.1%) have the highest median income of $62,500 per family member.
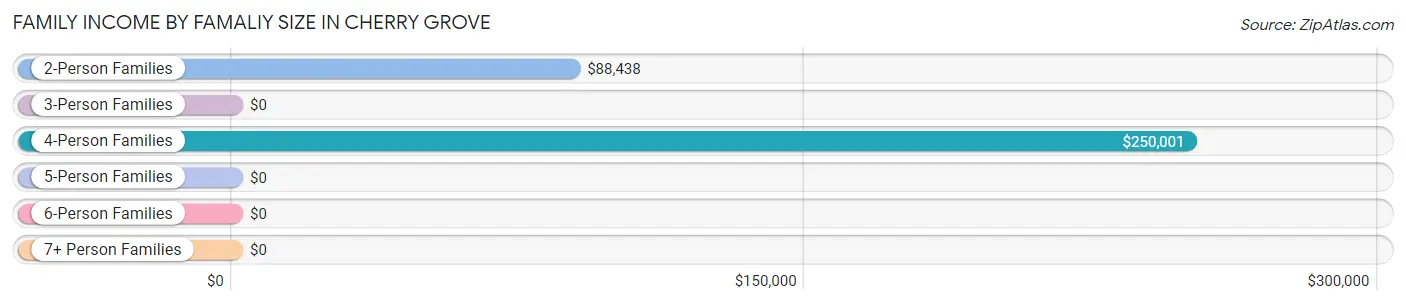
| Income Bracket | # Families | Median Income |
| 2-Person Families | 51 (38.4%) | $88,438 |
| 3-Person Families | 0 (0.0%) | $0 |
| 4-Person Families | 76 (57.1%) | $250,001 |
| 5-Person Families | 6 (4.5%) | $0 |
| 6-Person Families | 0 (0.0%) | $0 |
| 7+ Person Families | 0 (0.0%) | $0 |
| Total | 133 (100.0%) | $233,558 |
Family Income by Number of Earners in Cherry Grove
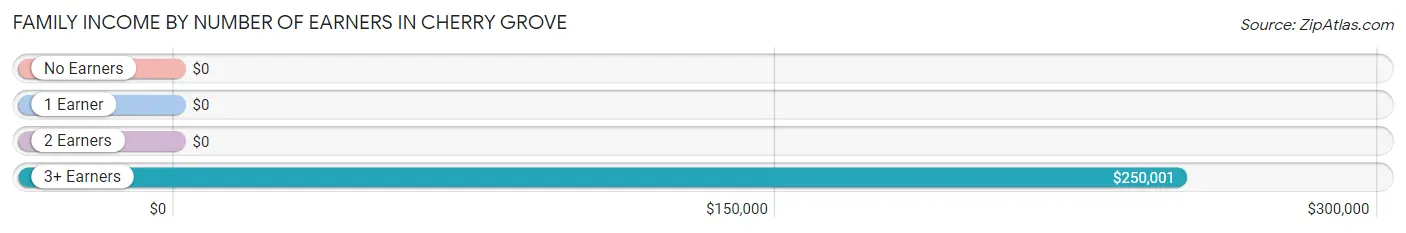
| Number of Earners | # Families | Median Income |
| No Earners | 44 (33.1%) | $0 |
| 1 Earner | 24 (18.0%) | $0 |
| 2 Earners | 17 (12.8%) | $0 |
| 3+ Earners | 48 (36.1%) | $250,001 |
| Total | 133 (100.0%) | $233,558 |
Household Income in Cherry Grove
Household Income Brackets in Cherry Grove
With 78 households falling in the category, the $200,000+ income range is the most frequent in Cherry Grove, accounting for 52.3% of all households.
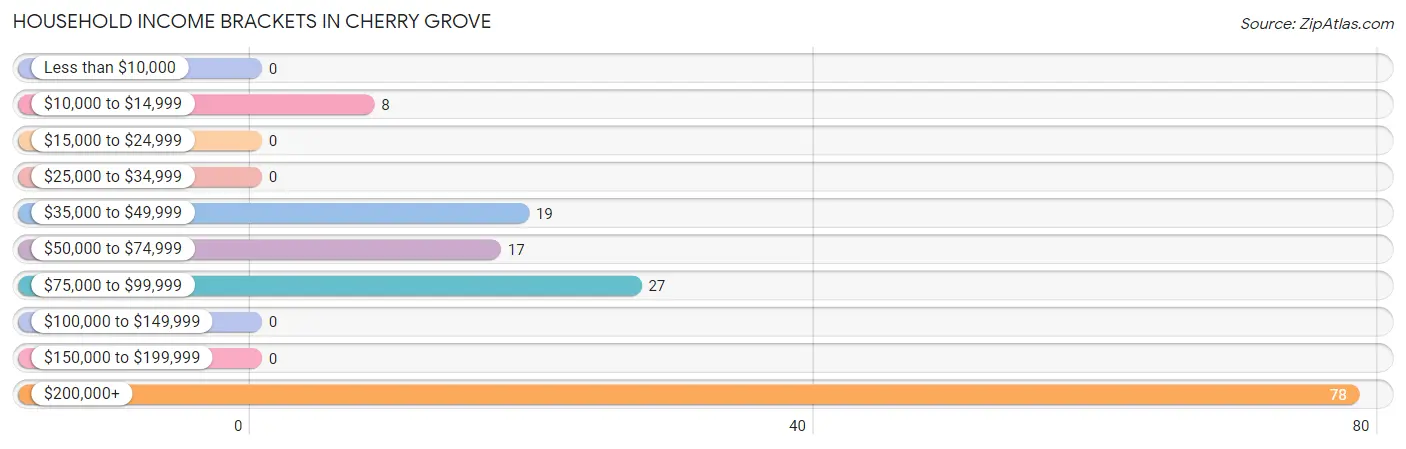
| Income Bracket | # Households | % Households |
| Less than $10,000 | 0 | 0.0% |
| $10,000 to $14,999 | 8 | 5.4% |
| $15,000 to $24,999 | 0 | 0.0% |
| $25,000 to $34,999 | 0 | 0.0% |
| $35,000 to $49,999 | 19 | 12.8% |
| $50,000 to $74,999 | 17 | 11.4% |
| $75,000 to $99,999 | 27 | 18.1% |
| $100,000 to $149,999 | 0 | 0.0% |
| $150,000 to $199,999 | 0 | 0.0% |
| $200,000+ | 78 | 52.3% |
Household Income by Householder Age in Cherry Grove
| Income Bracket | # Households | Median Income |
| 15 to 24 Years | 0 (0.0%) | $0 |
| 25 to 44 Years | 0 (0.0%) | $0 |
| 45 to 64 Years | 61 (40.9%) | $0 |
| 65+ Years | 88 (59.1%) | $0 |
| Total | 149 (100.0%) | $0 |
Poverty in Cherry Grove
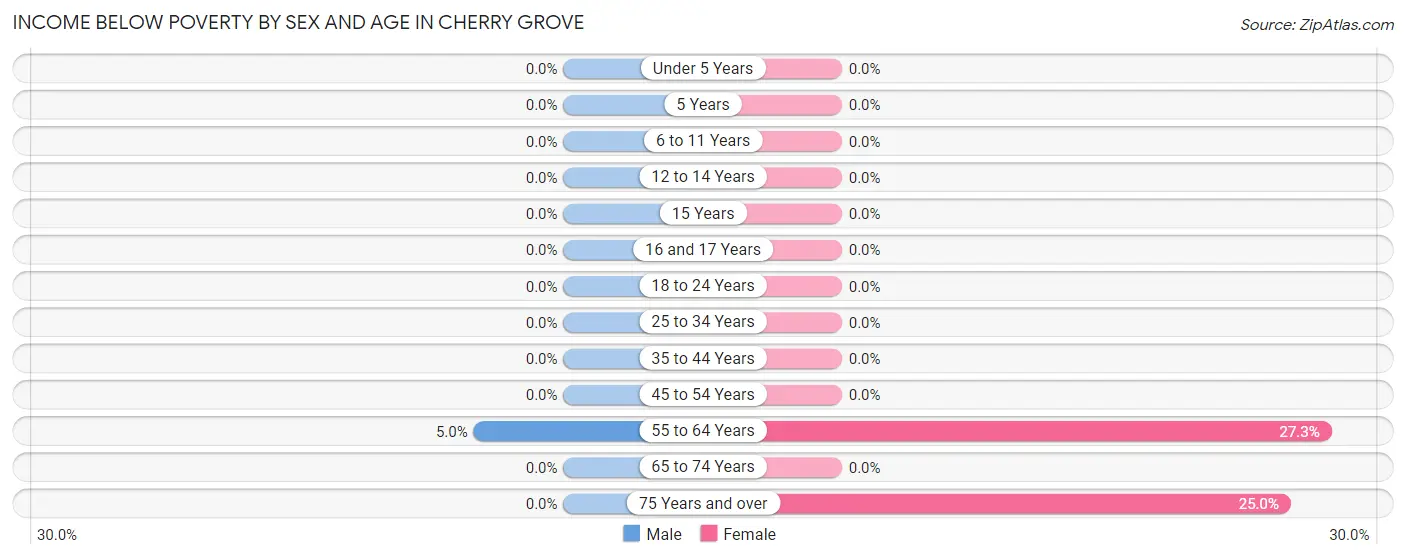
Income Below Poverty by Sex and Age in Cherry Grove
With 0.8% poverty level for males and 7.4% for females among the residents of Cherry Grove, 55 to 64 year old males and 55 to 64 year old females are the most vulnerable to poverty, with 2 males (5.0%) and 6 females (27.3%) in their respective age groups living below the poverty level.
| Age Bracket | Male | Female |
| Under 5 Years | 0 (0.0%) | 0 (0.0%) |
| 5 Years | 0 (0.0%) | 0 (0.0%) |
| 6 to 11 Years | 0 (0.0%) | 0 (0.0%) |
| 12 to 14 Years | 0 (0.0%) | 0 (0.0%) |
| 15 Years | 0 (0.0%) | 0 (0.0%) |
| 16 and 17 Years | 0 (0.0%) | 0 (0.0%) |
| 18 to 24 Years | 0 (0.0%) | 0 (0.0%) |
| 25 to 34 Years | 0 (0.0%) | 0 (0.0%) |
| 35 to 44 Years | 0 (0.0%) | 0 (0.0%) |
| 45 to 54 Years | 0 (0.0%) | 0 (0.0%) |
| 55 to 64 Years | 2 (5.0%) | 6 (27.3%) |
| 65 to 74 Years | 0 (0.0%) | 0 (0.0%) |
| 75 Years and over | 0 (0.0%) | 9 (25.0%) |
| Total | 2 (0.8%) | 15 (7.4%) |
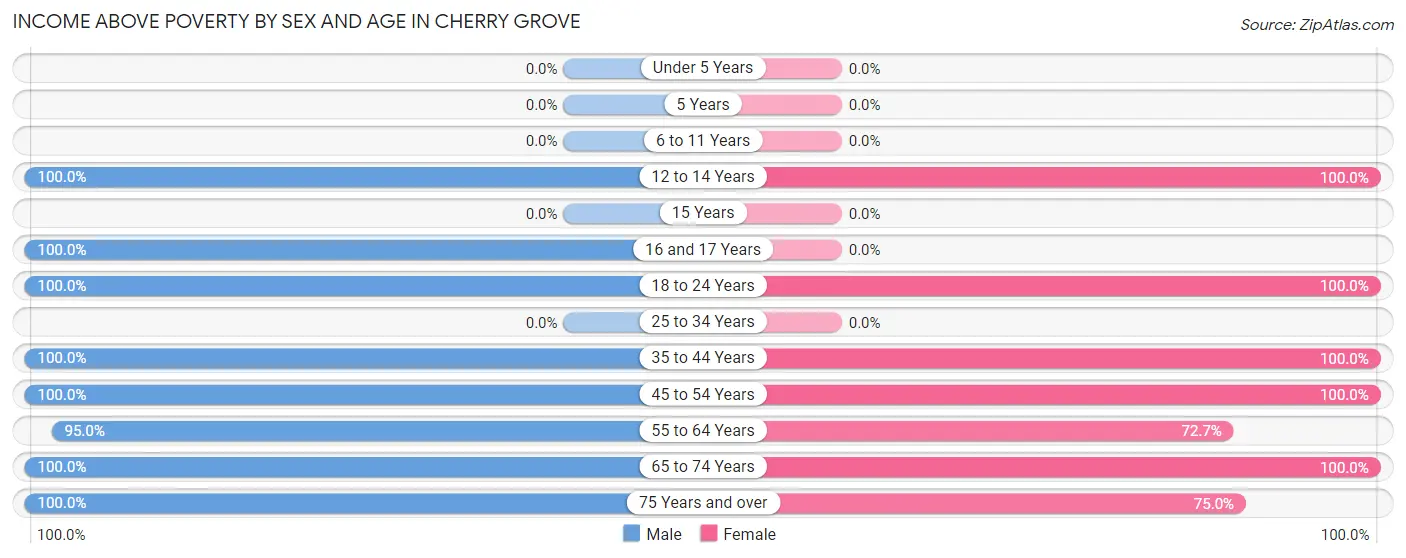
Income Above Poverty by Sex and Age in Cherry Grove
According to the poverty statistics in Cherry Grove, males aged 12 to 14 years and females aged 12 to 14 years are the age groups that are most secure financially, with 100.0% of males and 100.0% of females in these age groups living above the poverty line.
| Age Bracket | Male | Female |
| Under 5 Years | 0 (0.0%) | 0 (0.0%) |
| 5 Years | 0 (0.0%) | 0 (0.0%) |
| 6 to 11 Years | 0 (0.0%) | 0 (0.0%) |
| 12 to 14 Years | 17 (100.0%) | 16 (100.0%) |
| 15 Years | 0 (0.0%) | 0 (0.0%) |
| 16 and 17 Years | 29 (100.0%) | 0 (0.0%) |
| 18 to 24 Years | 46 (100.0%) | 24 (100.0%) |
| 25 to 34 Years | 0 (0.0%) | 0 (0.0%) |
| 35 to 44 Years | 19 (100.0%) | 17 (100.0%) |
| 45 to 54 Years | 23 (100.0%) | 46 (100.0%) |
| 55 to 64 Years | 38 (95.0%) | 16 (72.7%) |
| 65 to 74 Years | 49 (100.0%) | 41 (100.0%) |
| 75 Years and over | 31 (100.0%) | 27 (75.0%) |
| Total | 252 (99.2%) | 187 (92.6%) |
Income Below Poverty Among Married-Couple Families in Cherry Grove
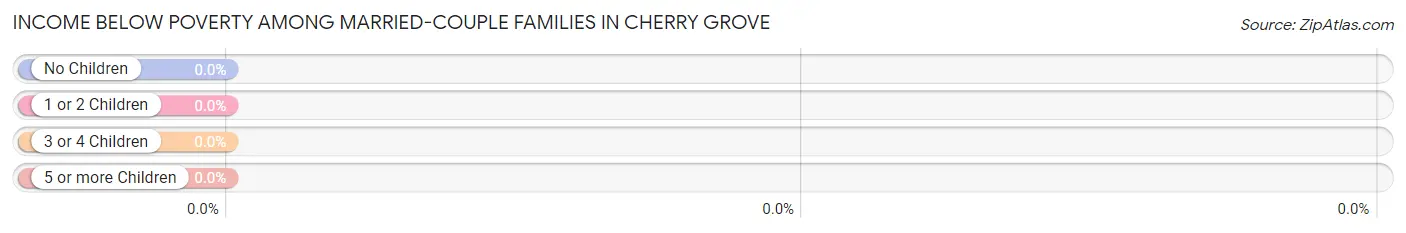
| Children | Above Poverty | Below Poverty |
| No Children | 86 (100.0%) | 0 (0.0%) |
| 1 or 2 Children | 47 (100.0%) | 0 (0.0%) |
| 3 or 4 Children | 0 (0.0%) | 0 (0.0%) |
| 5 or more Children | 0 (0.0%) | 0 (0.0%) |
| Total | 133 (100.0%) | 0 (0.0%) |
Income Below Poverty Among Single-Parent Households in Cherry Grove
| Children | Single Father | Single Mother |
| No Children | 0 (0.0%) | 0 (0.0%) |
| 1 or 2 Children | 0 (0.0%) | 0 (0.0%) |
| 3 or 4 Children | 0 (0.0%) | 0 (0.0%) |
| 5 or more Children | 0 (0.0%) | 0 (0.0%) |
| Total | 0 (0.0%) | 0 (0.0%) |
Income Below Poverty Among Married-Couple vs Single-Parent Households in Cherry Grove
| Children | Married-Couple Families | Single-Parent Households |
| No Children | 0 (0.0%) | 0 (0.0%) |
| 1 or 2 Children | 0 (0.0%) | 0 (0.0%) |
| 3 or 4 Children | 0 (0.0%) | 0 (0.0%) |
| 5 or more Children | 0 (0.0%) | 0 (0.0%) |
| Total | 0 (0.0%) | 0 (0.0%) |
Race in Cherry Grove
The most populous races in Cherry Grove are White / Caucasian (451 | 98.9%), Hispanic or Latino (3 | 0.7%), and Two or more Races (3 | 0.7%).
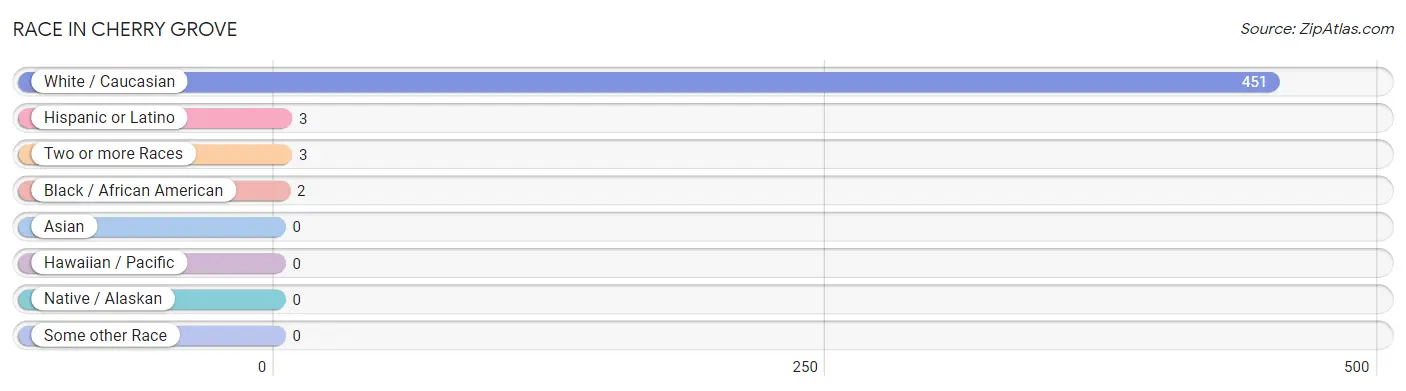
| Race | # Population | % Population |
| Asian | 0 | 0.0% |
| Black / African American | 2 | 0.4% |
| Hawaiian / Pacific | 0 | 0.0% |
| Hispanic or Latino | 3 | 0.7% |
| Native / Alaskan | 0 | 0.0% |
| White / Caucasian | 451 | 98.9% |
| Two or more Races | 3 | 0.7% |
| Some other Race | 0 | 0.0% |
| Total | 456 | 100.0% |
Ancestry in Cherry Grove
The most populous ancestries reported in Cherry Grove are European (137 | 30.0%), German (84 | 18.4%), Irish (77 | 16.9%), English (67 | 14.7%), and Belgian (50 | 11.0%), together accounting for 91.0% of all Cherry Grove residents.
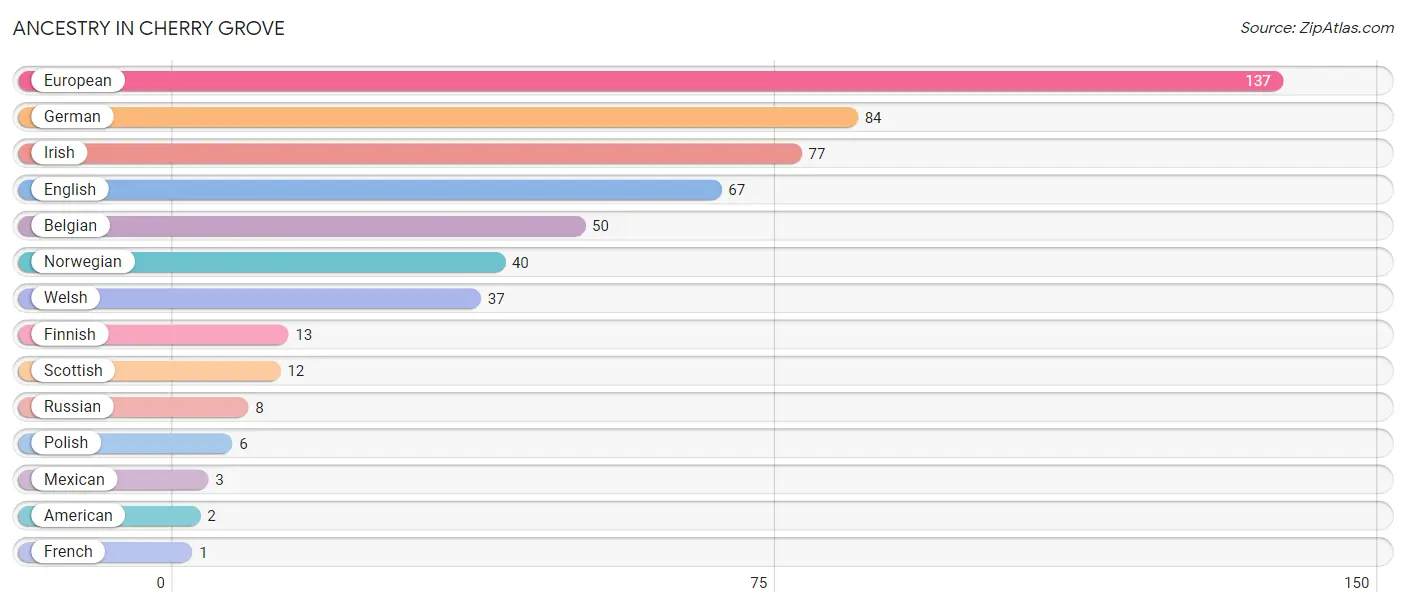
| Ancestry | # Population | % Population |
| American | 2 | 0.4% |
| Belgian | 50 | 11.0% |
| English | 67 | 14.7% |
| European | 137 | 30.0% |
| Finnish | 13 | 2.9% |
| French | 1 | 0.2% |
| German | 84 | 18.4% |
| Irish | 77 | 16.9% |
| Mexican | 3 | 0.7% |
| Norwegian | 40 | 8.8% |
| Polish | 6 | 1.3% |
| Russian | 8 | 1.8% |
| Scottish | 12 | 2.6% |
| Welsh | 37 | 8.1% | View All 14 Rows |
Immigrants in Cherry Grove
The most numerous immigrant groups reported in Cherry Grove came from Belgium (17 | 3.7%), Europe (17 | 3.7%), and Western Europe (17 | 3.7%), together accounting for 11.2% of all Cherry Grove residents.
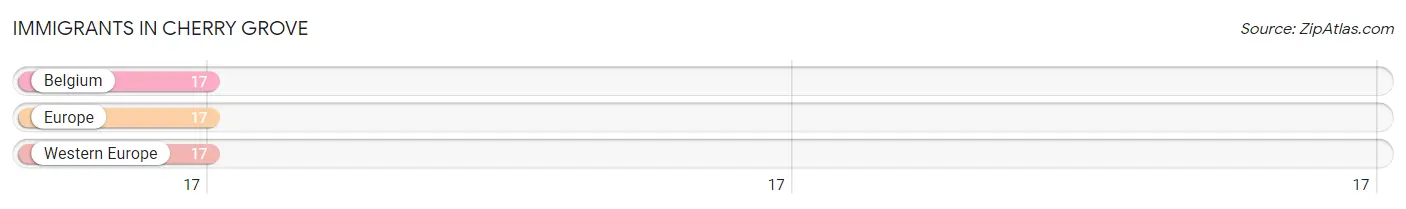
| Immigration Origin | # Population | % Population |
| Belgium | 17 | 3.7% |
| Europe | 17 | 3.7% |
| Western Europe | 17 | 3.7% | View All 3 Rows |
Sex and Age in Cherry Grove
Sex and Age in Cherry Grove
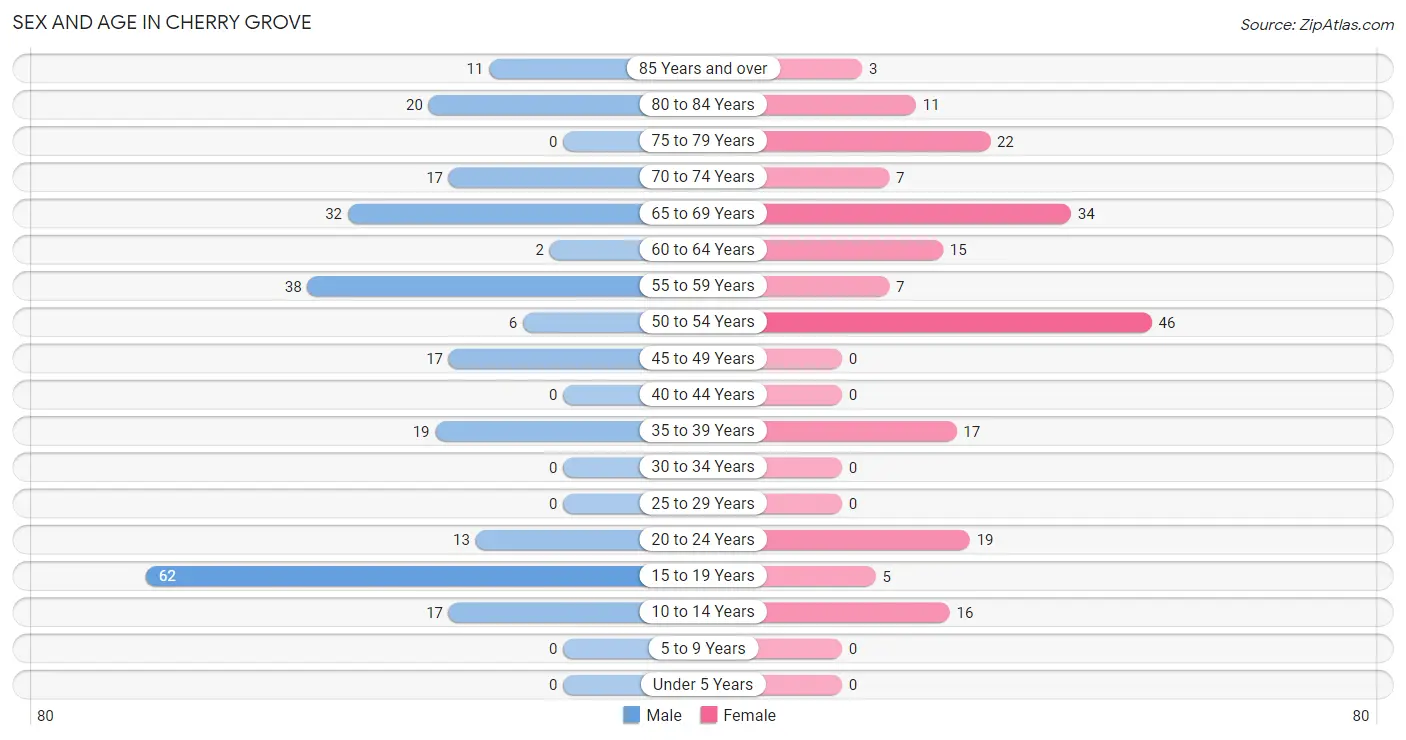
The most populous age groups in Cherry Grove are 15 to 19 Years (62 | 24.4%) for men and 50 to 54 Years (46 | 22.8%) for women.
| Age Bracket | Male | Female |
| Under 5 Years | 0 (0.0%) | 0 (0.0%) |
| 5 to 9 Years | 0 (0.0%) | 0 (0.0%) |
| 10 to 14 Years | 17 (6.7%) | 16 (7.9%) |
| 15 to 19 Years | 62 (24.4%) | 5 (2.5%) |
| 20 to 24 Years | 13 (5.1%) | 19 (9.4%) |
| 25 to 29 Years | 0 (0.0%) | 0 (0.0%) |
| 30 to 34 Years | 0 (0.0%) | 0 (0.0%) |
| 35 to 39 Years | 19 (7.5%) | 17 (8.4%) |
| 40 to 44 Years | 0 (0.0%) | 0 (0.0%) |
| 45 to 49 Years | 17 (6.7%) | 0 (0.0%) |
| 50 to 54 Years | 6 (2.4%) | 46 (22.8%) |
| 55 to 59 Years | 38 (15.0%) | 7 (3.5%) |
| 60 to 64 Years | 2 (0.8%) | 15 (7.4%) |
| 65 to 69 Years | 32 (12.6%) | 34 (16.8%) |
| 70 to 74 Years | 17 (6.7%) | 7 (3.5%) |
| 75 to 79 Years | 0 (0.0%) | 22 (10.9%) |
| 80 to 84 Years | 20 (7.9%) | 11 (5.4%) |
| 85 Years and over | 11 (4.3%) | 3 (1.5%) |
| Total | 254 (100.0%) | 202 (100.0%) |
Families and Households in Cherry Grove
Median Family Size in Cherry Grove
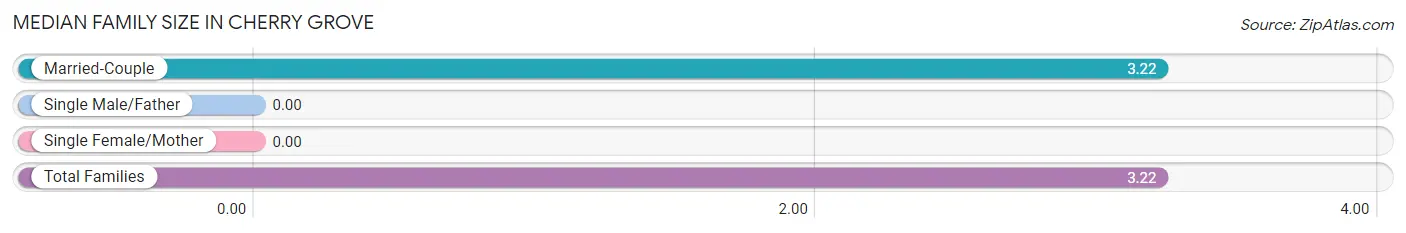
| Family Type | # Families | Family Size |
| Married-Couple | 133 (100.0%) | 3.22 |
| Single Male/Father | 0 (0.0%) | - |
| Single Female/Mother | 0 (0.0%) | - |
| Total Families | 133 (100.0%) | 3.22 |
Median Household Size in Cherry Grove
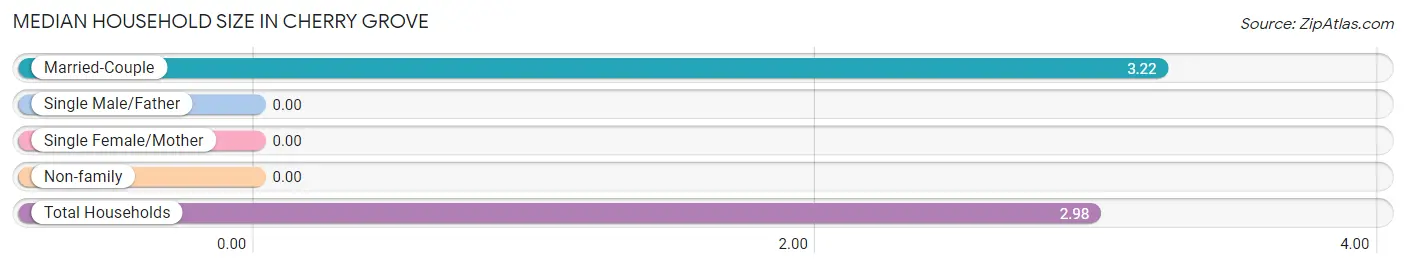
| Household Type | # Households | Household Size |
| Married-Couple | 133 (89.3%) | 3.22 |
| Single Male/Father | 0 (0.0%) | - |
| Single Female/Mother | 0 (0.0%) | - |
| Non-family | 16 (10.7%) | - |
| Total Households | 149 (100.0%) | 2.98 |
Household Size by Marriage Status in Cherry Grove
Out of a total of 149 households in Cherry Grove, 133 (89.3%) are family households, while 16 (10.7%) are nonfamily households. The most numerous type of family households are 4-person households, comprising 76, and the most common type of nonfamily households are 1-person households, comprising 16.
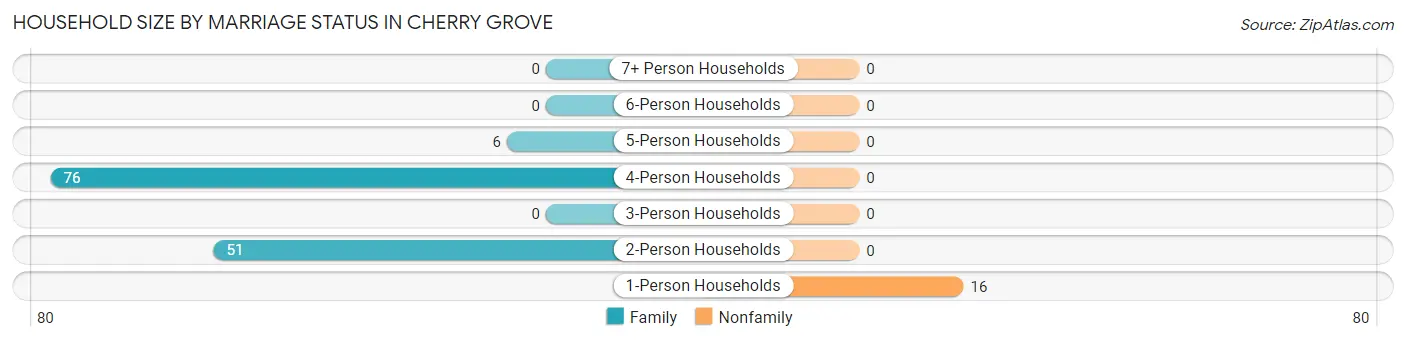
| Household Size | Family Households | Nonfamily Households |
| 1-Person Households | - | 16 (10.7%) |
| 2-Person Households | 51 (34.2%) | 0 (0.0%) |
| 3-Person Households | 0 (0.0%) | 0 (0.0%) |
| 4-Person Households | 76 (51.0%) | 0 (0.0%) |
| 5-Person Households | 6 (4.0%) | 0 (0.0%) |
| 6-Person Households | 0 (0.0%) | 0 (0.0%) |
| 7+ Person Households | 0 (0.0%) | 0 (0.0%) |
| Total | 133 (89.3%) | 16 (10.7%) |
Female Fertility in Cherry Grove
Fertility by Age in Cherry Grove
| Age Bracket | Women with Births | Births / 1,000 Women |
| 15 to 19 years | 0 (0.0%) | 0.0 |
| 20 to 34 years | 0 (0.0%) | 0.0 |
| 35 to 50 years | 0 (0.0%) | 0.0 |
| Total | 0 (0.0%) | 0.0 |
Fertility by Age by Marriage Status in Cherry Grove
| Age Bracket | Married | Unmarried |
| 15 to 19 years | 0 (0.0%) | 0 (0.0%) |
| 20 to 34 years | 0 (0.0%) | 0 (0.0%) |
| 35 to 50 years | 0 (0.0%) | 0 (0.0%) |
| Total | 0 (0.0%) | 0 (0.0%) |
Fertility by Education in Cherry Grove
| Educational Attainment | Women with Births | Births / 1,000 Women |
| Less than High School | 0 (0.0%) | 0.0 |
| High School Diploma | 0 (0.0%) | 0.0 |
| College or Associate's Degree | 0 (0.0%) | 0.0 |
| Bachelor's Degree | 0 (0.0%) | 0.0 |
| Graduate Degree | 0 (0.0%) | 0.0 |
| Total | 0 (0.0%) | 0.0 |
Fertility by Education by Marriage Status in Cherry Grove
| Educational Attainment | Married | Unmarried |
| Less than High School | 0 (0.0%) | 0 (0.0%) |
| High School Diploma | 0 (0.0%) | 0 (0.0%) |
| College or Associate's Degree | 0 (0.0%) | 0 (0.0%) |
| Bachelor's Degree | 0 (0.0%) | 0 (0.0%) |
| Graduate Degree | 0 (0.0%) | 0 (0.0%) |
| Total | 0 (0.0%) | 0 (0.0%) |
Employment Characteristics in Cherry Grove
Employment by Class of Employer in Cherry Grove
Among the 209 employed individuals in Cherry Grove, private company employees (150 | 71.8%), local government employees (34 | 16.3%), and self-employed (not incorporated) (17 | 8.1%) make up the most common classes of employment.
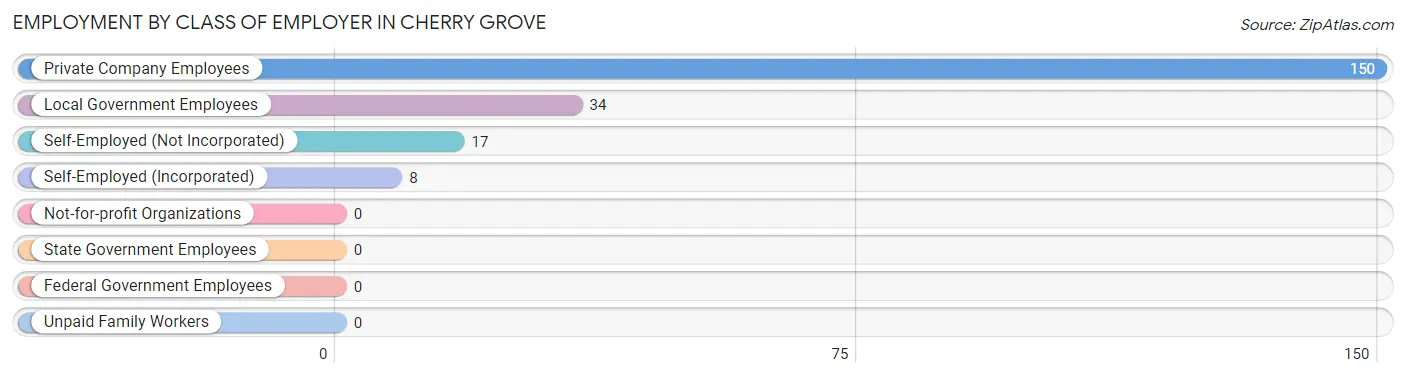
| Employer Class | # Employees | % Employees |
| Private Company Employees | 150 | 71.8% |
| Self-Employed (Incorporated) | 8 | 3.8% |
| Self-Employed (Not Incorporated) | 17 | 8.1% |
| Not-for-profit Organizations | 0 | 0.0% |
| Local Government Employees | 34 | 16.3% |
| State Government Employees | 0 | 0.0% |
| Federal Government Employees | 0 | 0.0% |
| Unpaid Family Workers | 0 | 0.0% |
| Total | 209 | 100.0% |
Employment Status by Age in Cherry Grove
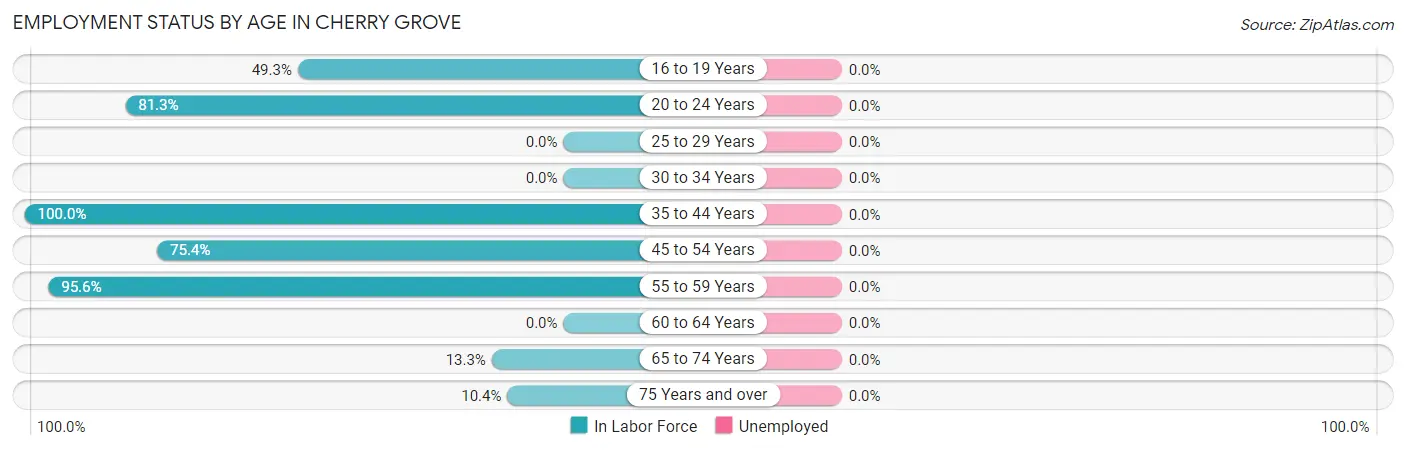
| Age Bracket | In Labor Force | Unemployed |
| 16 to 19 Years | 33 (49.3%) | 0 (0.0%) |
| 20 to 24 Years | 26 (81.3%) | 0 (0.0%) |
| 25 to 29 Years | 0 (0.0%) | 0 (0.0%) |
| 30 to 34 Years | 0 (0.0%) | 0 (0.0%) |
| 35 to 44 Years | 36 (100.0%) | 0 (0.0%) |
| 45 to 54 Years | 52 (75.4%) | 0 (0.0%) |
| 55 to 59 Years | 43 (95.6%) | 0 (0.0%) |
| 60 to 64 Years | 0 (0.0%) | 0 (0.0%) |
| 65 to 74 Years | 12 (13.3%) | 0 (0.0%) |
| 75 Years and over | 7 (10.4%) | 0 (0.0%) |
| Total | 209 (49.4%) | 0 (0.0%) |
Employment Status by Educational Attainment in Cherry Grove
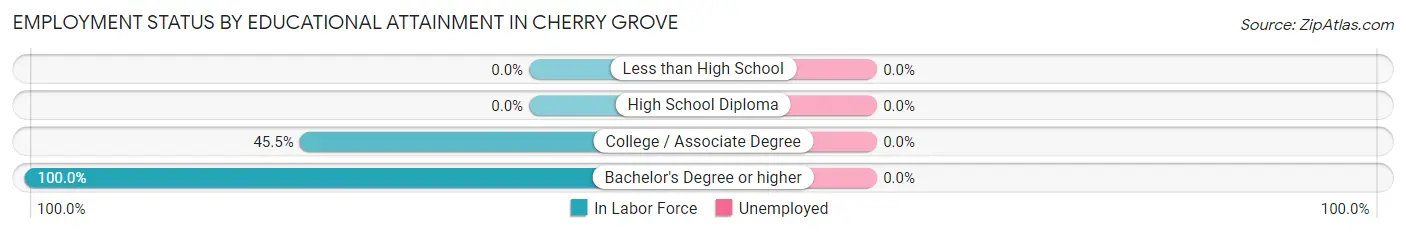
| Educational Attainment | In Labor Force | Unemployed |
| Less than High School | 0 (0.0%) | 0 (0.0%) |
| High School Diploma | 0 (0.0%) | 0 (0.0%) |
| College / Associate Degree | 30 (45.5%) | 0 (0.0%) |
| Bachelor's Degree or higher | 101 (100.0%) | 0 (0.0%) |
| Total | 131 (78.4%) | 0 (0.0%) |
Employment Occupations by Sex in Cherry Grove
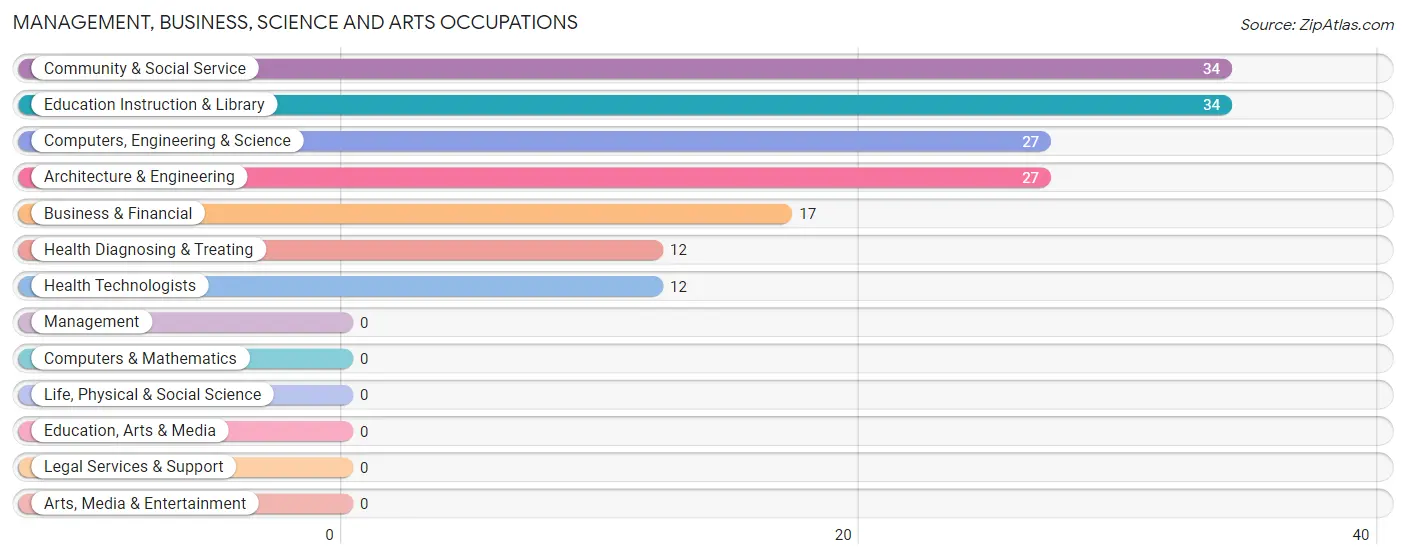
Management, Business, Science and Arts Occupations
The most common Management, Business, Science and Arts occupations in Cherry Grove are Community & Social Service (34 | 16.3%), Education Instruction & Library (34 | 16.3%), Computers, Engineering & Science (27 | 12.9%), Architecture & Engineering (27 | 12.9%), and Business & Financial (17 | 8.1%).
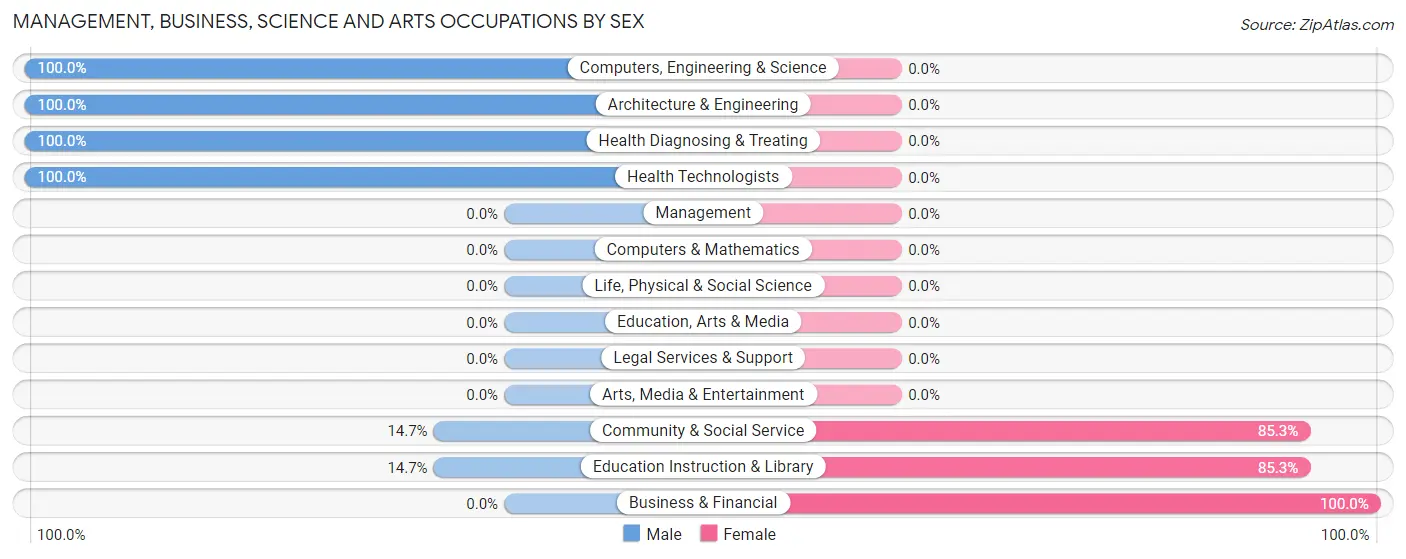
Management, Business, Science and Arts Occupations by Sex
Within the Management, Business, Science and Arts occupations in Cherry Grove, the most male-oriented occupations are Computers, Engineering & Science (100.0%), Architecture & Engineering (100.0%), and Health Diagnosing & Treating (100.0%), while the most female-oriented occupations are Business & Financial (100.0%), Community & Social Service (85.3%), and Education Instruction & Library (85.3%).
| Occupation | Male | Female |
| Management | 0 (0.0%) | 0 (0.0%) |
| Business & Financial | 0 (0.0%) | 17 (100.0%) |
| Computers, Engineering & Science | 27 (100.0%) | 0 (0.0%) |
| Computers & Mathematics | 0 (0.0%) | 0 (0.0%) |
| Architecture & Engineering | 27 (100.0%) | 0 (0.0%) |
| Life, Physical & Social Science | 0 (0.0%) | 0 (0.0%) |
| Community & Social Service | 5 (14.7%) | 29 (85.3%) |
| Education, Arts & Media | 0 (0.0%) | 0 (0.0%) |
| Legal Services & Support | 0 (0.0%) | 0 (0.0%) |
| Education Instruction & Library | 5 (14.7%) | 29 (85.3%) |
| Arts, Media & Entertainment | 0 (0.0%) | 0 (0.0%) |
| Health Diagnosing & Treating | 12 (100.0%) | 0 (0.0%) |
| Health Technologists | 12 (100.0%) | 0 (0.0%) |
| Total (Category) | 44 (48.9%) | 46 (51.1%) |
| Total (Overall) | 145 (69.4%) | 64 (30.6%) |
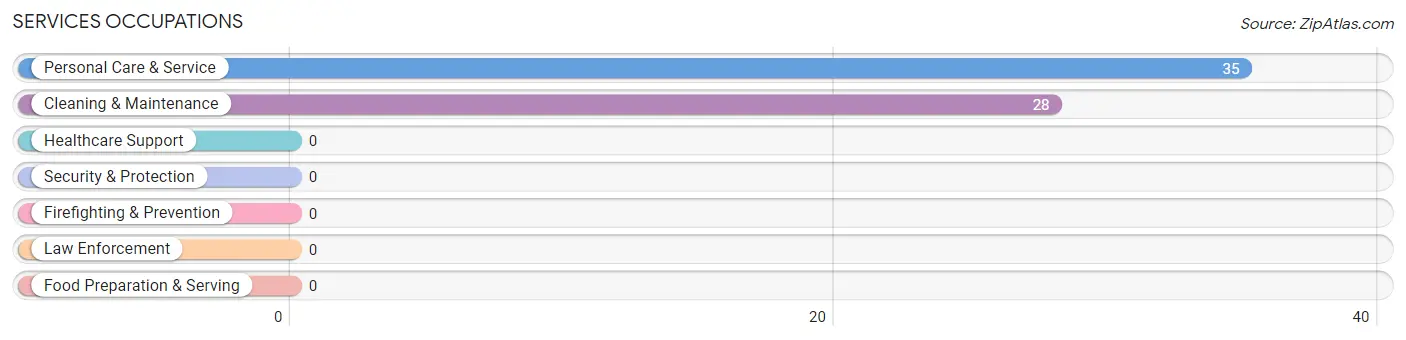
Services Occupations
The most common Services occupations in Cherry Grove are Personal Care & Service (35 | 16.8%), and Cleaning & Maintenance (28 | 13.4%).
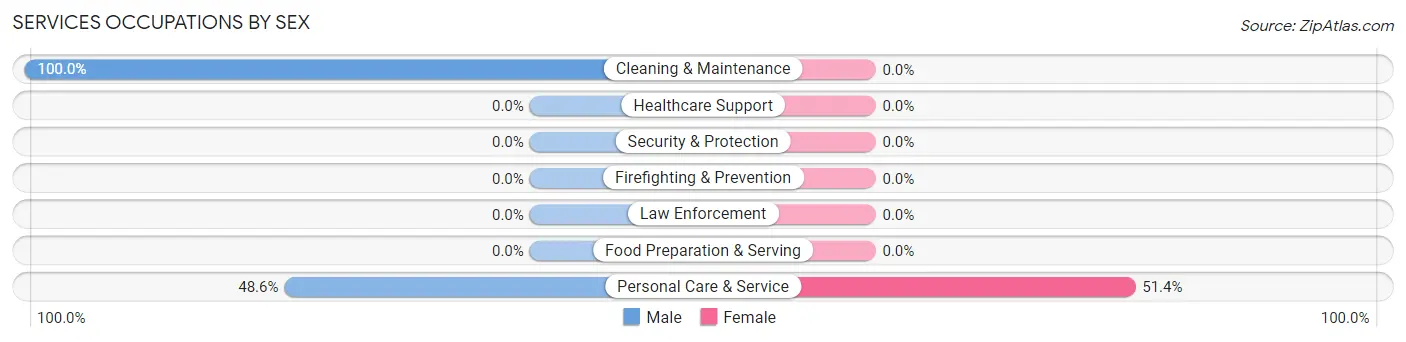
Services Occupations by Sex
| Occupation | Male | Female |
| Healthcare Support | 0 (0.0%) | 0 (0.0%) |
| Security & Protection | 0 (0.0%) | 0 (0.0%) |
| Firefighting & Prevention | 0 (0.0%) | 0 (0.0%) |
| Law Enforcement | 0 (0.0%) | 0 (0.0%) |
| Food Preparation & Serving | 0 (0.0%) | 0 (0.0%) |
| Cleaning & Maintenance | 28 (100.0%) | 0 (0.0%) |
| Personal Care & Service | 17 (48.6%) | 18 (51.4%) |
| Total (Category) | 45 (71.4%) | 18 (28.6%) |
| Total (Overall) | 145 (69.4%) | 64 (30.6%) |
Sales and Office Occupations
The most common Sales and Office occupations in Cherry Grove are , and Sales & Related (30 | 14.3%).
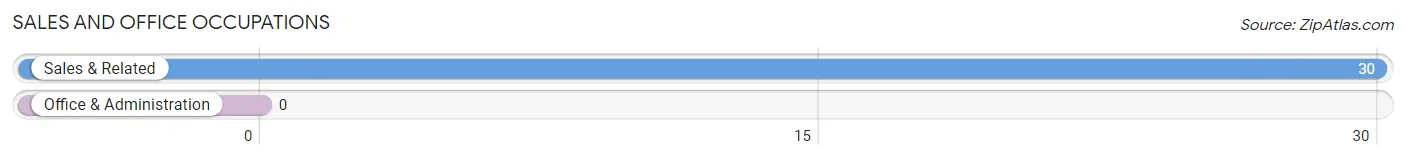
Sales and Office Occupations by Sex

| Occupation | Male | Female |
| Sales & Related | 30 (100.0%) | 0 (0.0%) |
| Office & Administration | 0 (0.0%) | 0 (0.0%) |
| Total (Category) | 30 (100.0%) | 0 (0.0%) |
| Total (Overall) | 145 (69.4%) | 64 (30.6%) |
Natural Resources, Construction and Maintenance Occupations
The most common Natural Resources, Construction and Maintenance occupations in Cherry Grove are , and Installation, Maintenance & Repair (13 | 6.2%).
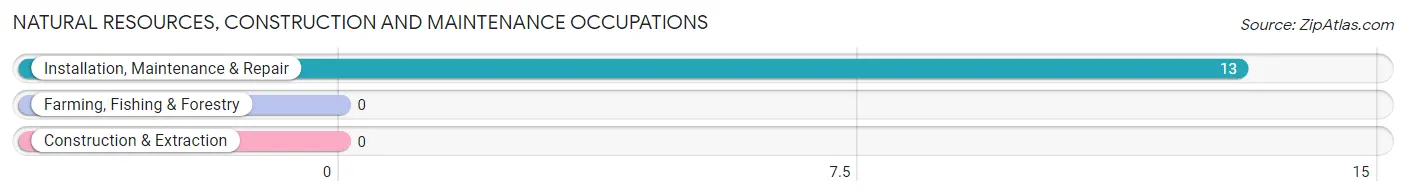
Natural Resources, Construction and Maintenance Occupations by Sex
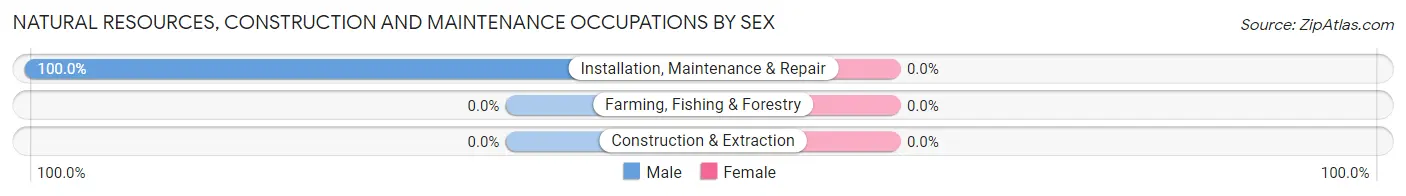
| Occupation | Male | Female |
| Farming, Fishing & Forestry | 0 (0.0%) | 0 (0.0%) |
| Construction & Extraction | 0 (0.0%) | 0 (0.0%) |
| Installation, Maintenance & Repair | 13 (100.0%) | 0 (0.0%) |
| Total (Category) | 13 (100.0%) | 0 (0.0%) |
| Total (Overall) | 145 (69.4%) | 64 (30.6%) |
Production, Transportation and Moving Occupations
The most common Production, Transportation and Moving occupations in Cherry Grove are , and Production (13 | 6.2%).
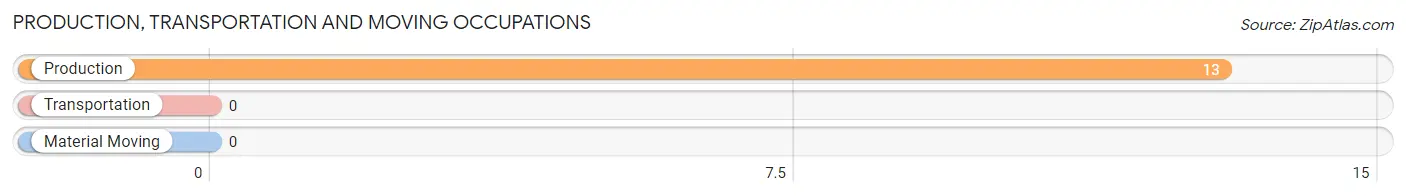
Production, Transportation and Moving Occupations by Sex
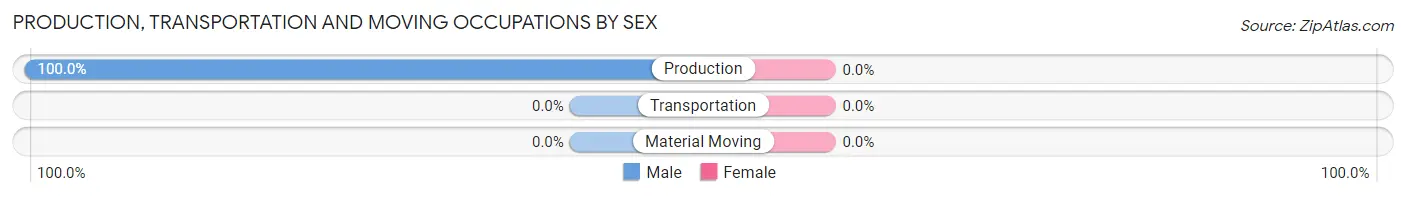
| Occupation | Male | Female |
| Production | 13 (100.0%) | 0 (0.0%) |
| Transportation | 0 (0.0%) | 0 (0.0%) |
| Material Moving | 0 (0.0%) | 0 (0.0%) |
| Total (Category) | 13 (100.0%) | 0 (0.0%) |
| Total (Overall) | 145 (69.4%) | 64 (30.6%) |
Employment Industries by Sex in Cherry Grove
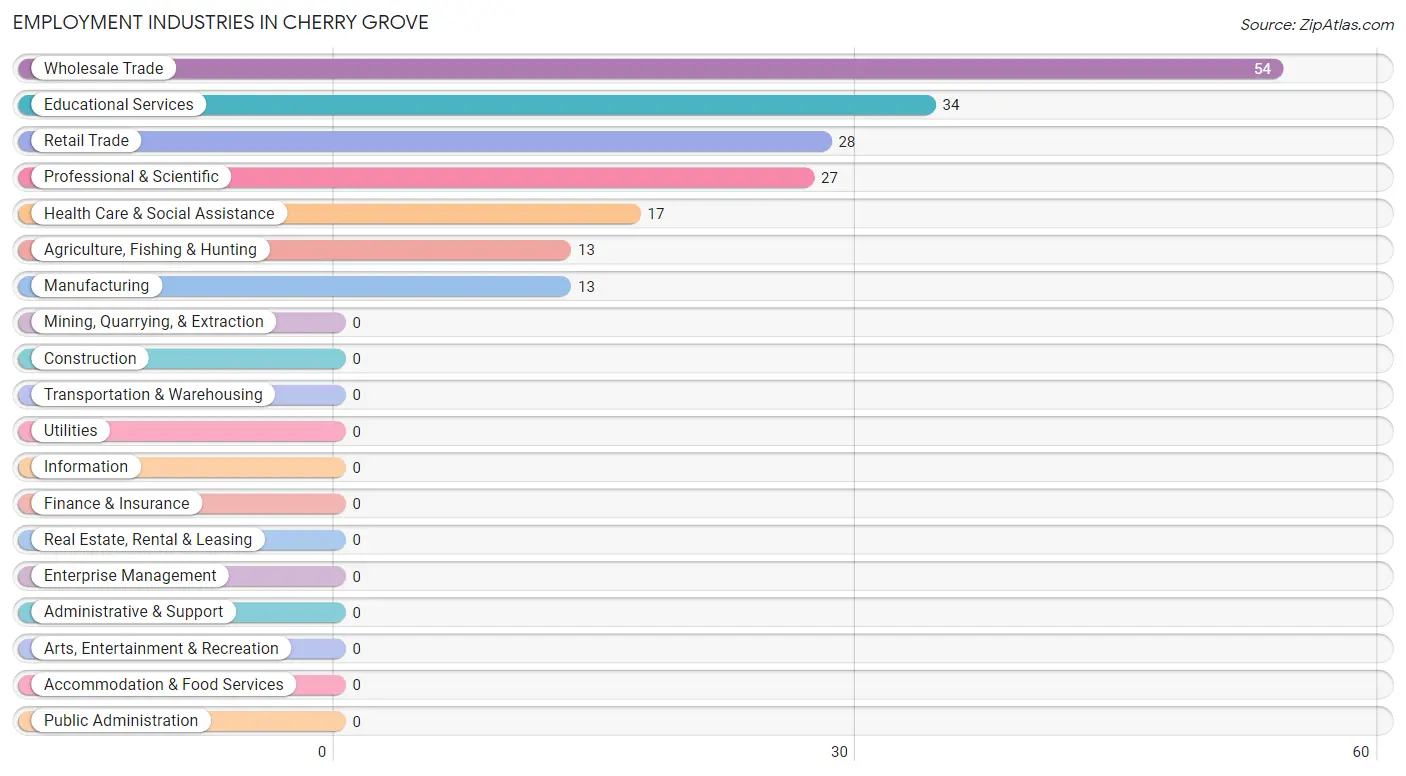
Employment Industries in Cherry Grove
The major employment industries in Cherry Grove include Wholesale Trade (54 | 25.8%), Educational Services (34 | 16.3%), Retail Trade (28 | 13.4%), Professional & Scientific (27 | 12.9%), and Health Care & Social Assistance (17 | 8.1%).
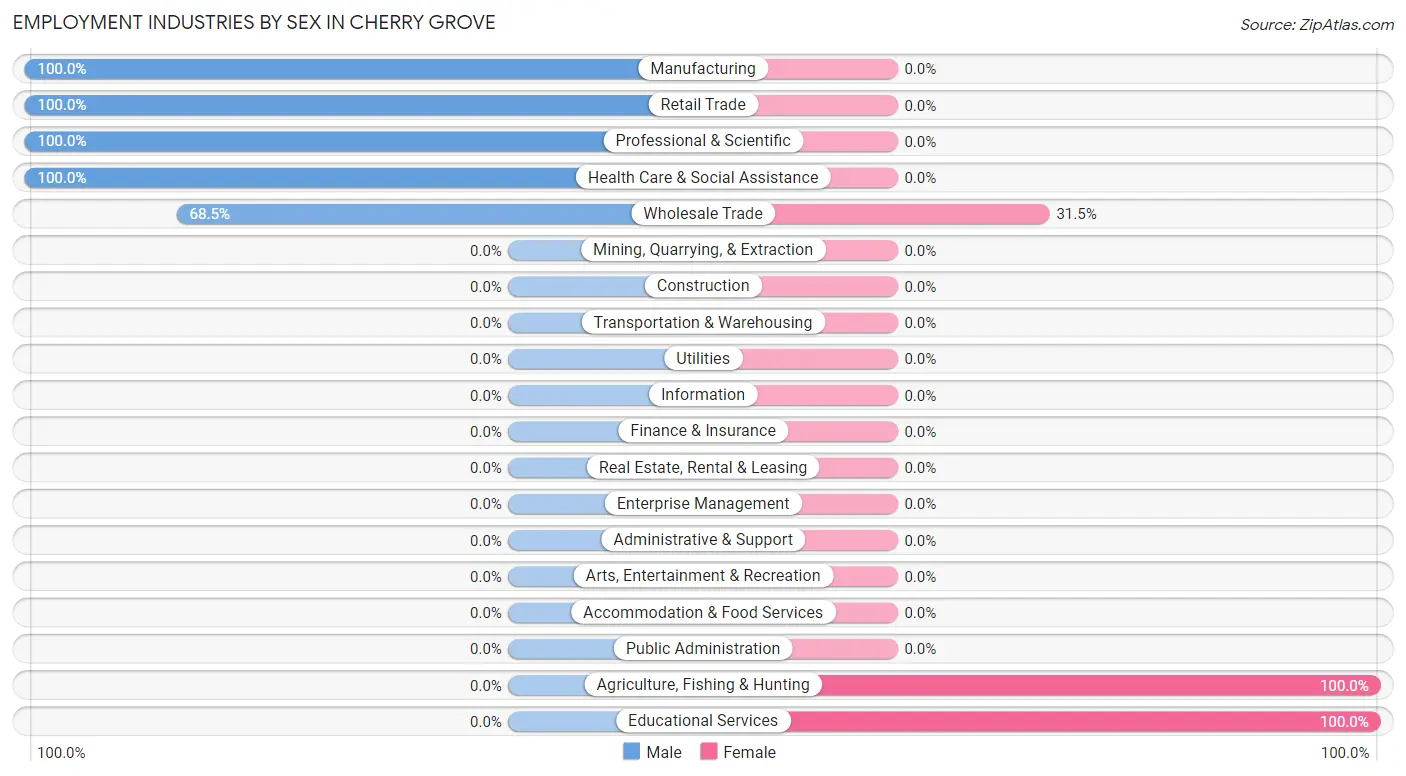
Employment Industries by Sex in Cherry Grove
The Cherry Grove industries that see more men than women are Manufacturing (100.0%), Retail Trade (100.0%), and Professional & Scientific (100.0%), whereas the industries that tend to have a higher number of women are Agriculture, Fishing & Hunting (100.0%), Educational Services (100.0%), and Wholesale Trade (31.5%).
| Industry | Male | Female |
| Agriculture, Fishing & Hunting | 0 (0.0%) | 13 (100.0%) |
| Mining, Quarrying, & Extraction | 0 (0.0%) | 0 (0.0%) |
| Construction | 0 (0.0%) | 0 (0.0%) |
| Manufacturing | 13 (100.0%) | 0 (0.0%) |
| Wholesale Trade | 37 (68.5%) | 17 (31.5%) |
| Retail Trade | 28 (100.0%) | 0 (0.0%) |
| Transportation & Warehousing | 0 (0.0%) | 0 (0.0%) |
| Utilities | 0 (0.0%) | 0 (0.0%) |
| Information | 0 (0.0%) | 0 (0.0%) |
| Finance & Insurance | 0 (0.0%) | 0 (0.0%) |
| Real Estate, Rental & Leasing | 0 (0.0%) | 0 (0.0%) |
| Professional & Scientific | 27 (100.0%) | 0 (0.0%) |
| Enterprise Management | 0 (0.0%) | 0 (0.0%) |
| Administrative & Support | 0 (0.0%) | 0 (0.0%) |
| Educational Services | 0 (0.0%) | 34 (100.0%) |
| Health Care & Social Assistance | 17 (100.0%) | 0 (0.0%) |
| Arts, Entertainment & Recreation | 0 (0.0%) | 0 (0.0%) |
| Accommodation & Food Services | 0 (0.0%) | 0 (0.0%) |
| Public Administration | 0 (0.0%) | 0 (0.0%) |
| Total | 145 (69.4%) | 64 (30.6%) |
Education in Cherry Grove
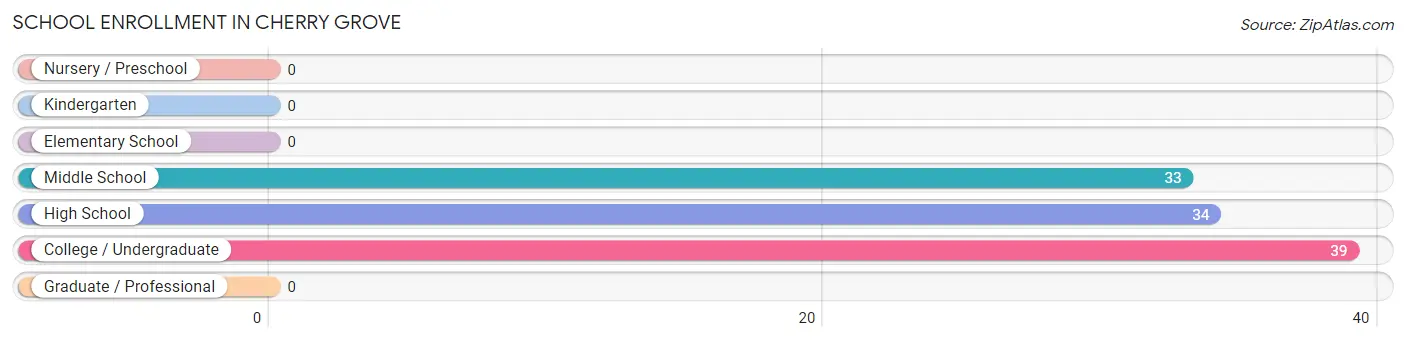
School Enrollment in Cherry Grove
The most common levels of schooling among the 106 students in Cherry Grove are college / undergraduate (39 | 36.8%), high school (34 | 32.1%), and middle school (33 | 31.1%).
| School Level | # Students | % Students |
| Nursery / Preschool | 0 | 0.0% |
| Kindergarten | 0 | 0.0% |
| Elementary School | 0 | 0.0% |
| Middle School | 33 | 31.1% |
| High School | 34 | 32.1% |
| College / Undergraduate | 39 | 36.8% |
| Graduate / Professional | 0 | 0.0% |
| Total | 106 | 100.0% |
School Enrollment by Age by Funding Source in Cherry Grove
Out of a total of 106 students who are enrolled in schools in Cherry Grove, 39 (36.8%) attend a private institution, while the remaining 67 (63.2%) are enrolled in public schools. The age group of 10 to 14 year olds has the highest likelihood of being enrolled in private schools, with 33 (100.0% in the age bracket) enrolled. Conversely, the age group of 15 to 17 year olds has the lowest likelihood of being enrolled in a private school, with 29 (100.0% in the age bracket) attending a public institution.
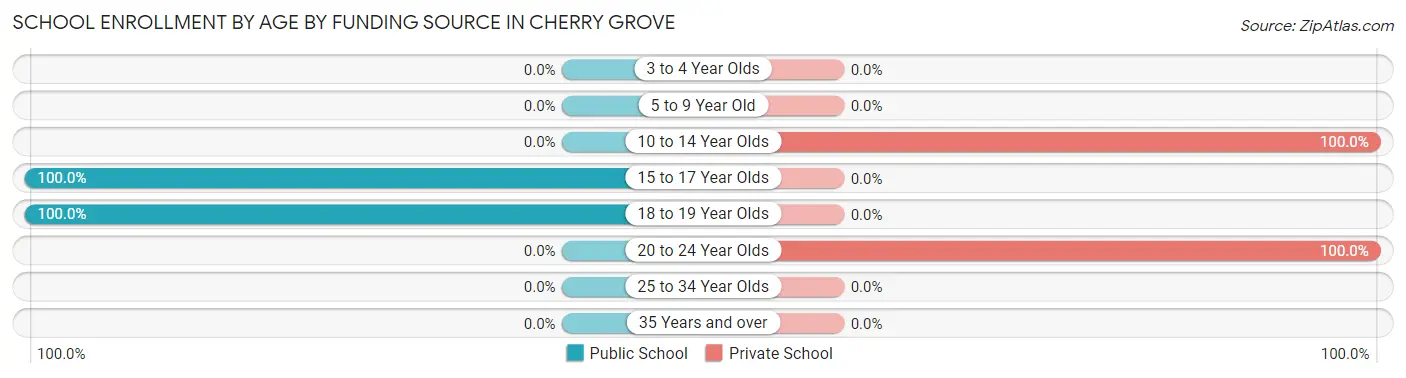
| Age Bracket | Public School | Private School |
| 3 to 4 Year Olds | 0 (0.0%) | 0 (0.0%) |
| 5 to 9 Year Old | 0 (0.0%) | 0 (0.0%) |
| 10 to 14 Year Olds | 0 (0.0%) | 33 (100.0%) |
| 15 to 17 Year Olds | 29 (100.0%) | 0 (0.0%) |
| 18 to 19 Year Olds | 38 (100.0%) | 0 (0.0%) |
| 20 to 24 Year Olds | 0 (0.0%) | 6 (100.0%) |
| 25 to 34 Year Olds | 0 (0.0%) | 0 (0.0%) |
| 35 Years and over | 0 (0.0%) | 0 (0.0%) |
| Total | 67 (63.2%) | 39 (36.8%) |
Educational Attainment by Field of Study in Cherry Grove
Engineering (39 | 23.6%), arts & humanities (32 | 19.4%), literature & languages (29 | 17.6%), science & technology (25 | 15.1%), and communications (17 | 10.3%) are the most common fields of study among 165 individuals in Cherry Grove who have obtained a bachelor's degree or higher.
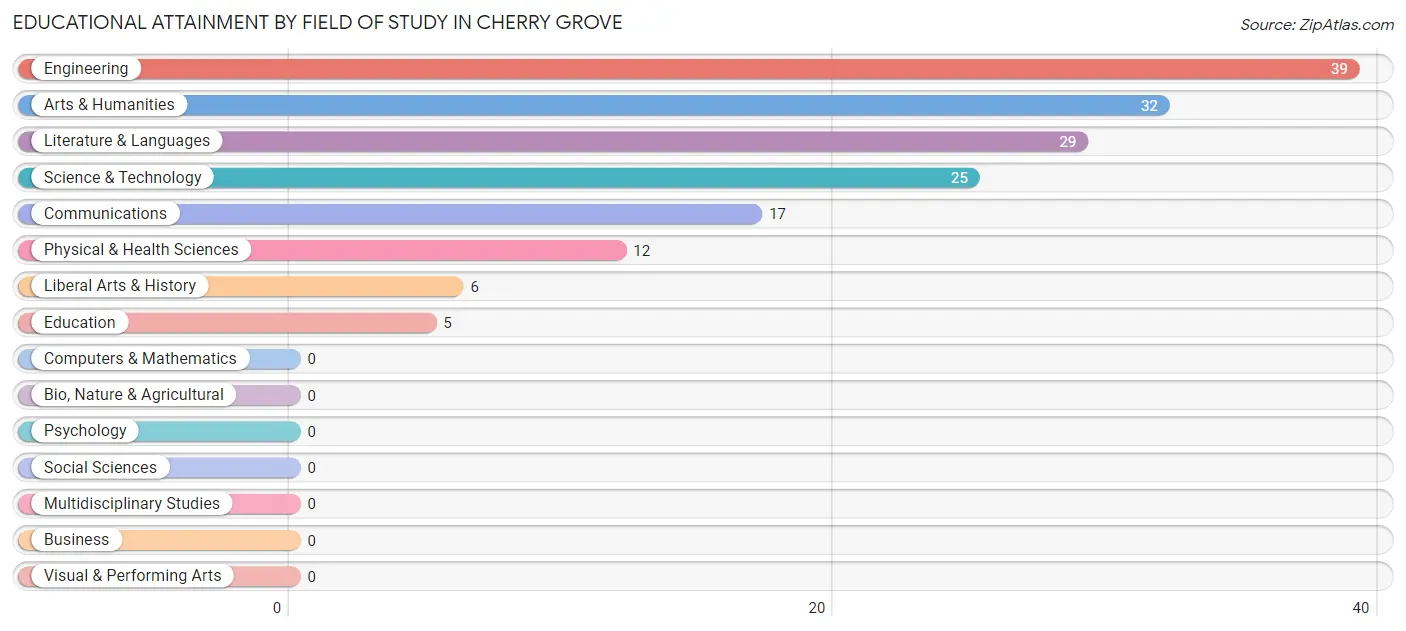
| Field of Study | # Graduates | % Graduates |
| Computers & Mathematics | 0 | 0.0% |
| Bio, Nature & Agricultural | 0 | 0.0% |
| Physical & Health Sciences | 12 | 7.3% |
| Psychology | 0 | 0.0% |
| Social Sciences | 0 | 0.0% |
| Engineering | 39 | 23.6% |
| Multidisciplinary Studies | 0 | 0.0% |
| Science & Technology | 25 | 15.1% |
| Business | 0 | 0.0% |
| Education | 5 | 3.0% |
| Literature & Languages | 29 | 17.6% |
| Liberal Arts & History | 6 | 3.6% |
| Visual & Performing Arts | 0 | 0.0% |
| Communications | 17 | 10.3% |
| Arts & Humanities | 32 | 19.4% |
| Total | 165 | 100.0% |
Transportation & Commute in Cherry Grove
Vehicle Availability by Sex in Cherry Grove
The most prevalent vehicle ownership categories in Cherry Grove are males with 3 vehicles (69, accounting for 47.6%) and females with 3 vehicles (34, making up 107.8%).
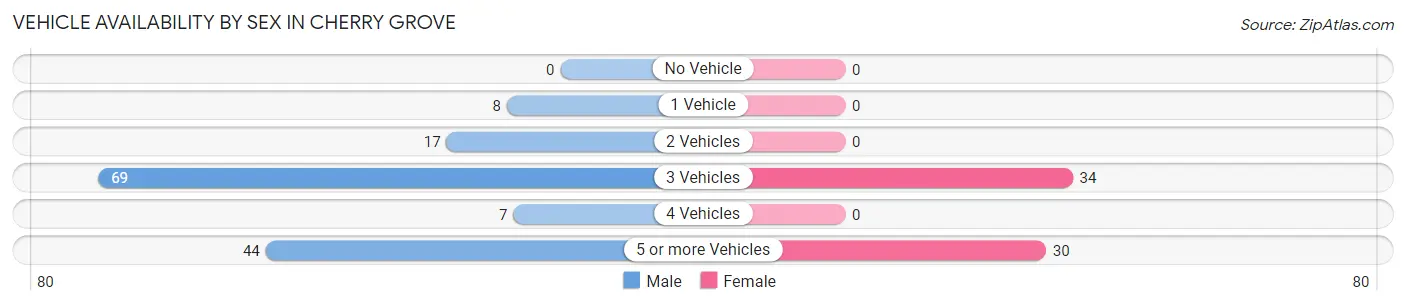
| Vehicles Available | Male | Female |
| No Vehicle | 0 (0.0%) | 0 (0.0%) |
| 1 Vehicle | 8 (5.5%) | 0 (0.0%) |
| 2 Vehicles | 17 (11.7%) | 0 (0.0%) |
| 3 Vehicles | 69 (47.6%) | 34 (53.1%) |
| 4 Vehicles | 7 (4.8%) | 0 (0.0%) |
| 5 or more Vehicles | 44 (30.3%) | 30 (46.9%) |
| Total | 145 (100.0%) | 64 (100.0%) |
Commute Time in Cherry Grove
The most frequently occuring commute durations in Cherry Grove are 60 to 89 minutes (42 commuters, 24.0%), 15 to 19 minutes (36 commuters, 20.6%), and 20 to 24 minutes (29 commuters, 16.6%).
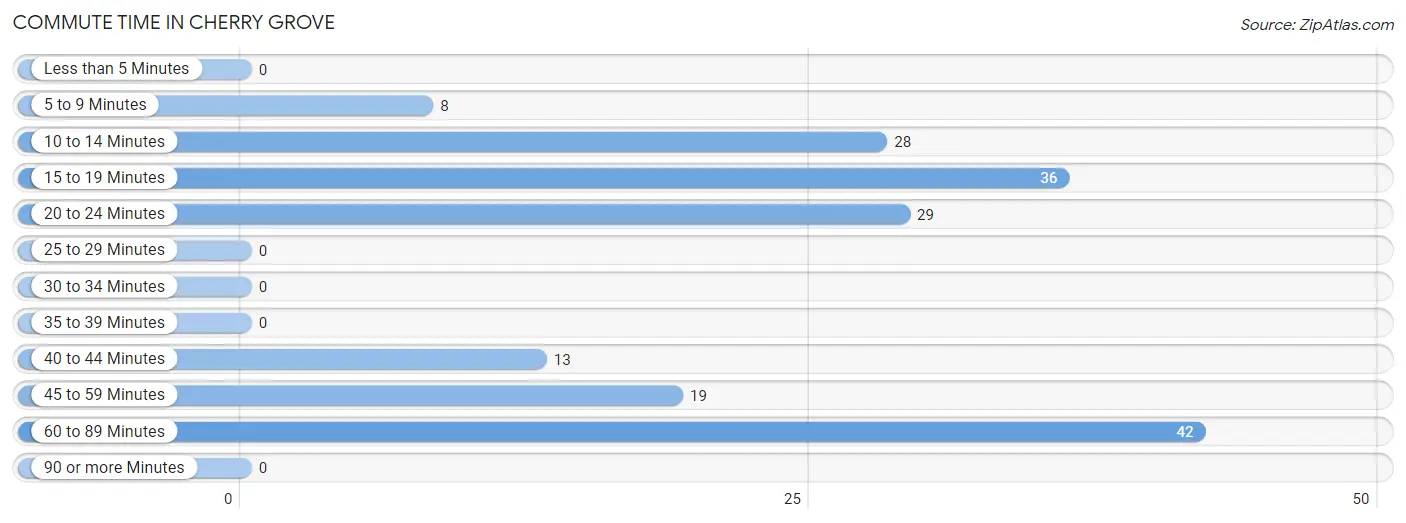
| Commute Time | # Commuters | % Commuters |
| Less than 5 Minutes | 0 | 0.0% |
| 5 to 9 Minutes | 8 | 4.6% |
| 10 to 14 Minutes | 28 | 16.0% |
| 15 to 19 Minutes | 36 | 20.6% |
| 20 to 24 Minutes | 29 | 16.6% |
| 25 to 29 Minutes | 0 | 0.0% |
| 30 to 34 Minutes | 0 | 0.0% |
| 35 to 39 Minutes | 0 | 0.0% |
| 40 to 44 Minutes | 13 | 7.4% |
| 45 to 59 Minutes | 19 | 10.9% |
| 60 to 89 Minutes | 42 | 24.0% |
| 90 or more Minutes | 0 | 0.0% |
Commute Time by Sex in Cherry Grove
The most common commute times in Cherry Grove are 60 to 89 minutes (42 commuters, 32.8%) for males and 20 to 24 minutes (29 commuters, 61.7%) for females.
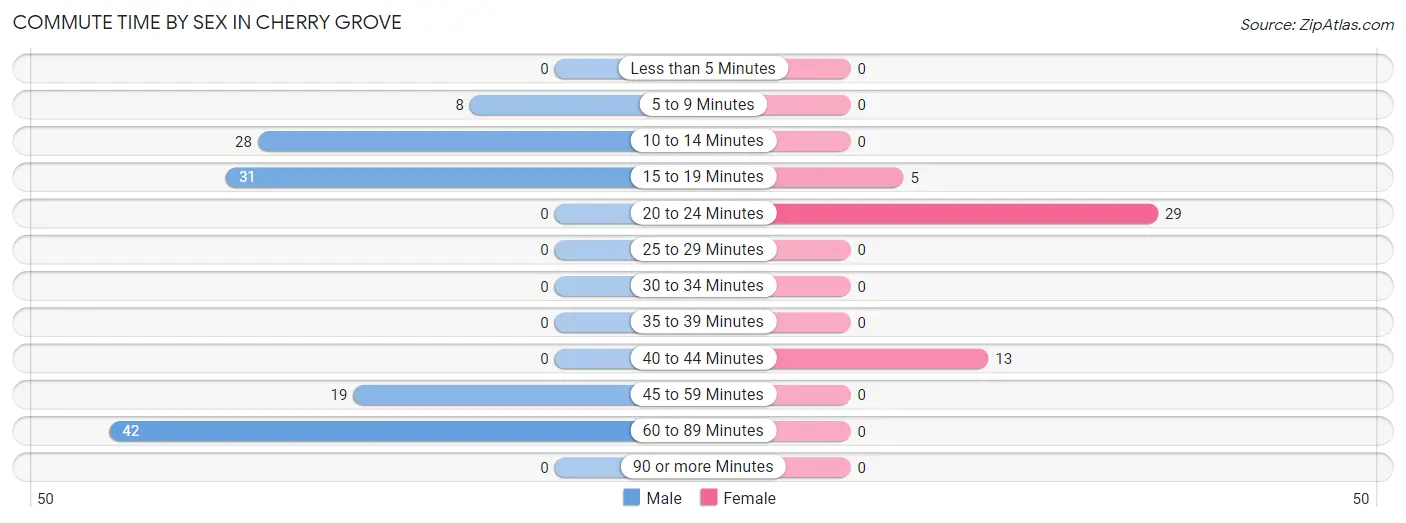
| Commute Time | Male | Female |
| Less than 5 Minutes | 0 (0.0%) | 0 (0.0%) |
| 5 to 9 Minutes | 8 (6.2%) | 0 (0.0%) |
| 10 to 14 Minutes | 28 (21.9%) | 0 (0.0%) |
| 15 to 19 Minutes | 31 (24.2%) | 5 (10.6%) |
| 20 to 24 Minutes | 0 (0.0%) | 29 (61.7%) |
| 25 to 29 Minutes | 0 (0.0%) | 0 (0.0%) |
| 30 to 34 Minutes | 0 (0.0%) | 0 (0.0%) |
| 35 to 39 Minutes | 0 (0.0%) | 0 (0.0%) |
| 40 to 44 Minutes | 0 (0.0%) | 13 (27.7%) |
| 45 to 59 Minutes | 19 (14.8%) | 0 (0.0%) |
| 60 to 89 Minutes | 42 (32.8%) | 0 (0.0%) |
| 90 or more Minutes | 0 (0.0%) | 0 (0.0%) |
Time of Departure to Work by Sex in Cherry Grove
The most frequent times of departure to work in Cherry Grove are 9:00 AM to 9:59 AM (38, 29.7%) for males and 8:30 AM to 8:59 AM (29, 61.7%) for females.
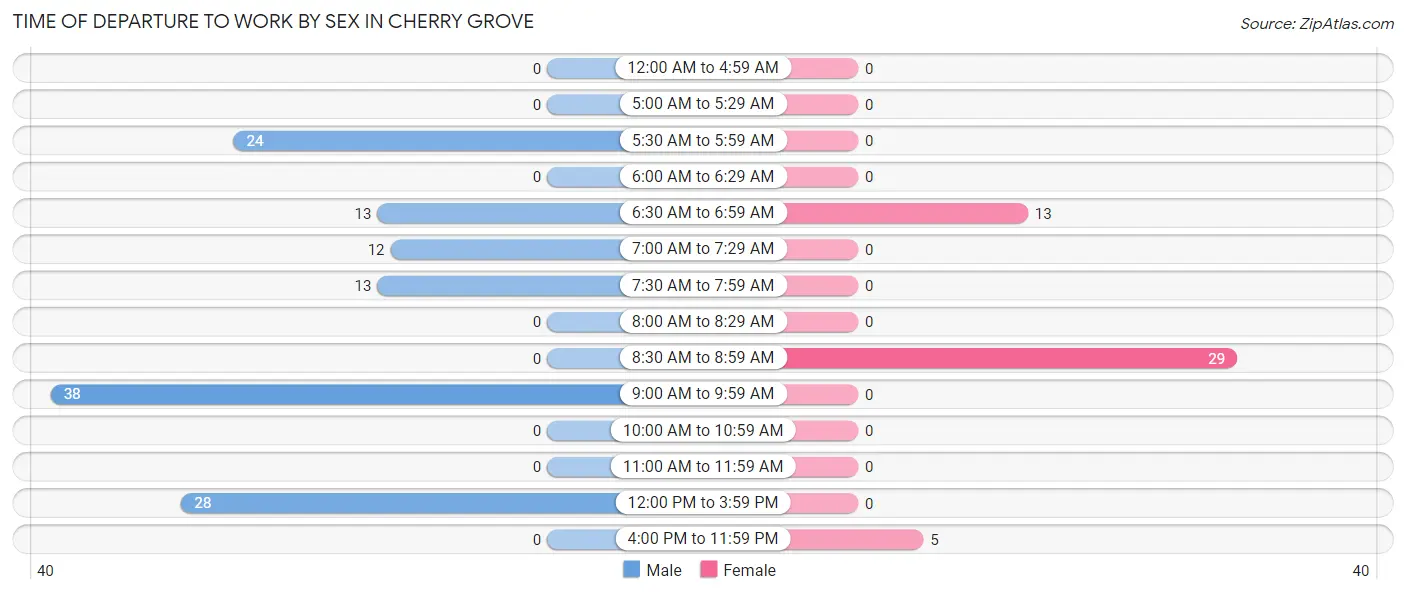
| Time of Departure | Male | Female |
| 12:00 AM to 4:59 AM | 0 (0.0%) | 0 (0.0%) |
| 5:00 AM to 5:29 AM | 0 (0.0%) | 0 (0.0%) |
| 5:30 AM to 5:59 AM | 24 (18.8%) | 0 (0.0%) |
| 6:00 AM to 6:29 AM | 0 (0.0%) | 0 (0.0%) |
| 6:30 AM to 6:59 AM | 13 (10.2%) | 13 (27.7%) |
| 7:00 AM to 7:29 AM | 12 (9.4%) | 0 (0.0%) |
| 7:30 AM to 7:59 AM | 13 (10.2%) | 0 (0.0%) |
| 8:00 AM to 8:29 AM | 0 (0.0%) | 0 (0.0%) |
| 8:30 AM to 8:59 AM | 0 (0.0%) | 29 (61.7%) |
| 9:00 AM to 9:59 AM | 38 (29.7%) | 0 (0.0%) |
| 10:00 AM to 10:59 AM | 0 (0.0%) | 0 (0.0%) |
| 11:00 AM to 11:59 AM | 0 (0.0%) | 0 (0.0%) |
| 12:00 PM to 3:59 PM | 28 (21.9%) | 0 (0.0%) |
| 4:00 PM to 11:59 PM | 0 (0.0%) | 5 (10.6%) |
| Total | 128 (100.0%) | 47 (100.0%) |
Housing Occupancy in Cherry Grove
Occupancy by Ownership in Cherry Grove
Of the total 149 dwellings in Cherry Grove, owner-occupied units account for 149 (100.0%), while renter-occupied units make up 0 (0.0%).
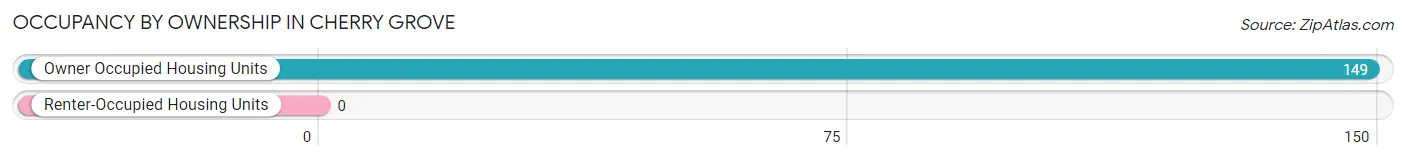
| Occupancy | # Housing Units | % Housing Units |
| Owner Occupied Housing Units | 149 | 100.0% |
| Renter-Occupied Housing Units | 0 | 0.0% |
| Total Occupied Housing Units | 149 | 100.0% |
Occupancy by Household Size in Cherry Grove
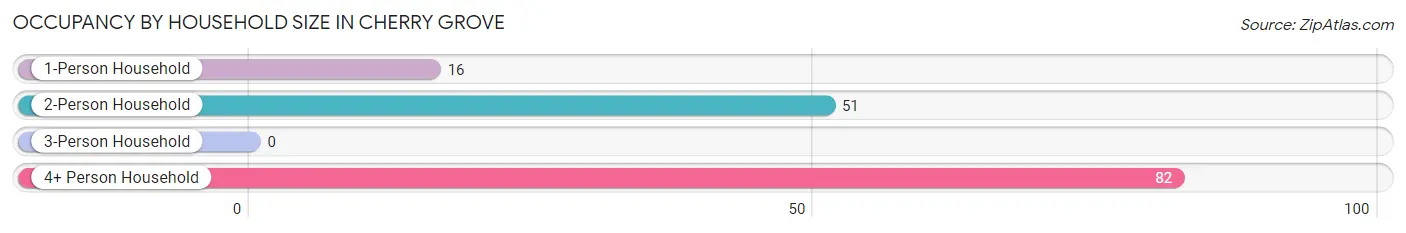
| Household Size | # Housing Units | % Housing Units |
| 1-Person Household | 16 | 10.7% |
| 2-Person Household | 51 | 34.2% |
| 3-Person Household | 0 | 0.0% |
| 4+ Person Household | 82 | 55.0% |
| Total Housing Units | 149 | 100.0% |
Occupancy by Ownership by Household Size in Cherry Grove
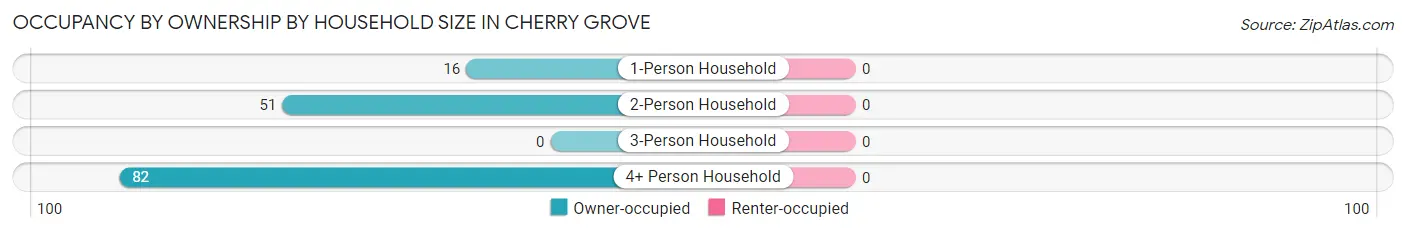
| Household Size | Owner-occupied | Renter-occupied |
| 1-Person Household | 16 (100.0%) | 0 (0.0%) |
| 2-Person Household | 51 (100.0%) | 0 (0.0%) |
| 3-Person Household | 0 (0.0%) | 0 (0.0%) |
| 4+ Person Household | 82 (100.0%) | 0 (0.0%) |
| Total Housing Units | 149 (100.0%) | 0 (0.0%) |
Occupancy by Educational Attainment in Cherry Grove
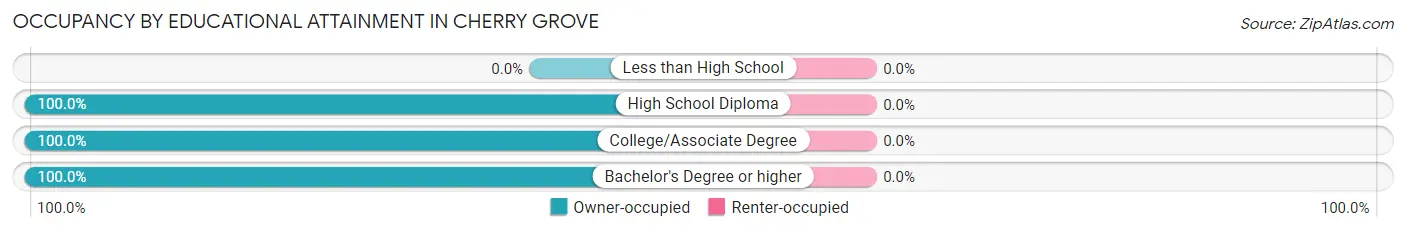
| Household Size | Owner-occupied | Renter-occupied |
| Less than High School | 0 (0.0%) | 0 (0.0%) |
| High School Diploma | 19 (100.0%) | 0 (0.0%) |
| College/Associate Degree | 67 (100.0%) | 0 (0.0%) |
| Bachelor's Degree or higher | 63 (100.0%) | 0 (0.0%) |
Occupancy by Age of Householder in Cherry Grove
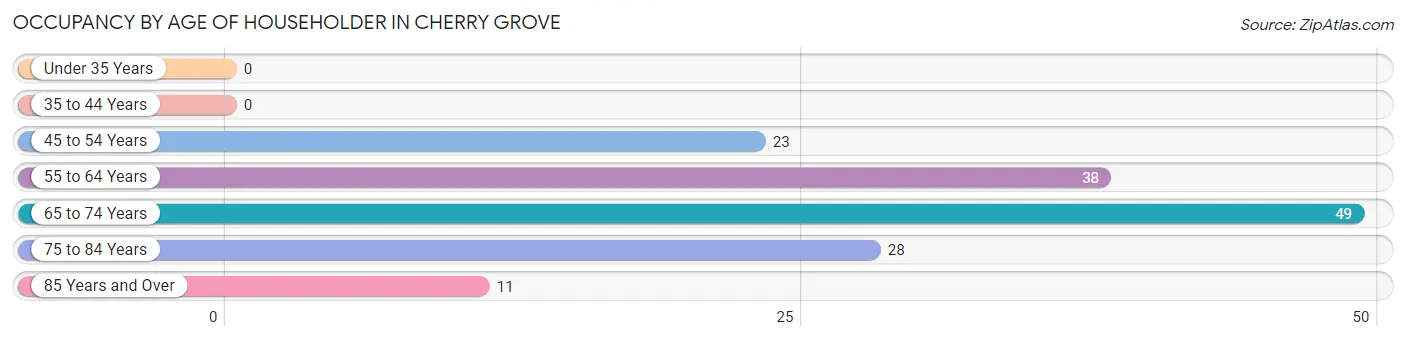
| Age Bracket | # Households | % Households |
| Under 35 Years | 0 | 0.0% |
| 35 to 44 Years | 0 | 0.0% |
| 45 to 54 Years | 23 | 15.4% |
| 55 to 64 Years | 38 | 25.5% |
| 65 to 74 Years | 49 | 32.9% |
| 75 to 84 Years | 28 | 18.8% |
| 85 Years and Over | 11 | 7.4% |
| Total | 149 | 100.0% |
Housing Finances in Cherry Grove
Median Income by Occupancy in Cherry Grove
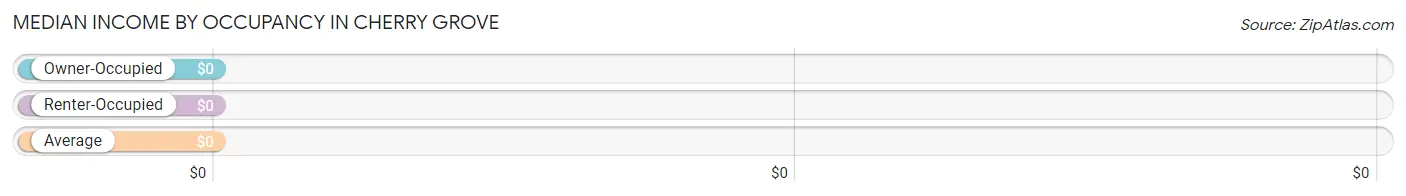
| Occupancy Type | # Households | Median Income |
| Owner-Occupied | 149 (100.0%) | $0 |
| Renter-Occupied | 0 (0.0%) | $0 |
| Average | 149 (100.0%) | $0 |
Occupancy by Householder Income Bracket in Cherry Grove
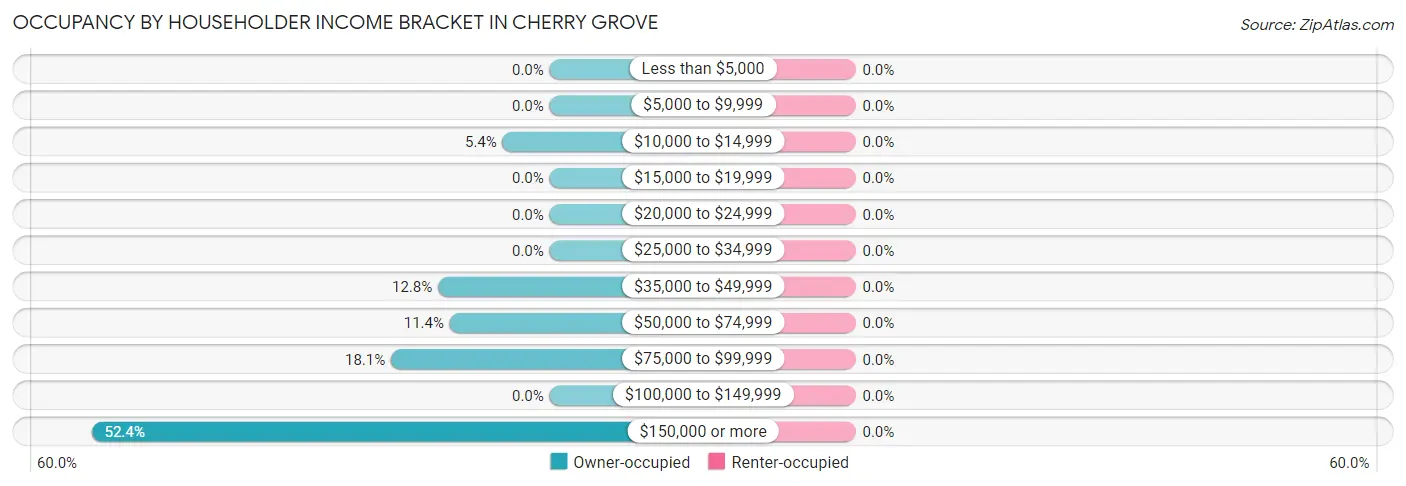
| Income Bracket | Owner-occupied | Renter-occupied |
| Less than $5,000 | 0 (0.0%) | 0 (0.0%) |
| $5,000 to $9,999 | 0 (0.0%) | 0 (0.0%) |
| $10,000 to $14,999 | 8 (5.4%) | 0 (0.0%) |
| $15,000 to $19,999 | 0 (0.0%) | 0 (0.0%) |
| $20,000 to $24,999 | 0 (0.0%) | 0 (0.0%) |
| $25,000 to $34,999 | 0 (0.0%) | 0 (0.0%) |
| $35,000 to $49,999 | 19 (12.8%) | 0 (0.0%) |
| $50,000 to $74,999 | 17 (11.4%) | 0 (0.0%) |
| $75,000 to $99,999 | 27 (18.1%) | 0 (0.0%) |
| $100,000 to $149,999 | 0 (0.0%) | 0 (0.0%) |
| $150,000 or more | 78 (52.3%) | 0 (0.0%) |
| Total | 149 (100.0%) | 0 (0.0%) |
Monthly Housing Cost Tiers in Cherry Grove
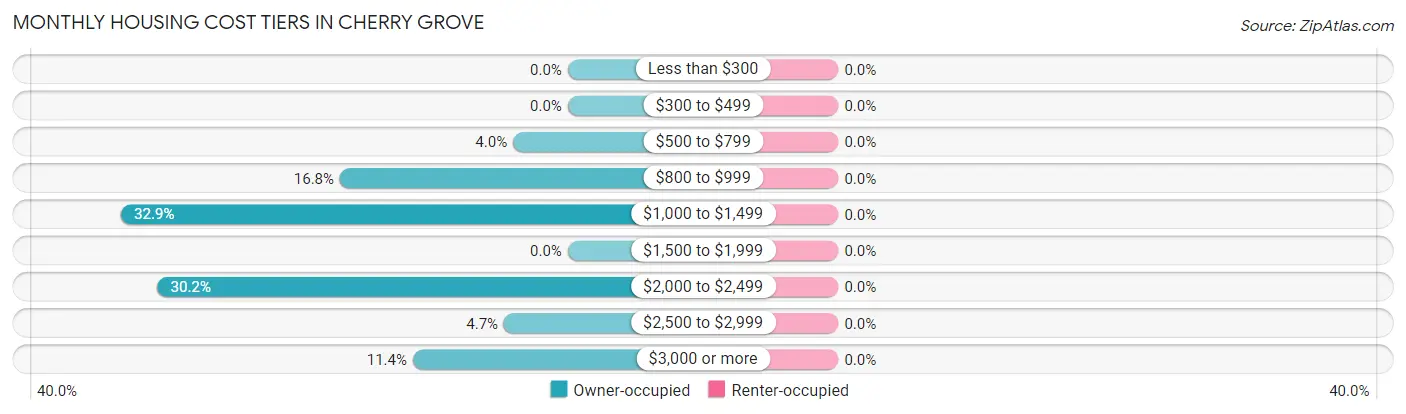
| Monthly Cost | Owner-occupied | Renter-occupied |
| Less than $300 | 0 (0.0%) | 0 (0.0%) |
| $300 to $499 | 0 (0.0%) | 0 (0.0%) |
| $500 to $799 | 6 (4.0%) | 0 (0.0%) |
| $800 to $999 | 25 (16.8%) | 0 (0.0%) |
| $1,000 to $1,499 | 49 (32.9%) | 0 (0.0%) |
| $1,500 to $1,999 | 0 (0.0%) | 0 (0.0%) |
| $2,000 to $2,499 | 45 (30.2%) | 0 (0.0%) |
| $2,500 to $2,999 | 7 (4.7%) | 0 (0.0%) |
| $3,000 or more | 17 (11.4%) | 0 (0.0%) |
| Total | 149 (100.0%) | 0 (0.0%) |
Physical Housing Characteristics in Cherry Grove
Housing Structures in Cherry Grove
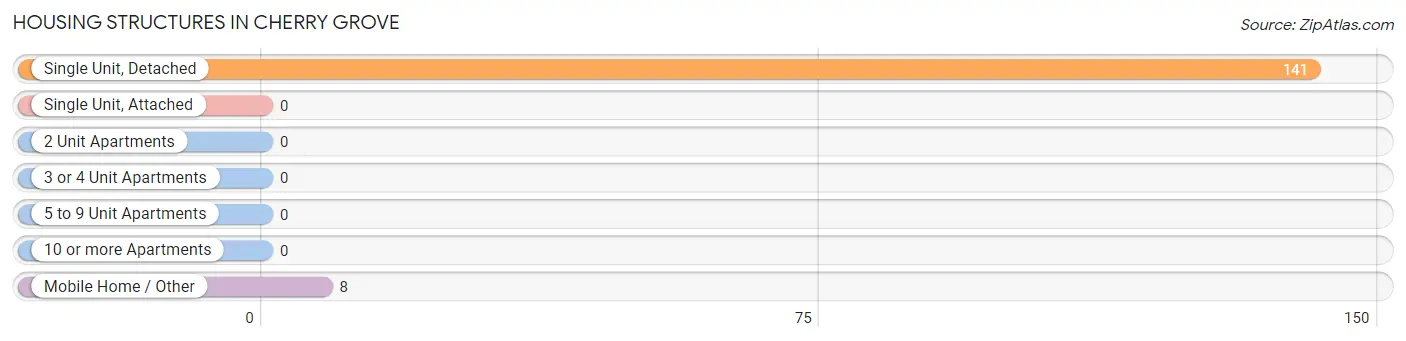
| Structure Type | # Housing Units | % Housing Units |
| Single Unit, Detached | 141 | 94.6% |
| Single Unit, Attached | 0 | 0.0% |
| 2 Unit Apartments | 0 | 0.0% |
| 3 or 4 Unit Apartments | 0 | 0.0% |
| 5 to 9 Unit Apartments | 0 | 0.0% |
| 10 or more Apartments | 0 | 0.0% |
| Mobile Home / Other | 8 | 5.4% |
| Total | 149 | 100.0% |
Housing Structures by Occupancy in Cherry Grove
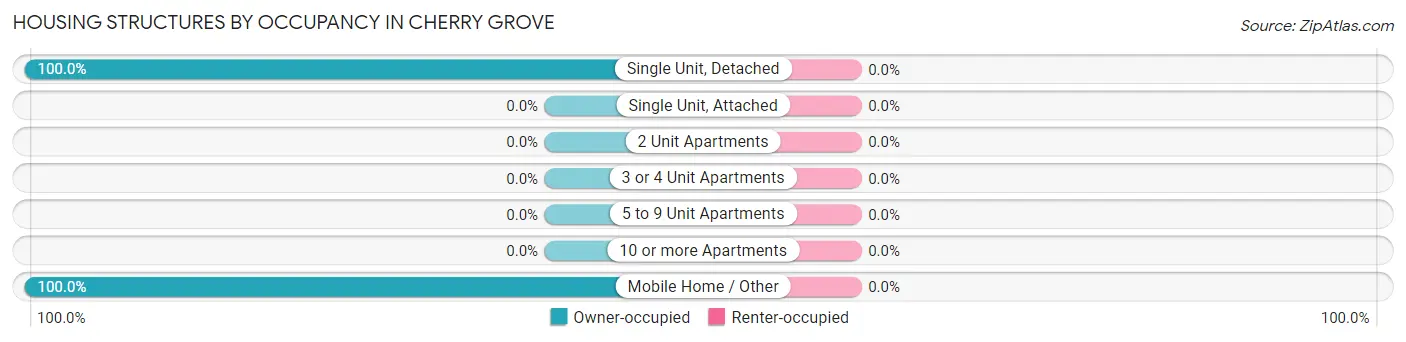
| Structure Type | Owner-occupied | Renter-occupied |
| Single Unit, Detached | 141 (100.0%) | 0 (0.0%) |
| Single Unit, Attached | 0 (0.0%) | 0 (0.0%) |
| 2 Unit Apartments | 0 (0.0%) | 0 (0.0%) |
| 3 or 4 Unit Apartments | 0 (0.0%) | 0 (0.0%) |
| 5 to 9 Unit Apartments | 0 (0.0%) | 0 (0.0%) |
| 10 or more Apartments | 0 (0.0%) | 0 (0.0%) |
| Mobile Home / Other | 8 (100.0%) | 0 (0.0%) |
| Total | 149 (100.0%) | 0 (0.0%) |
Housing Structures by Number of Rooms in Cherry Grove
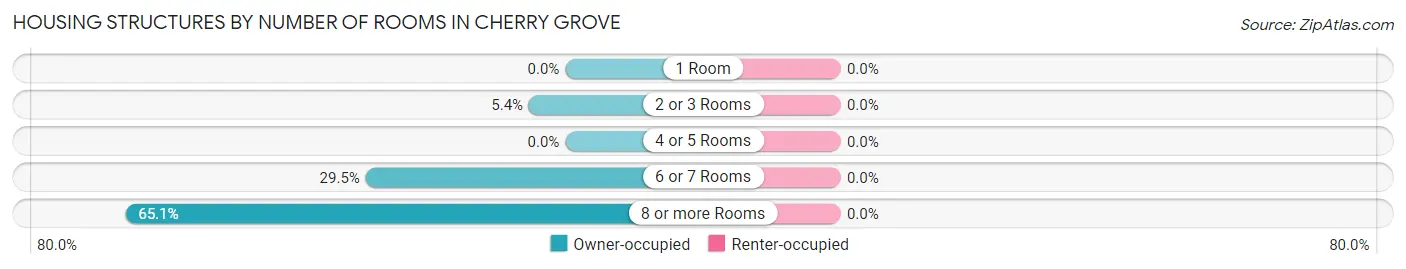
| Number of Rooms | Owner-occupied | Renter-occupied |
| 1 Room | 0 (0.0%) | 0 (0.0%) |
| 2 or 3 Rooms | 8 (5.4%) | 0 (0.0%) |
| 4 or 5 Rooms | 0 (0.0%) | 0 (0.0%) |
| 6 or 7 Rooms | 44 (29.5%) | 0 (0.0%) |
| 8 or more Rooms | 97 (65.1%) | 0 (0.0%) |
| Total | 149 (100.0%) | 0 (0.0%) |
Housing Structure by Heating Type in Cherry Grove
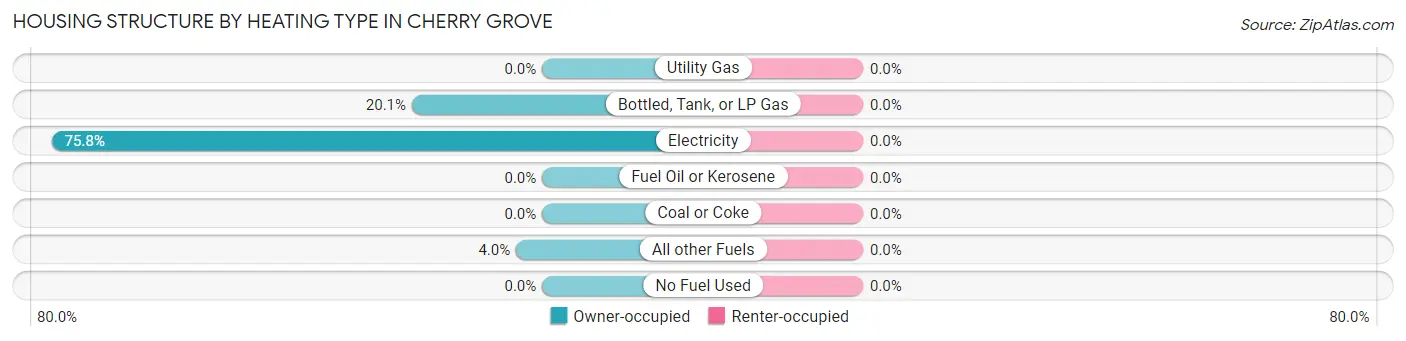
| Heating Type | Owner-occupied | Renter-occupied |
| Utility Gas | 0 (0.0%) | 0 (0.0%) |
| Bottled, Tank, or LP Gas | 30 (20.1%) | 0 (0.0%) |
| Electricity | 113 (75.8%) | 0 (0.0%) |
| Fuel Oil or Kerosene | 0 (0.0%) | 0 (0.0%) |
| Coal or Coke | 0 (0.0%) | 0 (0.0%) |
| All other Fuels | 6 (4.0%) | 0 (0.0%) |
| No Fuel Used | 0 (0.0%) | 0 (0.0%) |
| Total | 149 (100.0%) | 0 (0.0%) |
Household Vehicle Usage in Cherry Grove
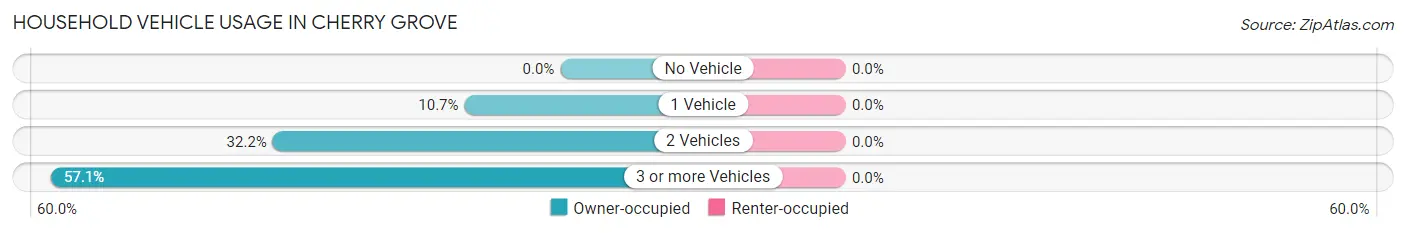
| Vehicles per Household | Owner-occupied | Renter-occupied |
| No Vehicle | 0 (0.0%) | 0 (0.0%) |
| 1 Vehicle | 16 (10.7%) | 0 (0.0%) |
| 2 Vehicles | 48 (32.2%) | 0 (0.0%) |
| 3 or more Vehicles | 85 (57.1%) | 0 (0.0%) |
| Total | 149 (100.0%) | 0 (0.0%) |
Real Estate & Mortgages in Cherry Grove
Real Estate and Mortgage Overview in Cherry Grove
| Characteristic | Without Mortgage | With Mortgage |
| Housing Units | 42 | 107 |
| Median Property Value | - | - |
| Median Household Income | - | - |
| Monthly Housing Costs | $888 | $17 |
| Real Estate Taxes | $6,029 | $0 |
Property Value by Mortgage Status in Cherry Grove
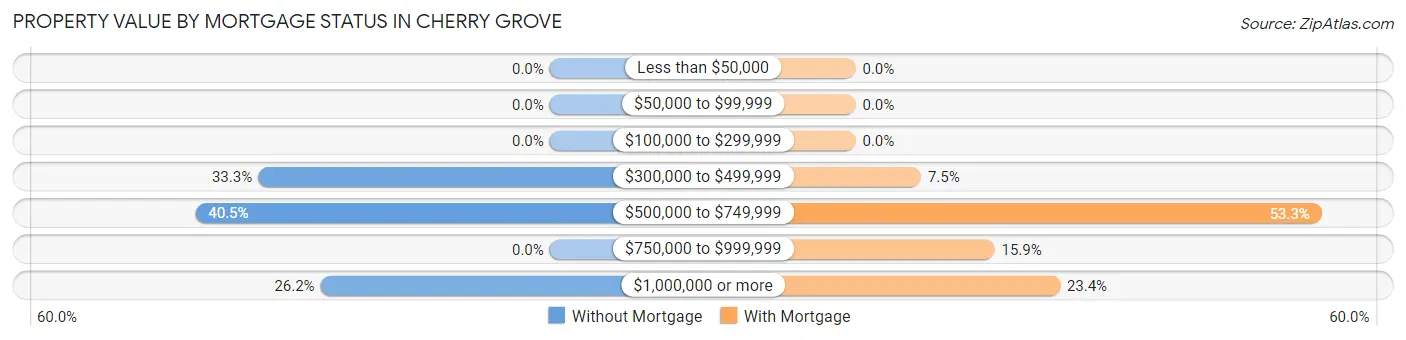
| Property Value | Without Mortgage | With Mortgage |
| Less than $50,000 | 0 (0.0%) | 0 (0.0%) |
| $50,000 to $99,999 | 0 (0.0%) | 0 (0.0%) |
| $100,000 to $299,999 | 0 (0.0%) | 0 (0.0%) |
| $300,000 to $499,999 | 14 (33.3%) | 8 (7.5%) |
| $500,000 to $749,999 | 17 (40.5%) | 57 (53.3%) |
| $750,000 to $999,999 | 0 (0.0%) | 17 (15.9%) |
| $1,000,000 or more | 11 (26.2%) | 25 (23.4%) |
| Total | 42 (100.0%) | 107 (100.0%) |
Household Income by Mortgage Status in Cherry Grove
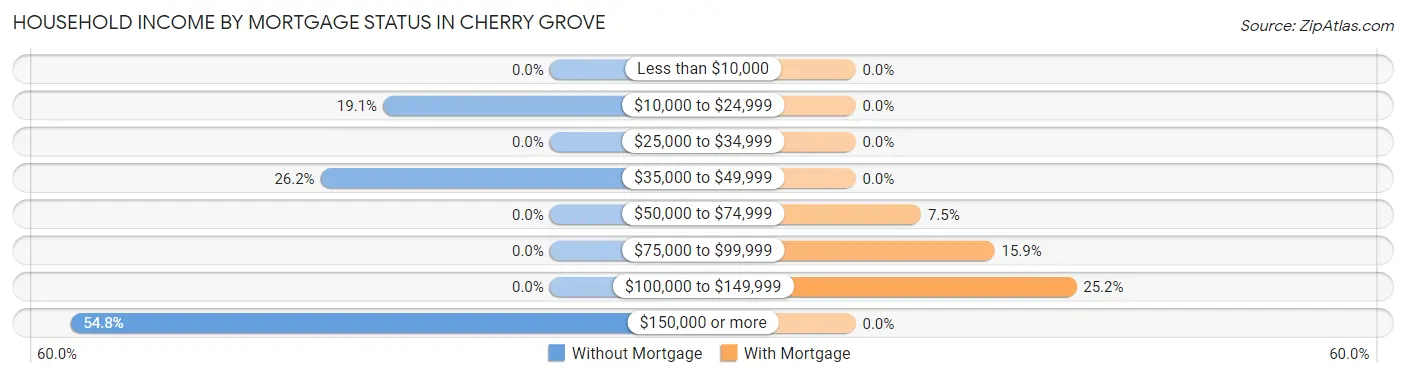
| Household Income | Without Mortgage | With Mortgage |
| Less than $10,000 | 0 (0.0%) | 0 (0.0%) |
| $10,000 to $24,999 | 8 (19.1%) | 0 (0.0%) |
| $25,000 to $34,999 | 0 (0.0%) | 0 (0.0%) |
| $35,000 to $49,999 | 11 (26.2%) | 0 (0.0%) |
| $50,000 to $74,999 | 0 (0.0%) | 8 (7.5%) |
| $75,000 to $99,999 | 0 (0.0%) | 17 (15.9%) |
| $100,000 to $149,999 | 0 (0.0%) | 27 (25.2%) |
| $150,000 or more | 23 (54.8%) | 0 (0.0%) |
| Total | 42 (100.0%) | 107 (100.0%) |
Property Value to Household Income Ratio in Cherry Grove
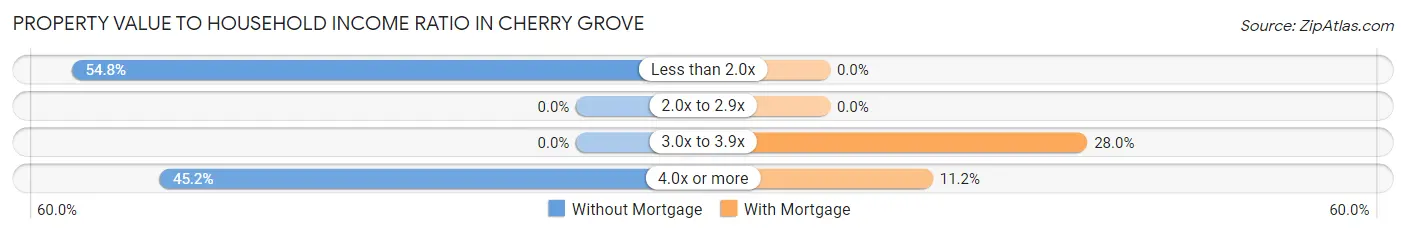
| Value-to-Income Ratio | Without Mortgage | With Mortgage |
| Less than 2.0x | 23 (54.8%) | 0 (0.0%) |
| 2.0x to 2.9x | 0 (0.0%) | 0 (0.0%) |
| 3.0x to 3.9x | 0 (0.0%) | 30 (28.0%) |
| 4.0x or more | 19 (45.2%) | 12 (11.2%) |
| Total | 42 (100.0%) | 107 (100.0%) |
Real Estate Taxes by Mortgage Status in Cherry Grove
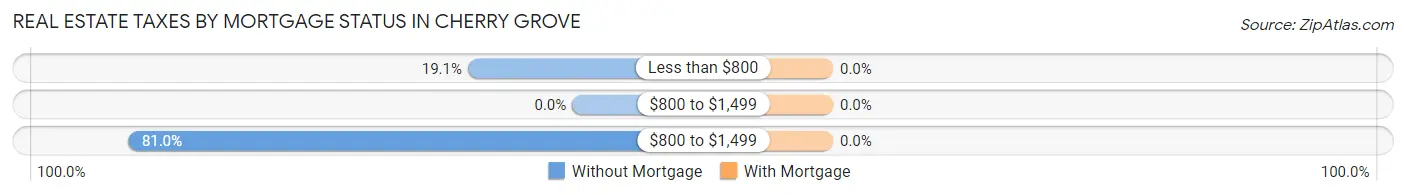
| Property Taxes | Without Mortgage | With Mortgage |
| Less than $800 | 8 (19.1%) | 0 (0.0%) |
| $800 to $1,499 | 0 (0.0%) | 0 (0.0%) |
| $800 to $1,499 | 34 (80.9%) | 0 (0.0%) |
| Total | 42 (100.0%) | 107 (100.0%) |
Health & Disability in Cherry Grove
Health Insurance Coverage by Age in Cherry Grove
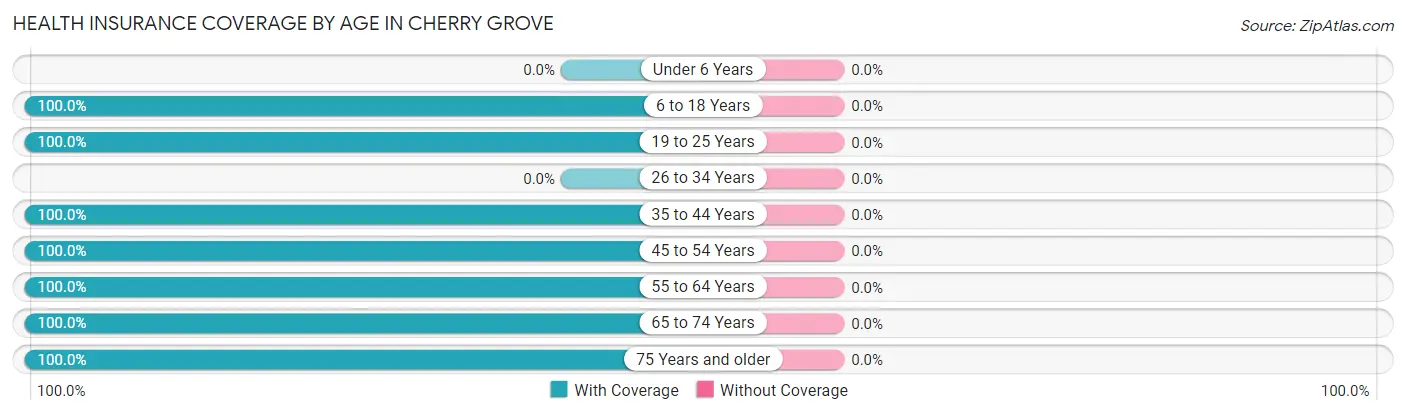
| Age Bracket | With Coverage | Without Coverage |
| Under 6 Years | 0 (0.0%) | 0 (0.0%) |
| 6 to 18 Years | 95 (100.0%) | 0 (0.0%) |
| 19 to 25 Years | 37 (100.0%) | 0 (0.0%) |
| 26 to 34 Years | 0 (0.0%) | 0 (0.0%) |
| 35 to 44 Years | 36 (100.0%) | 0 (0.0%) |
| 45 to 54 Years | 69 (100.0%) | 0 (0.0%) |
| 55 to 64 Years | 62 (100.0%) | 0 (0.0%) |
| 65 to 74 Years | 90 (100.0%) | 0 (0.0%) |
| 75 Years and older | 67 (100.0%) | 0 (0.0%) |
| Total | 456 (100.0%) | 0 (0.0%) |
Health Insurance Coverage by Citizenship Status in Cherry Grove
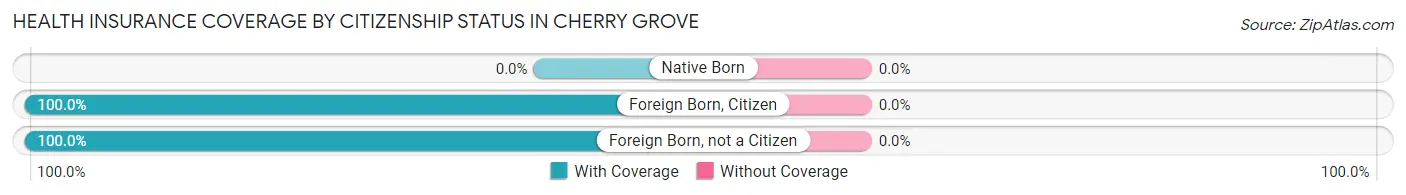
| Citizenship Status | With Coverage | Without Coverage |
| Native Born | 0 (0.0%) | 0 (0.0%) |
| Foreign Born, Citizen | 95 (100.0%) | 0 (0.0%) |
| Foreign Born, not a Citizen | 37 (100.0%) | 0 (0.0%) |
Health Insurance Coverage by Household Income in Cherry Grove
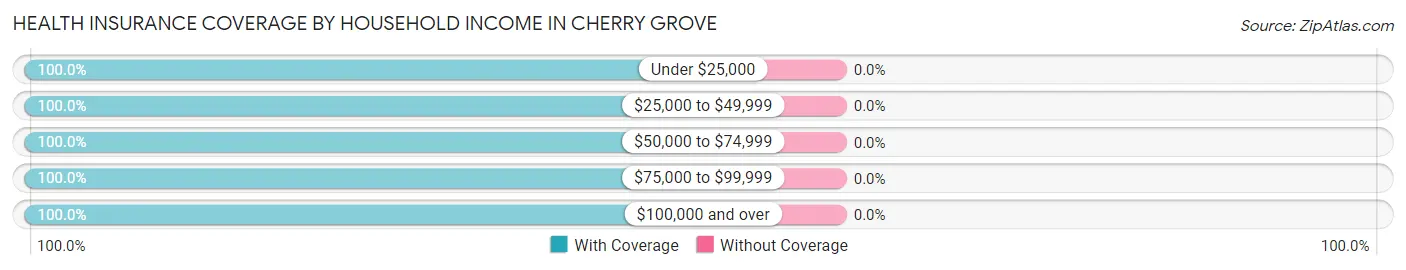
| Household Income | With Coverage | Without Coverage |
| Under $25,000 | 8 (100.0%) | 0 (0.0%) |
| $25,000 to $49,999 | 30 (100.0%) | 0 (0.0%) |
| $50,000 to $74,999 | 67 (100.0%) | 0 (0.0%) |
| $75,000 to $99,999 | 53 (100.0%) | 0 (0.0%) |
| $100,000 and over | 286 (100.0%) | 0 (0.0%) |
Public vs Private Health Insurance Coverage by Age in Cherry Grove
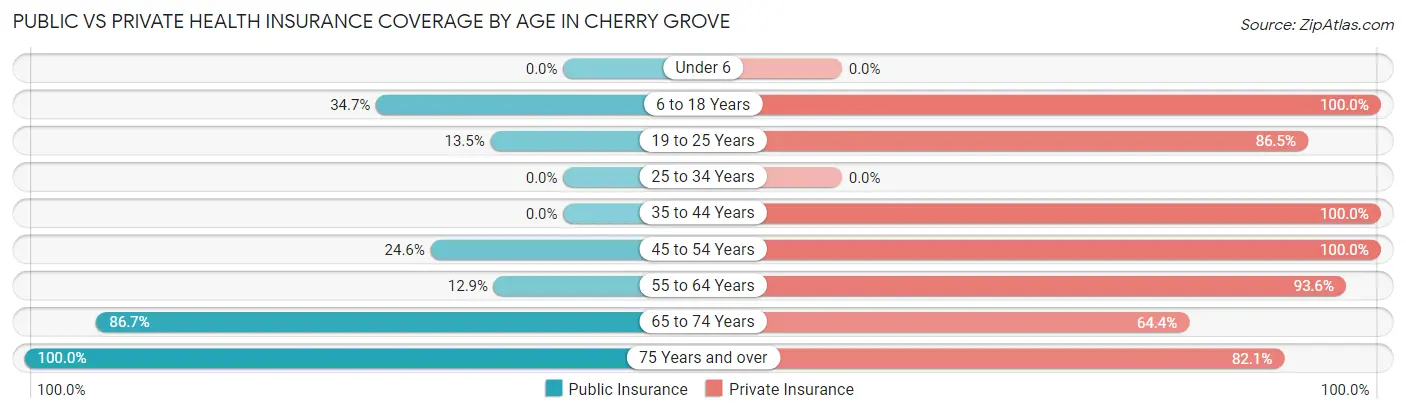
| Age Bracket | Public Insurance | Private Insurance |
| Under 6 | 0 (0.0%) | 0 (0.0%) |
| 6 to 18 Years | 33 (34.7%) | 95 (100.0%) |
| 19 to 25 Years | 5 (13.5%) | 32 (86.5%) |
| 25 to 34 Years | 0 (0.0%) | 0 (0.0%) |
| 35 to 44 Years | 0 (0.0%) | 36 (100.0%) |
| 45 to 54 Years | 17 (24.6%) | 69 (100.0%) |
| 55 to 64 Years | 8 (12.9%) | 58 (93.5%) |
| 65 to 74 Years | 78 (86.7%) | 58 (64.4%) |
| 75 Years and over | 67 (100.0%) | 55 (82.1%) |
| Total | 208 (45.6%) | 403 (88.4%) |
Disability Status by Sex by Age in Cherry Grove
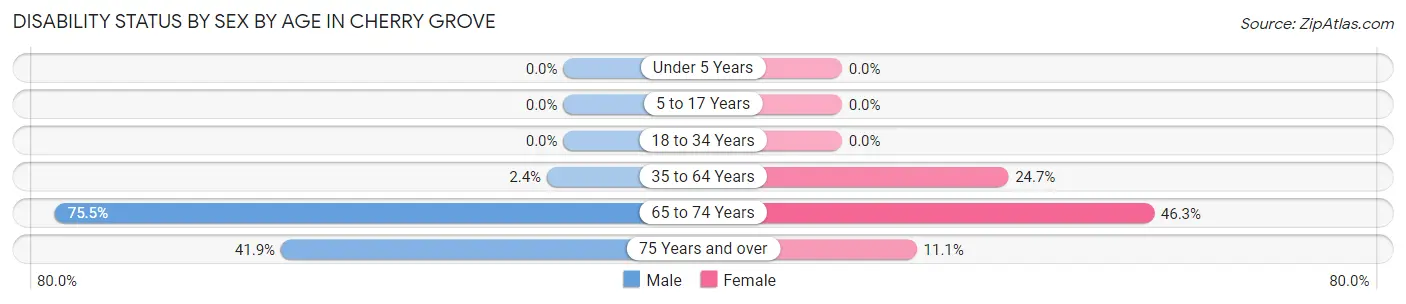
| Age Bracket | Male | Female |
| Under 5 Years | 0 (0.0%) | 0 (0.0%) |
| 5 to 17 Years | 0 (0.0%) | 0 (0.0%) |
| 18 to 34 Years | 0 (0.0%) | 0 (0.0%) |
| 35 to 64 Years | 2 (2.4%) | 21 (24.7%) |
| 65 to 74 Years | 37 (75.5%) | 19 (46.3%) |
| 75 Years and over | 13 (41.9%) | 4 (11.1%) |
Disability Class by Sex by Age in Cherry Grove
Disability Class: Hearing Difficulty
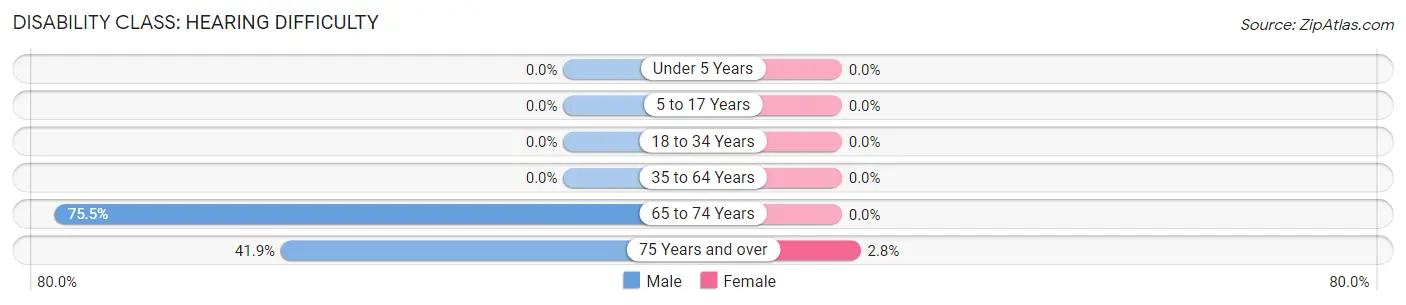
| Age Bracket | Male | Female |
| Under 5 Years | 0 (0.0%) | 0 (0.0%) |
| 5 to 17 Years | 0 (0.0%) | 0 (0.0%) |
| 18 to 34 Years | 0 (0.0%) | 0 (0.0%) |
| 35 to 64 Years | 0 (0.0%) | 0 (0.0%) |
| 65 to 74 Years | 37 (75.5%) | 0 (0.0%) |
| 75 Years and over | 13 (41.9%) | 1 (2.8%) |
Disability Class: Vision Difficulty
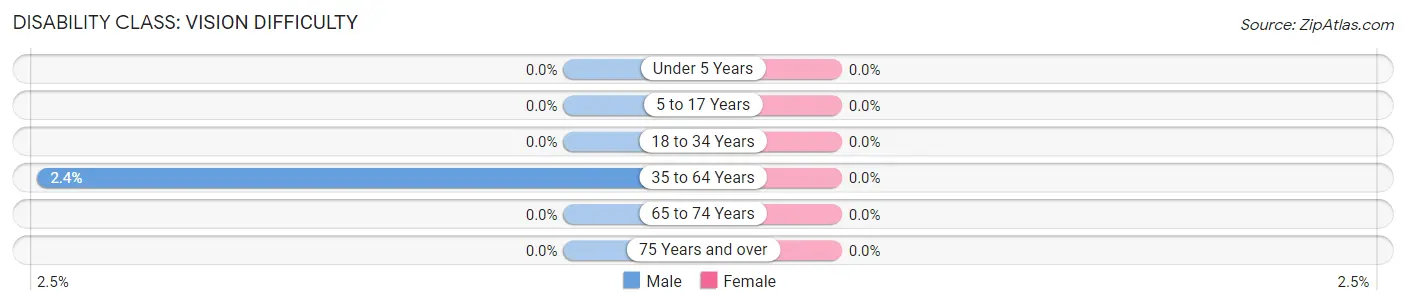
| Age Bracket | Male | Female |
| Under 5 Years | 0 (0.0%) | 0 (0.0%) |
| 5 to 17 Years | 0 (0.0%) | 0 (0.0%) |
| 18 to 34 Years | 0 (0.0%) | 0 (0.0%) |
| 35 to 64 Years | 2 (2.4%) | 0 (0.0%) |
| 65 to 74 Years | 0 (0.0%) | 0 (0.0%) |
| 75 Years and over | 0 (0.0%) | 0 (0.0%) |
Disability Class: Cognitive Difficulty
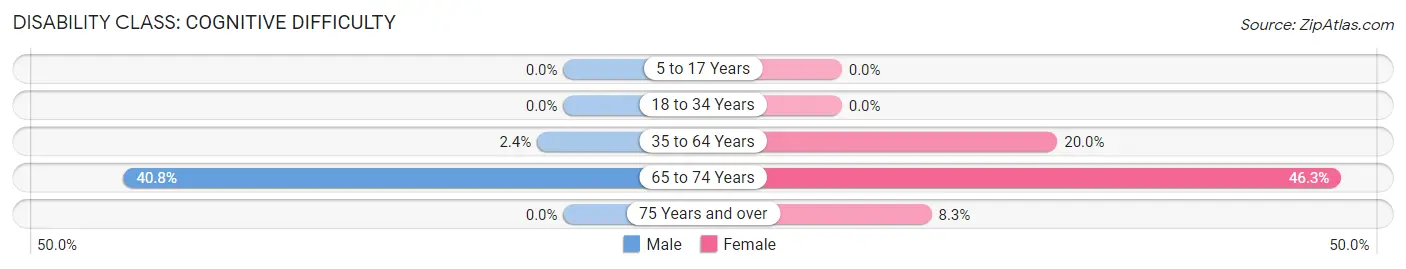
| Age Bracket | Male | Female |
| 5 to 17 Years | 0 (0.0%) | 0 (0.0%) |
| 18 to 34 Years | 0 (0.0%) | 0 (0.0%) |
| 35 to 64 Years | 2 (2.4%) | 17 (20.0%) |
| 65 to 74 Years | 20 (40.8%) | 19 (46.3%) |
| 75 Years and over | 0 (0.0%) | 3 (8.3%) |
Disability Class: Ambulatory Difficulty
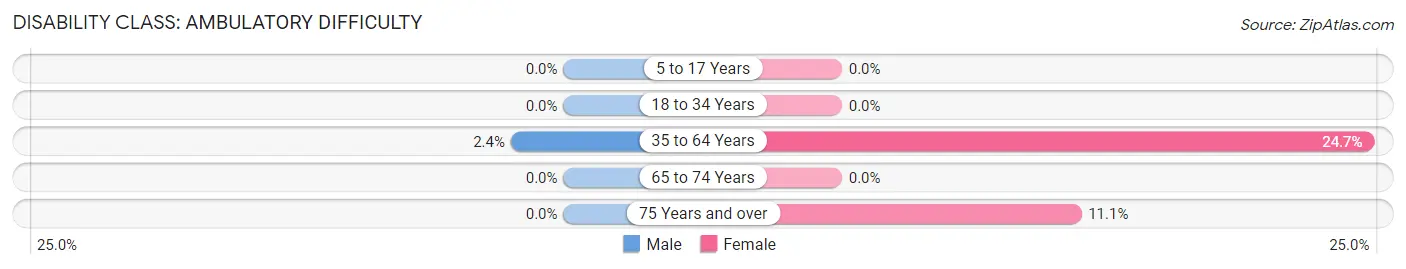
| Age Bracket | Male | Female |
| 5 to 17 Years | 0 (0.0%) | 0 (0.0%) |
| 18 to 34 Years | 0 (0.0%) | 0 (0.0%) |
| 35 to 64 Years | 2 (2.4%) | 21 (24.7%) |
| 65 to 74 Years | 0 (0.0%) | 0 (0.0%) |
| 75 Years and over | 0 (0.0%) | 4 (11.1%) |
Disability Class: Self-Care Difficulty
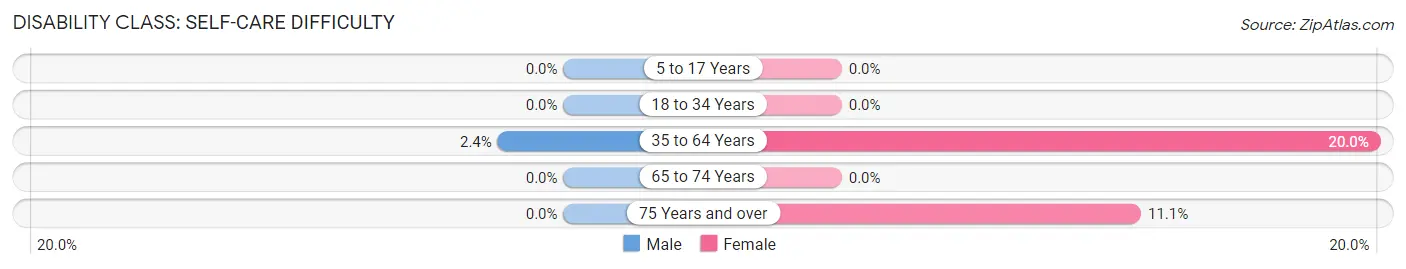
| Age Bracket | Male | Female |
| 5 to 17 Years | 0 (0.0%) | 0 (0.0%) |
| 18 to 34 Years | 0 (0.0%) | 0 (0.0%) |
| 35 to 64 Years | 2 (2.4%) | 17 (20.0%) |
| 65 to 74 Years | 0 (0.0%) | 0 (0.0%) |
| 75 Years and over | 0 (0.0%) | 4 (11.1%) |
Technology Access in Cherry Grove
Computing Device Access in Cherry Grove
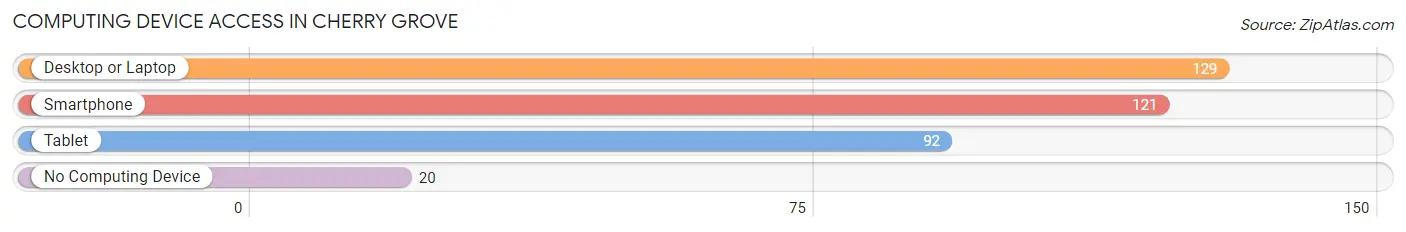
| Device Type | # Households | % Households |
| Desktop or Laptop | 129 | 86.6% |
| Smartphone | 121 | 81.2% |
| Tablet | 92 | 61.7% |
| No Computing Device | 20 | 13.4% |
| Total | 149 | 100.0% |
Internet Access in Cherry Grove
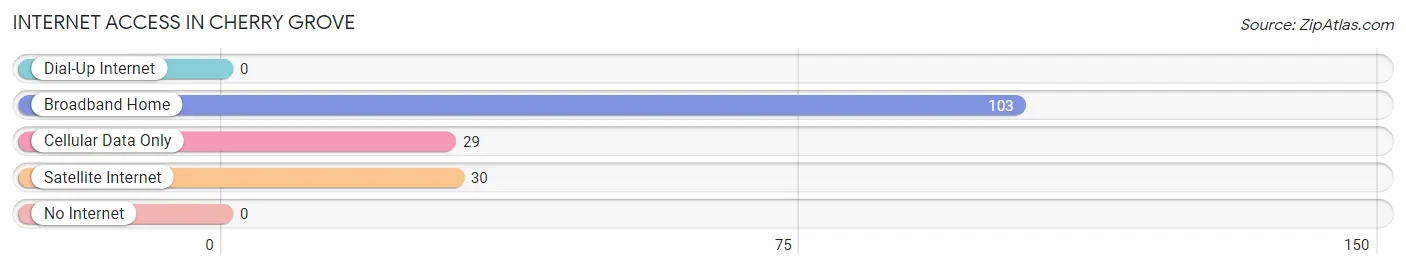
| Internet Type | # Households | % Households |
| Dial-Up Internet | 0 | 0.0% |
| Broadband Home | 103 | 69.1% |
| Cellular Data Only | 29 | 19.5% |
| Satellite Internet | 30 | 20.1% |
| No Internet | 0 | 0.0% |
| Total | 149 | 100.0% |
Cherry Grove Summary
Cherry Grove is a small unincorporated community located in Snohomish County, Washington, United States. It is situated in the foothills of the Cascade Mountains, approximately 25 miles northeast of Seattle. The community is located along the Stillaguamish River, and is surrounded by lush forests and rolling hills.
History
The area now known as Cherry Grove was first settled in the late 1800s by homesteaders who were drawn to the area by its abundant natural resources. The first settlers were mostly of Scandinavian descent, and the community was originally known as “Scandinavian Grove.” The name was changed to “Cherry Grove” in the early 1900s, when the area became known for its abundance of wild cherry trees.
In the early 1900s, the area was home to a thriving logging industry, and the community was home to several sawmills and logging camps. The logging industry declined in the mid-1900s, and the community shifted its focus to agriculture. Today, the area is home to several small farms and orchards, and is known for its production of apples, pears, and other fruits and vegetables.
Geography
Cherry Grove is located in the foothills of the Cascade Mountains, approximately 25 miles northeast of Seattle. The community is situated along the Stillaguamish River, and is surrounded by lush forests and rolling hills. The area is known for its abundance of wildlife, including deer, elk, and bald eagles.
The climate in Cherry Grove is mild and temperate, with warm summers and cool winters. The average annual temperature is around 50 degrees Fahrenheit, and the average annual precipitation is around 40 inches.
Economy
The economy of Cherry Grove is largely based on agriculture and tourism. The area is home to several small farms and orchards, and is known for its production of apples, pears, and other fruits and vegetables. The area is also popular with tourists, who come to enjoy the area’s natural beauty and outdoor recreation opportunities.
Demographics
As of the 2010 census, the population of Cherry Grove was 1,093. The racial makeup of the community was 94.3% White, 0.7% African American, 0.7% Native American, 0.7% Asian, 0.1% Pacific Islander, and 2.6% from other races. The median household income was $50,000, and the median age was 44.
Cherry Grove is a small, close-knit community with a strong sense of community and pride. The area is known for its friendly, welcoming atmosphere, and its residents are passionate about preserving the area’s natural beauty and rural character.
Common Questions
What is Per Capita Income in Cherry Grove?
Per Capita income in Cherry Grove is $58,388.
What is the Median Family Income in Cherry Grove?
Median Family Income in Cherry Grove is $233,558.
What is Inequality or Gini Index in Cherry Grove?
Inequality or Gini Index in Cherry Grove is 0.37.
What is the Total Population of Cherry Grove?
Total Population of Cherry Grove is 456.
What is the Total Male Population of Cherry Grove?
Total Male Population of Cherry Grove is 254.
What is the Total Female Population of Cherry Grove?
Total Female Population of Cherry Grove is 202.
What is the Ratio of Males per 100 Females in Cherry Grove?
There are 125.74 Males per 100 Females in Cherry Grove.
What is the Ratio of Females per 100 Males in Cherry Grove?
There are 79.53 Females per 100 Males in Cherry Grove.
What is the Median Population Age in Cherry Grove?
Median Population Age in Cherry Grove is 54.7 Years.
What is the Average Family Size in Cherry Grove
Average Family Size in Cherry Grove is 3.2 People.
What is the Average Household Size in Cherry Grove
Average Household Size in Cherry Grove is 3.0 People.
How Large is the Labor Force in Cherry Grove?
There are 209 People in the Labor Forcein in Cherry Grove.
What is the Percentage of People in the Labor Force in Cherry Grove?
49.4% of People are in the Labor Force in Cherry Grove.