Duvall, WA Map & Demographics
Duvall Map
Duvall Overview
$60,634
PER CAPITA INCOME
$182,513
AVG FAMILY INCOME
$168,663
AVG HOUSEHOLD INCOME
62.5%
WAGE / INCOME GAP [ % ]
37.5¢/ $1
WAGE / INCOME GAP [ $ ]
0.35
INEQUALITY / GINI INDEX
8,128
TOTAL POPULATION
3,867
MALE POPULATION
4,261
FEMALE POPULATION
90.75
MALES / 100 FEMALES
110.19
FEMALES / 100 MALES
35.4
MEDIAN AGE
3.5
AVG FAMILY SIZE
3.1
AVG HOUSEHOLD SIZE
4,240
LABOR FORCE [ PEOPLE ]
72.2%
PERCENT IN LABOR FORCE
4.3%
UNEMPLOYMENT RATE
Duvall Zip Codes
Duvall Area Codes
Income in Duvall
Income Overview in Duvall
Per Capita Income in Duvall is $60,634, while median incomes of families and households are $182,513 and $168,663 respectively.
| Characteristic | Number | Measure |
| Per Capita Income | 8,128 | $60,634 |
| Median Family Income | 2,173 | $182,513 |
| Mean Family Income | 2,173 | $204,626 |
| Median Household Income | 2,584 | $168,663 |
| Mean Household Income | 2,584 | $189,649 |
| Income Deficit | 2,173 | $0 |
| Wage / Income Gap (%) | 8,128 | 62.52% |
| Wage / Income Gap ($) | 8,128 | 37.48¢ per $1 |
| Gini / Inequality Index | 8,128 | 0.35 |
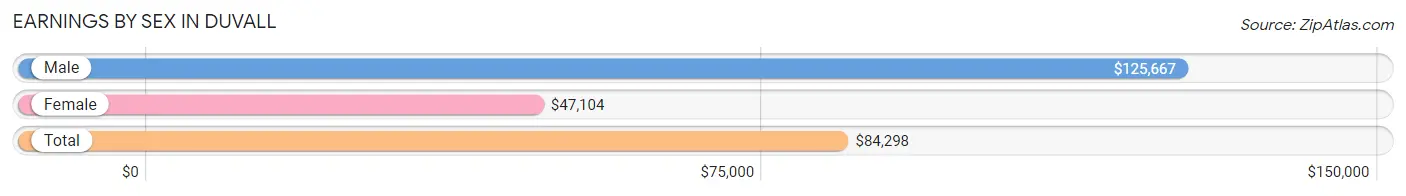
Earnings by Sex in Duvall
Average Earnings in Duvall are $84,298, $125,667 for men and $47,104 for women, a difference of 62.5%.
| Sex | Number | Average Earnings |
| Male | 2,442 (56.6%) | $125,667 |
| Female | 1,876 (43.4%) | $47,104 |
| Total | 4,318 (100.0%) | $84,298 |
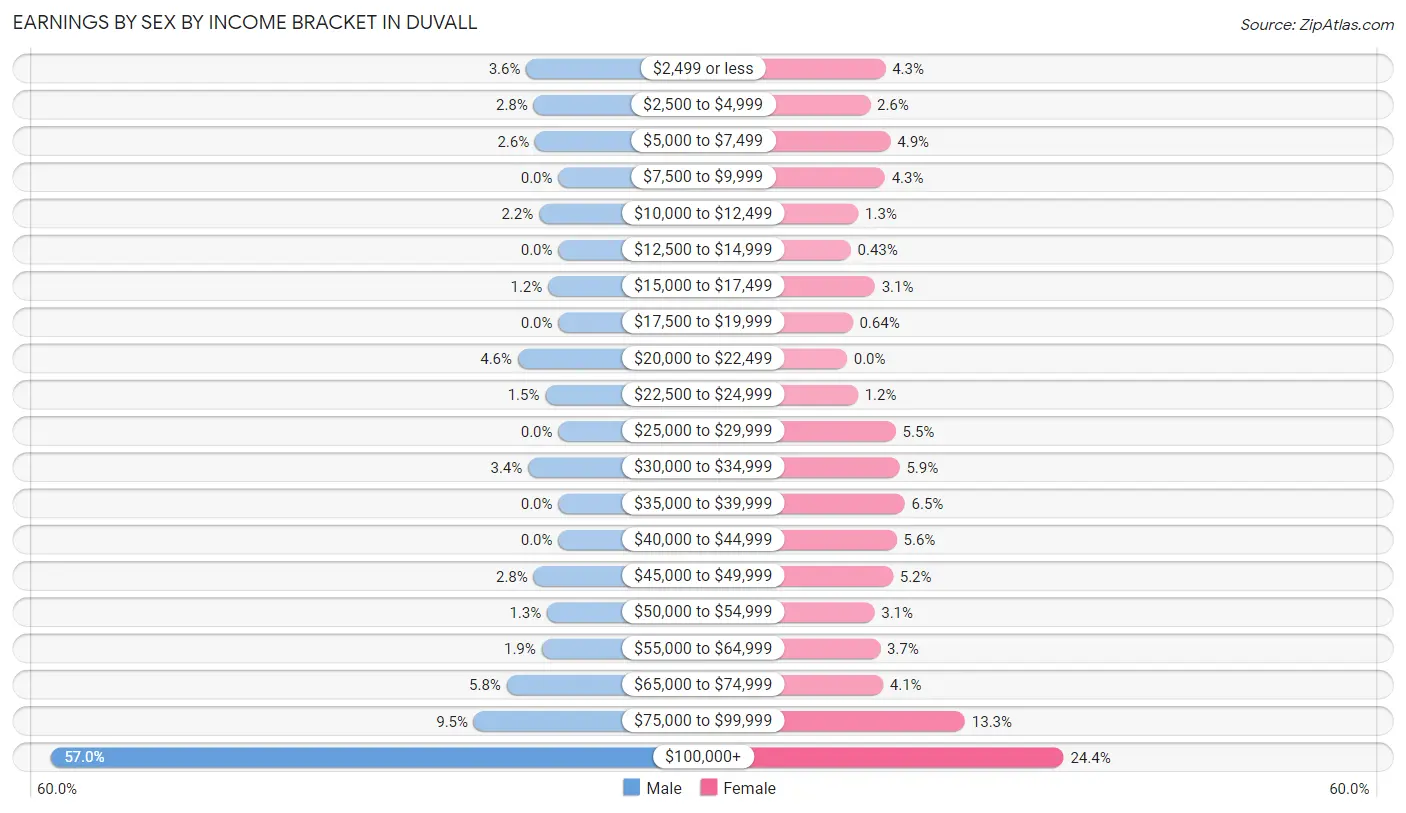
Earnings by Sex by Income Bracket in Duvall
The most common earnings brackets in Duvall are $100,000+ for men (1,392 | 57.0%) and $100,000+ for women (457 | 24.4%).
| Income | Male | Female |
| $2,499 or less | 88 (3.6%) | 81 (4.3%) |
| $2,500 to $4,999 | 68 (2.8%) | 49 (2.6%) |
| $5,000 to $7,499 | 64 (2.6%) | 92 (4.9%) |
| $7,500 to $9,999 | 0 (0.0%) | 80 (4.3%) |
| $10,000 to $12,499 | 53 (2.2%) | 24 (1.3%) |
| $12,500 to $14,999 | 0 (0.0%) | 8 (0.4%) |
| $15,000 to $17,499 | 28 (1.1%) | 59 (3.1%) |
| $17,500 to $19,999 | 0 (0.0%) | 12 (0.6%) |
| $20,000 to $22,499 | 111 (4.5%) | 0 (0.0%) |
| $22,500 to $24,999 | 36 (1.5%) | 23 (1.2%) |
| $25,000 to $29,999 | 0 (0.0%) | 103 (5.5%) |
| $30,000 to $34,999 | 83 (3.4%) | 111 (5.9%) |
| $35,000 to $39,999 | 0 (0.0%) | 122 (6.5%) |
| $40,000 to $44,999 | 0 (0.0%) | 105 (5.6%) |
| $45,000 to $49,999 | 68 (2.8%) | 97 (5.2%) |
| $50,000 to $54,999 | 31 (1.3%) | 58 (3.1%) |
| $55,000 to $64,999 | 46 (1.9%) | 70 (3.7%) |
| $65,000 to $74,999 | 142 (5.8%) | 76 (4.1%) |
| $75,000 to $99,999 | 232 (9.5%) | 249 (13.3%) |
| $100,000+ | 1,392 (57.0%) | 457 (24.4%) |
| Total | 2,442 (100.0%) | 1,876 (100.0%) |
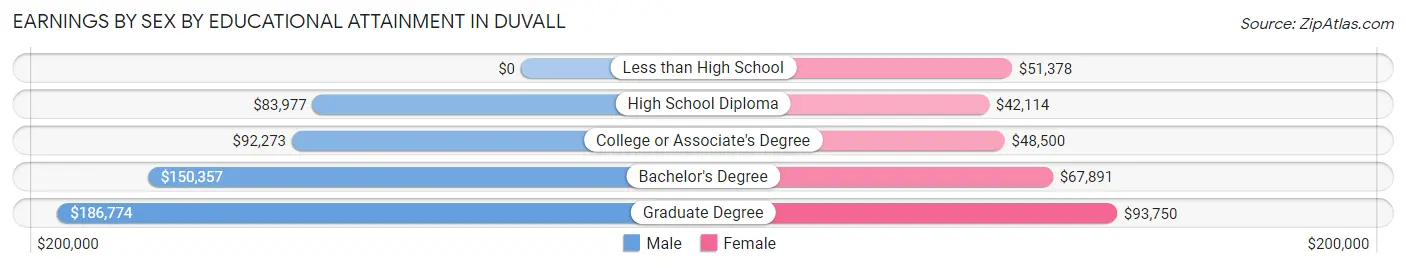
Earnings by Sex by Educational Attainment in Duvall
Average earnings in Duvall are $142,652 for men and $62,540 for women, a difference of 56.2%. Men with an educational attainment of graduate degree enjoy the highest average annual earnings of $186,774, while those with high school diploma education earn the least with $83,977. Women with an educational attainment of graduate degree earn the most with the average annual earnings of $93,750, while those with high school diploma education have the smallest earnings of $42,114.
| Educational Attainment | Male Income | Female Income |
| Less than High School | - | - |
| High School Diploma | $83,977 | $42,114 |
| College or Associate's Degree | $92,273 | $48,500 |
| Bachelor's Degree | $150,357 | $67,891 |
| Graduate Degree | $186,774 | $93,750 |
| Total | $142,652 | $62,540 |
Family Income in Duvall
Family Income Brackets in Duvall
According to the Duvall family income data, there are 880 families falling into the $200,000+ income range, which is the most common income bracket and makes up 40.5% of all families.
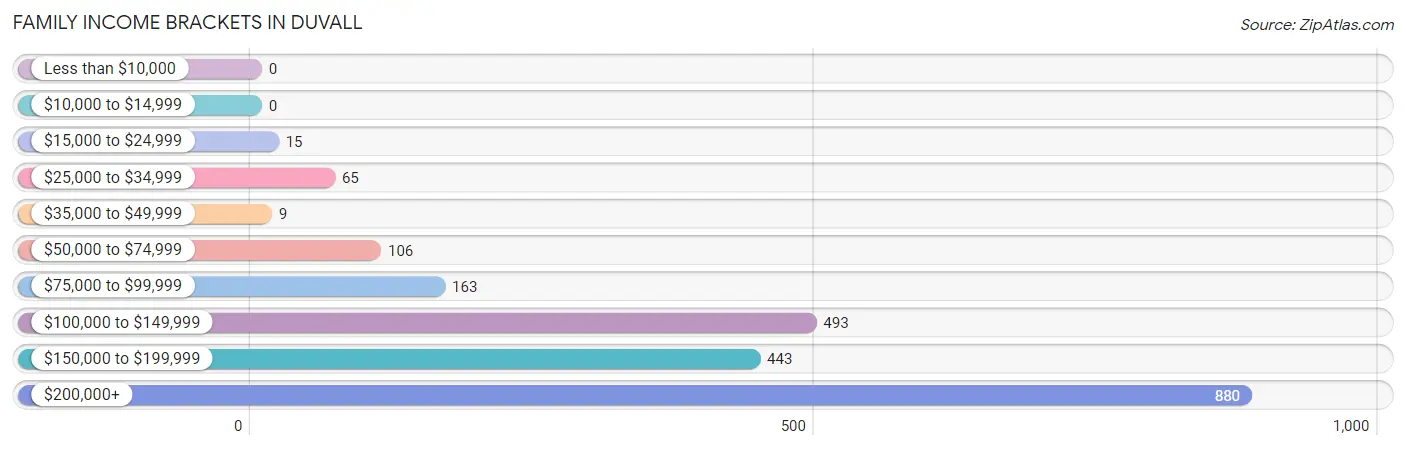
| Income Bracket | # Families | % Families |
| Less than $10,000 | 0 | 0.0% |
| $10,000 to $14,999 | 0 | 0.0% |
| $15,000 to $24,999 | 15 | 0.7% |
| $25,000 to $34,999 | 65 | 3.0% |
| $35,000 to $49,999 | 9 | 0.4% |
| $50,000 to $74,999 | 106 | 4.9% |
| $75,000 to $99,999 | 163 | 7.5% |
| $100,000 to $149,999 | 493 | 22.7% |
| $150,000 to $199,999 | 443 | 20.4% |
| $200,000+ | 880 | 40.5% |
Family Income by Famaliy Size in Duvall
4-person families (760 | 35.0%) account for the highest median family income in Duvall with $208,500 per family, while 2-person families (649 | 29.9%) have the highest median income of $91,476 per family member.
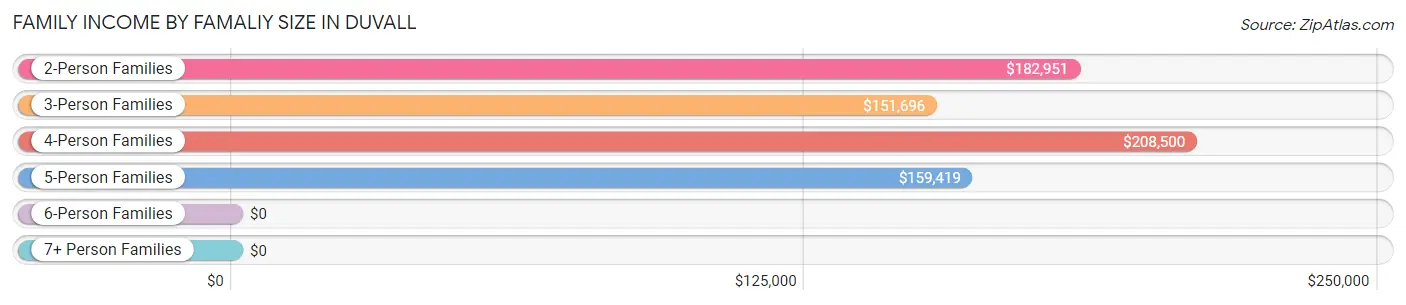
| Income Bracket | # Families | Median Income |
| 2-Person Families | 649 (29.9%) | $182,951 |
| 3-Person Families | 459 (21.1%) | $151,696 |
| 4-Person Families | 760 (35.0%) | $208,500 |
| 5-Person Families | 152 (7.0%) | $159,419 |
| 6-Person Families | 44 (2.0%) | $0 |
| 7+ Person Families | 109 (5.0%) | $0 |
| Total | 2,173 (100.0%) | $182,513 |
Family Income by Number of Earners in Duvall
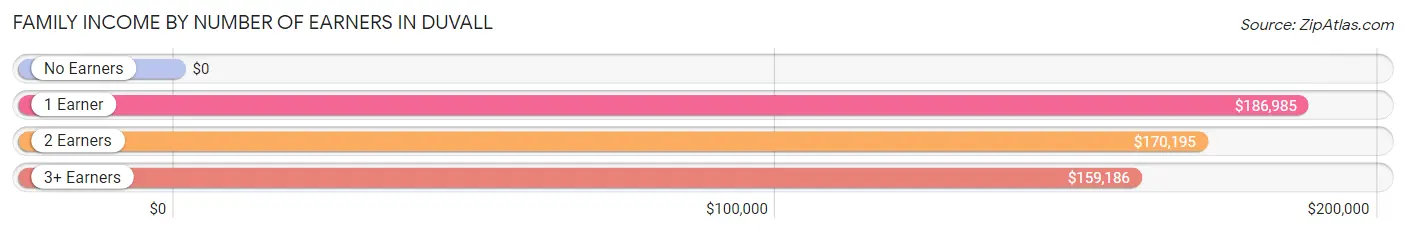
| Number of Earners | # Families | Median Income |
| No Earners | 85 (3.9%) | $0 |
| 1 Earner | 669 (30.8%) | $186,985 |
| 2 Earners | 1,133 (52.1%) | $170,195 |
| 3+ Earners | 286 (13.2%) | $159,186 |
| Total | 2,173 (100.0%) | $182,513 |
Household Income in Duvall
Household Income Brackets in Duvall
With 938 households falling in the category, the $200,000+ income range is the most frequent in Duvall, accounting for 36.3% of all households.
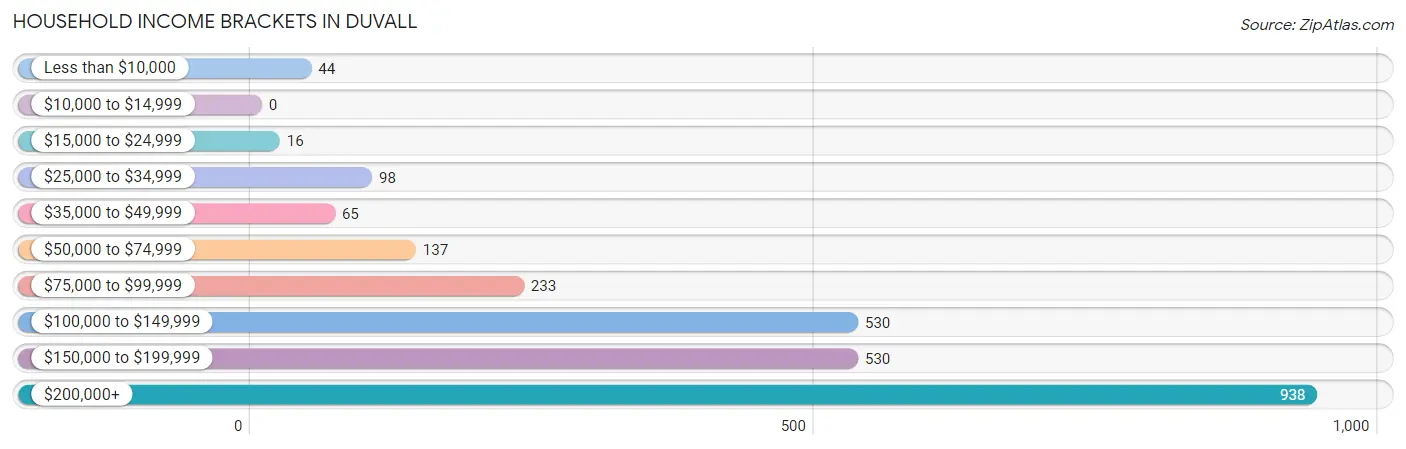
| Income Bracket | # Households | % Households |
| Less than $10,000 | 44 | 1.7% |
| $10,000 to $14,999 | 0 | 0.0% |
| $15,000 to $24,999 | 16 | 0.6% |
| $25,000 to $34,999 | 98 | 3.8% |
| $35,000 to $49,999 | 65 | 2.5% |
| $50,000 to $74,999 | 137 | 5.3% |
| $75,000 to $99,999 | 233 | 9.0% |
| $100,000 to $149,999 | 530 | 20.5% |
| $150,000 to $199,999 | 530 | 20.5% |
| $200,000+ | 938 | 36.3% |
Household Income by Householder Age in Duvall
The median household income in Duvall is $168,663, with the highest median household income of $210,089 found in the 25 to 44 years age bracket for the primary householder. A total of 1,057 households (40.9%) fall into this category. Meanwhile, the 15 to 24 years age bracket for the primary householder has the lowest median household income of $0, with 94 households (3.6%) in this group.
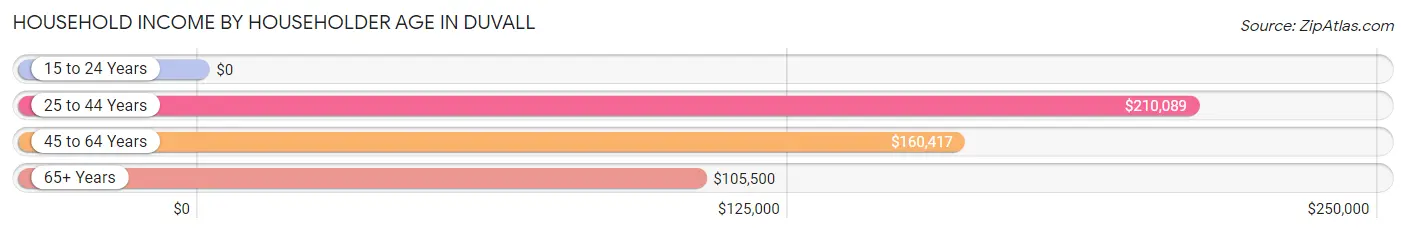
| Income Bracket | # Households | Median Income |
| 15 to 24 Years | 94 (3.6%) | $0 |
| 25 to 44 Years | 1,057 (40.9%) | $210,089 |
| 45 to 64 Years | 1,173 (45.4%) | $160,417 |
| 65+ Years | 260 (10.1%) | $105,500 |
| Total | 2,584 (100.0%) | $168,663 |
Poverty in Duvall
Income Below Poverty by Sex and Age in Duvall
With 8.0% poverty level for males and 7.2% for females among the residents of Duvall, 18 to 24 year old males and under 5 year old females are the most vulnerable to poverty, with 79 males (21.6%) and 69 females (18.9%) in their respective age groups living below the poverty level.
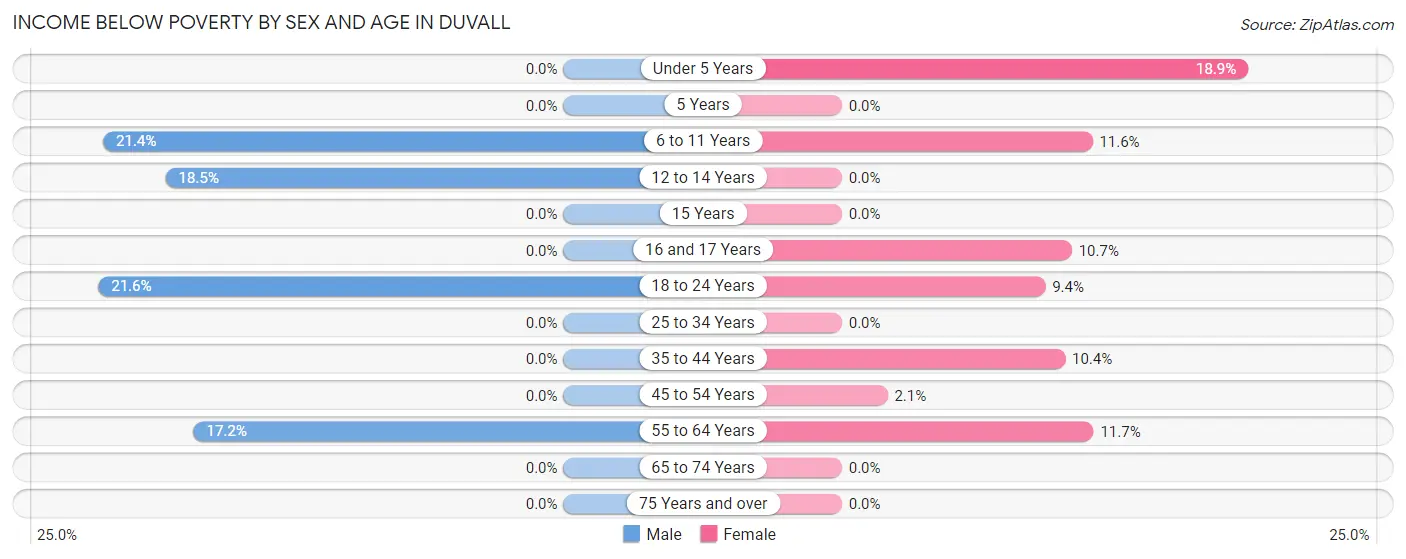
| Age Bracket | Male | Female |
| Under 5 Years | 0 (0.0%) | 69 (18.9%) |
| 5 Years | 0 (0.0%) | 0 (0.0%) |
| 6 to 11 Years | 72 (21.4%) | 60 (11.6%) |
| 12 to 14 Years | 72 (18.5%) | 0 (0.0%) |
| 15 Years | 0 (0.0%) | 0 (0.0%) |
| 16 and 17 Years | 0 (0.0%) | 16 (10.7%) |
| 18 to 24 Years | 79 (21.6%) | 17 (9.4%) |
| 25 to 34 Years | 0 (0.0%) | 0 (0.0%) |
| 35 to 44 Years | 0 (0.0%) | 67 (10.4%) |
| 45 to 54 Years | 0 (0.0%) | 15 (2.1%) |
| 55 to 64 Years | 87 (17.2%) | 62 (11.7%) |
| 65 to 74 Years | 0 (0.0%) | 0 (0.0%) |
| 75 Years and over | 0 (0.0%) | 0 (0.0%) |
| Total | 310 (8.0%) | 306 (7.2%) |
Income Above Poverty by Sex and Age in Duvall
According to the poverty statistics in Duvall, males aged under 5 years and females aged 5 years are the age groups that are most secure financially, with 100.0% of males and 100.0% of females in these age groups living above the poverty line.
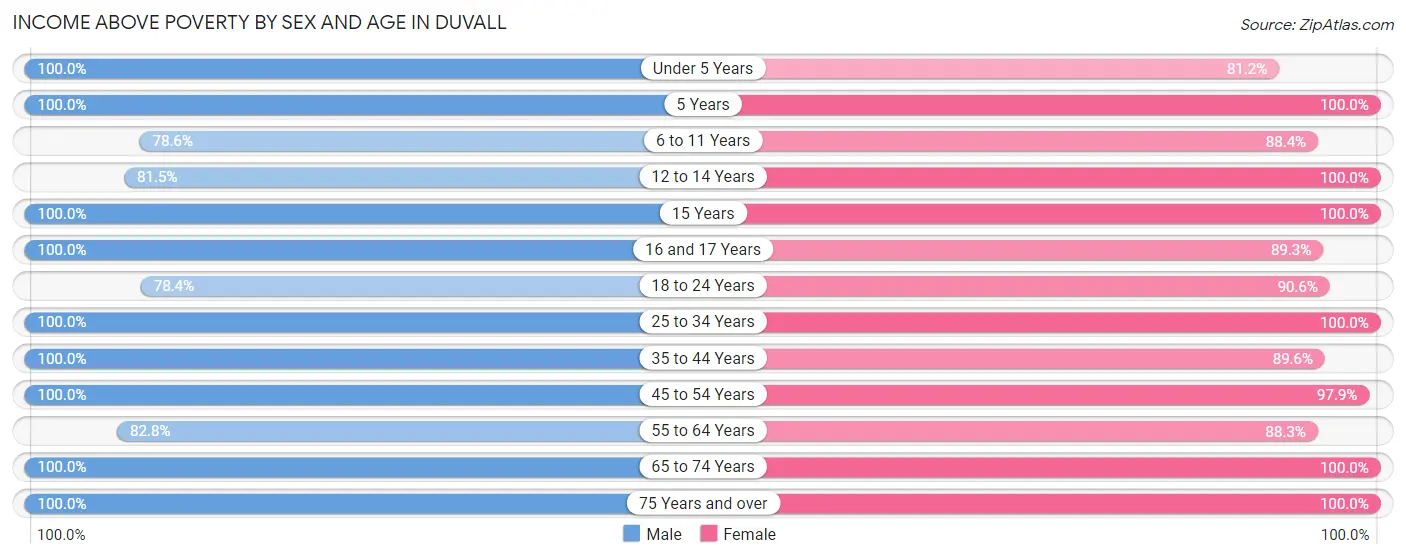
| Age Bracket | Male | Female |
| Under 5 Years | 185 (100.0%) | 297 (81.1%) |
| 5 Years | 66 (100.0%) | 145 (100.0%) |
| 6 to 11 Years | 265 (78.6%) | 456 (88.4%) |
| 12 to 14 Years | 318 (81.5%) | 139 (100.0%) |
| 15 Years | 44 (100.0%) | 68 (100.0%) |
| 16 and 17 Years | 134 (100.0%) | 134 (89.3%) |
| 18 to 24 Years | 287 (78.4%) | 163 (90.6%) |
| 25 to 34 Years | 418 (100.0%) | 489 (100.0%) |
| 35 to 44 Years | 732 (100.0%) | 580 (89.6%) |
| 45 to 54 Years | 567 (100.0%) | 694 (97.9%) |
| 55 to 64 Years | 420 (82.8%) | 469 (88.3%) |
| 65 to 74 Years | 38 (100.0%) | 312 (100.0%) |
| 75 Years and over | 83 (100.0%) | 9 (100.0%) |
| Total | 3,557 (92.0%) | 3,955 (92.8%) |
Income Below Poverty Among Married-Couple Families in Duvall
The poverty statistics for married-couple families in Duvall show that 3.5% or 66 of the total 1,864 families live below the poverty line. Families with 3 or 4 children have the highest poverty rate of 33.2%, comprising of 66 families. On the other hand, families with no children have the lowest poverty rate of 0.0%, which includes 0 families.
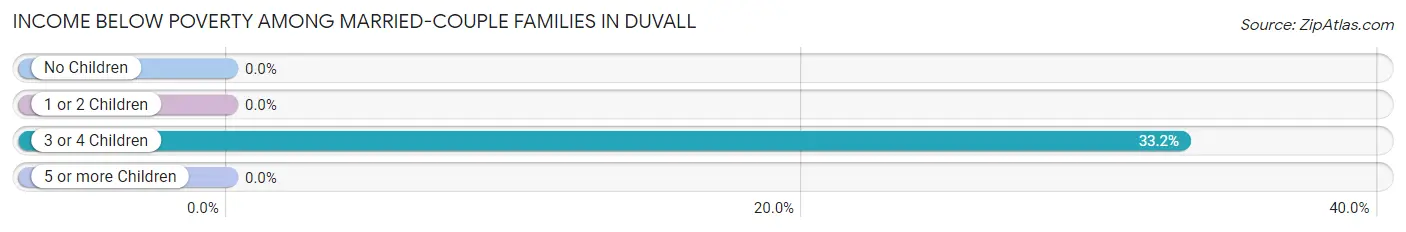
| Children | Above Poverty | Below Poverty |
| No Children | 647 (100.0%) | 0 (0.0%) |
| 1 or 2 Children | 992 (100.0%) | 0 (0.0%) |
| 3 or 4 Children | 133 (66.8%) | 66 (33.2%) |
| 5 or more Children | 26 (100.0%) | 0 (0.0%) |
| Total | 1,798 (96.5%) | 66 (3.5%) |
Income Below Poverty Among Single-Parent Households in Duvall
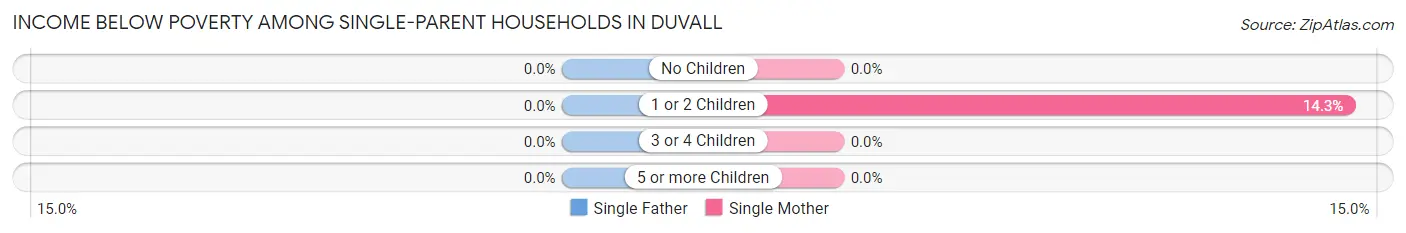
| Children | Single Father | Single Mother |
| No Children | 0 (0.0%) | 0 (0.0%) |
| 1 or 2 Children | 0 (0.0%) | 15 (14.3%) |
| 3 or 4 Children | 0 (0.0%) | 0 (0.0%) |
| 5 or more Children | 0 (0.0%) | 0 (0.0%) |
| Total | 0 (0.0%) | 15 (6.0%) |
Income Below Poverty Among Married-Couple vs Single-Parent Households in Duvall
The poverty data for Duvall shows that 66 of the married-couple family households (3.5%) and 15 of the single-parent households (4.9%) are living below the poverty level. Within the married-couple family households, those with 3 or 4 children have the highest poverty rate, with 66 households (33.2%) falling below the poverty line. Among the single-parent households, those with 1 or 2 children have the highest poverty rate, with 15 household (12.5%) living below poverty.
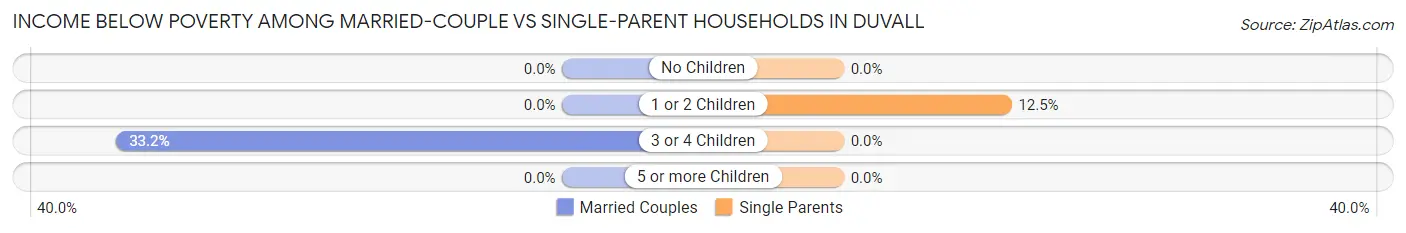
| Children | Married-Couple Families | Single-Parent Households |
| No Children | 0 (0.0%) | 0 (0.0%) |
| 1 or 2 Children | 0 (0.0%) | 15 (12.5%) |
| 3 or 4 Children | 66 (33.2%) | 0 (0.0%) |
| 5 or more Children | 0 (0.0%) | 0 (0.0%) |
| Total | 66 (3.5%) | 15 (4.9%) |
Race in Duvall
The most populous races in Duvall are White / Caucasian (6,029 | 74.2%), Hispanic or Latino (965 | 11.9%), and Asian (938 | 11.5%).
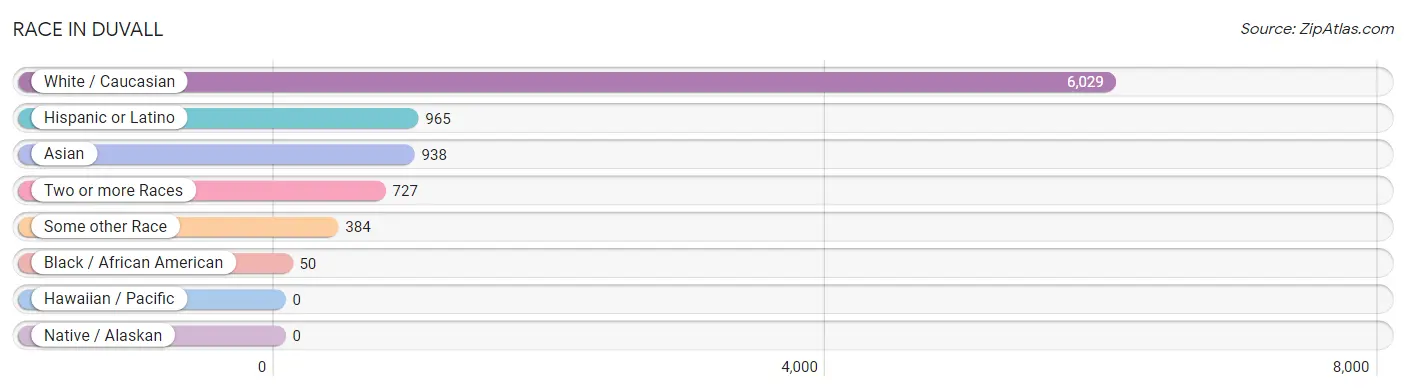
| Race | # Population | % Population |
| Asian | 938 | 11.5% |
| Black / African American | 50 | 0.6% |
| Hawaiian / Pacific | 0 | 0.0% |
| Hispanic or Latino | 965 | 11.9% |
| Native / Alaskan | 0 | 0.0% |
| White / Caucasian | 6,029 | 74.2% |
| Two or more Races | 727 | 8.9% |
| Some other Race | 384 | 4.7% |
| Total | 8,128 | 100.0% |
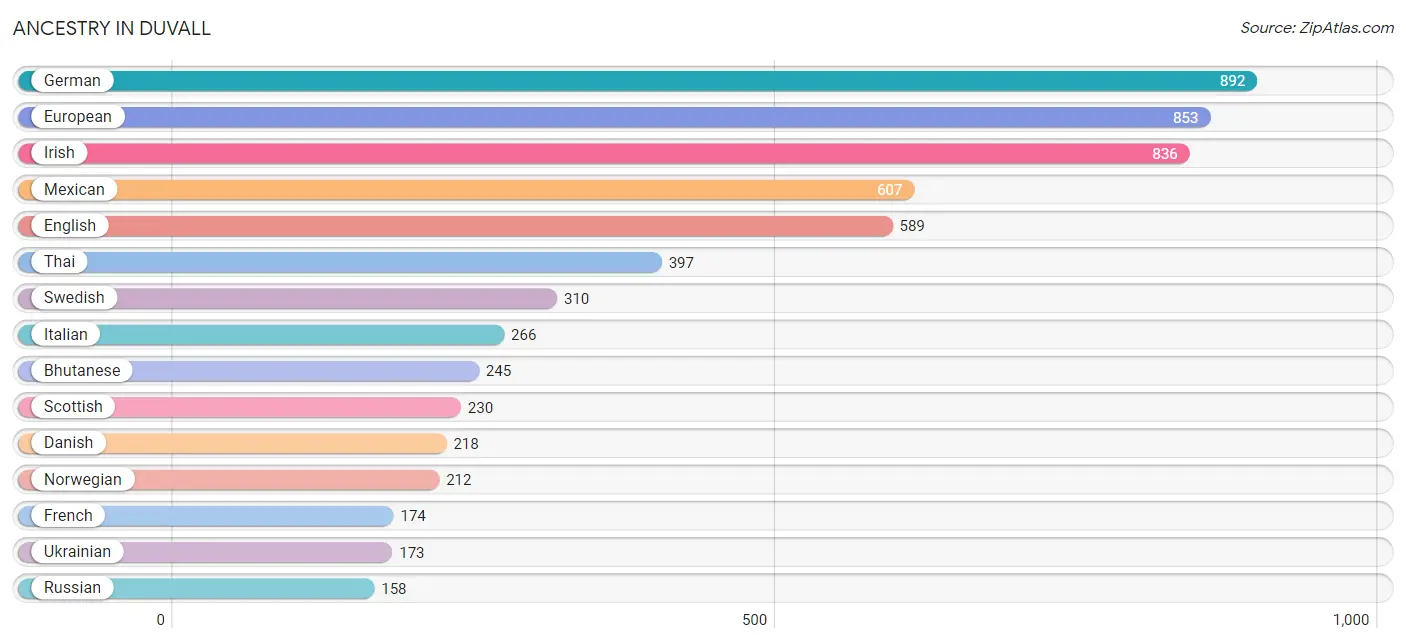
Ancestry in Duvall
The most populous ancestries reported in Duvall are German (892 | 11.0%), European (853 | 10.5%), Irish (836 | 10.3%), Mexican (607 | 7.5%), and English (589 | 7.2%), together accounting for 46.5% of all Duvall residents.
| Ancestry | # Population | % Population |
| African | 16 | 0.2% |
| American | 61 | 0.7% |
| Arab | 18 | 0.2% |
| Austrian | 9 | 0.1% |
| Basque | 15 | 0.2% |
| Belgian | 25 | 0.3% |
| Bhutanese | 245 | 3.0% |
| British | 43 | 0.5% |
| Burmese | 79 | 1.0% |
| Colombian | 16 | 0.2% |
| Croatian | 11 | 0.1% |
| Cuban | 21 | 0.3% |
| Czech | 23 | 0.3% |
| Czechoslovakian | 14 | 0.2% |
| Danish | 218 | 2.7% |
| Dutch | 154 | 1.9% |
| English | 589 | 7.2% |
| European | 853 | 10.5% |
| Filipino | 16 | 0.2% |
| Finnish | 98 | 1.2% |
| French | 174 | 2.1% |
| French Canadian | 15 | 0.2% |
| German | 892 | 11.0% |
| Indian (Asian) | 65 | 0.8% |
| Iranian | 9 | 0.1% |
| Irish | 836 | 10.3% |
| Italian | 266 | 3.3% |
| Korean | 85 | 1.1% |
| Lebanese | 18 | 0.2% |
| Mexican | 607 | 7.5% |
| Mexican American Indian | 17 | 0.2% |
| Northern European | 59 | 0.7% |
| Norwegian | 212 | 2.6% |
| Pakistani | 55 | 0.7% |
| Polish | 125 | 1.5% |
| Portuguese | 58 | 0.7% |
| Puerto Rican | 97 | 1.2% |
| Romanian | 14 | 0.2% |
| Russian | 158 | 1.9% |
| Scandinavian | 155 | 1.9% |
| Scotch-Irish | 39 | 0.5% |
| Scottish | 230 | 2.8% |
| South American | 16 | 0.2% |
| Spaniard | 44 | 0.5% |
| Spanish | 36 | 0.4% |
| Subsaharan African | 16 | 0.2% |
| Swedish | 310 | 3.8% |
| Swiss | 48 | 0.6% |
| Thai | 397 | 4.9% |
| Turkish | 43 | 0.5% |
| Ukrainian | 173 | 2.1% |
| Welsh | 40 | 0.5% | View All 52 Rows |
Immigrants in Duvall
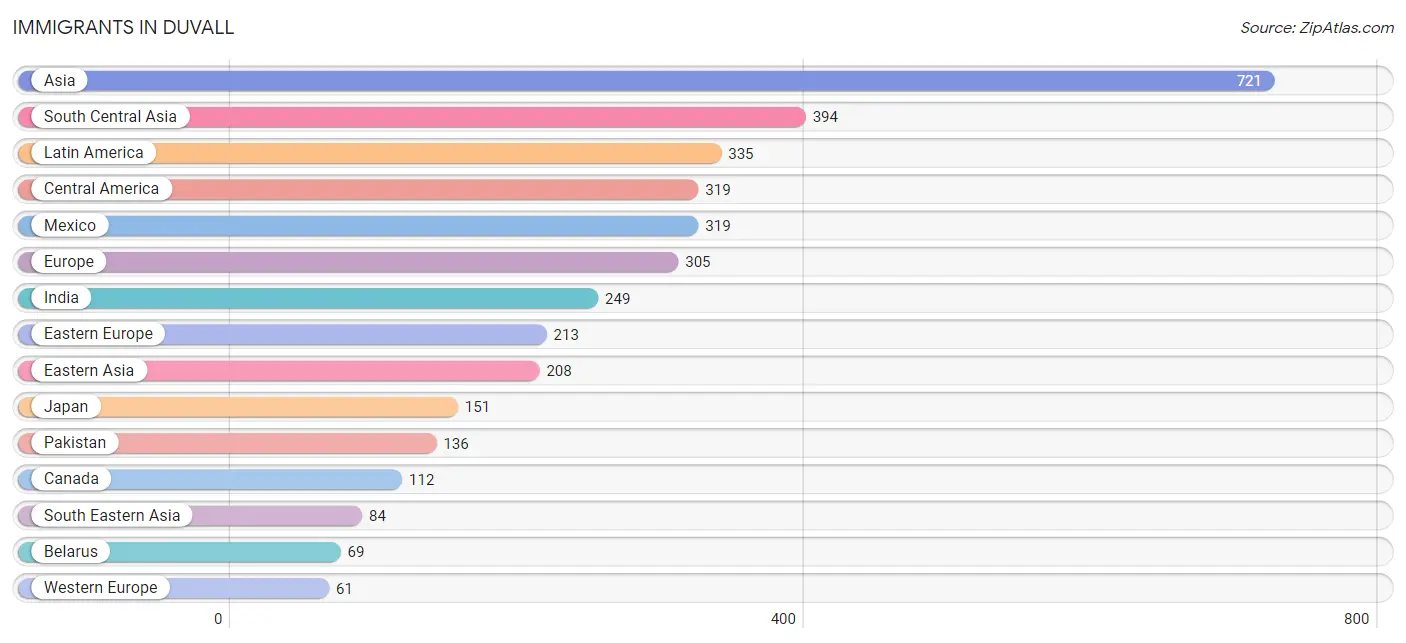
The most numerous immigrant groups reported in Duvall came from Asia (721 | 8.9%), South Central Asia (394 | 4.9%), Latin America (335 | 4.1%), Central America (319 | 3.9%), and Mexico (319 | 3.9%), together accounting for 25.7% of all Duvall residents.
| Immigration Origin | # Population | % Population |
| Asia | 721 | 8.9% |
| Belarus | 69 | 0.9% |
| Belgium | 25 | 0.3% |
| Canada | 112 | 1.4% |
| Central America | 319 | 3.9% |
| China | 33 | 0.4% |
| Colombia | 16 | 0.2% |
| Eastern Asia | 208 | 2.6% |
| Eastern Europe | 213 | 2.6% |
| Europe | 305 | 3.7% |
| France | 18 | 0.2% |
| Germany | 18 | 0.2% |
| Hong Kong | 17 | 0.2% |
| India | 249 | 3.1% |
| Iran | 9 | 0.1% |
| Japan | 151 | 1.9% |
| Korea | 24 | 0.3% |
| Latin America | 335 | 4.1% |
| Lebanon | 18 | 0.2% |
| Malaysia | 29 | 0.4% |
| Mexico | 319 | 3.9% |
| Northern Europe | 31 | 0.4% |
| Pakistan | 136 | 1.7% |
| Poland | 41 | 0.5% |
| Russia | 52 | 0.6% |
| South America | 16 | 0.2% |
| South Central Asia | 394 | 4.9% |
| South Eastern Asia | 84 | 1.0% |
| Taiwan | 16 | 0.2% |
| Thailand | 55 | 0.7% |
| Ukraine | 51 | 0.6% |
| Western Asia | 35 | 0.4% |
| Western Europe | 61 | 0.7% | View All 33 Rows |
Sex and Age in Duvall
Sex and Age in Duvall
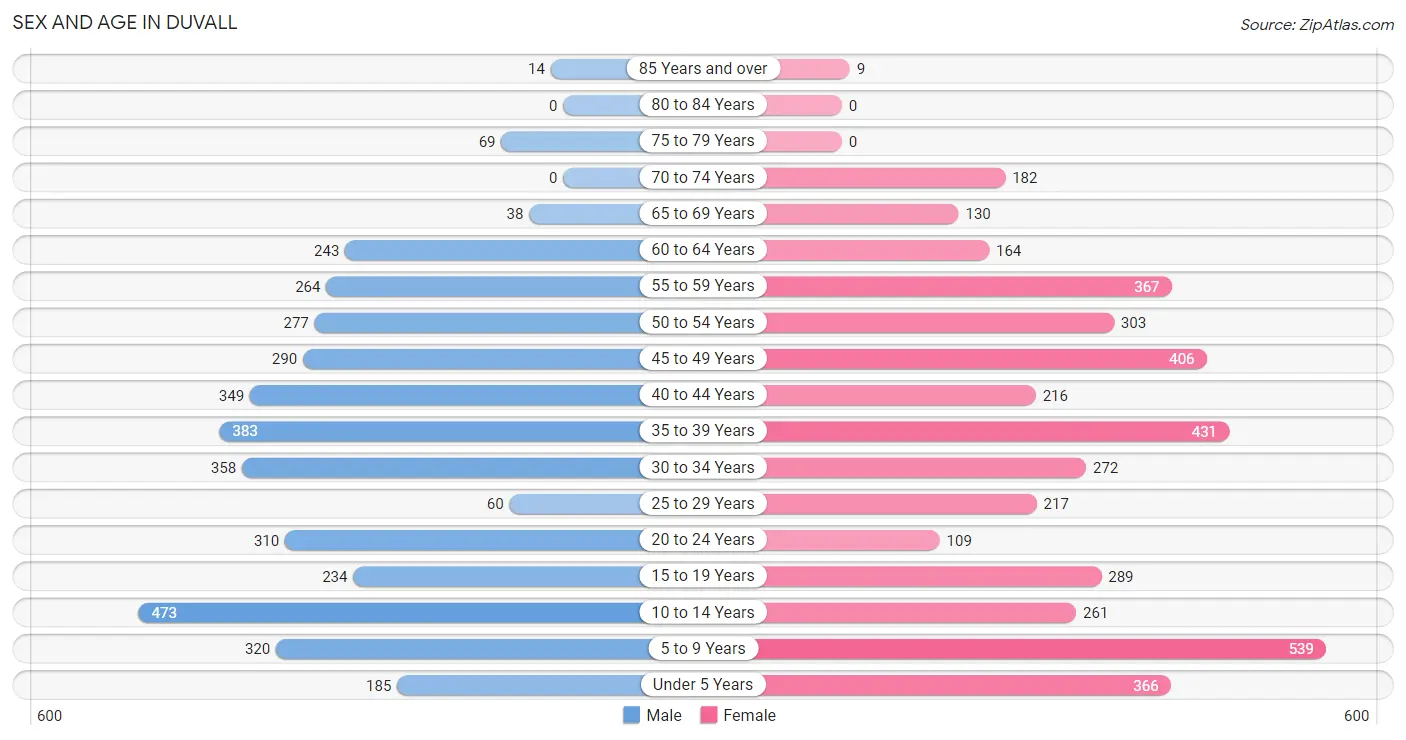
The most populous age groups in Duvall are 10 to 14 Years (473 | 12.2%) for men and 5 to 9 Years (539 | 12.7%) for women.
| Age Bracket | Male | Female |
| Under 5 Years | 185 (4.8%) | 366 (8.6%) |
| 5 to 9 Years | 320 (8.3%) | 539 (12.7%) |
| 10 to 14 Years | 473 (12.2%) | 261 (6.1%) |
| 15 to 19 Years | 234 (6.0%) | 289 (6.8%) |
| 20 to 24 Years | 310 (8.0%) | 109 (2.6%) |
| 25 to 29 Years | 60 (1.5%) | 217 (5.1%) |
| 30 to 34 Years | 358 (9.3%) | 272 (6.4%) |
| 35 to 39 Years | 383 (9.9%) | 431 (10.1%) |
| 40 to 44 Years | 349 (9.0%) | 216 (5.1%) |
| 45 to 49 Years | 290 (7.5%) | 406 (9.5%) |
| 50 to 54 Years | 277 (7.2%) | 303 (7.1%) |
| 55 to 59 Years | 264 (6.8%) | 367 (8.6%) |
| 60 to 64 Years | 243 (6.3%) | 164 (3.8%) |
| 65 to 69 Years | 38 (1.0%) | 130 (3.0%) |
| 70 to 74 Years | 0 (0.0%) | 182 (4.3%) |
| 75 to 79 Years | 69 (1.8%) | 0 (0.0%) |
| 80 to 84 Years | 0 (0.0%) | 0 (0.0%) |
| 85 Years and over | 14 (0.4%) | 9 (0.2%) |
| Total | 3,867 (100.0%) | 4,261 (100.0%) |
Families and Households in Duvall
Median Family Size in Duvall
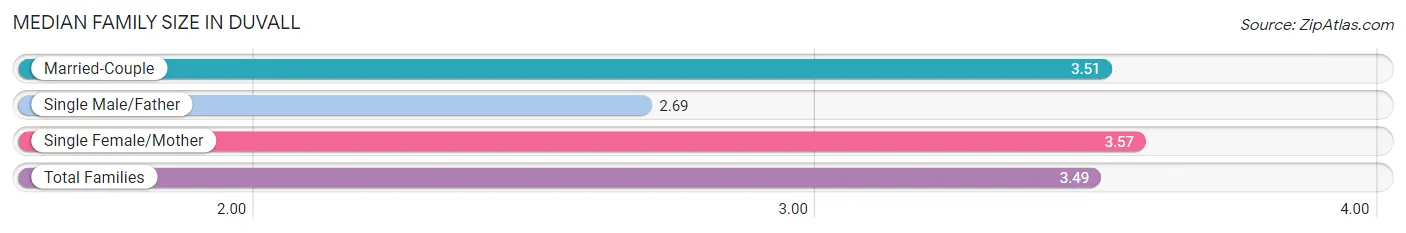
The median family size in Duvall is 3.49 persons per family, with single female/mother families (250 | 11.5%) accounting for the largest median family size of 3.57 persons per family. On the other hand, single male/father families (59 | 2.7%) represent the smallest median family size with 2.69 persons per family.
| Family Type | # Families | Family Size |
| Married-Couple | 1,864 (85.8%) | 3.51 |
| Single Male/Father | 59 (2.7%) | 2.69 |
| Single Female/Mother | 250 (11.5%) | 3.57 |
| Total Families | 2,173 (100.0%) | 3.49 |
Median Household Size in Duvall
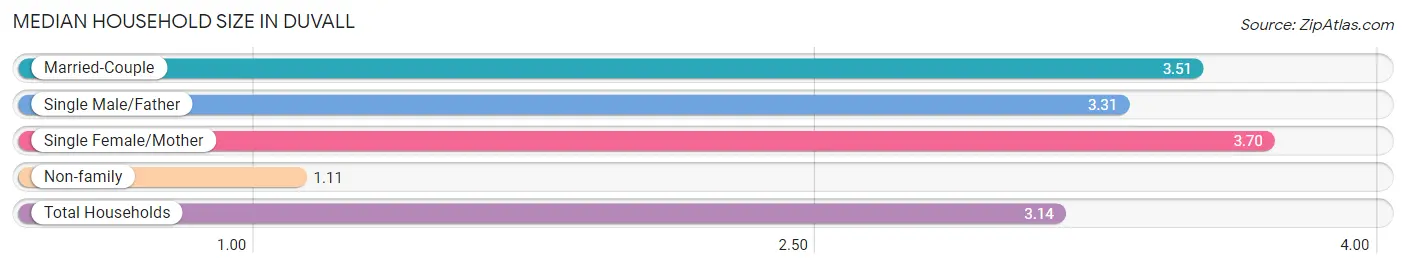
The median household size in Duvall is 3.14 persons per household, with single female/mother households (250 | 9.7%) accounting for the largest median household size of 3.7 persons per household. non-family households (411 | 15.9%) represent the smallest median household size with 1.11 persons per household.
| Household Type | # Households | Household Size |
| Married-Couple | 1,864 (72.1%) | 3.51 |
| Single Male/Father | 59 (2.3%) | 3.31 |
| Single Female/Mother | 250 (9.7%) | 3.70 |
| Non-family | 411 (15.9%) | 1.11 |
| Total Households | 2,584 (100.0%) | 3.14 |
Household Size by Marriage Status in Duvall
Out of a total of 2,584 households in Duvall, 2,173 (84.1%) are family households, while 411 (15.9%) are nonfamily households. The most numerous type of family households are 4-person households, comprising 794, and the most common type of nonfamily households are 1-person households, comprising 365.
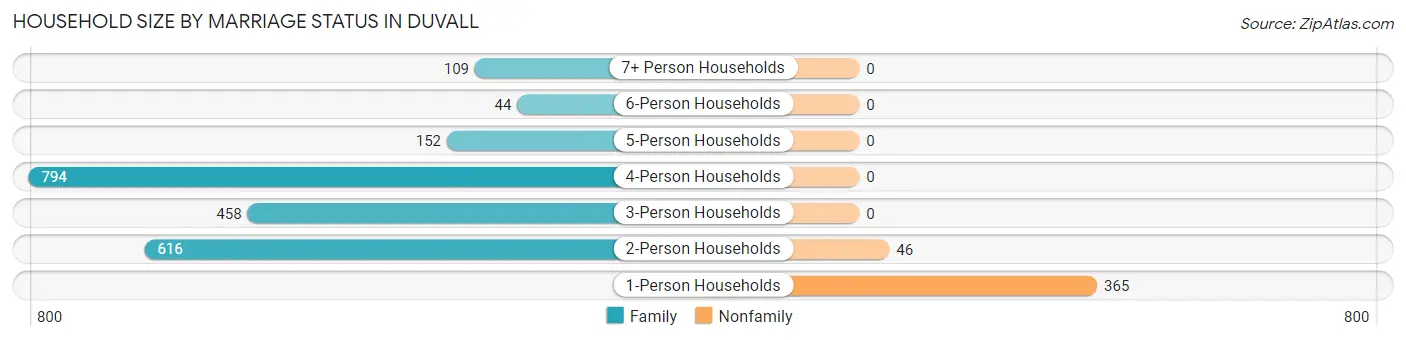
| Household Size | Family Households | Nonfamily Households |
| 1-Person Households | - | 365 (14.1%) |
| 2-Person Households | 616 (23.8%) | 46 (1.8%) |
| 3-Person Households | 458 (17.7%) | 0 (0.0%) |
| 4-Person Households | 794 (30.7%) | 0 (0.0%) |
| 5-Person Households | 152 (5.9%) | 0 (0.0%) |
| 6-Person Households | 44 (1.7%) | 0 (0.0%) |
| 7+ Person Households | 109 (4.2%) | 0 (0.0%) |
| Total | 2,173 (84.1%) | 411 (15.9%) |
Female Fertility in Duvall
Fertility by Age in Duvall
Average fertility rate in Duvall is 18.0 births per 1,000 women. Women in the age bracket of 20 to 34 years have the highest fertility rate with 23.0 births per 1,000 women. Women in the age bracket of 35 to 50 years acount for 60.0% of all women with births.
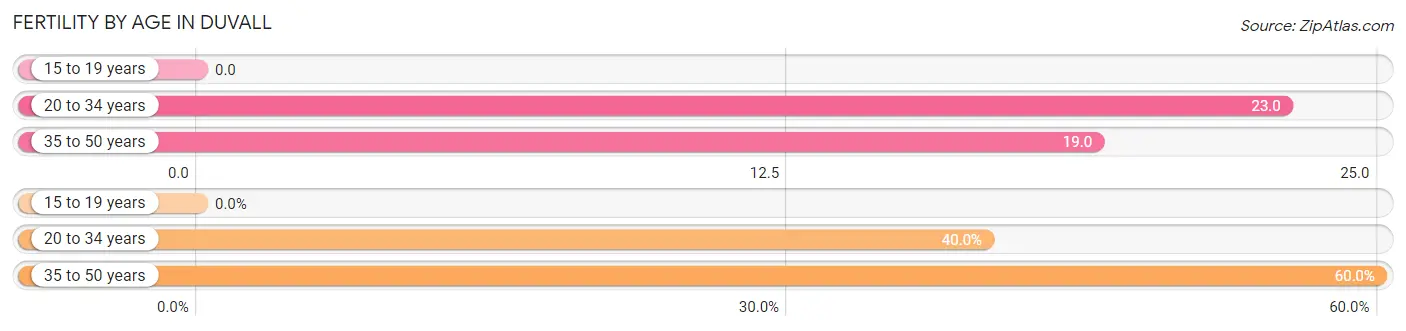
| Age Bracket | Women with Births | Births / 1,000 Women |
| 15 to 19 years | 0 (0.0%) | 0.0 |
| 20 to 34 years | 14 (40.0%) | 23.0 |
| 35 to 50 years | 21 (60.0%) | 19.0 |
| Total | 35 (100.0%) | 18.0 |
Fertility by Age by Marriage Status in Duvall
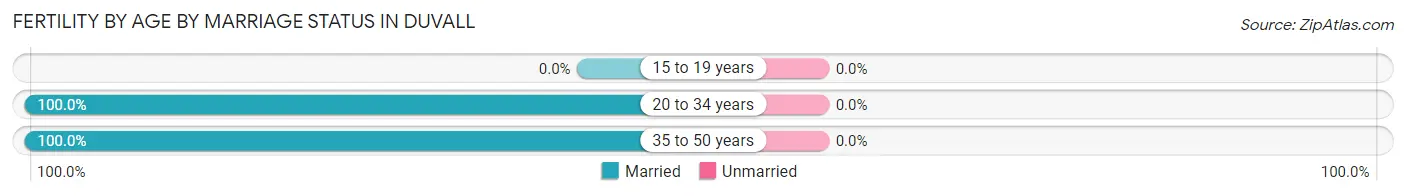
| Age Bracket | Married | Unmarried |
| 15 to 19 years | 0 (0.0%) | 0 (0.0%) |
| 20 to 34 years | 14 (100.0%) | 0 (0.0%) |
| 35 to 50 years | 21 (100.0%) | 0 (0.0%) |
| Total | 35 (100.0%) | 0 (0.0%) |
Fertility by Education in Duvall
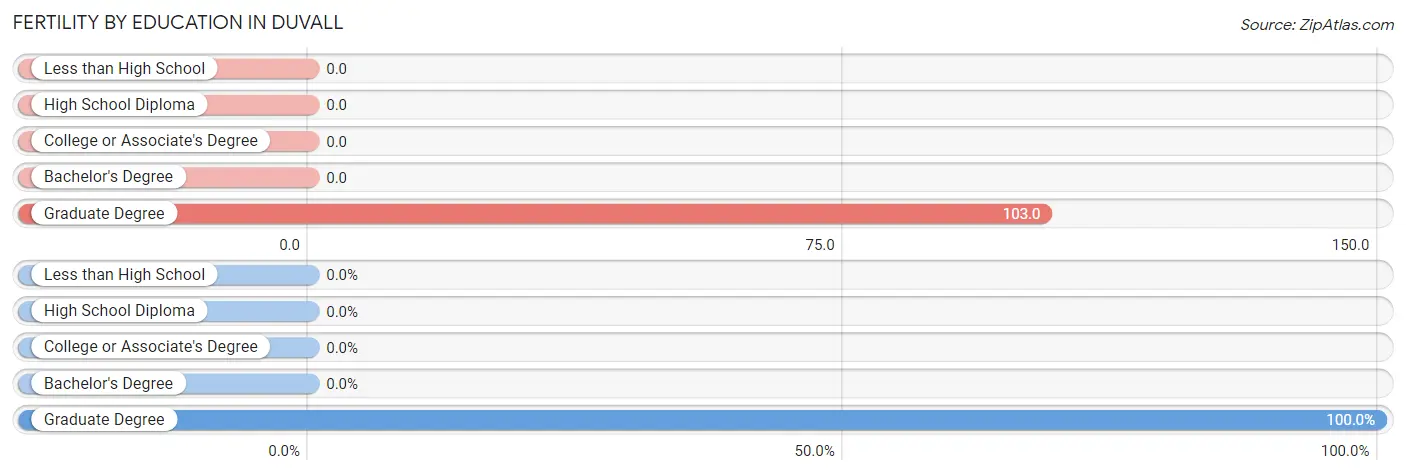
| Educational Attainment | Women with Births | Births / 1,000 Women |
| Less than High School | 0 (0.0%) | 0.0 |
| High School Diploma | 0 (0.0%) | 0.0 |
| College or Associate's Degree | 0 (0.0%) | 0.0 |
| Bachelor's Degree | 0 (0.0%) | 0.0 |
| Graduate Degree | 35 (100.0%) | 103.0 |
| Total | 35 (100.0%) | 18.0 |
Fertility by Education by Marriage Status in Duvall
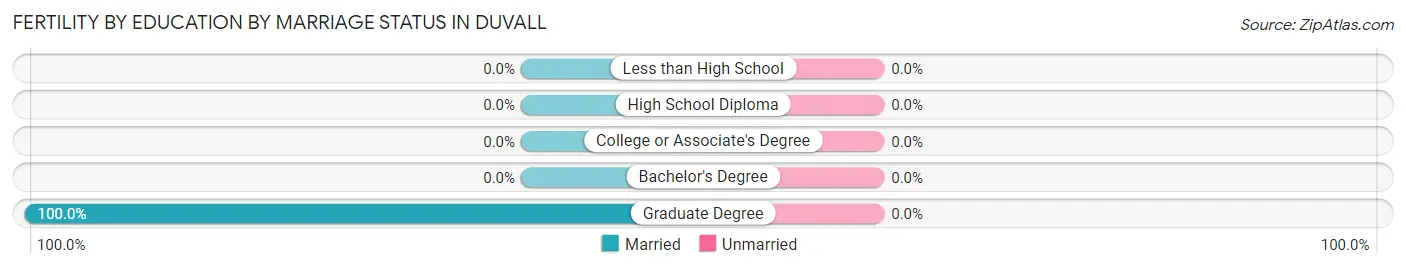
| Educational Attainment | Married | Unmarried |
| Less than High School | 0 (0.0%) | 0 (0.0%) |
| High School Diploma | 0 (0.0%) | 0 (0.0%) |
| College or Associate's Degree | 0 (0.0%) | 0 (0.0%) |
| Bachelor's Degree | 0 (0.0%) | 0 (0.0%) |
| Graduate Degree | 35 (100.0%) | 0 (0.0%) |
| Total | 35 (100.0%) | 0 (0.0%) |
Employment Characteristics in Duvall
Employment by Class of Employer in Duvall
Among the 3,995 employed individuals in Duvall, private company employees (2,891 | 72.4%), not-for-profit organizations (351 | 8.8%), and local government employees (340 | 8.5%) make up the most common classes of employment.
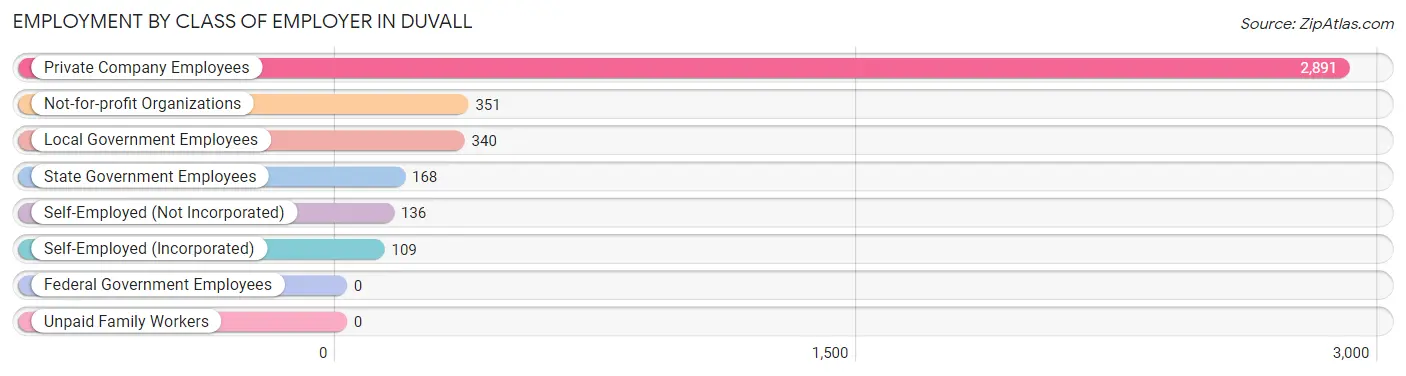
| Employer Class | # Employees | % Employees |
| Private Company Employees | 2,891 | 72.4% |
| Self-Employed (Incorporated) | 109 | 2.7% |
| Self-Employed (Not Incorporated) | 136 | 3.4% |
| Not-for-profit Organizations | 351 | 8.8% |
| Local Government Employees | 340 | 8.5% |
| State Government Employees | 168 | 4.2% |
| Federal Government Employees | 0 | 0.0% |
| Unpaid Family Workers | 0 | 0.0% |
| Total | 3,995 | 100.0% |
Employment Status by Age in Duvall
According to the labor force statistics for Duvall, out of the total population over 16 years of age (5,872), 72.2% or 4,240 individuals are in the labor force, with 4.3% or 182 of them unemployed. The age group with the highest labor force participation rate is 55 to 59 years, with 87.8% or 554 individuals in the labor force. Within the labor force, the 60 to 64 years age range has the highest percentage of unemployed individuals, with 23.9% or 48 of them being unemployed.
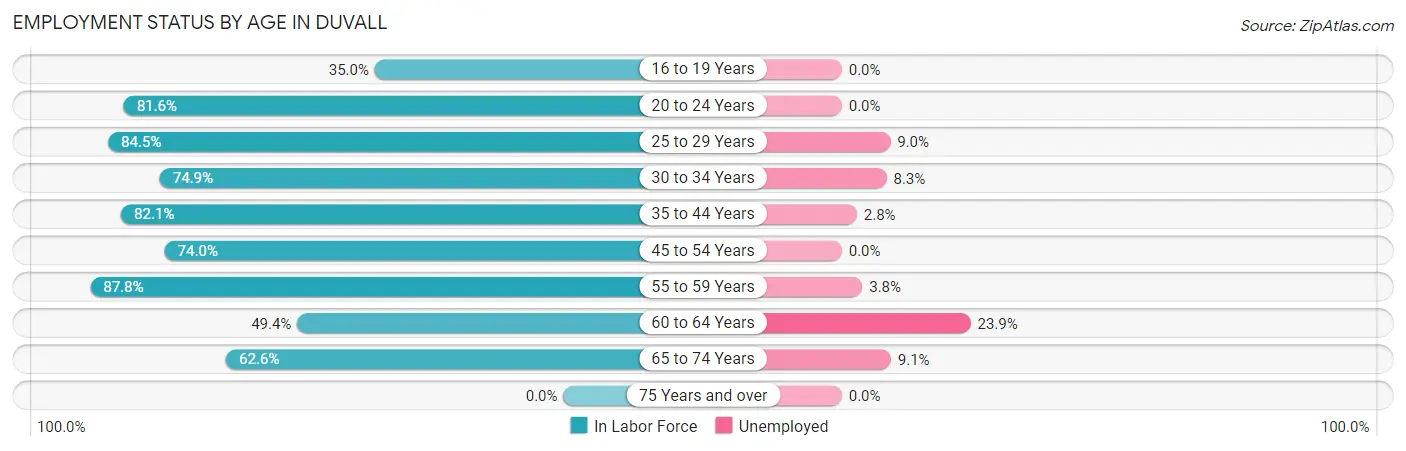
| Age Bracket | In Labor Force | Unemployed |
| 16 to 19 Years | 144 (35.0%) | 0 (0.0%) |
| 20 to 24 Years | 342 (81.6%) | 0 (0.0%) |
| 25 to 29 Years | 234 (84.5%) | 21 (9.0%) |
| 30 to 34 Years | 472 (74.9%) | 39 (8.3%) |
| 35 to 44 Years | 1,132 (82.1%) | 32 (2.8%) |
| 45 to 54 Years | 944 (74.0%) | 0 (0.0%) |
| 55 to 59 Years | 554 (87.8%) | 21 (3.8%) |
| 60 to 64 Years | 201 (49.4%) | 48 (23.9%) |
| 65 to 74 Years | 219 (62.6%) | 20 (9.1%) |
| 75 Years and over | 0 (0.0%) | 0 (0.0%) |
| Total | 4,240 (72.2%) | 182 (4.3%) |
Employment Status by Educational Attainment in Duvall
According to labor force statistics for Duvall, 76.9% of individuals (3,537) out of the total population between 25 and 64 years of age (4,600) are in the labor force, with 4.6% or 163 of them being unemployed. The group with the highest labor force participation rate are those with the educational attainment of bachelor's degree or higher, with 85.6% or 2,223 individuals in the labor force. Within the labor force, individuals with college / associate degree education have the highest percentage of unemployment, with 14.6% or 135 of them being unemployed.
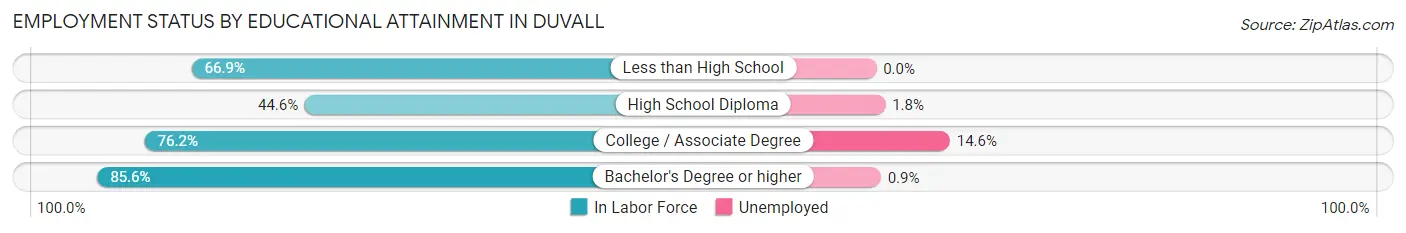
| Educational Attainment | In Labor Force | Unemployed |
| Less than High School | 117 (66.9%) | 0 (0.0%) |
| High School Diploma | 275 (44.6%) | 11 (1.8%) |
| College / Associate Degree | 924 (76.2%) | 177 (14.6%) |
| Bachelor's Degree or higher | 2,223 (85.6%) | 23 (0.9%) |
| Total | 3,537 (76.9%) | 212 (4.6%) |
Employment Occupations by Sex in Duvall
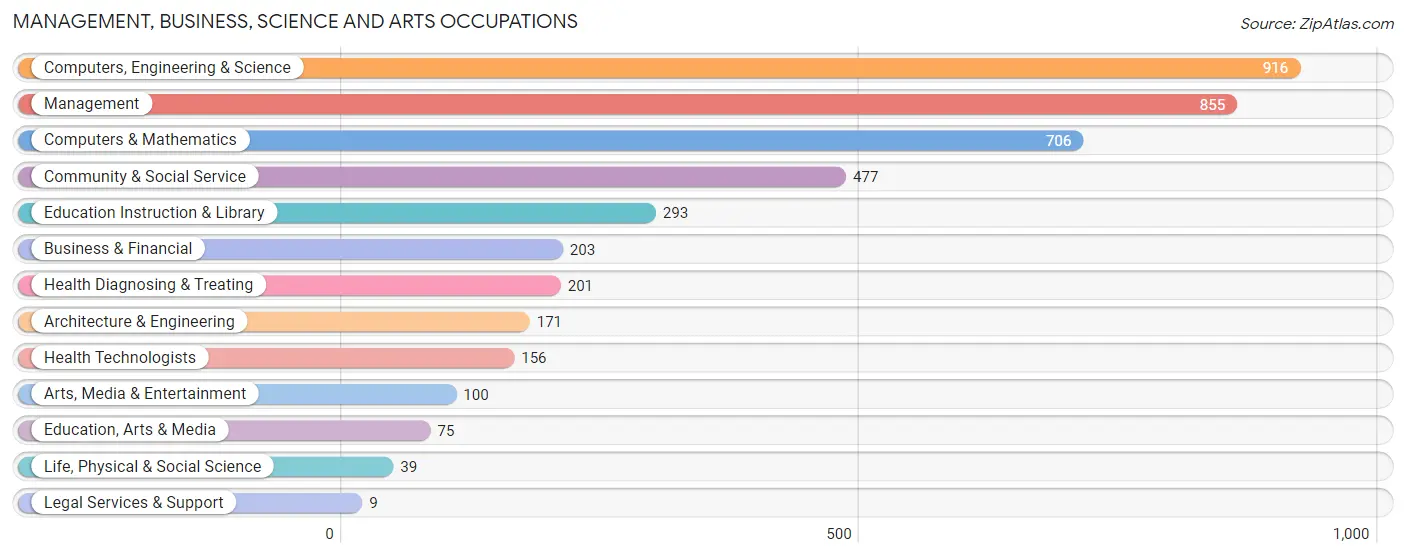
Management, Business, Science and Arts Occupations
The most common Management, Business, Science and Arts occupations in Duvall are Computers, Engineering & Science (916 | 22.6%), Management (855 | 21.0%), Computers & Mathematics (706 | 17.4%), Community & Social Service (477 | 11.7%), and Education Instruction & Library (293 | 7.2%).
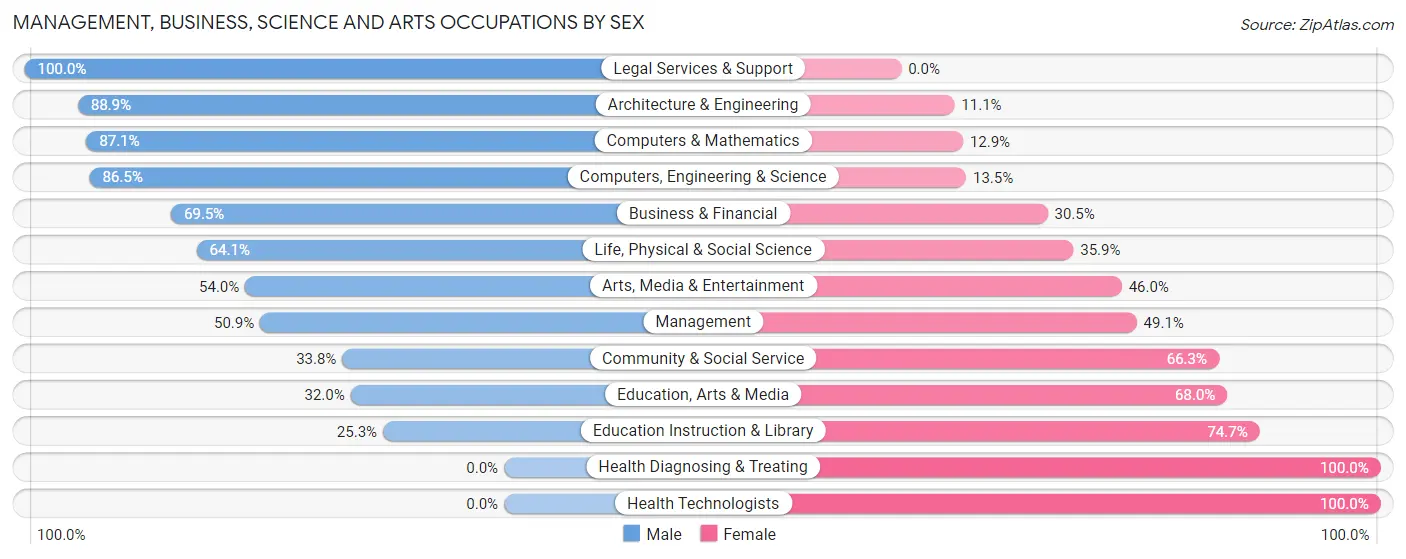
Management, Business, Science and Arts Occupations by Sex
Within the Management, Business, Science and Arts occupations in Duvall, the most male-oriented occupations are Legal Services & Support (100.0%), Architecture & Engineering (88.9%), and Computers & Mathematics (87.1%), while the most female-oriented occupations are Health Diagnosing & Treating (100.0%), Health Technologists (100.0%), and Education Instruction & Library (74.7%).
| Occupation | Male | Female |
| Management | 435 (50.9%) | 420 (49.1%) |
| Business & Financial | 141 (69.5%) | 62 (30.5%) |
| Computers, Engineering & Science | 792 (86.5%) | 124 (13.5%) |
| Computers & Mathematics | 615 (87.1%) | 91 (12.9%) |
| Architecture & Engineering | 152 (88.9%) | 19 (11.1%) |
| Life, Physical & Social Science | 25 (64.1%) | 14 (35.9%) |
| Community & Social Service | 161 (33.8%) | 316 (66.2%) |
| Education, Arts & Media | 24 (32.0%) | 51 (68.0%) |
| Legal Services & Support | 9 (100.0%) | 0 (0.0%) |
| Education Instruction & Library | 74 (25.3%) | 219 (74.7%) |
| Arts, Media & Entertainment | 54 (54.0%) | 46 (46.0%) |
| Health Diagnosing & Treating | 0 (0.0%) | 201 (100.0%) |
| Health Technologists | 0 (0.0%) | 156 (100.0%) |
| Total (Category) | 1,529 (57.7%) | 1,123 (42.3%) |
| Total (Overall) | 2,267 (55.8%) | 1,794 (44.2%) |
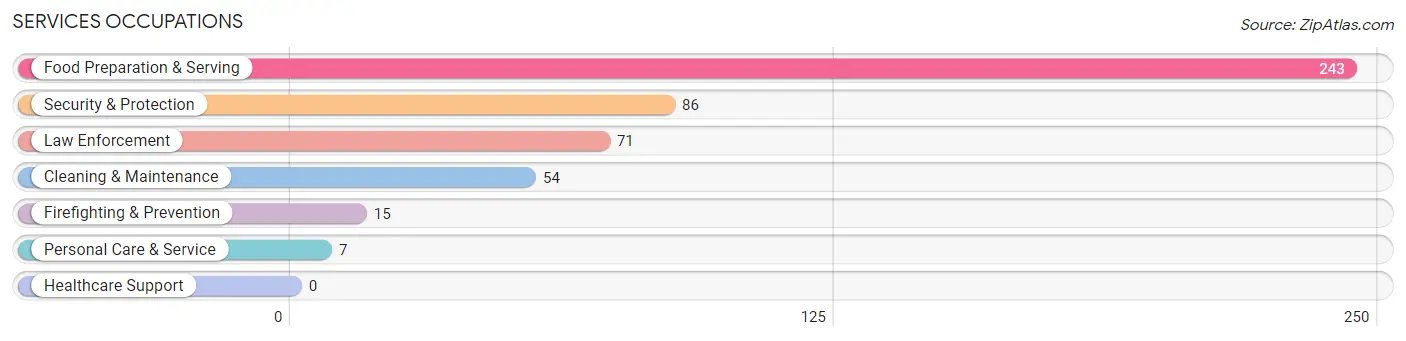
Services Occupations
The most common Services occupations in Duvall are Food Preparation & Serving (243 | 6.0%), Security & Protection (86 | 2.1%), Law Enforcement (71 | 1.8%), Cleaning & Maintenance (54 | 1.3%), and Firefighting & Prevention (15 | 0.4%).
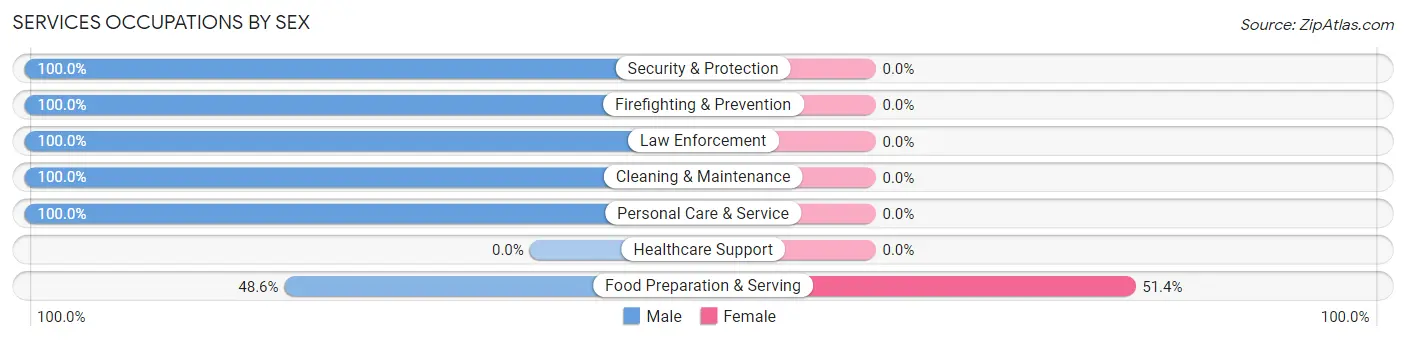
Services Occupations by Sex
| Occupation | Male | Female |
| Healthcare Support | 0 (0.0%) | 0 (0.0%) |
| Security & Protection | 86 (100.0%) | 0 (0.0%) |
| Firefighting & Prevention | 15 (100.0%) | 0 (0.0%) |
| Law Enforcement | 71 (100.0%) | 0 (0.0%) |
| Food Preparation & Serving | 118 (48.6%) | 125 (51.4%) |
| Cleaning & Maintenance | 54 (100.0%) | 0 (0.0%) |
| Personal Care & Service | 7 (100.0%) | 0 (0.0%) |
| Total (Category) | 265 (67.9%) | 125 (32.1%) |
| Total (Overall) | 2,267 (55.8%) | 1,794 (44.2%) |
Sales and Office Occupations
The most common Sales and Office occupations in Duvall are Office & Administration (350 | 8.6%), and Sales & Related (308 | 7.6%).
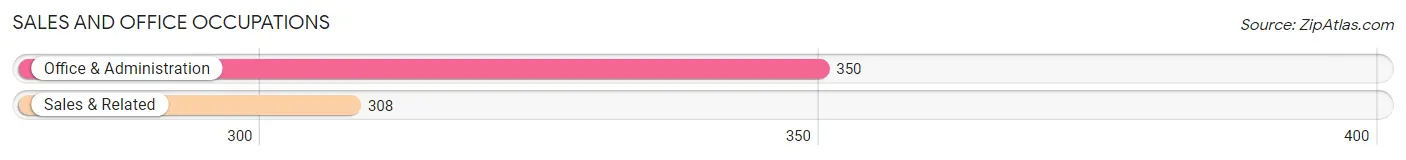
Sales and Office Occupations by Sex
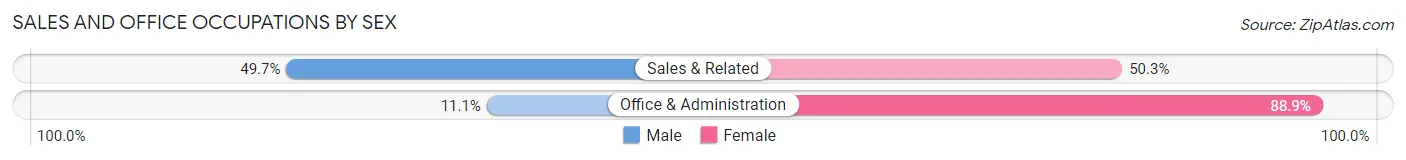
| Occupation | Male | Female |
| Sales & Related | 153 (49.7%) | 155 (50.3%) |
| Office & Administration | 39 (11.1%) | 311 (88.9%) |
| Total (Category) | 192 (29.2%) | 466 (70.8%) |
| Total (Overall) | 2,267 (55.8%) | 1,794 (44.2%) |
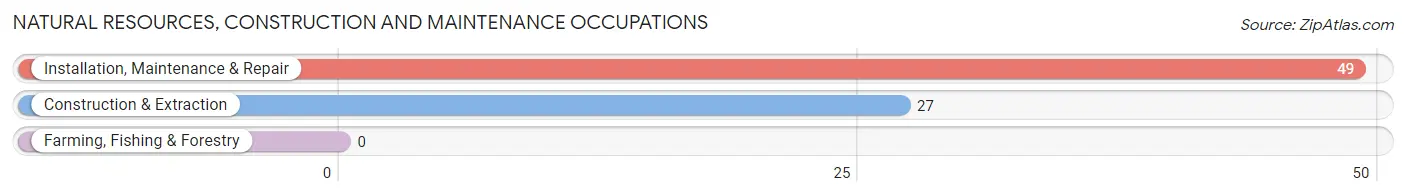
Natural Resources, Construction and Maintenance Occupations
The most common Natural Resources, Construction and Maintenance occupations in Duvall are Installation, Maintenance & Repair (49 | 1.2%), and Construction & Extraction (27 | 0.7%).
Natural Resources, Construction and Maintenance Occupations by Sex
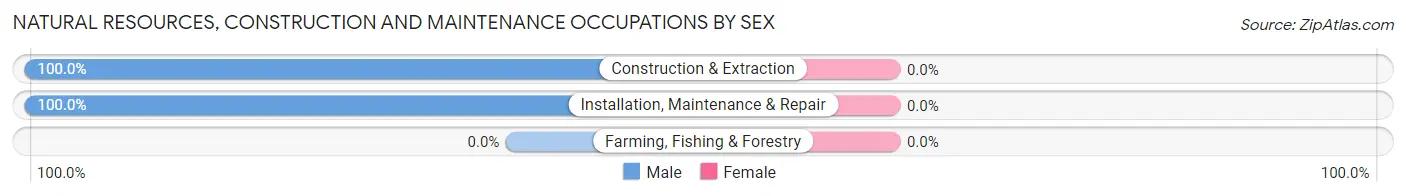
| Occupation | Male | Female |
| Farming, Fishing & Forestry | 0 (0.0%) | 0 (0.0%) |
| Construction & Extraction | 27 (100.0%) | 0 (0.0%) |
| Installation, Maintenance & Repair | 49 (100.0%) | 0 (0.0%) |
| Total (Category) | 76 (100.0%) | 0 (0.0%) |
| Total (Overall) | 2,267 (55.8%) | 1,794 (44.2%) |
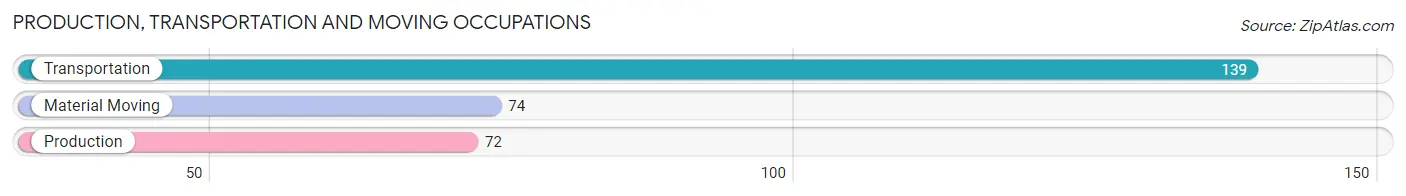
Production, Transportation and Moving Occupations
The most common Production, Transportation and Moving occupations in Duvall are Transportation (139 | 3.4%), Material Moving (74 | 1.8%), and Production (72 | 1.8%).
Production, Transportation and Moving Occupations by Sex
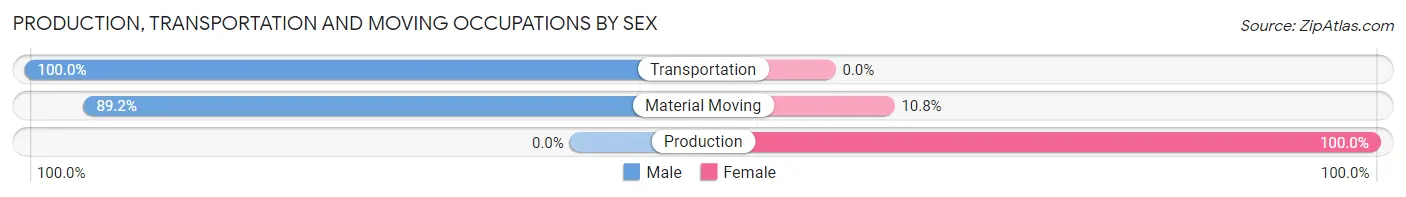
| Occupation | Male | Female |
| Production | 0 (0.0%) | 72 (100.0%) |
| Transportation | 139 (100.0%) | 0 (0.0%) |
| Material Moving | 66 (89.2%) | 8 (10.8%) |
| Total (Category) | 205 (71.9%) | 80 (28.1%) |
| Total (Overall) | 2,267 (55.8%) | 1,794 (44.2%) |
Employment Industries by Sex in Duvall
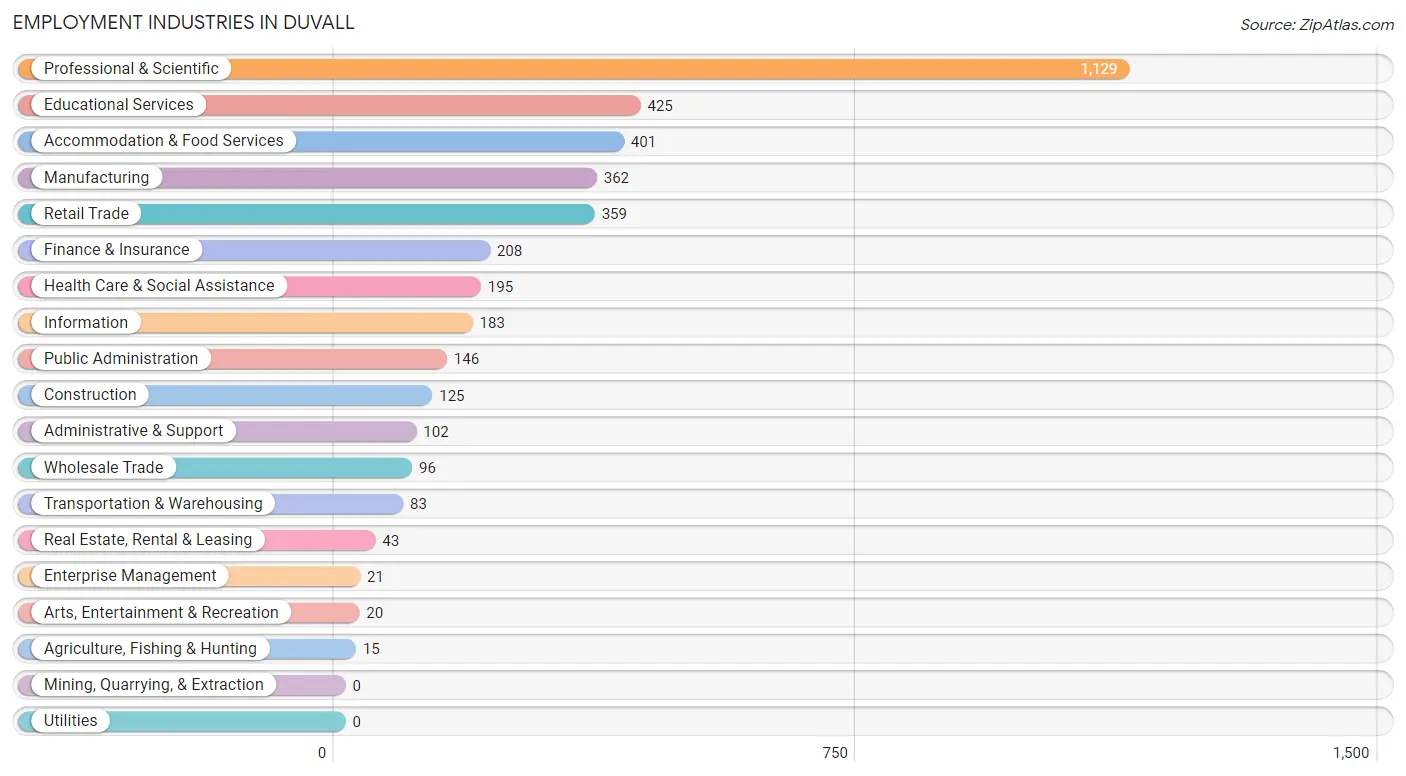
Employment Industries in Duvall
The major employment industries in Duvall include Professional & Scientific (1,129 | 27.8%), Educational Services (425 | 10.5%), Accommodation & Food Services (401 | 9.9%), Manufacturing (362 | 8.9%), and Retail Trade (359 | 8.8%).
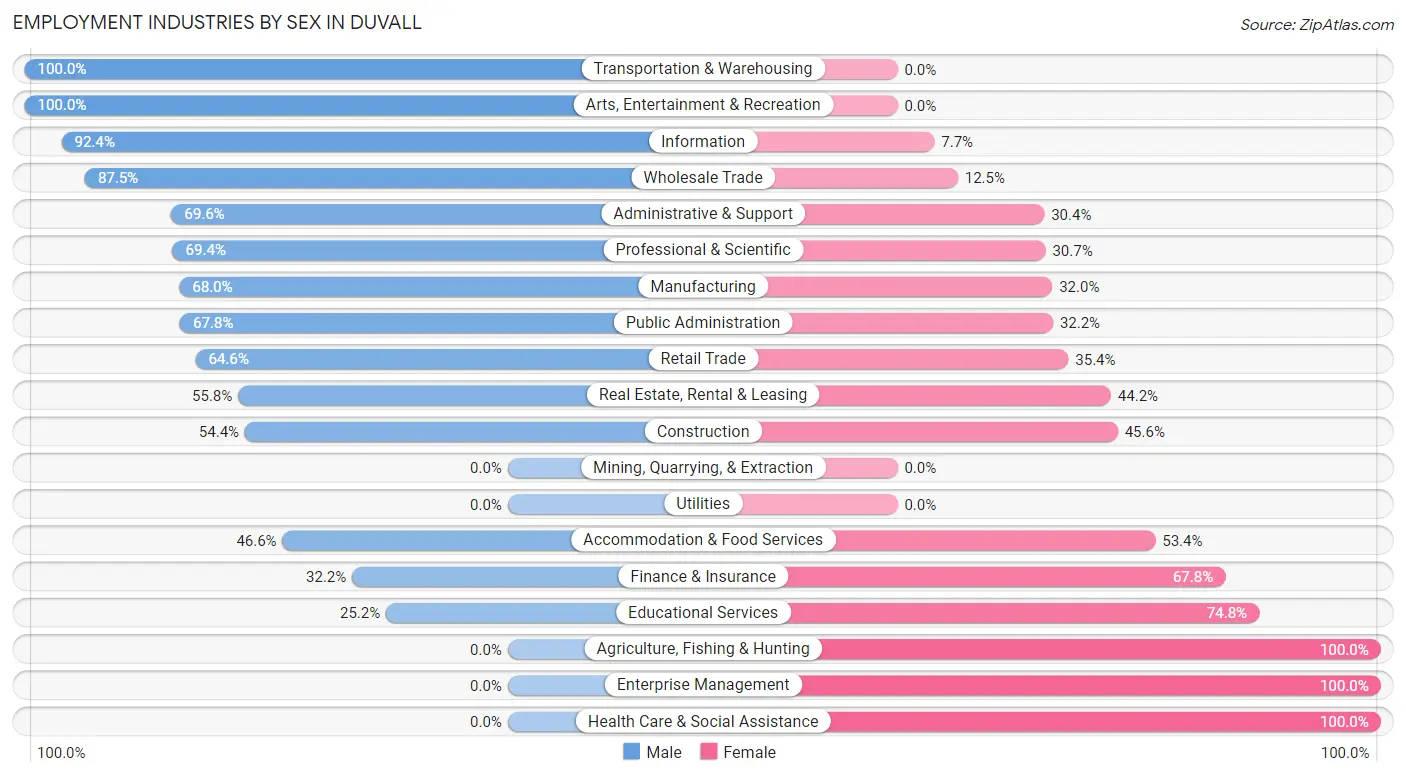
Employment Industries by Sex in Duvall
The Duvall industries that see more men than women are Transportation & Warehousing (100.0%), Arts, Entertainment & Recreation (100.0%), and Information (92.3%), whereas the industries that tend to have a higher number of women are Agriculture, Fishing & Hunting (100.0%), Enterprise Management (100.0%), and Health Care & Social Assistance (100.0%).
| Industry | Male | Female |
| Agriculture, Fishing & Hunting | 0 (0.0%) | 15 (100.0%) |
| Mining, Quarrying, & Extraction | 0 (0.0%) | 0 (0.0%) |
| Construction | 68 (54.4%) | 57 (45.6%) |
| Manufacturing | 246 (68.0%) | 116 (32.0%) |
| Wholesale Trade | 84 (87.5%) | 12 (12.5%) |
| Retail Trade | 232 (64.6%) | 127 (35.4%) |
| Transportation & Warehousing | 83 (100.0%) | 0 (0.0%) |
| Utilities | 0 (0.0%) | 0 (0.0%) |
| Information | 169 (92.3%) | 14 (7.6%) |
| Finance & Insurance | 67 (32.2%) | 141 (67.8%) |
| Real Estate, Rental & Leasing | 24 (55.8%) | 19 (44.2%) |
| Professional & Scientific | 783 (69.4%) | 346 (30.6%) |
| Enterprise Management | 0 (0.0%) | 21 (100.0%) |
| Administrative & Support | 71 (69.6%) | 31 (30.4%) |
| Educational Services | 107 (25.2%) | 318 (74.8%) |
| Health Care & Social Assistance | 0 (0.0%) | 195 (100.0%) |
| Arts, Entertainment & Recreation | 20 (100.0%) | 0 (0.0%) |
| Accommodation & Food Services | 187 (46.6%) | 214 (53.4%) |
| Public Administration | 99 (67.8%) | 47 (32.2%) |
| Total | 2,267 (55.8%) | 1,794 (44.2%) |
Education in Duvall
School Enrollment in Duvall
The most common levels of schooling among the 2,600 students in Duvall are middle school (604 | 23.2%), high school (578 | 22.2%), and elementary school (561 | 21.6%).
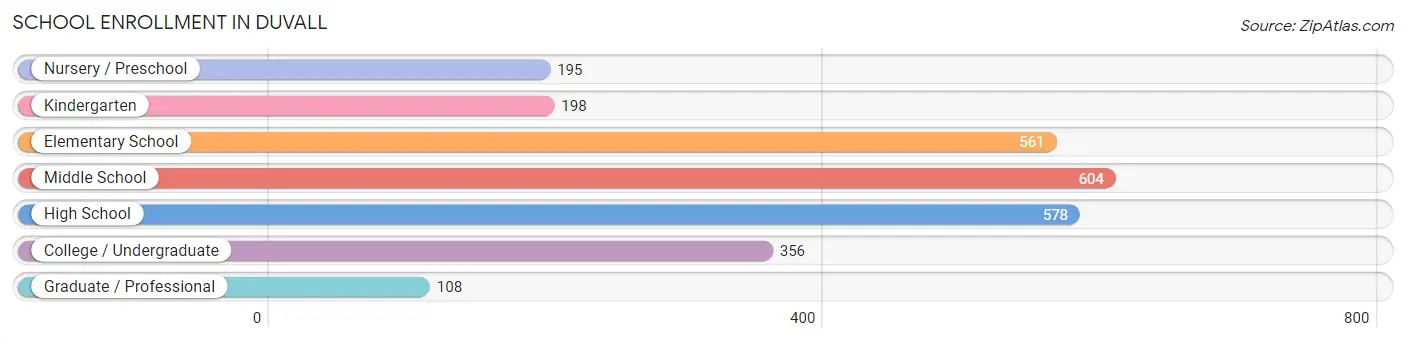
| School Level | # Students | % Students |
| Nursery / Preschool | 195 | 7.5% |
| Kindergarten | 198 | 7.6% |
| Elementary School | 561 | 21.6% |
| Middle School | 604 | 23.2% |
| High School | 578 | 22.2% |
| College / Undergraduate | 356 | 13.7% |
| Graduate / Professional | 108 | 4.2% |
| Total | 2,600 | 100.0% |
School Enrollment by Age by Funding Source in Duvall
Out of a total of 2,600 students who are enrolled in schools in Duvall, 432 (16.6%) attend a private institution, while the remaining 2,168 (83.4%) are enrolled in public schools. The age group of 3 to 4 year olds has the highest likelihood of being enrolled in private schools, with 116 (89.9% in the age bracket) enrolled. Conversely, the age group of 18 to 19 year olds has the lowest likelihood of being enrolled in a private school, with 94 (100.0% in the age bracket) attending a public institution.
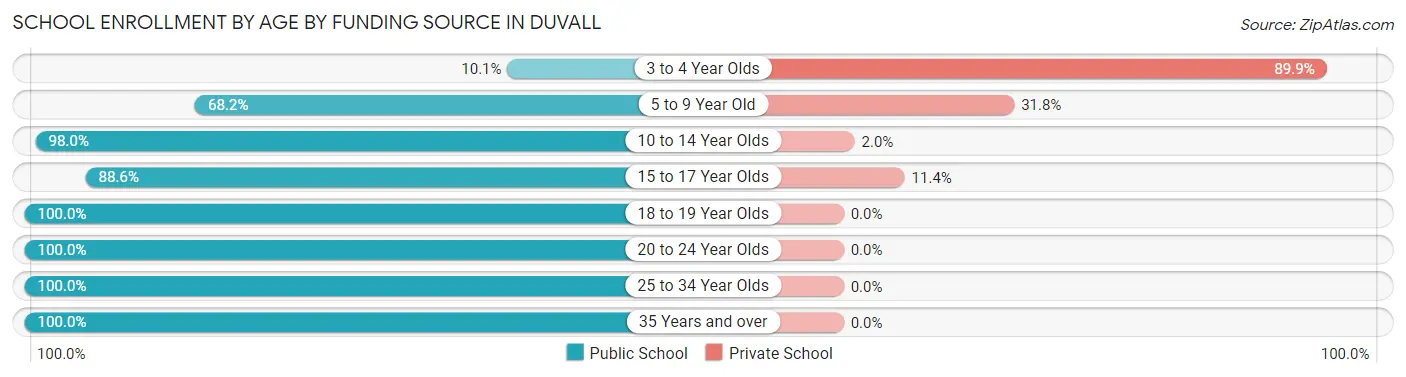
| Age Bracket | Public School | Private School |
| 3 to 4 Year Olds | 13 (10.1%) | 116 (89.9%) |
| 5 to 9 Year Old | 550 (68.2%) | 256 (31.8%) |
| 10 to 14 Year Olds | 719 (98.0%) | 15 (2.0%) |
| 15 to 17 Year Olds | 351 (88.6%) | 45 (11.4%) |
| 18 to 19 Year Olds | 94 (100.0%) | 0 (0.0%) |
| 20 to 24 Year Olds | 200 (100.0%) | 0 (0.0%) |
| 25 to 34 Year Olds | 175 (100.0%) | 0 (0.0%) |
| 35 Years and over | 66 (100.0%) | 0 (0.0%) |
| Total | 2,168 (83.4%) | 432 (16.6%) |
Educational Attainment by Field of Study in Duvall
Computers & mathematics (457 | 14.5%), science & technology (383 | 12.1%), engineering (375 | 11.9%), business (348 | 11.0%), and communications (278 | 8.8%) are the most common fields of study among 3,152 individuals in Duvall who have obtained a bachelor's degree or higher.
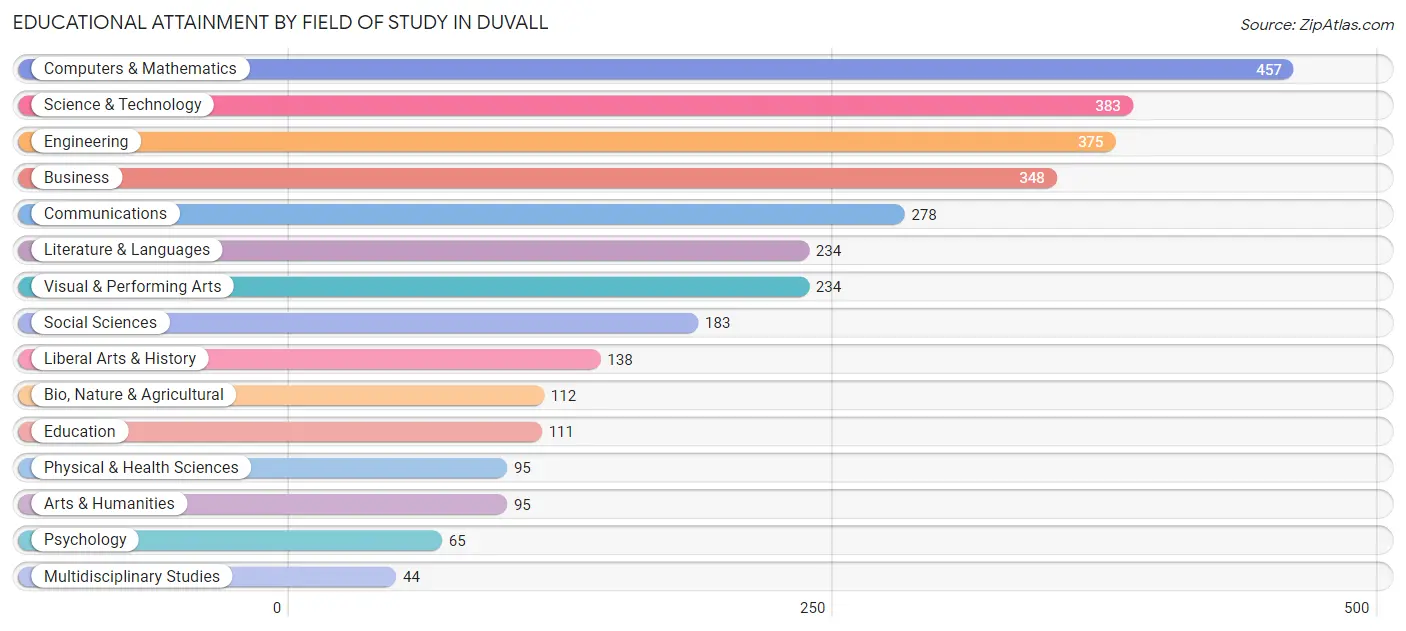
| Field of Study | # Graduates | % Graduates |
| Computers & Mathematics | 457 | 14.5% |
| Bio, Nature & Agricultural | 112 | 3.5% |
| Physical & Health Sciences | 95 | 3.0% |
| Psychology | 65 | 2.1% |
| Social Sciences | 183 | 5.8% |
| Engineering | 375 | 11.9% |
| Multidisciplinary Studies | 44 | 1.4% |
| Science & Technology | 383 | 12.1% |
| Business | 348 | 11.0% |
| Education | 111 | 3.5% |
| Literature & Languages | 234 | 7.4% |
| Liberal Arts & History | 138 | 4.4% |
| Visual & Performing Arts | 234 | 7.4% |
| Communications | 278 | 8.8% |
| Arts & Humanities | 95 | 3.0% |
| Total | 3,152 | 100.0% |
Transportation & Commute in Duvall
Vehicle Availability by Sex in Duvall
The most prevalent vehicle ownership categories in Duvall are males with 2 vehicles (1,084, accounting for 49.1%) and females with 2 vehicles (804, making up 60.8%).
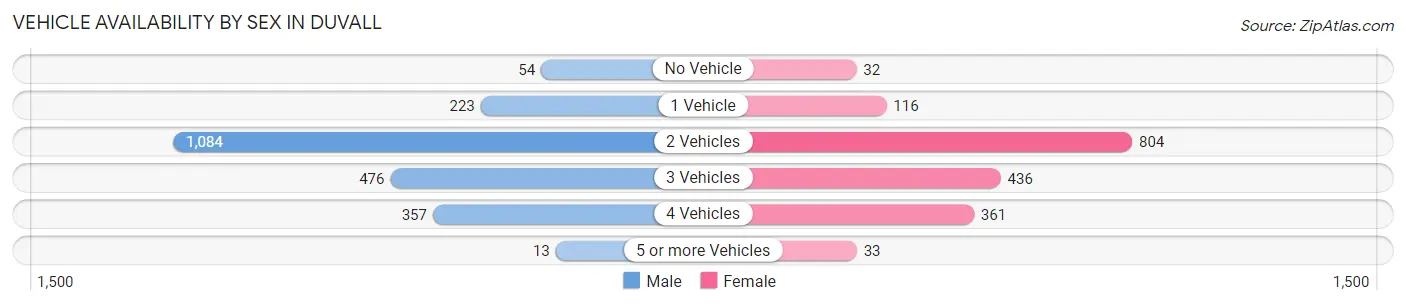
| Vehicles Available | Male | Female |
| No Vehicle | 54 (2.5%) | 32 (1.8%) |
| 1 Vehicle | 223 (10.1%) | 116 (6.5%) |
| 2 Vehicles | 1,084 (49.1%) | 804 (45.1%) |
| 3 Vehicles | 476 (21.6%) | 436 (24.5%) |
| 4 Vehicles | 357 (16.2%) | 361 (20.3%) |
| 5 or more Vehicles | 13 (0.6%) | 33 (1.8%) |
| Total | 2,207 (100.0%) | 1,782 (100.0%) |
Commute Time in Duvall
The most frequently occuring commute durations in Duvall are 25 to 29 minutes (461 commuters, 16.1%), 20 to 24 minutes (421 commuters, 14.7%), and 45 to 59 minutes (401 commuters, 14.0%).
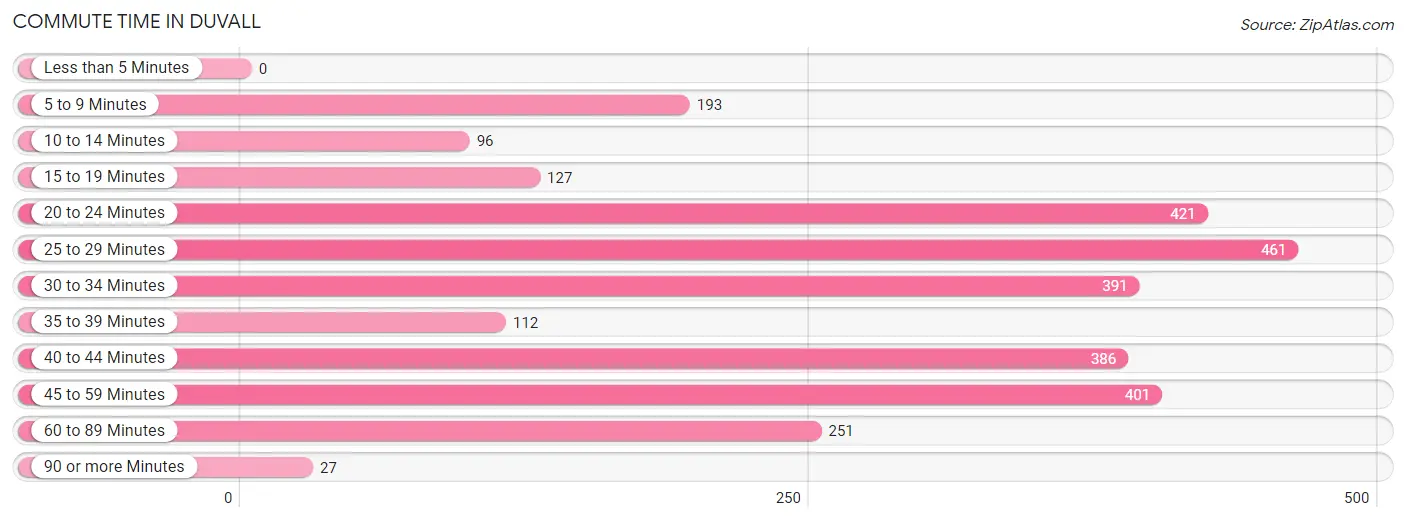
| Commute Time | # Commuters | % Commuters |
| Less than 5 Minutes | 0 | 0.0% |
| 5 to 9 Minutes | 193 | 6.7% |
| 10 to 14 Minutes | 96 | 3.4% |
| 15 to 19 Minutes | 127 | 4.4% |
| 20 to 24 Minutes | 421 | 14.7% |
| 25 to 29 Minutes | 461 | 16.1% |
| 30 to 34 Minutes | 391 | 13.6% |
| 35 to 39 Minutes | 112 | 3.9% |
| 40 to 44 Minutes | 386 | 13.5% |
| 45 to 59 Minutes | 401 | 14.0% |
| 60 to 89 Minutes | 251 | 8.8% |
| 90 or more Minutes | 27 | 0.9% |
Commute Time by Sex in Duvall
The most common commute times in Duvall are 40 to 44 minutes (254 commuters, 17.3%) for males and 25 to 29 minutes (256 commuters, 18.3%) for females.
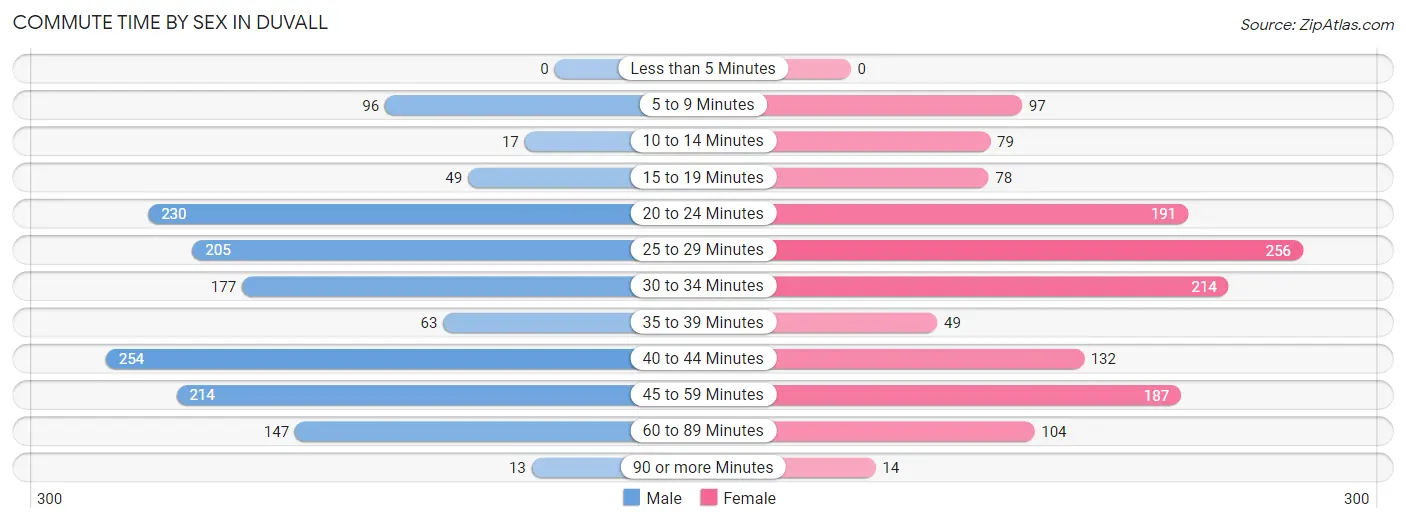
| Commute Time | Male | Female |
| Less than 5 Minutes | 0 (0.0%) | 0 (0.0%) |
| 5 to 9 Minutes | 96 (6.6%) | 97 (6.9%) |
| 10 to 14 Minutes | 17 (1.2%) | 79 (5.6%) |
| 15 to 19 Minutes | 49 (3.3%) | 78 (5.6%) |
| 20 to 24 Minutes | 230 (15.7%) | 191 (13.6%) |
| 25 to 29 Minutes | 205 (14.0%) | 256 (18.3%) |
| 30 to 34 Minutes | 177 (12.1%) | 214 (15.3%) |
| 35 to 39 Minutes | 63 (4.3%) | 49 (3.5%) |
| 40 to 44 Minutes | 254 (17.3%) | 132 (9.4%) |
| 45 to 59 Minutes | 214 (14.6%) | 187 (13.4%) |
| 60 to 89 Minutes | 147 (10.0%) | 104 (7.4%) |
| 90 or more Minutes | 13 (0.9%) | 14 (1.0%) |
Time of Departure to Work by Sex in Duvall
The most frequent times of departure to work in Duvall are 6:00 AM to 6:29 AM (281, 19.2%) for males and 8:30 AM to 8:59 AM (213, 15.2%) for females.
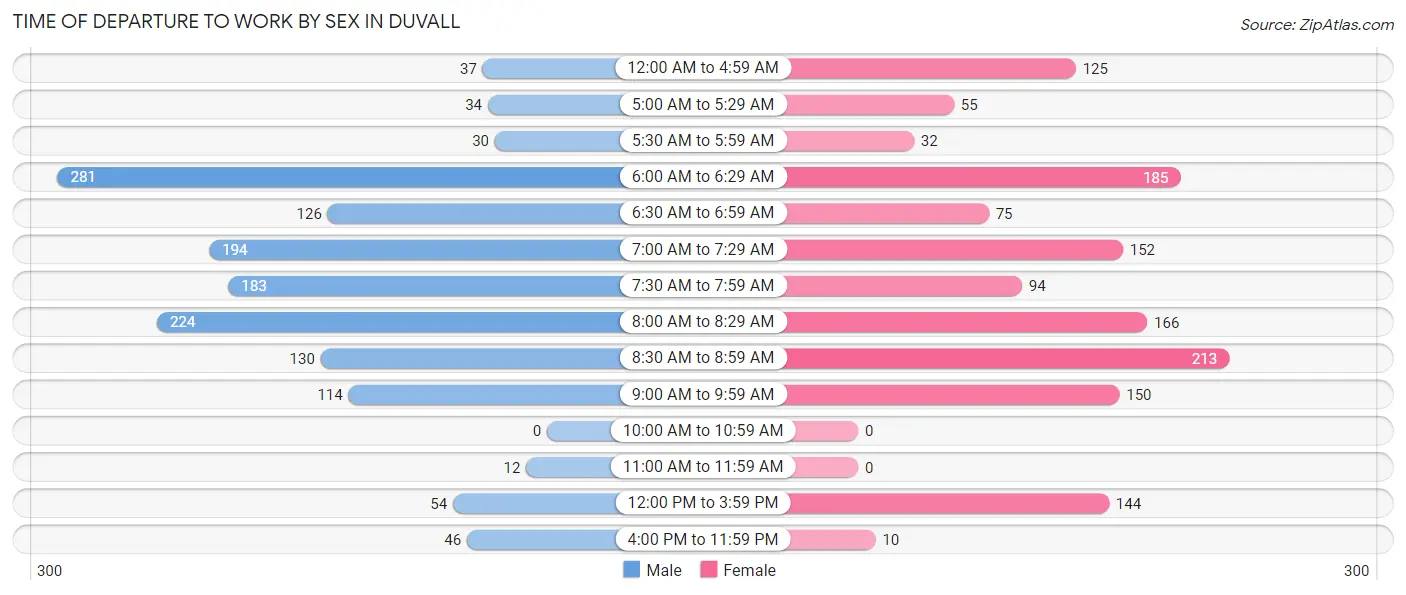
| Time of Departure | Male | Female |
| 12:00 AM to 4:59 AM | 37 (2.5%) | 125 (8.9%) |
| 5:00 AM to 5:29 AM | 34 (2.3%) | 55 (3.9%) |
| 5:30 AM to 5:59 AM | 30 (2.1%) | 32 (2.3%) |
| 6:00 AM to 6:29 AM | 281 (19.2%) | 185 (13.2%) |
| 6:30 AM to 6:59 AM | 126 (8.6%) | 75 (5.3%) |
| 7:00 AM to 7:29 AM | 194 (13.2%) | 152 (10.8%) |
| 7:30 AM to 7:59 AM | 183 (12.5%) | 94 (6.7%) |
| 8:00 AM to 8:29 AM | 224 (15.3%) | 166 (11.8%) |
| 8:30 AM to 8:59 AM | 130 (8.9%) | 213 (15.2%) |
| 9:00 AM to 9:59 AM | 114 (7.8%) | 150 (10.7%) |
| 10:00 AM to 10:59 AM | 0 (0.0%) | 0 (0.0%) |
| 11:00 AM to 11:59 AM | 12 (0.8%) | 0 (0.0%) |
| 12:00 PM to 3:59 PM | 54 (3.7%) | 144 (10.3%) |
| 4:00 PM to 11:59 PM | 46 (3.1%) | 10 (0.7%) |
| Total | 1,465 (100.0%) | 1,401 (100.0%) |
Housing Occupancy in Duvall
Occupancy by Ownership in Duvall
Of the total 2,584 dwellings in Duvall, owner-occupied units account for 2,346 (90.8%), while renter-occupied units make up 238 (9.2%).
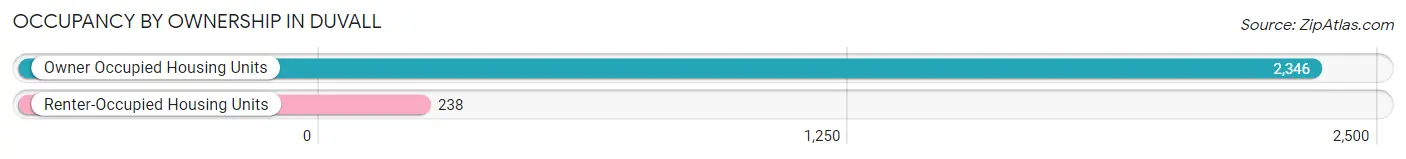
| Occupancy | # Housing Units | % Housing Units |
| Owner Occupied Housing Units | 2,346 | 90.8% |
| Renter-Occupied Housing Units | 238 | 9.2% |
| Total Occupied Housing Units | 2,584 | 100.0% |
Occupancy by Household Size in Duvall
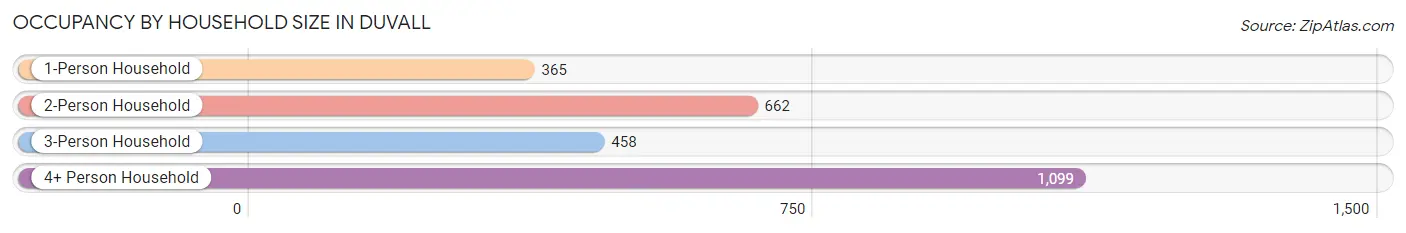
| Household Size | # Housing Units | % Housing Units |
| 1-Person Household | 365 | 14.1% |
| 2-Person Household | 662 | 25.6% |
| 3-Person Household | 458 | 17.7% |
| 4+ Person Household | 1,099 | 42.5% |
| Total Housing Units | 2,584 | 100.0% |
Occupancy by Ownership by Household Size in Duvall
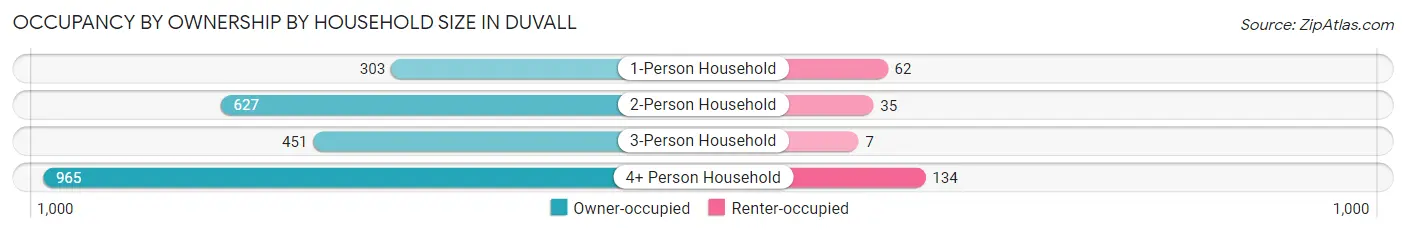
| Household Size | Owner-occupied | Renter-occupied |
| 1-Person Household | 303 (83.0%) | 62 (17.0%) |
| 2-Person Household | 627 (94.7%) | 35 (5.3%) |
| 3-Person Household | 451 (98.5%) | 7 (1.5%) |
| 4+ Person Household | 965 (87.8%) | 134 (12.2%) |
| Total Housing Units | 2,346 (90.8%) | 238 (9.2%) |
Occupancy by Educational Attainment in Duvall
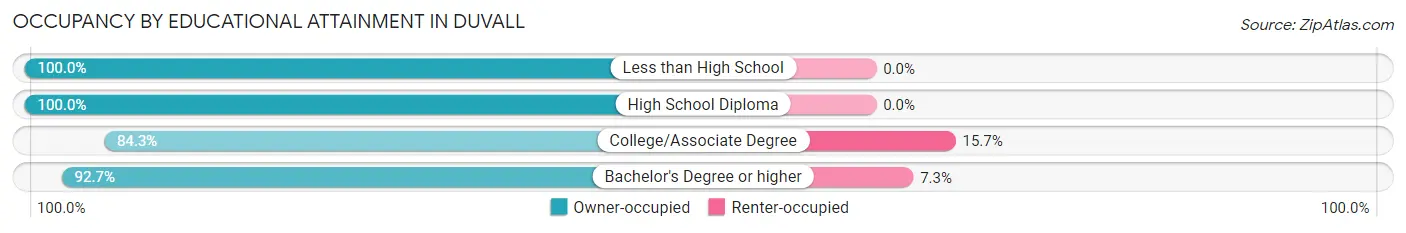
| Household Size | Owner-occupied | Renter-occupied |
| Less than High School | 25 (100.0%) | 0 (0.0%) |
| High School Diploma | 137 (100.0%) | 0 (0.0%) |
| College/Associate Degree | 605 (84.3%) | 113 (15.7%) |
| Bachelor's Degree or higher | 1,579 (92.7%) | 125 (7.3%) |
Occupancy by Age of Householder in Duvall
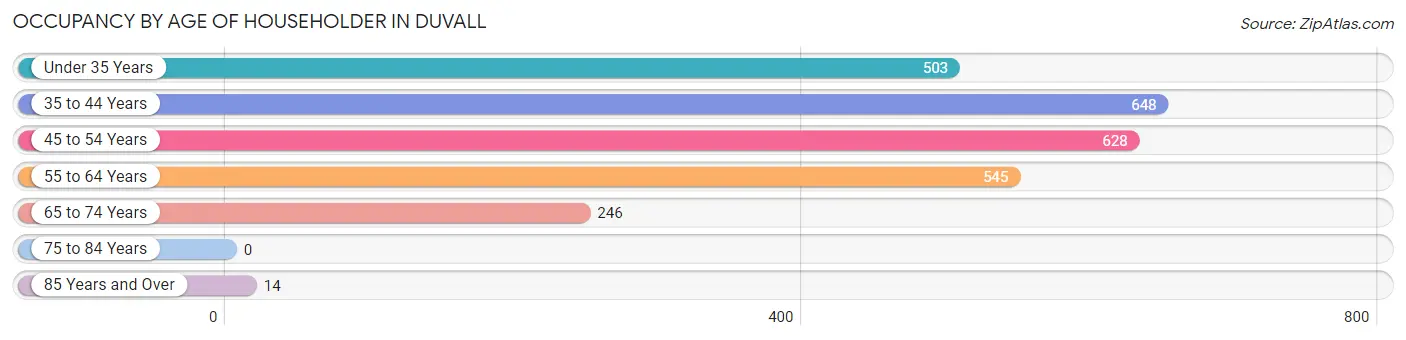
| Age Bracket | # Households | % Households |
| Under 35 Years | 503 | 19.5% |
| 35 to 44 Years | 648 | 25.1% |
| 45 to 54 Years | 628 | 24.3% |
| 55 to 64 Years | 545 | 21.1% |
| 65 to 74 Years | 246 | 9.5% |
| 75 to 84 Years | 0 | 0.0% |
| 85 Years and Over | 14 | 0.5% |
| Total | 2,584 | 100.0% |
Housing Finances in Duvall
Median Income by Occupancy in Duvall
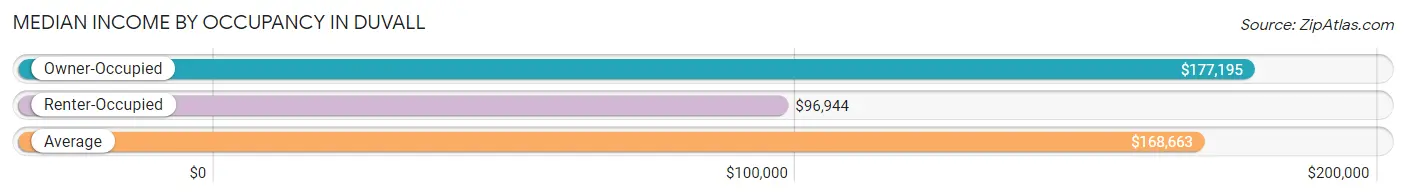
| Occupancy Type | # Households | Median Income |
| Owner-Occupied | 2,346 (90.8%) | $177,195 |
| Renter-Occupied | 238 (9.2%) | $96,944 |
| Average | 2,584 (100.0%) | $168,663 |
Occupancy by Householder Income Bracket in Duvall
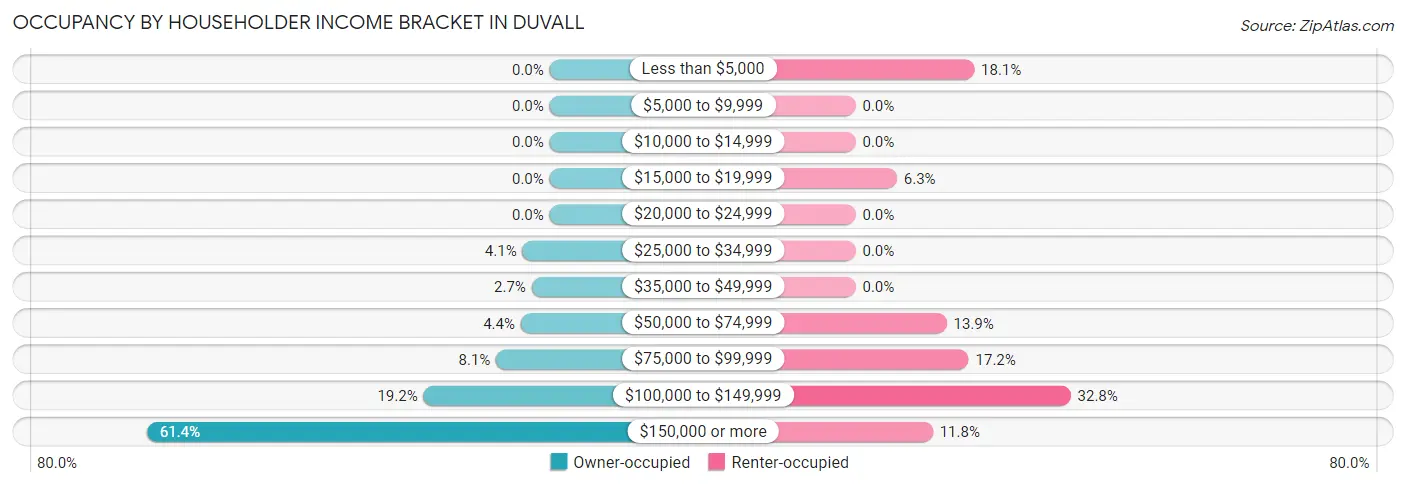
| Income Bracket | Owner-occupied | Renter-occupied |
| Less than $5,000 | 0 (0.0%) | 43 (18.1%) |
| $5,000 to $9,999 | 0 (0.0%) | 0 (0.0%) |
| $10,000 to $14,999 | 0 (0.0%) | 0 (0.0%) |
| $15,000 to $19,999 | 0 (0.0%) | 15 (6.3%) |
| $20,000 to $24,999 | 0 (0.0%) | 0 (0.0%) |
| $25,000 to $34,999 | 97 (4.1%) | 0 (0.0%) |
| $35,000 to $49,999 | 64 (2.7%) | 0 (0.0%) |
| $50,000 to $74,999 | 103 (4.4%) | 33 (13.9%) |
| $75,000 to $99,999 | 191 (8.1%) | 41 (17.2%) |
| $100,000 to $149,999 | 451 (19.2%) | 78 (32.8%) |
| $150,000 or more | 1,440 (61.4%) | 28 (11.8%) |
| Total | 2,346 (100.0%) | 238 (100.0%) |
Monthly Housing Cost Tiers in Duvall
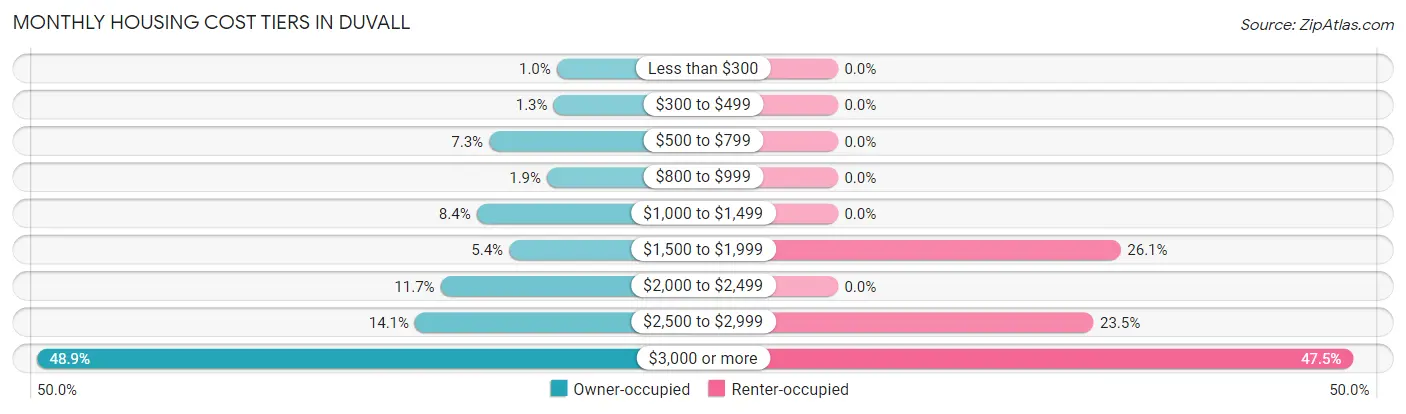
| Monthly Cost | Owner-occupied | Renter-occupied |
| Less than $300 | 24 (1.0%) | 0 (0.0%) |
| $300 to $499 | 31 (1.3%) | 0 (0.0%) |
| $500 to $799 | 170 (7.2%) | 0 (0.0%) |
| $800 to $999 | 45 (1.9%) | 0 (0.0%) |
| $1,000 to $1,499 | 197 (8.4%) | 0 (0.0%) |
| $1,500 to $1,999 | 127 (5.4%) | 62 (26.1%) |
| $2,000 to $2,499 | 275 (11.7%) | 0 (0.0%) |
| $2,500 to $2,999 | 330 (14.1%) | 56 (23.5%) |
| $3,000 or more | 1,147 (48.9%) | 113 (47.5%) |
| Total | 2,346 (100.0%) | 238 (100.0%) |
Physical Housing Characteristics in Duvall
Housing Structures in Duvall
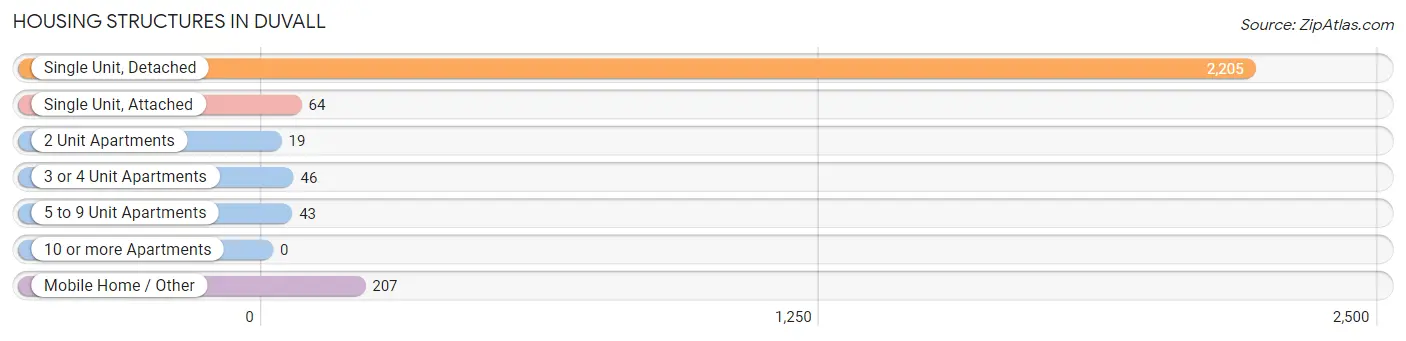
| Structure Type | # Housing Units | % Housing Units |
| Single Unit, Detached | 2,205 | 85.3% |
| Single Unit, Attached | 64 | 2.5% |
| 2 Unit Apartments | 19 | 0.7% |
| 3 or 4 Unit Apartments | 46 | 1.8% |
| 5 to 9 Unit Apartments | 43 | 1.7% |
| 10 or more Apartments | 0 | 0.0% |
| Mobile Home / Other | 207 | 8.0% |
| Total | 2,584 | 100.0% |
Housing Structures by Occupancy in Duvall
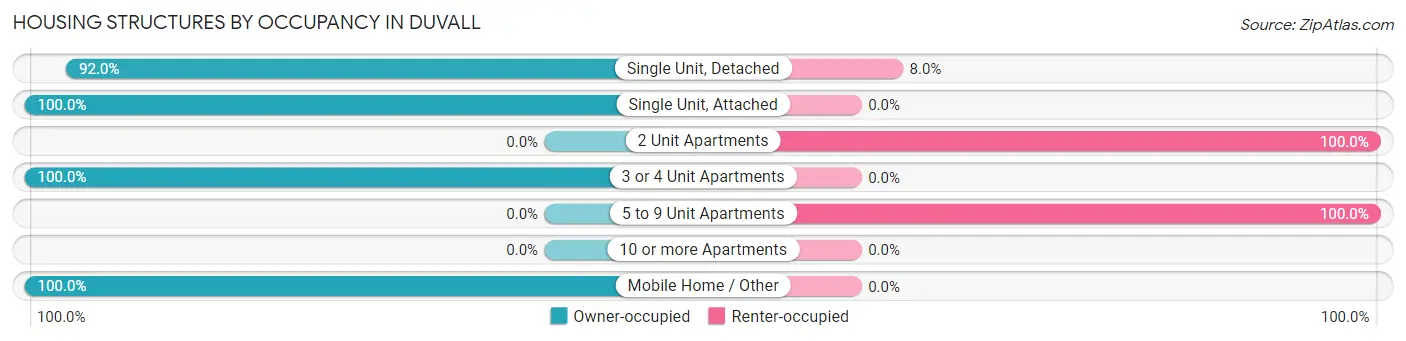
| Structure Type | Owner-occupied | Renter-occupied |
| Single Unit, Detached | 2,029 (92.0%) | 176 (8.0%) |
| Single Unit, Attached | 64 (100.0%) | 0 (0.0%) |
| 2 Unit Apartments | 0 (0.0%) | 19 (100.0%) |
| 3 or 4 Unit Apartments | 46 (100.0%) | 0 (0.0%) |
| 5 to 9 Unit Apartments | 0 (0.0%) | 43 (100.0%) |
| 10 or more Apartments | 0 (0.0%) | 0 (0.0%) |
| Mobile Home / Other | 207 (100.0%) | 0 (0.0%) |
| Total | 2,346 (90.8%) | 238 (9.2%) |
Housing Structures by Number of Rooms in Duvall
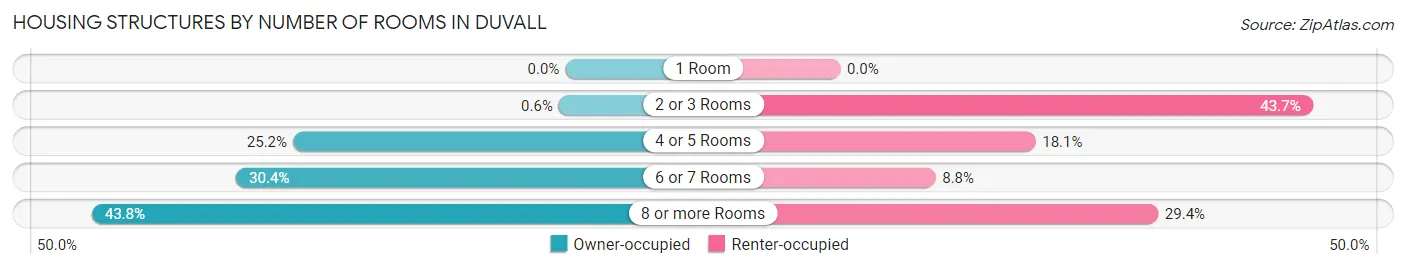
| Number of Rooms | Owner-occupied | Renter-occupied |
| 1 Room | 0 (0.0%) | 0 (0.0%) |
| 2 or 3 Rooms | 14 (0.6%) | 104 (43.7%) |
| 4 or 5 Rooms | 591 (25.2%) | 43 (18.1%) |
| 6 or 7 Rooms | 714 (30.4%) | 21 (8.8%) |
| 8 or more Rooms | 1,027 (43.8%) | 70 (29.4%) |
| Total | 2,346 (100.0%) | 238 (100.0%) |
Housing Structure by Heating Type in Duvall
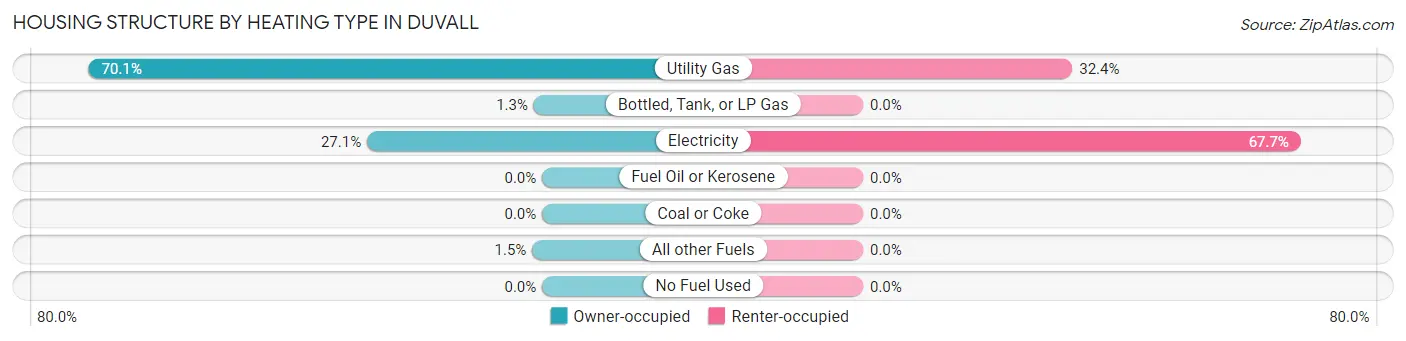
| Heating Type | Owner-occupied | Renter-occupied |
| Utility Gas | 1,645 (70.1%) | 77 (32.4%) |
| Bottled, Tank, or LP Gas | 30 (1.3%) | 0 (0.0%) |
| Electricity | 635 (27.1%) | 161 (67.6%) |
| Fuel Oil or Kerosene | 0 (0.0%) | 0 (0.0%) |
| Coal or Coke | 0 (0.0%) | 0 (0.0%) |
| All other Fuels | 36 (1.5%) | 0 (0.0%) |
| No Fuel Used | 0 (0.0%) | 0 (0.0%) |
| Total | 2,346 (100.0%) | 238 (100.0%) |
Household Vehicle Usage in Duvall
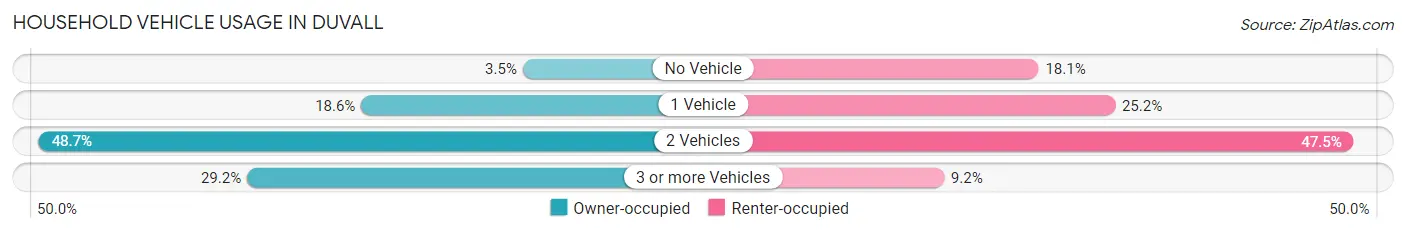
| Vehicles per Household | Owner-occupied | Renter-occupied |
| No Vehicle | 82 (3.5%) | 43 (18.1%) |
| 1 Vehicle | 436 (18.6%) | 60 (25.2%) |
| 2 Vehicles | 1,142 (48.7%) | 113 (47.5%) |
| 3 or more Vehicles | 686 (29.2%) | 22 (9.2%) |
| Total | 2,346 (100.0%) | 238 (100.0%) |
Real Estate & Mortgages in Duvall
Real Estate and Mortgage Overview in Duvall
| Characteristic | Without Mortgage | With Mortgage |
| Housing Units | 395 | 1,951 |
| Median Property Value | - | - |
| Median Household Income | $85,379 | $1,319 |
| Monthly Housing Costs | $770 | $1,147 |
| Real Estate Taxes | - | - |
Property Value by Mortgage Status in Duvall
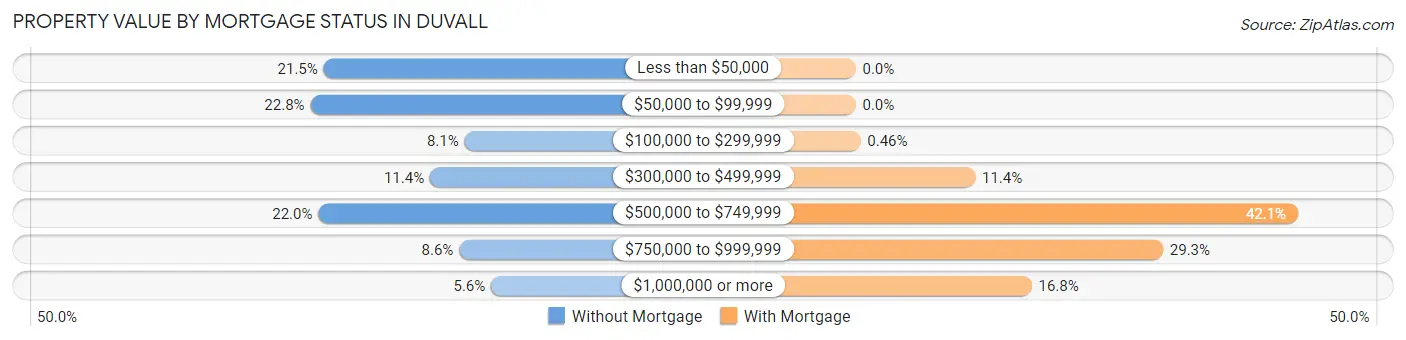
| Property Value | Without Mortgage | With Mortgage |
| Less than $50,000 | 85 (21.5%) | 0 (0.0%) |
| $50,000 to $99,999 | 90 (22.8%) | 0 (0.0%) |
| $100,000 to $299,999 | 32 (8.1%) | 9 (0.5%) |
| $300,000 to $499,999 | 45 (11.4%) | 222 (11.4%) |
| $500,000 to $749,999 | 87 (22.0%) | 822 (42.1%) |
| $750,000 to $999,999 | 34 (8.6%) | 571 (29.3%) |
| $1,000,000 or more | 22 (5.6%) | 327 (16.8%) |
| Total | 395 (100.0%) | 1,951 (100.0%) |
Household Income by Mortgage Status in Duvall
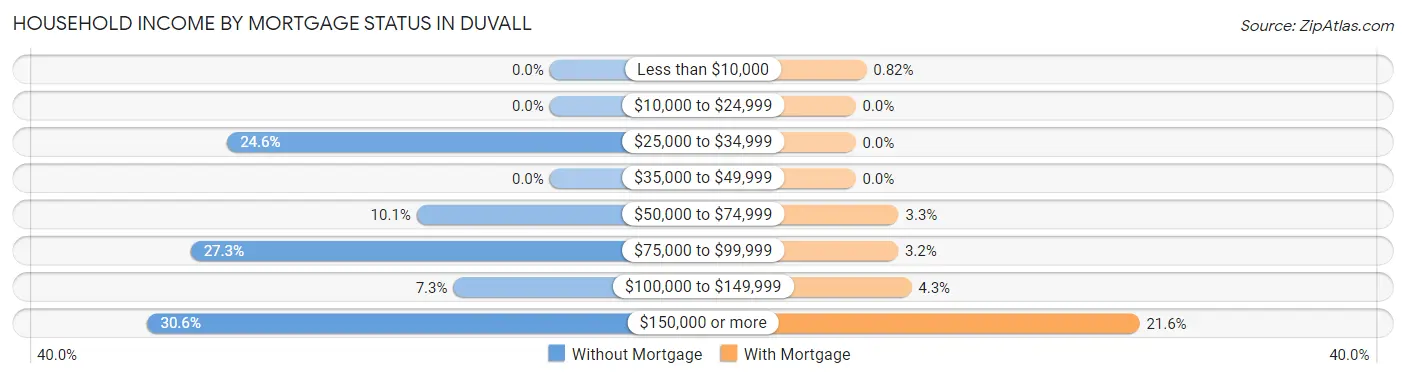
| Household Income | Without Mortgage | With Mortgage |
| Less than $10,000 | 0 (0.0%) | 16 (0.8%) |
| $10,000 to $24,999 | 0 (0.0%) | 0 (0.0%) |
| $25,000 to $34,999 | 97 (24.6%) | 0 (0.0%) |
| $35,000 to $49,999 | 0 (0.0%) | 0 (0.0%) |
| $50,000 to $74,999 | 40 (10.1%) | 64 (3.3%) |
| $75,000 to $99,999 | 108 (27.3%) | 63 (3.2%) |
| $100,000 to $149,999 | 29 (7.3%) | 83 (4.3%) |
| $150,000 or more | 121 (30.6%) | 422 (21.6%) |
| Total | 395 (100.0%) | 1,951 (100.0%) |
Property Value to Household Income Ratio in Duvall
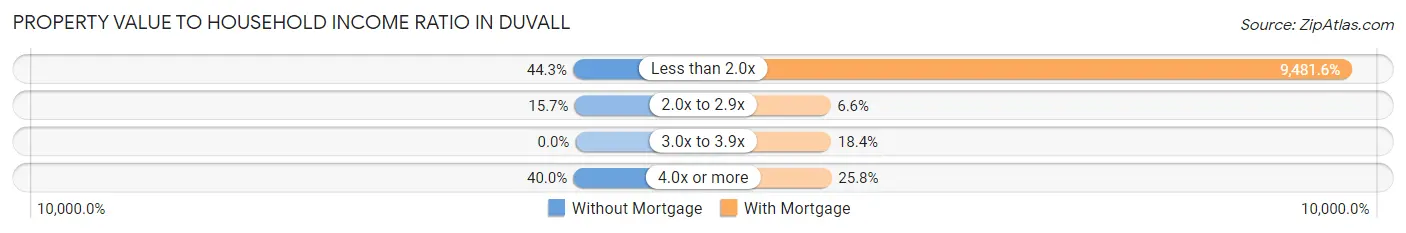
| Value-to-Income Ratio | Without Mortgage | With Mortgage |
| Less than 2.0x | 175 (44.3%) | 184,986 (9,481.6%) |
| 2.0x to 2.9x | 62 (15.7%) | 128 (6.6%) |
| 3.0x to 3.9x | 0 (0.0%) | 358 (18.3%) |
| 4.0x or more | 158 (40.0%) | 504 (25.8%) |
| Total | 395 (100.0%) | 1,951 (100.0%) |
Real Estate Taxes by Mortgage Status in Duvall

| Property Taxes | Without Mortgage | With Mortgage |
| Less than $800 | 165 (41.8%) | 0 (0.0%) |
| $800 to $1,499 | 0 (0.0%) | 0 (0.0%) |
| $800 to $1,499 | 230 (58.2%) | 0 (0.0%) |
| Total | 395 (100.0%) | 1,951 (100.0%) |
Health & Disability in Duvall
Health Insurance Coverage by Age in Duvall
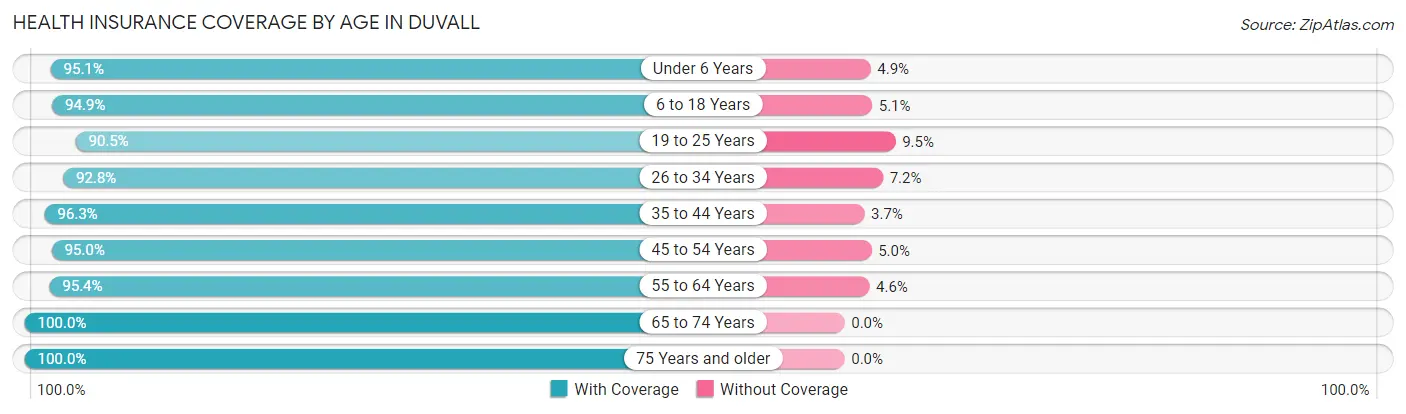
| Age Bracket | With Coverage | Without Coverage |
| Under 6 Years | 725 (95.1%) | 37 (4.9%) |
| 6 to 18 Years | 1,774 (94.9%) | 96 (5.1%) |
| 19 to 25 Years | 448 (90.5%) | 47 (9.5%) |
| 26 to 34 Years | 804 (92.8%) | 62 (7.2%) |
| 35 to 44 Years | 1,328 (96.3%) | 51 (3.7%) |
| 45 to 54 Years | 1,212 (95.0%) | 64 (5.0%) |
| 55 to 64 Years | 990 (95.4%) | 48 (4.6%) |
| 65 to 74 Years | 350 (100.0%) | 0 (0.0%) |
| 75 Years and older | 92 (100.0%) | 0 (0.0%) |
| Total | 7,723 (95.0%) | 405 (5.0%) |
Health Insurance Coverage by Citizenship Status in Duvall
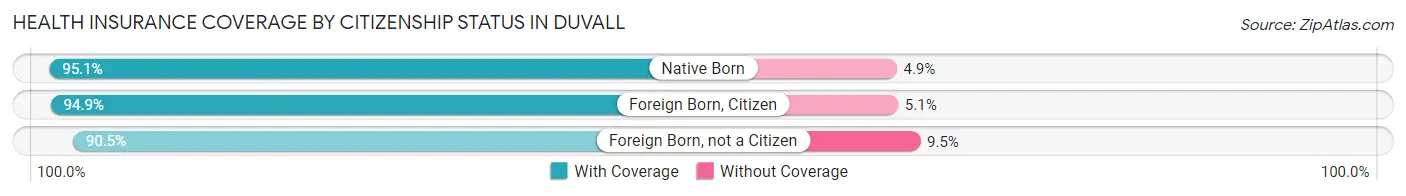
| Citizenship Status | With Coverage | Without Coverage |
| Native Born | 725 (95.1%) | 37 (4.9%) |
| Foreign Born, Citizen | 1,774 (94.9%) | 96 (5.1%) |
| Foreign Born, not a Citizen | 448 (90.5%) | 47 (9.5%) |
Health Insurance Coverage by Household Income in Duvall
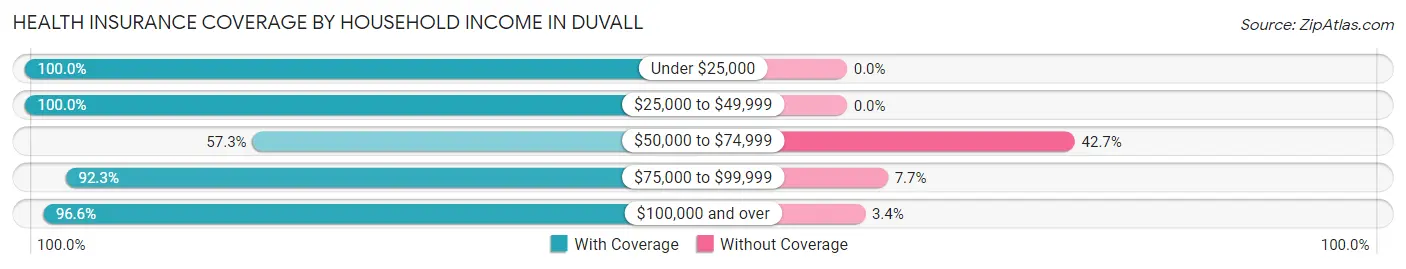
| Household Income | With Coverage | Without Coverage |
| Under $25,000 | 127 (100.0%) | 0 (0.0%) |
| $25,000 to $49,999 | 581 (100.0%) | 0 (0.0%) |
| $50,000 to $74,999 | 184 (57.3%) | 137 (42.7%) |
| $75,000 to $99,999 | 578 (92.3%) | 48 (7.7%) |
| $100,000 and over | 6,238 (96.6%) | 220 (3.4%) |
Public vs Private Health Insurance Coverage by Age in Duvall
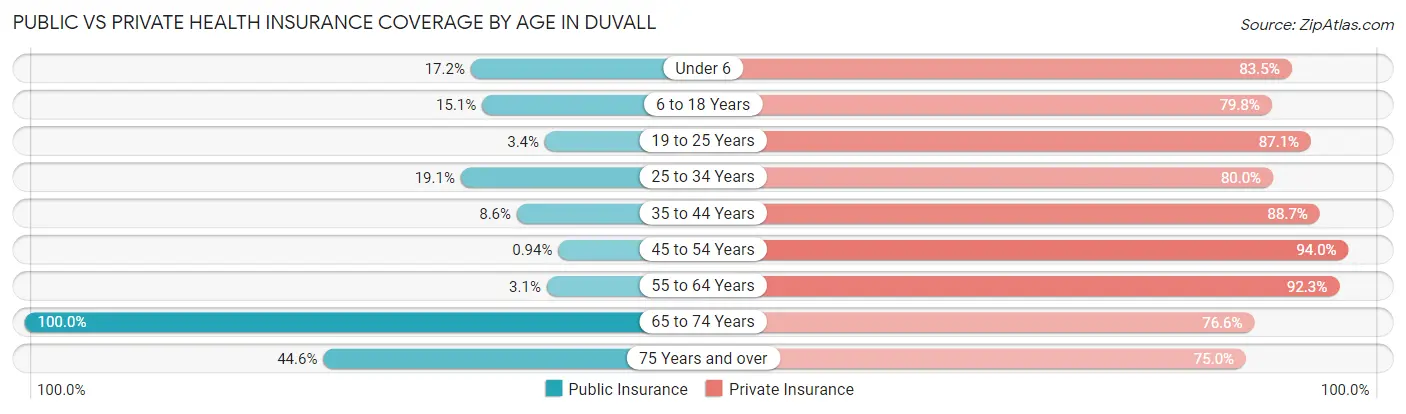
| Age Bracket | Public Insurance | Private Insurance |
| Under 6 | 131 (17.2%) | 636 (83.5%) |
| 6 to 18 Years | 282 (15.1%) | 1,492 (79.8%) |
| 19 to 25 Years | 17 (3.4%) | 431 (87.1%) |
| 25 to 34 Years | 165 (19.1%) | 693 (80.0%) |
| 35 to 44 Years | 119 (8.6%) | 1,223 (88.7%) |
| 45 to 54 Years | 12 (0.9%) | 1,200 (94.0%) |
| 55 to 64 Years | 32 (3.1%) | 958 (92.3%) |
| 65 to 74 Years | 350 (100.0%) | 268 (76.6%) |
| 75 Years and over | 41 (44.6%) | 69 (75.0%) |
| Total | 1,149 (14.1%) | 6,970 (85.8%) |
Disability Status by Sex by Age in Duvall
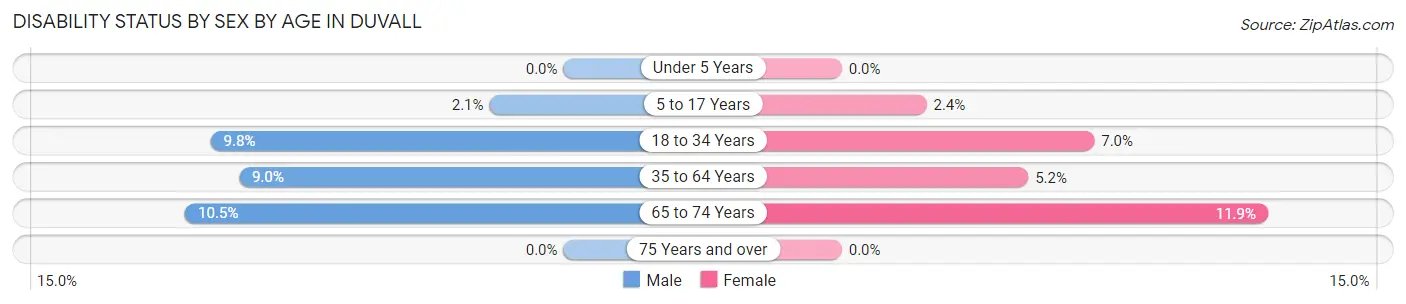
| Age Bracket | Male | Female |
| Under 5 Years | 0 (0.0%) | 0 (0.0%) |
| 5 to 17 Years | 20 (2.1%) | 24 (2.4%) |
| 18 to 34 Years | 77 (9.8%) | 47 (7.0%) |
| 35 to 64 Years | 163 (9.0%) | 98 (5.2%) |
| 65 to 74 Years | 4 (10.5%) | 37 (11.9%) |
| 75 Years and over | 0 (0.0%) | 0 (0.0%) |
Disability Class by Sex by Age in Duvall
Disability Class: Hearing Difficulty
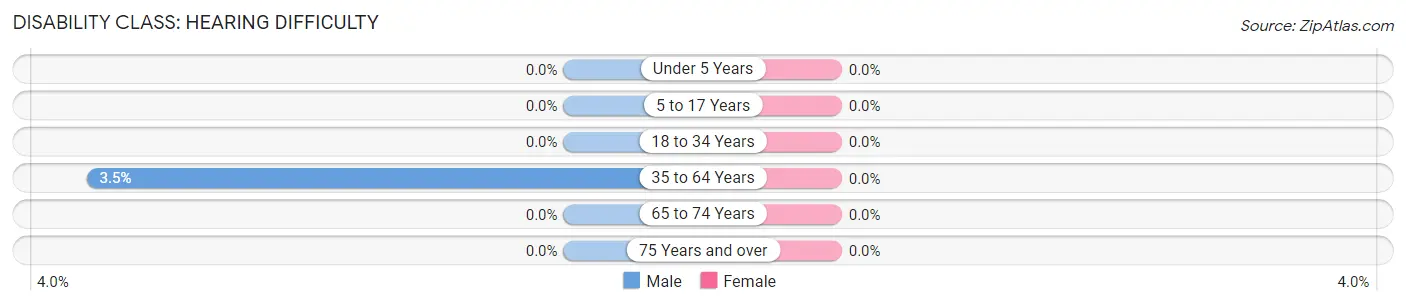
| Age Bracket | Male | Female |
| Under 5 Years | 0 (0.0%) | 0 (0.0%) |
| 5 to 17 Years | 0 (0.0%) | 0 (0.0%) |
| 18 to 34 Years | 0 (0.0%) | 0 (0.0%) |
| 35 to 64 Years | 64 (3.5%) | 0 (0.0%) |
| 65 to 74 Years | 0 (0.0%) | 0 (0.0%) |
| 75 Years and over | 0 (0.0%) | 0 (0.0%) |
Disability Class: Vision Difficulty
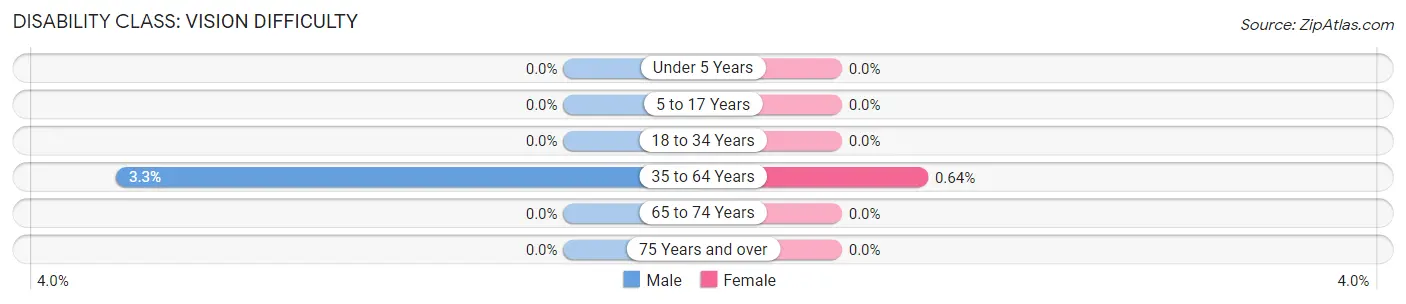
| Age Bracket | Male | Female |
| Under 5 Years | 0 (0.0%) | 0 (0.0%) |
| 5 to 17 Years | 0 (0.0%) | 0 (0.0%) |
| 18 to 34 Years | 0 (0.0%) | 0 (0.0%) |
| 35 to 64 Years | 60 (3.3%) | 12 (0.6%) |
| 65 to 74 Years | 0 (0.0%) | 0 (0.0%) |
| 75 Years and over | 0 (0.0%) | 0 (0.0%) |
Disability Class: Cognitive Difficulty
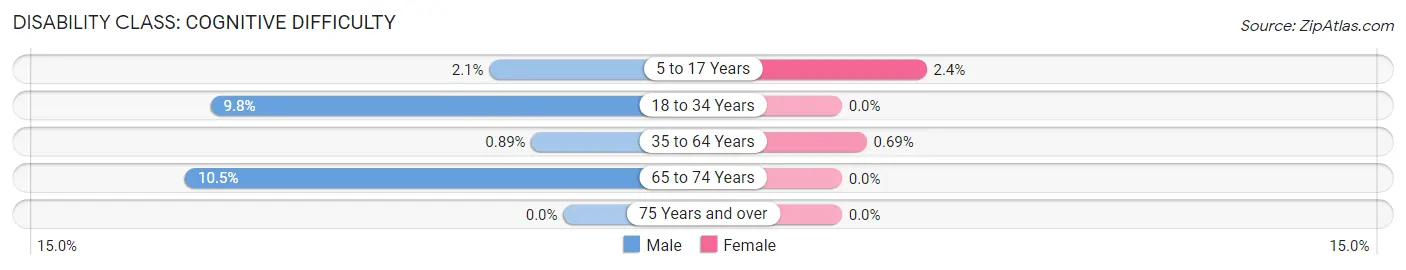
| Age Bracket | Male | Female |
| 5 to 17 Years | 20 (2.1%) | 24 (2.4%) |
| 18 to 34 Years | 77 (9.8%) | 0 (0.0%) |
| 35 to 64 Years | 16 (0.9%) | 13 (0.7%) |
| 65 to 74 Years | 4 (10.5%) | 0 (0.0%) |
| 75 Years and over | 0 (0.0%) | 0 (0.0%) |
Disability Class: Ambulatory Difficulty
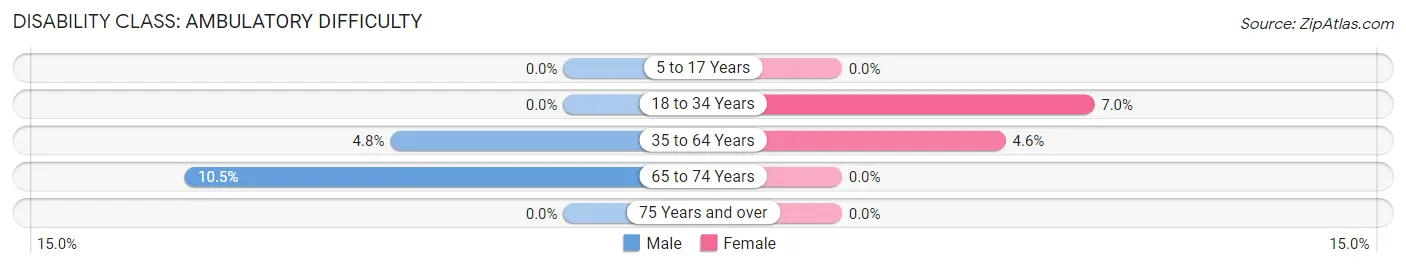
| Age Bracket | Male | Female |
| 5 to 17 Years | 0 (0.0%) | 0 (0.0%) |
| 18 to 34 Years | 0 (0.0%) | 47 (7.0%) |
| 35 to 64 Years | 87 (4.8%) | 86 (4.6%) |
| 65 to 74 Years | 4 (10.5%) | 0 (0.0%) |
| 75 Years and over | 0 (0.0%) | 0 (0.0%) |
Disability Class: Self-Care Difficulty
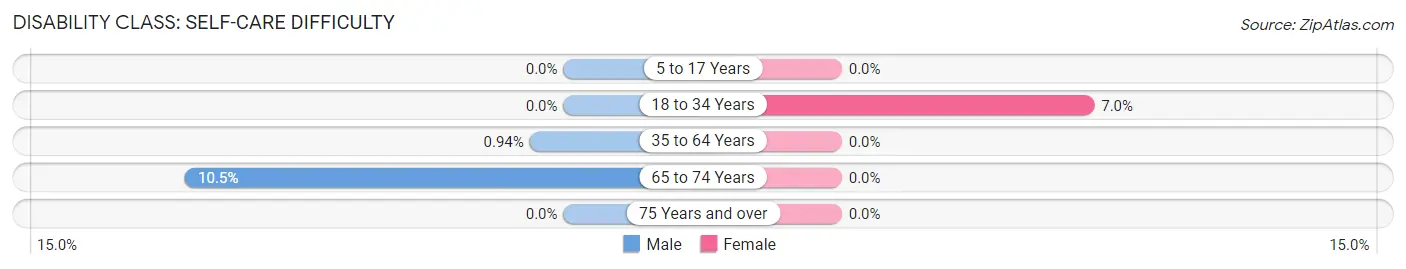
| Age Bracket | Male | Female |
| 5 to 17 Years | 0 (0.0%) | 0 (0.0%) |
| 18 to 34 Years | 0 (0.0%) | 47 (7.0%) |
| 35 to 64 Years | 17 (0.9%) | 0 (0.0%) |
| 65 to 74 Years | 4 (10.5%) | 0 (0.0%) |
| 75 Years and over | 0 (0.0%) | 0 (0.0%) |
Technology Access in Duvall
Computing Device Access in Duvall
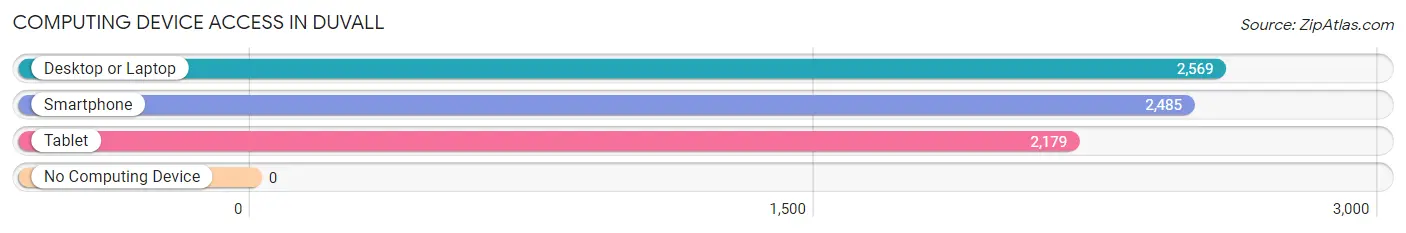
| Device Type | # Households | % Households |
| Desktop or Laptop | 2,569 | 99.4% |
| Smartphone | 2,485 | 96.2% |
| Tablet | 2,179 | 84.3% |
| No Computing Device | 0 | 0.0% |
| Total | 2,584 | 100.0% |
Internet Access in Duvall
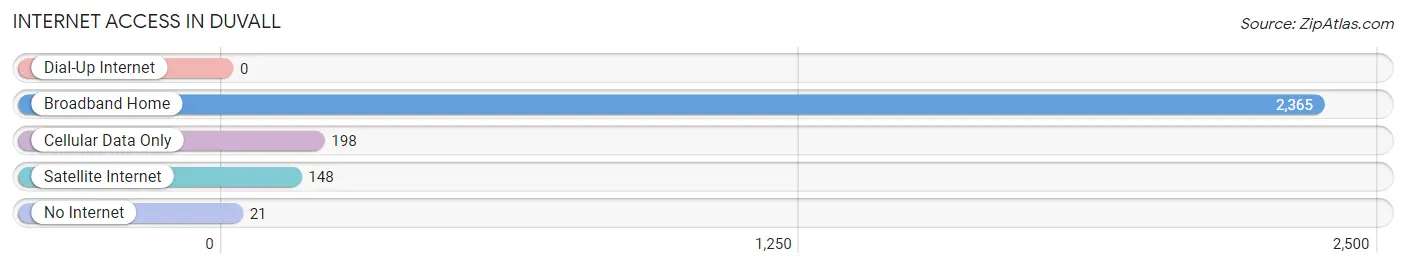
| Internet Type | # Households | % Households |
| Dial-Up Internet | 0 | 0.0% |
| Broadband Home | 2,365 | 91.5% |
| Cellular Data Only | 198 | 7.7% |
| Satellite Internet | 148 | 5.7% |
| No Internet | 21 | 0.8% |
| Total | 2,584 | 100.0% |
Duvall Summary
Duvall, Washington is a small city located in King County, Washington, United States. It is situated in the foothills of the Cascade Mountains, approximately 25 miles northeast of Seattle. The city was founded in 1889 and incorporated in 1908. As of the 2010 census, the population of Duvall was 7,674.
History
The area that is now Duvall was originally inhabited by the Snoqualmie people, who lived in the area for thousands of years before the arrival of European settlers. The first European settlers arrived in the area in the late 1800s, and the town of Duvall was officially founded in 1889. The town was named after William Duvall, a local pioneer who had settled in the area in 1871.
In 1908, Duvall was officially incorporated as a city. The city was initially a logging and farming community, but in the 1950s, the population began to grow as people moved to the area from Seattle and other nearby cities. The population continued to grow throughout the 1960s and 1970s, and by the 1980s, Duvall had become a bedroom community for Seattle.
Geography
Duvall is located in King County, Washington, approximately 25 miles northeast of Seattle. The city is situated in the foothills of the Cascade Mountains, and is surrounded by forests and rolling hills. The Snoqualmie River runs through the city, and the nearby Snoqualmie Valley is a popular destination for outdoor recreation.
The climate in Duvall is mild and temperate, with warm summers and cool winters. The average annual temperature is around 50 degrees Fahrenheit, and the average annual precipitation is around 40 inches.
Economy
The economy of Duvall is largely based on agriculture and tourism. The city is home to several farms, which produce a variety of crops, including apples, cherries, and vegetables. The nearby Snoqualmie Valley is a popular destination for outdoor recreation, and the city is home to several wineries and breweries.
The city is also home to several small businesses, including restaurants, retail stores, and professional services. The city is served by several major highways, and is located near several major cities, including Seattle, Bellevue, and Redmond.
Demographics
As of the 2010 census, the population of Duvall was 7,674. The population is predominantly white (90.2%), with smaller percentages of Asian (3.3%), African American (1.2%), and Hispanic or Latino (2.2%) residents. The median household income is $90,845, and the median home value is $521,400.
The city is served by the Northshore School District, which includes five elementary schools, two middle schools, and one high school. The city is also home to several private schools, including a Montessori school and a Christian school.
Conclusion
Duvall, Washington is a small city located in King County, Washington, United States. It is situated in the foothills of the Cascade Mountains, approximately 25 miles northeast of Seattle. The city was founded in 1889 and incorporated in 1908. As of the 2010 census, the population of Duvall was 7,674. The economy of Duvall is largely based on agriculture and tourism, and the population is predominantly white. The city is served by the Northshore School District, and is home to several small businesses, farms, wineries, and breweries.
Common Questions
What is Per Capita Income in Duvall?
Per Capita income in Duvall is $60,634.
What is the Median Family Income in Duvall?
Median Family Income in Duvall is $182,513.
What is the Median Household income in Duvall?
Median Household Income in Duvall is $168,663.
What is Income or Wage Gap in Duvall?
Income or Wage Gap in Duvall is 62.5%.
Women in Duvall earn 37.5 cents for every dollar earned by a man.
What is Inequality or Gini Index in Duvall?
Inequality or Gini Index in Duvall is 0.35.
What is the Total Population of Duvall?
Total Population of Duvall is 8,128.
What is the Total Male Population of Duvall?
Total Male Population of Duvall is 3,867.
What is the Total Female Population of Duvall?
Total Female Population of Duvall is 4,261.
What is the Ratio of Males per 100 Females in Duvall?
There are 90.75 Males per 100 Females in Duvall.
What is the Ratio of Females per 100 Males in Duvall?
There are 110.19 Females per 100 Males in Duvall.
What is the Median Population Age in Duvall?
Median Population Age in Duvall is 35.4 Years.
What is the Average Family Size in Duvall
Average Family Size in Duvall is 3.5 People.
What is the Average Household Size in Duvall
Average Household Size in Duvall is 3.1 People.
How Large is the Labor Force in Duvall?
There are 4,240 People in the Labor Forcein in Duvall.
What is the Percentage of People in the Labor Force in Duvall?
72.2% of People are in the Labor Force in Duvall.
What is the Unemployment Rate in Duvall?
Unemployment Rate in Duvall is 4.3%.