Davenport, WA Map & Demographics
Davenport Map
Davenport Overview
$30,297
PER CAPITA INCOME
$72,500
AVG FAMILY INCOME
$71,486
AVG HOUSEHOLD INCOME
19.3%
WAGE / INCOME GAP [ % ]
80.7¢/ $1
WAGE / INCOME GAP [ $ ]
0.37
INEQUALITY / GINI INDEX
1,850
TOTAL POPULATION
928
MALE POPULATION
922
FEMALE POPULATION
100.65
MALES / 100 FEMALES
99.35
FEMALES / 100 MALES
36.2
MEDIAN AGE
3.3
AVG FAMILY SIZE
2.7
AVG HOUSEHOLD SIZE
779
LABOR FORCE [ PEOPLE ]
54.6%
PERCENT IN LABOR FORCE
5.6%
UNEMPLOYMENT RATE
Davenport Zip Codes
Davenport Area Codes
Income in Davenport
Income Overview in Davenport
Per Capita Income in Davenport is $30,297, while median incomes of families and households are $72,500 and $71,486 respectively.
| Characteristic | Number | Measure |
| Per Capita Income | 1,850 | $30,297 |
| Median Family Income | 458 | $72,500 |
| Mean Family Income | 458 | $90,338 |
| Median Household Income | 683 | $71,486 |
| Mean Household Income | 683 | $79,112 |
| Income Deficit | 458 | $0 |
| Wage / Income Gap (%) | 1,850 | 19.29% |
| Wage / Income Gap ($) | 1,850 | 80.71¢ per $1 |
| Gini / Inequality Index | 1,850 | 0.37 |
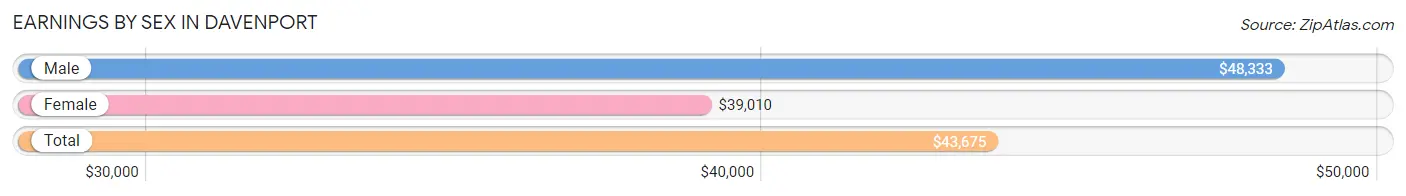
Earnings by Sex in Davenport
Average Earnings in Davenport are $43,675, $48,333 for men and $39,010 for women, a difference of 19.3%.
| Sex | Number | Average Earnings |
| Male | 456 (54.6%) | $48,333 |
| Female | 379 (45.4%) | $39,010 |
| Total | 835 (100.0%) | $43,675 |
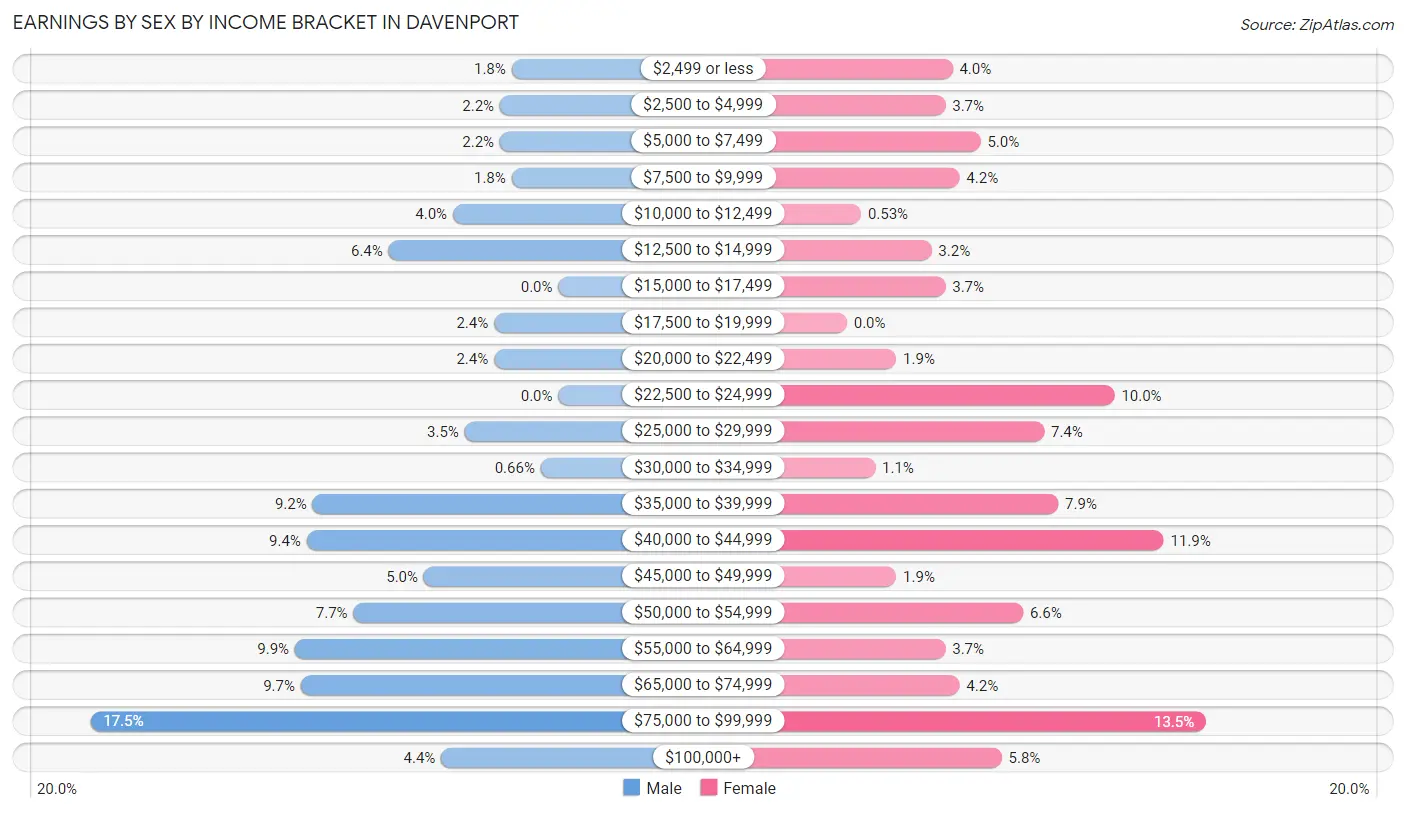
Earnings by Sex by Income Bracket in Davenport
The most common earnings brackets in Davenport are $75,000 to $99,999 for men (80 | 17.5%) and $75,000 to $99,999 for women (51 | 13.5%).
| Income | Male | Female |
| $2,499 or less | 8 (1.8%) | 15 (4.0%) |
| $2,500 to $4,999 | 10 (2.2%) | 14 (3.7%) |
| $5,000 to $7,499 | 10 (2.2%) | 19 (5.0%) |
| $7,500 to $9,999 | 8 (1.8%) | 16 (4.2%) |
| $10,000 to $12,499 | 18 (4.0%) | 2 (0.5%) |
| $12,500 to $14,999 | 29 (6.4%) | 12 (3.2%) |
| $15,000 to $17,499 | 0 (0.0%) | 14 (3.7%) |
| $17,500 to $19,999 | 11 (2.4%) | 0 (0.0%) |
| $20,000 to $22,499 | 11 (2.4%) | 7 (1.8%) |
| $22,500 to $24,999 | 0 (0.0%) | 38 (10.0%) |
| $25,000 to $29,999 | 16 (3.5%) | 28 (7.4%) |
| $30,000 to $34,999 | 3 (0.7%) | 4 (1.1%) |
| $35,000 to $39,999 | 42 (9.2%) | 30 (7.9%) |
| $40,000 to $44,999 | 43 (9.4%) | 45 (11.9%) |
| $45,000 to $49,999 | 23 (5.0%) | 7 (1.8%) |
| $50,000 to $54,999 | 35 (7.7%) | 25 (6.6%) |
| $55,000 to $64,999 | 45 (9.9%) | 14 (3.7%) |
| $65,000 to $74,999 | 44 (9.7%) | 16 (4.2%) |
| $75,000 to $99,999 | 80 (17.5%) | 51 (13.5%) |
| $100,000+ | 20 (4.4%) | 22 (5.8%) |
| Total | 456 (100.0%) | 379 (100.0%) |
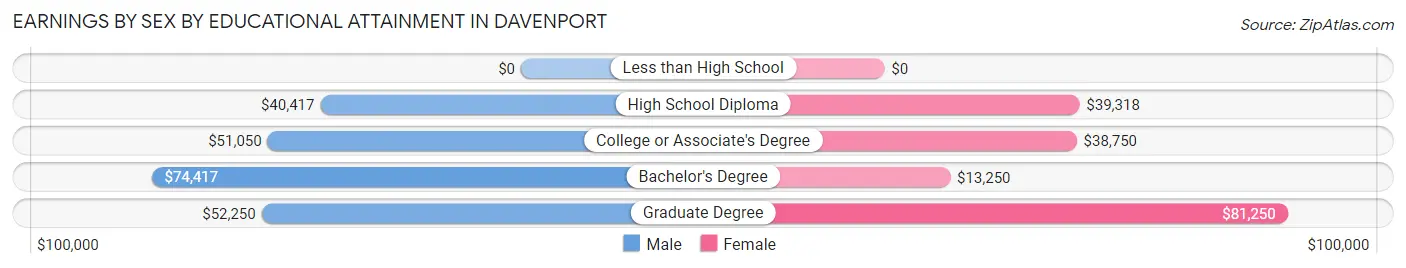
Earnings by Sex by Educational Attainment in Davenport
Average earnings in Davenport are $50,536 for men and $42,768 for women, a difference of 15.4%. Men with an educational attainment of bachelor's degree enjoy the highest average annual earnings of $74,417, while those with high school diploma education earn the least with $40,417. Women with an educational attainment of graduate degree earn the most with the average annual earnings of $81,250, while those with bachelor's degree education have the smallest earnings of $13,250.
| Educational Attainment | Male Income | Female Income |
| Less than High School | - | - |
| High School Diploma | $40,417 | $39,318 |
| College or Associate's Degree | $51,050 | $38,750 |
| Bachelor's Degree | $74,417 | $13,250 |
| Graduate Degree | $52,250 | $81,250 |
| Total | $50,536 | $42,768 |
Family Income in Davenport
Family Income Brackets in Davenport
According to the Davenport family income data, there are 132 families falling into the $50,000 to $74,999 income range, which is the most common income bracket and makes up 28.8% of all families.
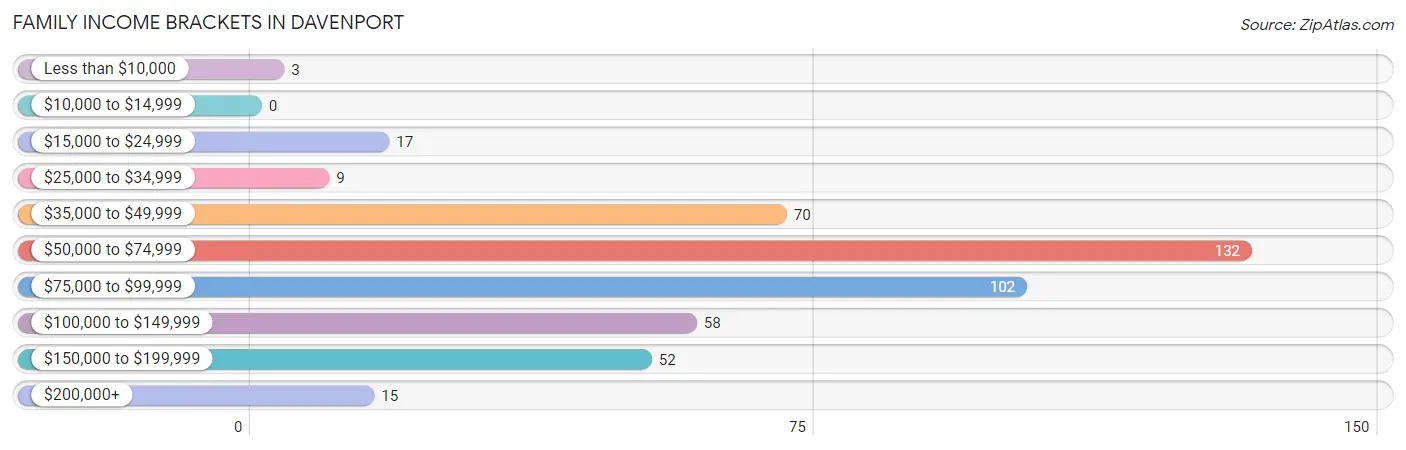
| Income Bracket | # Families | % Families |
| Less than $10,000 | 3 | 0.7% |
| $10,000 to $14,999 | 0 | 0.0% |
| $15,000 to $24,999 | 17 | 3.7% |
| $25,000 to $34,999 | 9 | 2.0% |
| $35,000 to $49,999 | 70 | 15.3% |
| $50,000 to $74,999 | 132 | 28.8% |
| $75,000 to $99,999 | 102 | 22.3% |
| $100,000 to $149,999 | 58 | 12.7% |
| $150,000 to $199,999 | 52 | 11.4% |
| $200,000+ | 15 | 3.3% |
Family Income by Famaliy Size in Davenport
4-person families (63 | 13.8%) account for the highest median family income in Davenport with $111,563 per family, while 2-person families (200 | 43.7%) have the highest median income of $35,357 per family member.
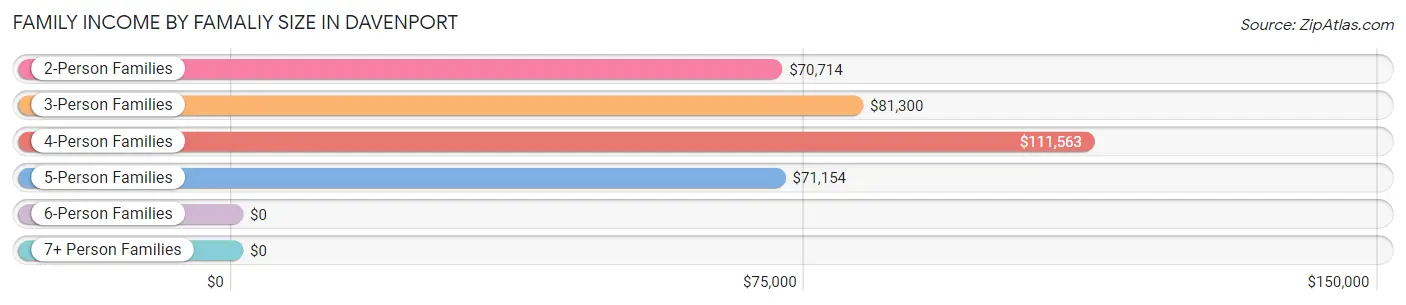
| Income Bracket | # Families | Median Income |
| 2-Person Families | 200 (43.7%) | $70,714 |
| 3-Person Families | 102 (22.3%) | $81,300 |
| 4-Person Families | 63 (13.8%) | $111,563 |
| 5-Person Families | 62 (13.5%) | $71,154 |
| 6-Person Families | 20 (4.4%) | $0 |
| 7+ Person Families | 11 (2.4%) | $0 |
| Total | 458 (100.0%) | $72,500 |
Family Income by Number of Earners in Davenport
The median family income in Davenport is $72,500, with families comprising 3+ earners (35) having the highest median family income of $119,327, while families with no earners (75) have the lowest median family income of $64,375, accounting for 7.6% and 16.4% of families, respectively.
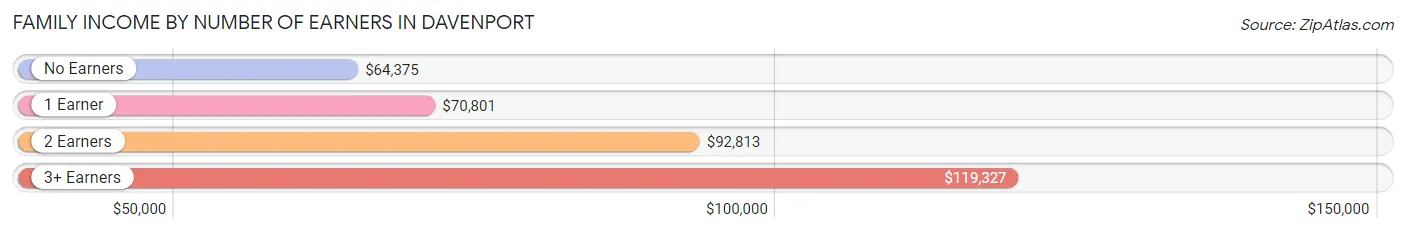
| Number of Earners | # Families | Median Income |
| No Earners | 75 (16.4%) | $64,375 |
| 1 Earner | 173 (37.8%) | $70,801 |
| 2 Earners | 175 (38.2%) | $92,813 |
| 3+ Earners | 35 (7.6%) | $119,327 |
| Total | 458 (100.0%) | $72,500 |
Household Income in Davenport
Household Income Brackets in Davenport
With 161 households falling in the category, the $75,000 to $99,999 income range is the most frequent in Davenport, accounting for 23.6% of all households. In contrast, only 15 households (2.2%) fall into the $200,000+ income bracket, making it the least populous group.
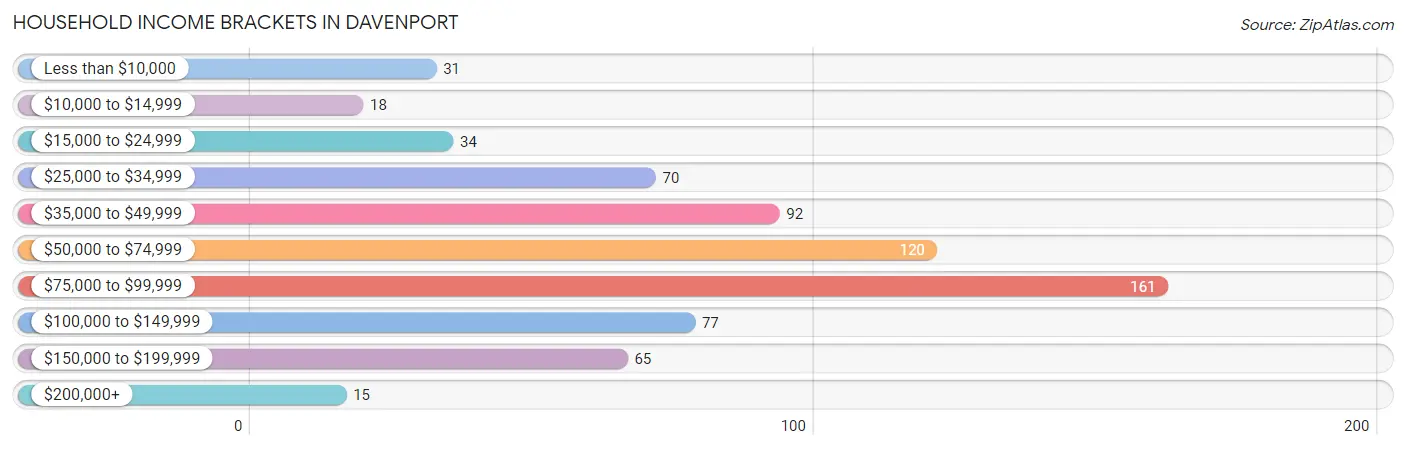
| Income Bracket | # Households | % Households |
| Less than $10,000 | 31 | 4.5% |
| $10,000 to $14,999 | 18 | 2.6% |
| $15,000 to $24,999 | 34 | 5.0% |
| $25,000 to $34,999 | 70 | 10.2% |
| $35,000 to $49,999 | 92 | 13.5% |
| $50,000 to $74,999 | 120 | 17.6% |
| $75,000 to $99,999 | 161 | 23.6% |
| $100,000 to $149,999 | 77 | 11.3% |
| $150,000 to $199,999 | 65 | 9.5% |
| $200,000+ | 15 | 2.2% |
Household Income by Householder Age in Davenport
The median household income in Davenport is $71,486, with the highest median household income of $86,750 found in the 45 to 64 years age bracket for the primary householder. A total of 202 households (29.6%) fall into this category. Meanwhile, the 65+ years age bracket for the primary householder has the lowest median household income of $50,288, with 209 households (30.6%) in this group.
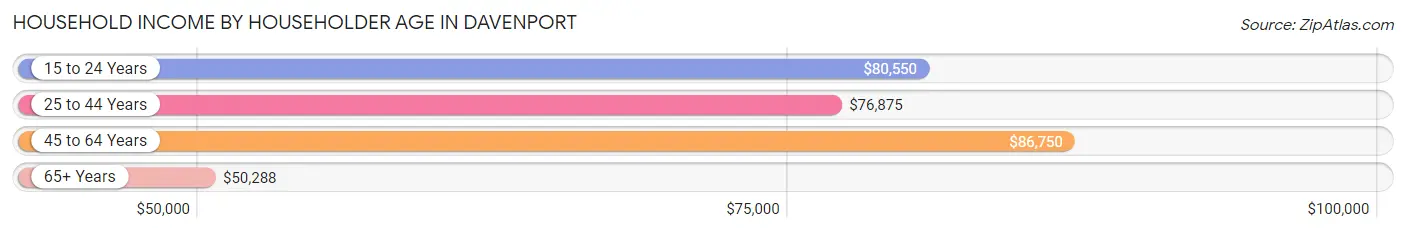
| Income Bracket | # Households | Median Income |
| 15 to 24 Years | 79 (11.6%) | $80,550 |
| 25 to 44 Years | 193 (28.3%) | $76,875 |
| 45 to 64 Years | 202 (29.6%) | $86,750 |
| 65+ Years | 209 (30.6%) | $50,288 |
| Total | 683 (100.0%) | $71,486 |
Poverty in Davenport
Income Below Poverty by Sex and Age in Davenport
With 10.5% poverty level for males and 8.8% for females among the residents of Davenport, 15 year old males and 75 year old and over females are the most vulnerable to poverty, with 9 males (52.9%) and 13 females (19.4%) in their respective age groups living below the poverty level.
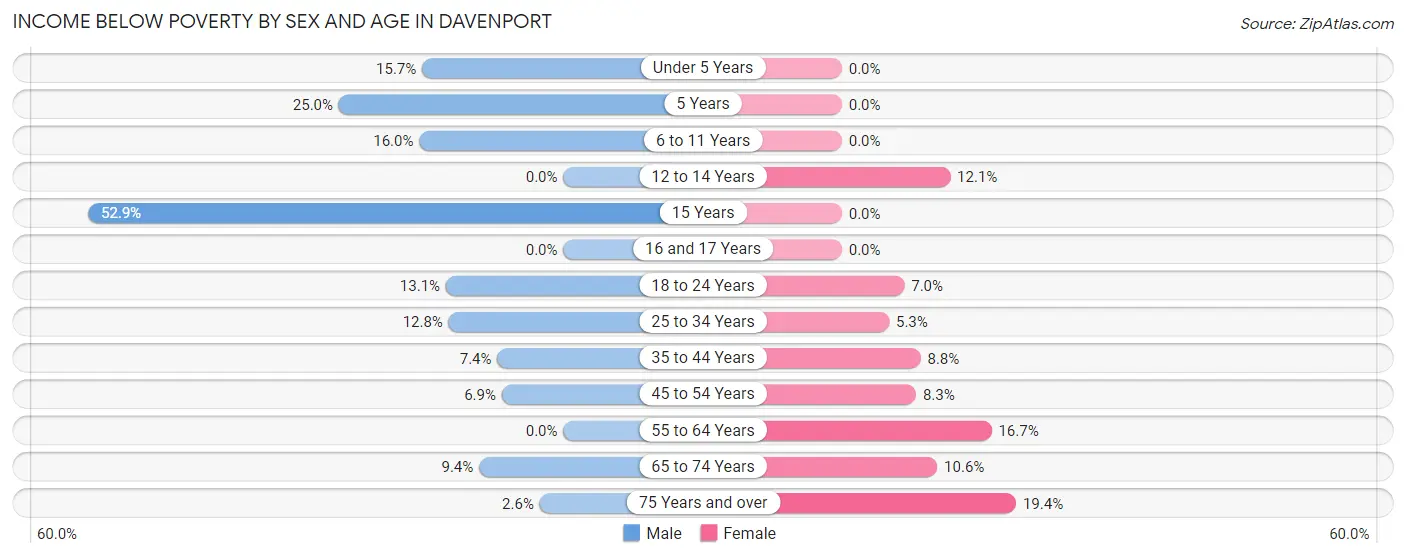
| Age Bracket | Male | Female |
| Under 5 Years | 14 (15.7%) | 0 (0.0%) |
| 5 Years | 4 (25.0%) | 0 (0.0%) |
| 6 to 11 Years | 17 (16.0%) | 0 (0.0%) |
| 12 to 14 Years | 0 (0.0%) | 7 (12.1%) |
| 15 Years | 9 (52.9%) | 0 (0.0%) |
| 16 and 17 Years | 0 (0.0%) | 0 (0.0%) |
| 18 to 24 Years | 17 (13.1%) | 8 (7.0%) |
| 25 to 34 Years | 6 (12.8%) | 5 (5.3%) |
| 35 to 44 Years | 10 (7.3%) | 10 (8.8%) |
| 45 to 54 Years | 5 (6.9%) | 10 (8.3%) |
| 55 to 64 Years | 0 (0.0%) | 16 (16.7%) |
| 65 to 74 Years | 12 (9.4%) | 12 (10.6%) |
| 75 Years and over | 1 (2.6%) | 13 (19.4%) |
| Total | 95 (10.5%) | 81 (8.8%) |
Income Above Poverty by Sex and Age in Davenport
According to the poverty statistics in Davenport, males aged 12 to 14 years and females aged under 5 years are the age groups that are most secure financially, with 100.0% of males and 100.0% of females in these age groups living above the poverty line.
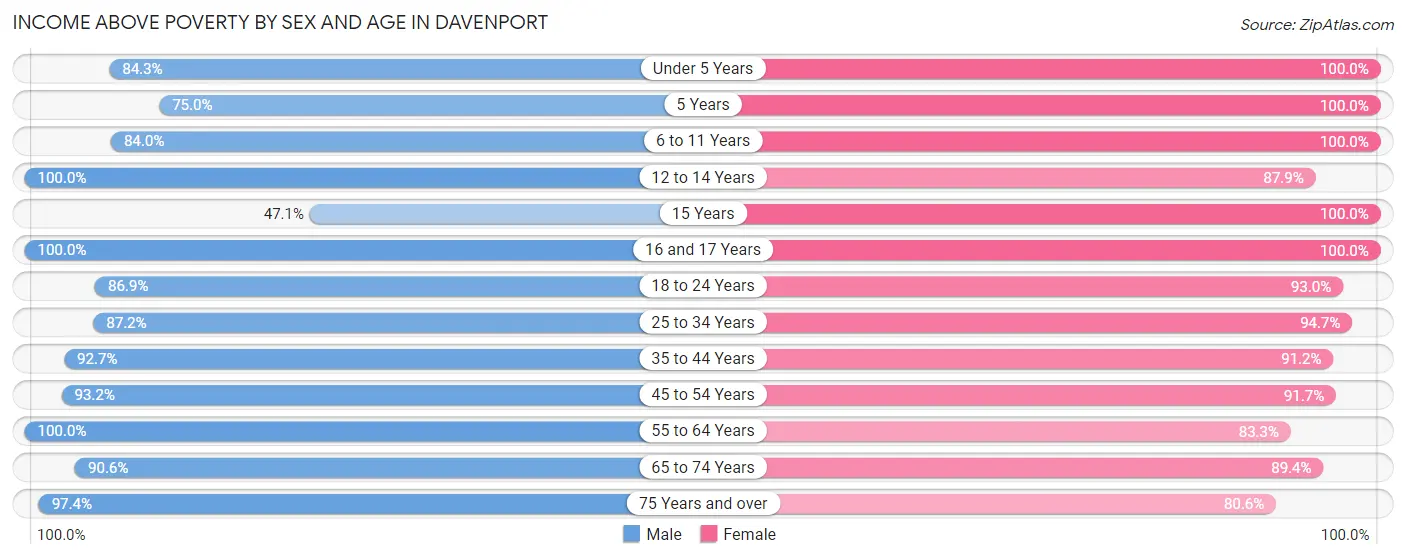
| Age Bracket | Male | Female |
| Under 5 Years | 75 (84.3%) | 76 (100.0%) |
| 5 Years | 12 (75.0%) | 6 (100.0%) |
| 6 to 11 Years | 89 (84.0%) | 28 (100.0%) |
| 12 to 14 Years | 17 (100.0%) | 51 (87.9%) |
| 15 Years | 8 (47.1%) | 10 (100.0%) |
| 16 and 17 Years | 40 (100.0%) | 23 (100.0%) |
| 18 to 24 Years | 113 (86.9%) | 107 (93.0%) |
| 25 to 34 Years | 41 (87.2%) | 90 (94.7%) |
| 35 to 44 Years | 126 (92.6%) | 104 (91.2%) |
| 45 to 54 Years | 68 (93.1%) | 111 (91.7%) |
| 55 to 64 Years | 65 (100.0%) | 80 (83.3%) |
| 65 to 74 Years | 116 (90.6%) | 101 (89.4%) |
| 75 Years and over | 37 (97.4%) | 54 (80.6%) |
| Total | 807 (89.5%) | 841 (91.2%) |
Income Below Poverty Among Married-Couple Families in Davenport
The poverty statistics for married-couple families in Davenport show that 1.7% or 7 of the total 411 families live below the poverty line. Families with no children have the highest poverty rate of 2.3%, comprising of 5 families. On the other hand, families with 3 or 4 children have the lowest poverty rate of 0.0%, which includes 0 families.
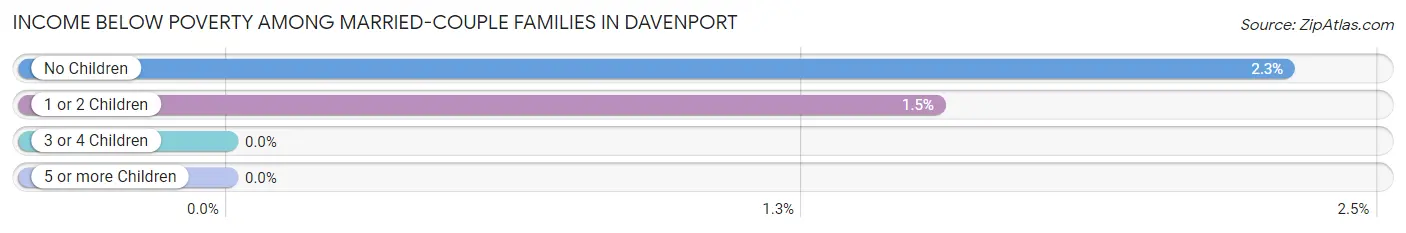
| Children | Above Poverty | Below Poverty |
| No Children | 212 (97.7%) | 5 (2.3%) |
| 1 or 2 Children | 128 (98.5%) | 2 (1.5%) |
| 3 or 4 Children | 53 (100.0%) | 0 (0.0%) |
| 5 or more Children | 11 (100.0%) | 0 (0.0%) |
| Total | 404 (98.3%) | 7 (1.7%) |
Income Below Poverty Among Single-Parent Households in Davenport
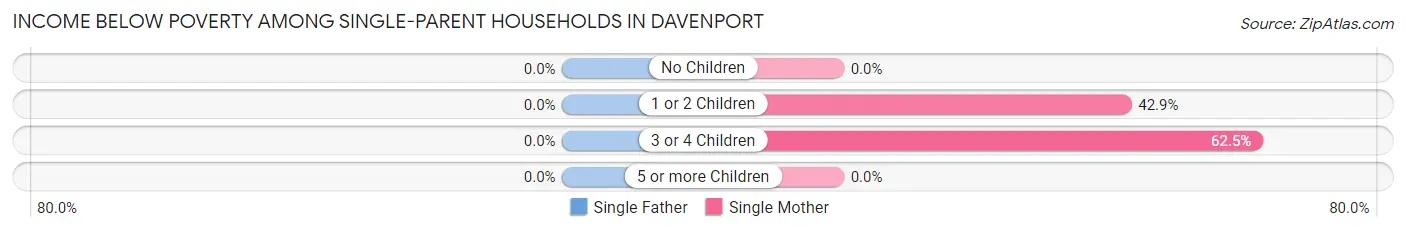
| Children | Single Father | Single Mother |
| No Children | 0 (0.0%) | 0 (0.0%) |
| 1 or 2 Children | 0 (0.0%) | 3 (42.9%) |
| 3 or 4 Children | 0 (0.0%) | 10 (62.5%) |
| 5 or more Children | 0 (0.0%) | 0 (0.0%) |
| Total | 0 (0.0%) | 13 (28.3%) |
Income Below Poverty Among Married-Couple vs Single-Parent Households in Davenport
The poverty data for Davenport shows that 7 of the married-couple family households (1.7%) and 13 of the single-parent households (27.7%) are living below the poverty level. Within the married-couple family households, those with no children have the highest poverty rate, with 5 households (2.3%) falling below the poverty line. Among the single-parent households, those with 3 or 4 children have the highest poverty rate, with 10 household (62.5%) living below poverty.
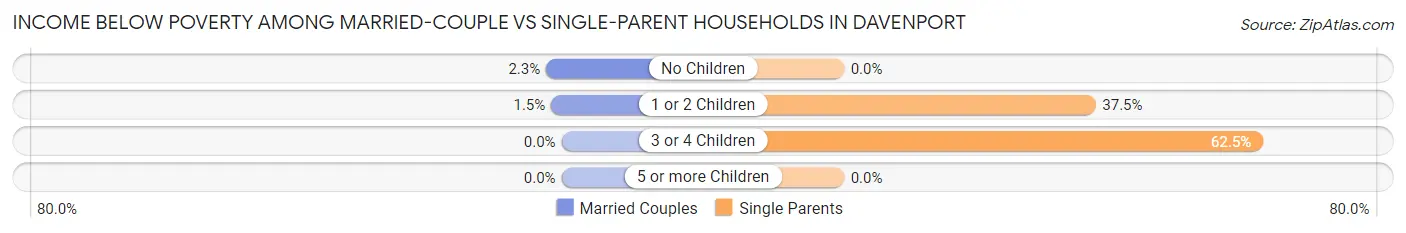
| Children | Married-Couple Families | Single-Parent Households |
| No Children | 5 (2.3%) | 0 (0.0%) |
| 1 or 2 Children | 2 (1.5%) | 3 (37.5%) |
| 3 or 4 Children | 0 (0.0%) | 10 (62.5%) |
| 5 or more Children | 0 (0.0%) | 0 (0.0%) |
| Total | 7 (1.7%) | 13 (27.7%) |
Race in Davenport
The most populous races in Davenport are White / Caucasian (1,632 | 88.2%), Hispanic or Latino (125 | 6.8%), and Two or more Races (102 | 5.5%).
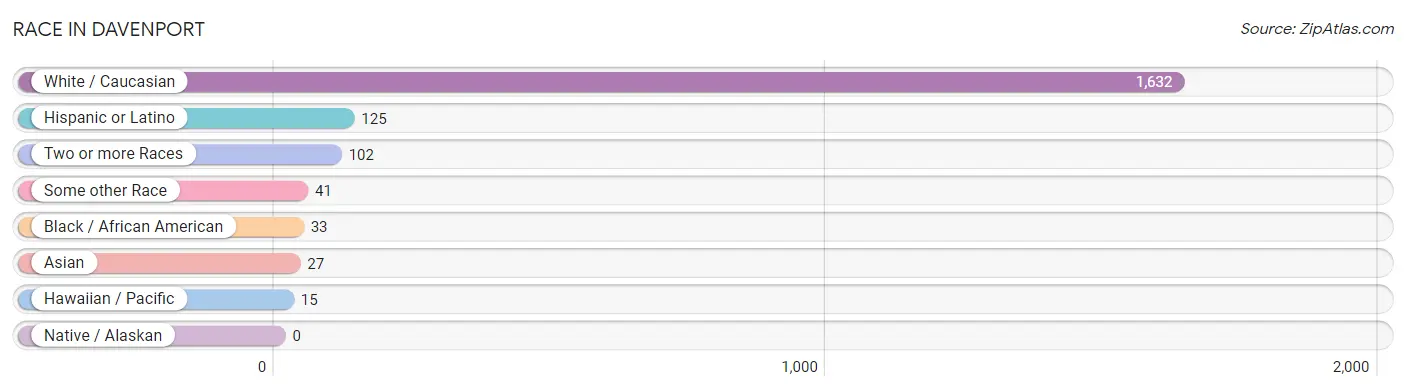
| Race | # Population | % Population |
| Asian | 27 | 1.5% |
| Black / African American | 33 | 1.8% |
| Hawaiian / Pacific | 15 | 0.8% |
| Hispanic or Latino | 125 | 6.8% |
| Native / Alaskan | 0 | 0.0% |
| White / Caucasian | 1,632 | 88.2% |
| Two or more Races | 102 | 5.5% |
| Some other Race | 41 | 2.2% |
| Total | 1,850 | 100.0% |
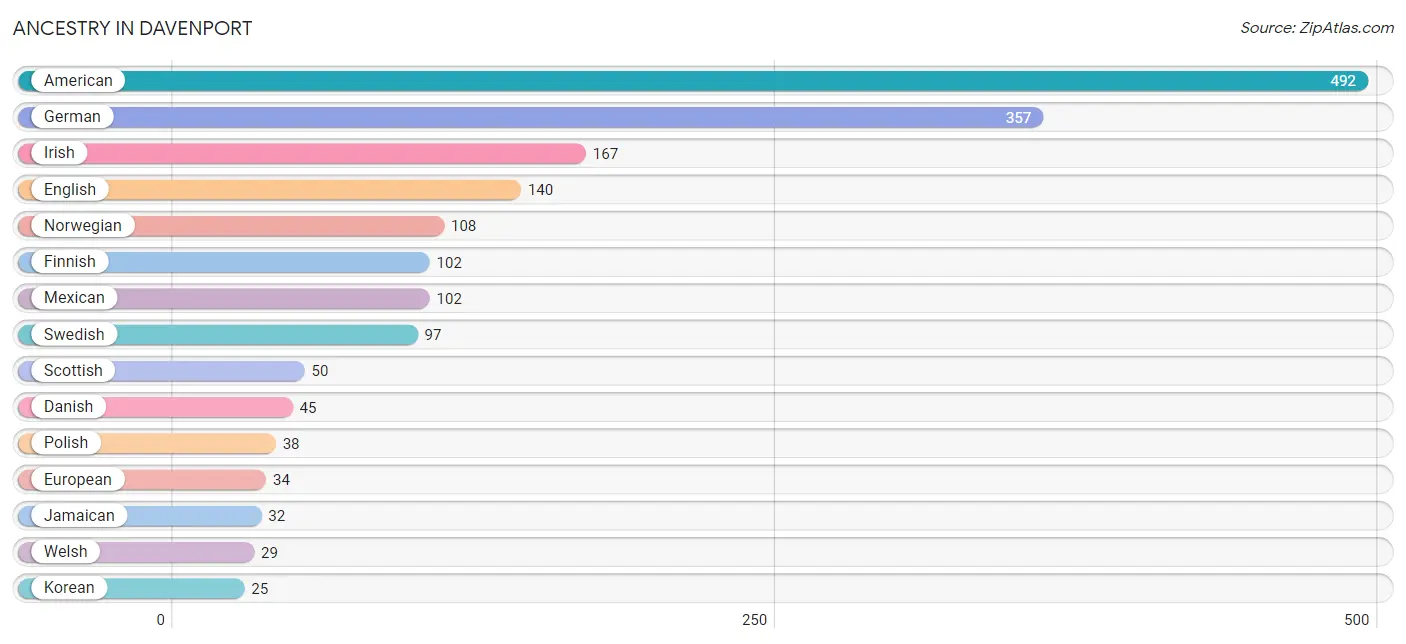
Ancestry in Davenport
The most populous ancestries reported in Davenport are American (492 | 26.6%), German (357 | 19.3%), Irish (167 | 9.0%), English (140 | 7.6%), and Norwegian (108 | 5.8%), together accounting for 68.3% of all Davenport residents.
| Ancestry | # Population | % Population |
| American | 492 | 26.6% |
| Arab | 2 | 0.1% |
| Bhutanese | 14 | 0.8% |
| Cherokee | 4 | 0.2% |
| Colville | 6 | 0.3% |
| Danish | 45 | 2.4% |
| Dominican | 23 | 1.2% |
| Dutch | 16 | 0.9% |
| English | 140 | 7.6% |
| European | 34 | 1.8% |
| Finnish | 102 | 5.5% |
| French | 5 | 0.3% |
| French Canadian | 6 | 0.3% |
| German | 357 | 19.3% |
| Greek | 12 | 0.6% |
| Haitian | 8 | 0.4% |
| Hungarian | 5 | 0.3% |
| Irish | 167 | 9.0% |
| Italian | 6 | 0.3% |
| Jamaican | 32 | 1.7% |
| Korean | 25 | 1.3% |
| Lithuanian | 4 | 0.2% |
| Mexican | 102 | 5.5% |
| Mexican American Indian | 2 | 0.1% |
| Native Hawaiian | 21 | 1.1% |
| Norwegian | 108 | 5.8% |
| Pennsylvania German | 6 | 0.3% |
| Polish | 38 | 2.1% |
| Russian | 2 | 0.1% |
| Samoan | 15 | 0.8% |
| Scandinavian | 24 | 1.3% |
| Scotch-Irish | 10 | 0.5% |
| Scottish | 50 | 2.7% |
| Swedish | 97 | 5.2% |
| Syrian | 2 | 0.1% |
| Thai | 1 | 0.1% |
| Welsh | 29 | 1.6% |
| Yugoslavian | 1 | 0.1% | View All 38 Rows |
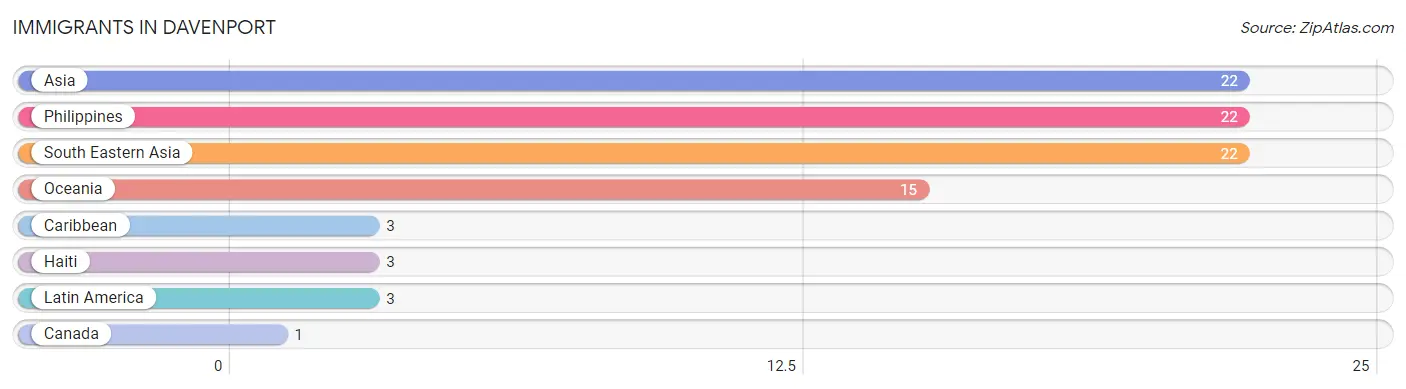
Immigrants in Davenport
The most numerous immigrant groups reported in Davenport came from Asia (22 | 1.2%), Philippines (22 | 1.2%), South Eastern Asia (22 | 1.2%), Oceania (15 | 0.8%), and Caribbean (3 | 0.2%), together accounting for 4.5% of all Davenport residents.
| Immigration Origin | # Population | % Population |
| Asia | 22 | 1.2% |
| Canada | 1 | 0.1% |
| Caribbean | 3 | 0.2% |
| Haiti | 3 | 0.2% |
| Latin America | 3 | 0.2% |
| Oceania | 15 | 0.8% |
| Philippines | 22 | 1.2% |
| South Eastern Asia | 22 | 1.2% | View All 8 Rows |
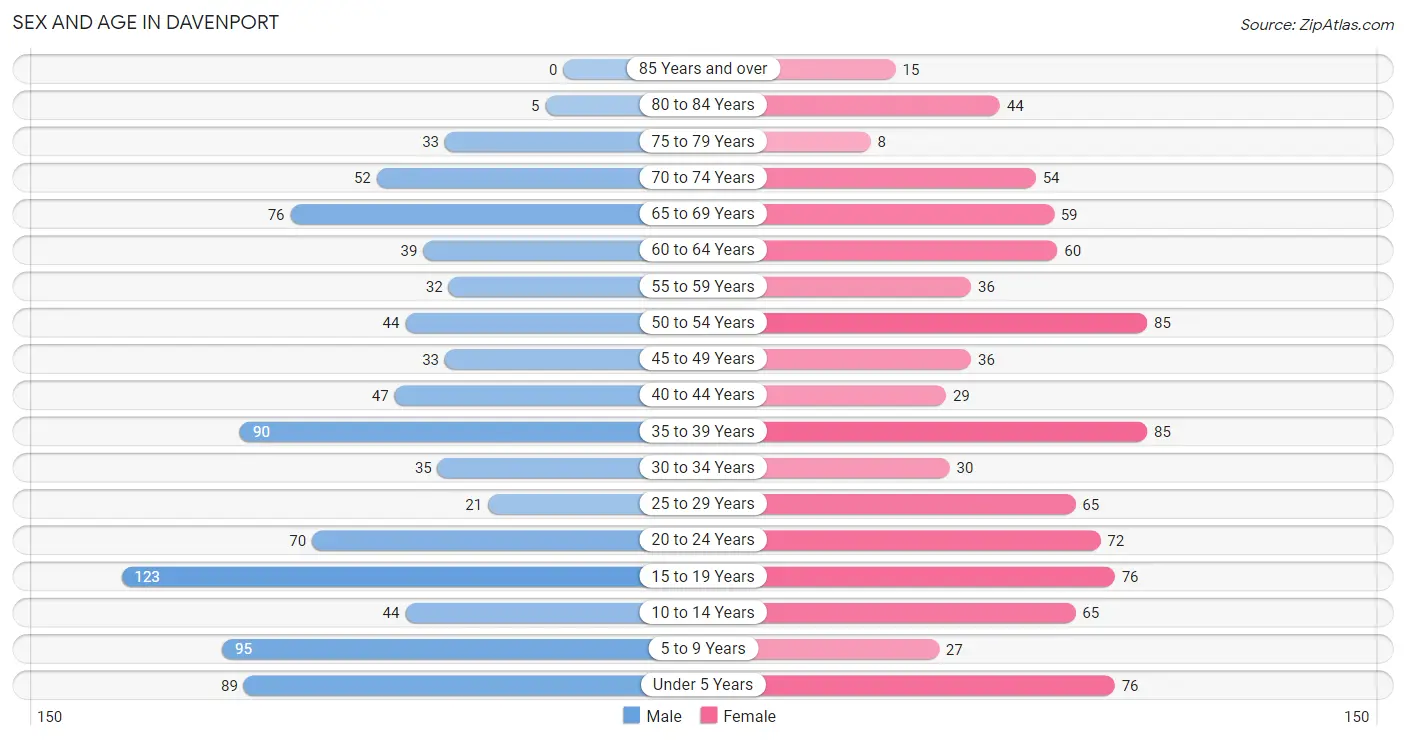
Sex and Age in Davenport
Sex and Age in Davenport
The most populous age groups in Davenport are 15 to 19 Years (123 | 13.3%) for men and 35 to 39 Years (85 | 9.2%) for women.
| Age Bracket | Male | Female |
| Under 5 Years | 89 (9.6%) | 76 (8.2%) |
| 5 to 9 Years | 95 (10.2%) | 27 (2.9%) |
| 10 to 14 Years | 44 (4.7%) | 65 (7.0%) |
| 15 to 19 Years | 123 (13.3%) | 76 (8.2%) |
| 20 to 24 Years | 70 (7.5%) | 72 (7.8%) |
| 25 to 29 Years | 21 (2.3%) | 65 (7.0%) |
| 30 to 34 Years | 35 (3.8%) | 30 (3.3%) |
| 35 to 39 Years | 90 (9.7%) | 85 (9.2%) |
| 40 to 44 Years | 47 (5.1%) | 29 (3.2%) |
| 45 to 49 Years | 33 (3.6%) | 36 (3.9%) |
| 50 to 54 Years | 44 (4.7%) | 85 (9.2%) |
| 55 to 59 Years | 32 (3.5%) | 36 (3.9%) |
| 60 to 64 Years | 39 (4.2%) | 60 (6.5%) |
| 65 to 69 Years | 76 (8.2%) | 59 (6.4%) |
| 70 to 74 Years | 52 (5.6%) | 54 (5.9%) |
| 75 to 79 Years | 33 (3.6%) | 8 (0.9%) |
| 80 to 84 Years | 5 (0.5%) | 44 (4.8%) |
| 85 Years and over | 0 (0.0%) | 15 (1.6%) |
| Total | 928 (100.0%) | 922 (100.0%) |
Families and Households in Davenport
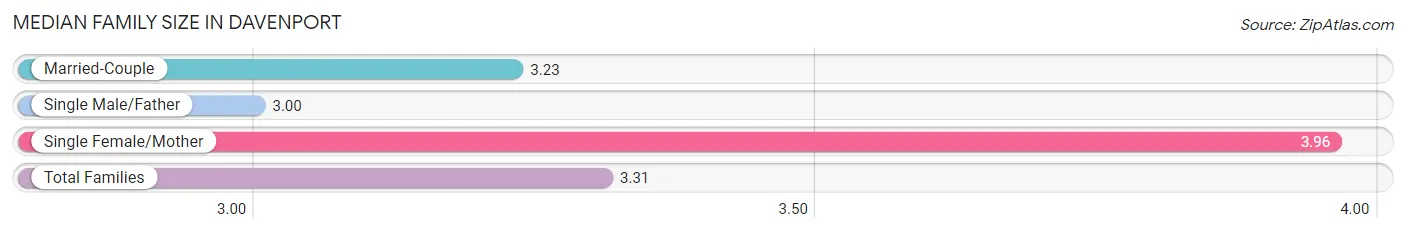
Median Family Size in Davenport
The median family size in Davenport is 3.31 persons per family, with single female/mother families (46 | 10.0%) accounting for the largest median family size of 3.96 persons per family. On the other hand, single male/father families (1 | 0.2%) represent the smallest median family size with 3.00 persons per family.
| Family Type | # Families | Family Size |
| Married-Couple | 411 (89.7%) | 3.23 |
| Single Male/Father | 1 (0.2%) | 3.00 |
| Single Female/Mother | 46 (10.0%) | 3.96 |
| Total Families | 458 (100.0%) | 3.31 |
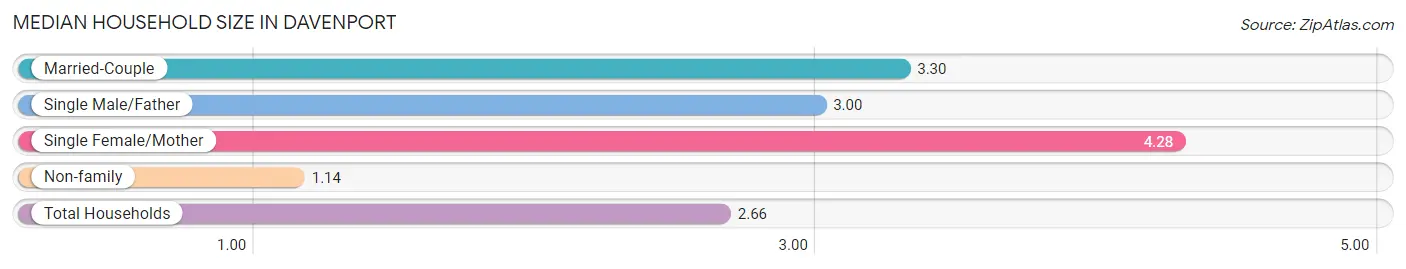
Median Household Size in Davenport
The median household size in Davenport is 2.66 persons per household, with single female/mother households (46 | 6.7%) accounting for the largest median household size of 4.28 persons per household. non-family households (225 | 32.9%) represent the smallest median household size with 1.14 persons per household.
| Household Type | # Households | Household Size |
| Married-Couple | 411 (60.2%) | 3.30 |
| Single Male/Father | 1 (0.2%) | 3.00 |
| Single Female/Mother | 46 (6.7%) | 4.28 |
| Non-family | 225 (32.9%) | 1.14 |
| Total Households | 683 (100.0%) | 2.66 |
Household Size by Marriage Status in Davenport
Out of a total of 683 households in Davenport, 458 (67.1%) are family households, while 225 (32.9%) are nonfamily households. The most numerous type of family households are 2-person households, comprising 200, and the most common type of nonfamily households are 1-person households, comprising 187.
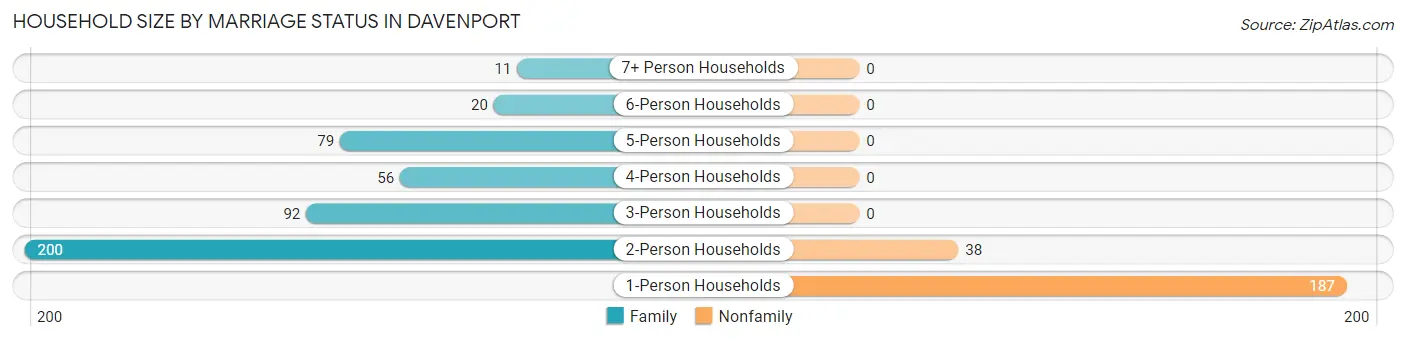
| Household Size | Family Households | Nonfamily Households |
| 1-Person Households | - | 187 (27.4%) |
| 2-Person Households | 200 (29.3%) | 38 (5.6%) |
| 3-Person Households | 92 (13.5%) | 0 (0.0%) |
| 4-Person Households | 56 (8.2%) | 0 (0.0%) |
| 5-Person Households | 79 (11.6%) | 0 (0.0%) |
| 6-Person Households | 20 (2.9%) | 0 (0.0%) |
| 7+ Person Households | 11 (1.6%) | 0 (0.0%) |
| Total | 458 (67.1%) | 225 (32.9%) |
Female Fertility in Davenport
Fertility by Age in Davenport
Average fertility rate in Davenport is 100.0 births per 1,000 women. Women in the age bracket of 20 to 34 years have the highest fertility rate with 174.0 births per 1,000 women. Women in the age bracket of 20 to 34 years acount for 70.7% of all women with births.
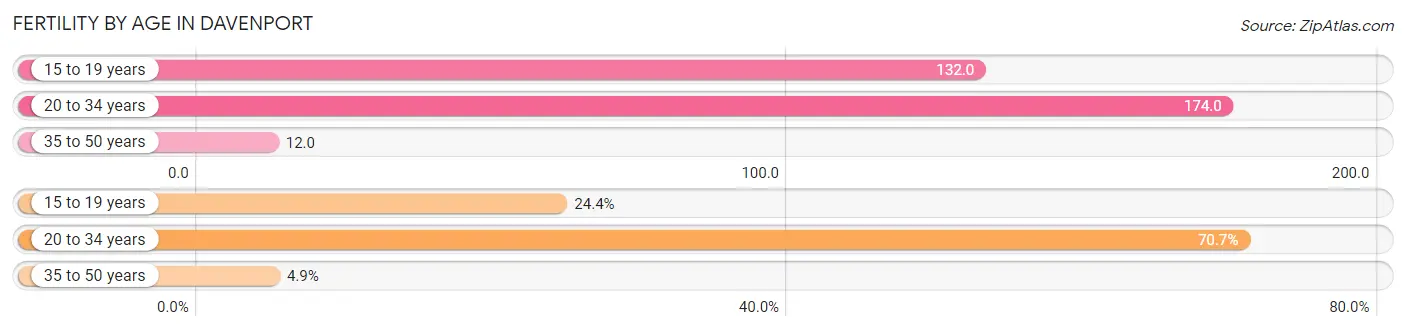
| Age Bracket | Women with Births | Births / 1,000 Women |
| 15 to 19 years | 10 (24.4%) | 132.0 |
| 20 to 34 years | 29 (70.7%) | 174.0 |
| 35 to 50 years | 2 (4.9%) | 12.0 |
| Total | 41 (100.0%) | 100.0 |
Fertility by Age by Marriage Status in Davenport
75.6% of women with births (41) in Davenport are married. The highest percentage of unmarried women with births falls into 15 to 19 years age bracket with 100.0% of them unmarried at the time of birth, while the lowest percentage of unmarried women with births belong to 20 to 34 years age bracket with 0.0% of them unmarried.
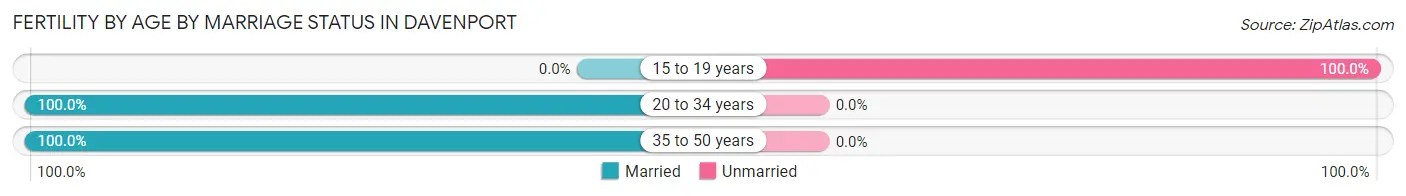
| Age Bracket | Married | Unmarried |
| 15 to 19 years | 0 (0.0%) | 10 (100.0%) |
| 20 to 34 years | 29 (100.0%) | 0 (0.0%) |
| 35 to 50 years | 2 (100.0%) | 0 (0.0%) |
| Total | 31 (75.6%) | 10 (24.4%) |
Fertility by Education in Davenport
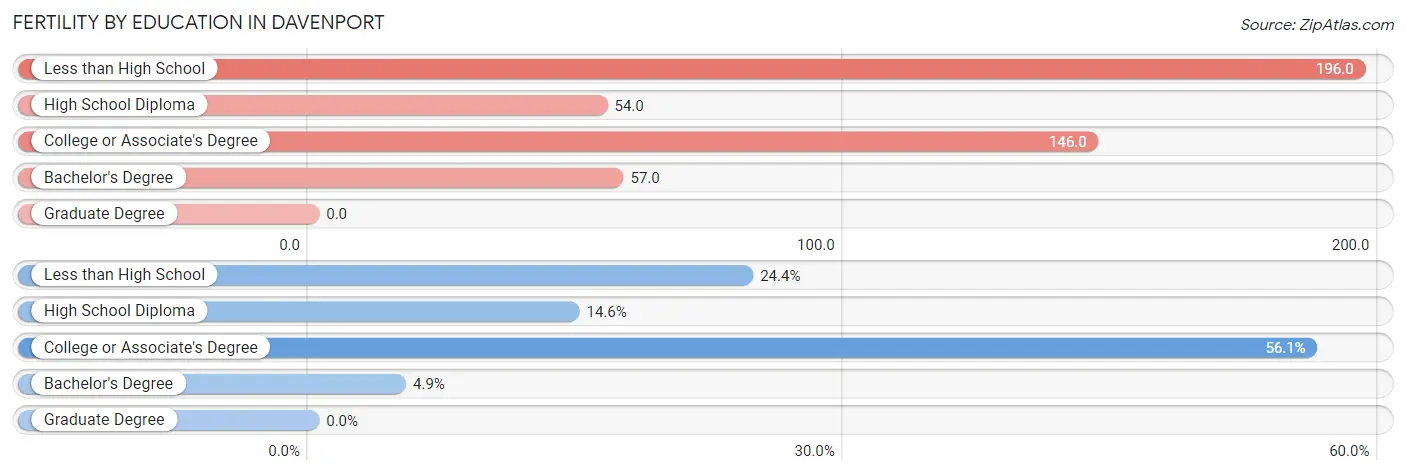
| Educational Attainment | Women with Births | Births / 1,000 Women |
| Less than High School | 10 (24.4%) | 196.0 |
| High School Diploma | 6 (14.6%) | 54.0 |
| College or Associate's Degree | 23 (56.1%) | 146.0 |
| Bachelor's Degree | 2 (4.9%) | 57.0 |
| Graduate Degree | 0 (0.0%) | 0.0 |
| Total | 41 (100.0%) | 100.0 |
Fertility by Education by Marriage Status in Davenport
24.4% of women with births in Davenport are unmarried. Women with the educational attainment of high school diploma are most likely to be married with 100.0% of them married at childbirth, while women with the educational attainment of less than high school are least likely to be married with 100.0% of them unmarried at childbirth.
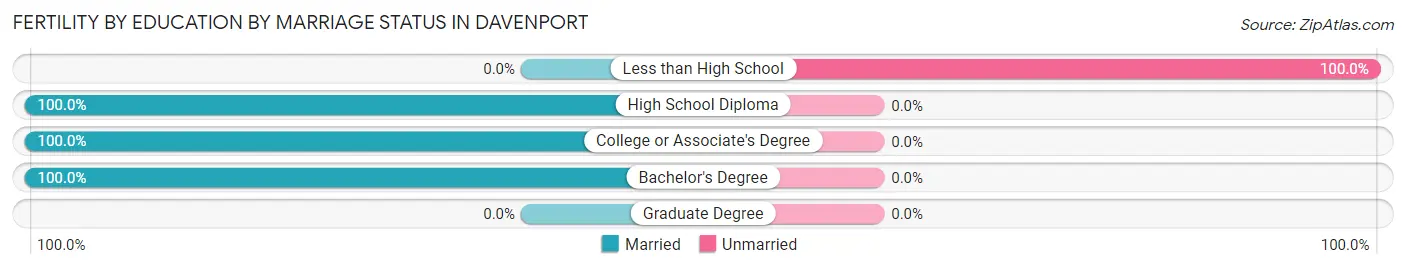
| Educational Attainment | Married | Unmarried |
| Less than High School | 0 (0.0%) | 10 (100.0%) |
| High School Diploma | 6 (100.0%) | 0 (0.0%) |
| College or Associate's Degree | 23 (100.0%) | 0 (0.0%) |
| Bachelor's Degree | 2 (100.0%) | 0 (0.0%) |
| Graduate Degree | 0 (0.0%) | 0 (0.0%) |
| Total | 31 (75.6%) | 10 (24.4%) |
Employment Characteristics in Davenport
Employment by Class of Employer in Davenport
Among the 696 employed individuals in Davenport, private company employees (362 | 52.0%), local government employees (116 | 16.7%), and not-for-profit organizations (103 | 14.8%) make up the most common classes of employment.
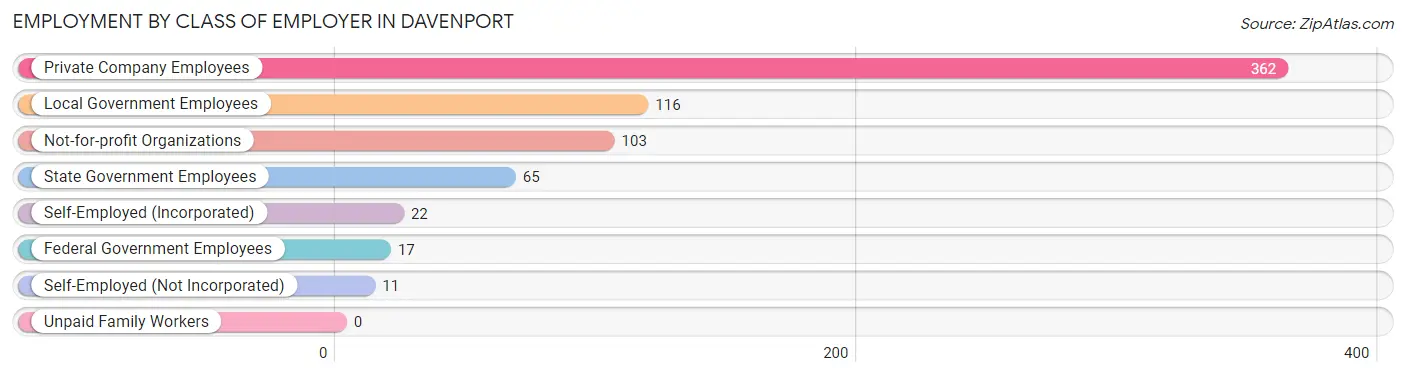
| Employer Class | # Employees | % Employees |
| Private Company Employees | 362 | 52.0% |
| Self-Employed (Incorporated) | 22 | 3.2% |
| Self-Employed (Not Incorporated) | 11 | 1.6% |
| Not-for-profit Organizations | 103 | 14.8% |
| Local Government Employees | 116 | 16.7% |
| State Government Employees | 65 | 9.3% |
| Federal Government Employees | 17 | 2.4% |
| Unpaid Family Workers | 0 | 0.0% |
| Total | 696 | 100.0% |
Employment Status by Age in Davenport
According to the labor force statistics for Davenport, out of the total population over 16 years of age (1,427), 54.6% or 779 individuals are in the labor force, with 5.6% or 44 of them unemployed. The age group with the highest labor force participation rate is 55 to 59 years, with 86.8% or 59 individuals in the labor force. Within the labor force, the 30 to 34 years age range has the highest percentage of unemployed individuals, with 23.2% or 13 of them being unemployed.
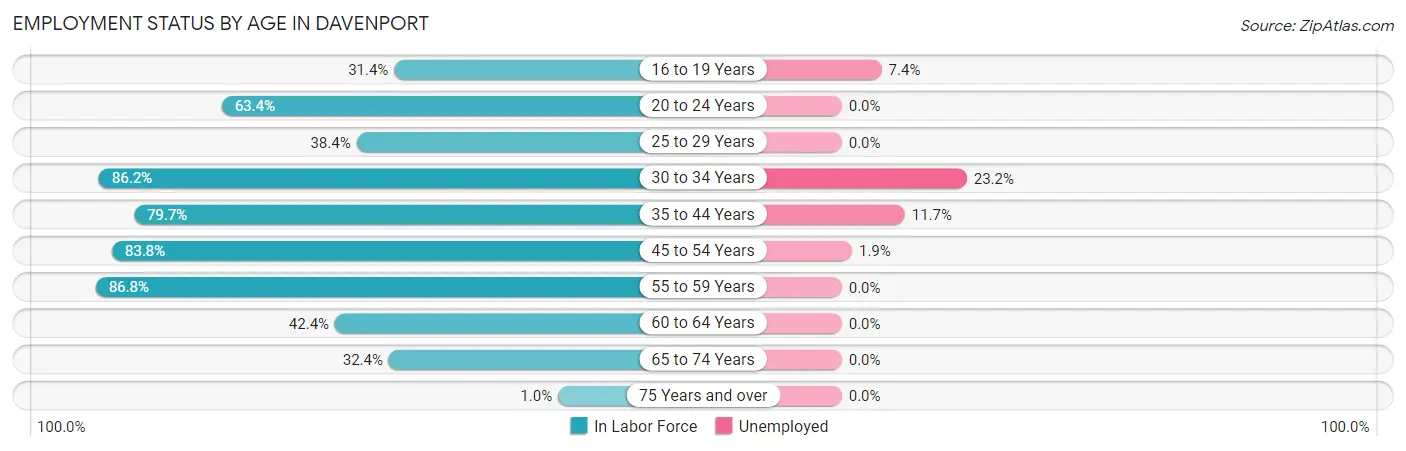
| Age Bracket | In Labor Force | Unemployed |
| 16 to 19 Years | 54 (31.4%) | 4 (7.4%) |
| 20 to 24 Years | 90 (63.4%) | 0 (0.0%) |
| 25 to 29 Years | 33 (38.4%) | 0 (0.0%) |
| 30 to 34 Years | 56 (86.2%) | 13 (23.2%) |
| 35 to 44 Years | 200 (79.7%) | 23 (11.7%) |
| 45 to 54 Years | 166 (83.8%) | 3 (1.9%) |
| 55 to 59 Years | 59 (86.8%) | 0 (0.0%) |
| 60 to 64 Years | 42 (42.4%) | 0 (0.0%) |
| 65 to 74 Years | 78 (32.4%) | 0 (0.0%) |
| 75 Years and over | 1 (1.0%) | 0 (0.0%) |
| Total | 779 (54.6%) | 44 (5.6%) |
Employment Status by Educational Attainment in Davenport
According to labor force statistics for Davenport, 72.5% of individuals (556) out of the total population between 25 and 64 years of age (767) are in the labor force, with 7.1% or 39 of them being unemployed. The group with the highest labor force participation rate are those with the educational attainment of bachelor's degree or higher, with 84.7% or 172 individuals in the labor force. Within the labor force, individuals with bachelor's degree or higher education have the highest percentage of unemployment, with 15.1% or 26 of them being unemployed.
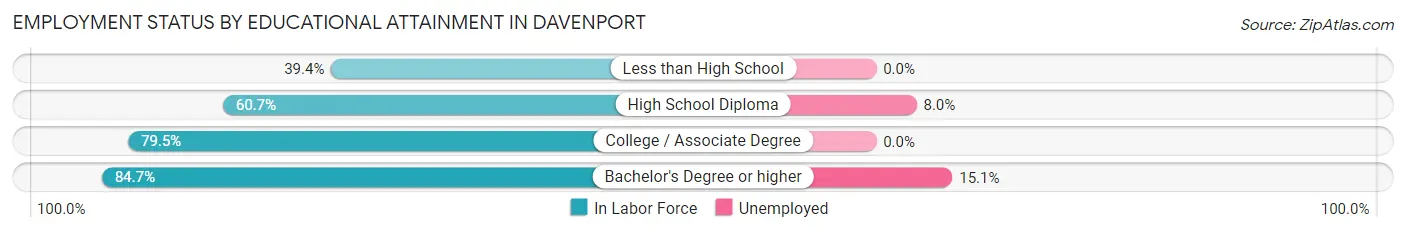
| Educational Attainment | In Labor Force | Unemployed |
| Less than High School | 13 (39.4%) | 0 (0.0%) |
| High School Diploma | 165 (60.7%) | 22 (8.0%) |
| College / Associate Degree | 206 (79.5%) | 0 (0.0%) |
| Bachelor's Degree or higher | 172 (84.7%) | 31 (15.1%) |
| Total | 556 (72.5%) | 54 (7.1%) |
Employment Occupations by Sex in Davenport
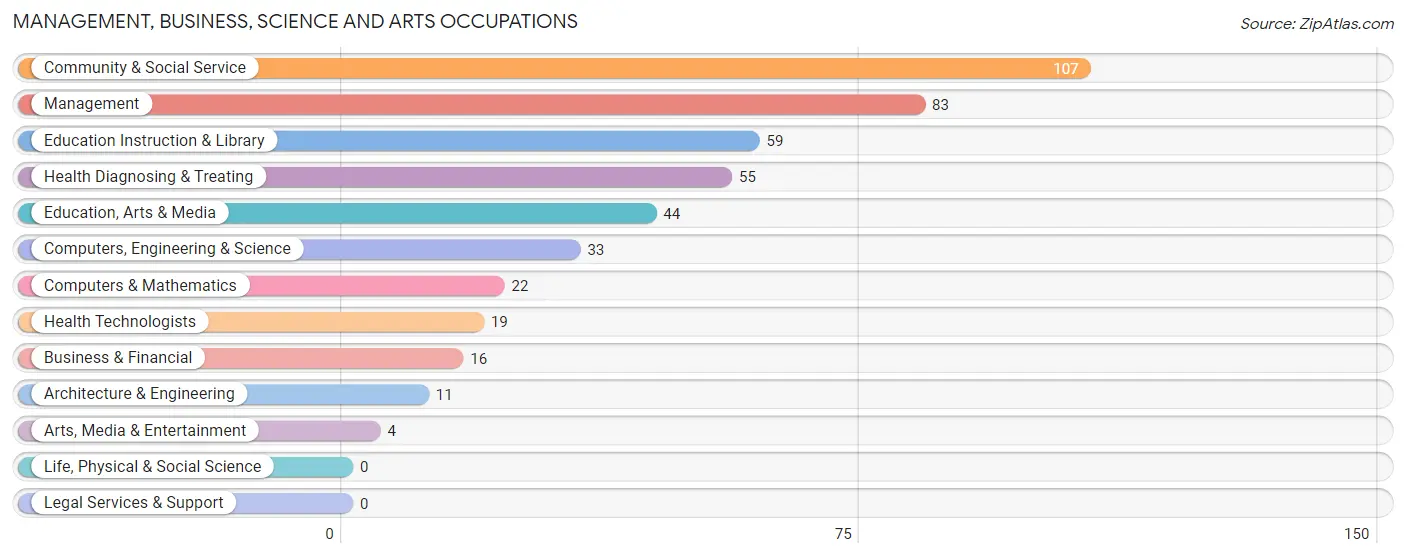
Management, Business, Science and Arts Occupations
The most common Management, Business, Science and Arts occupations in Davenport are Community & Social Service (107 | 14.7%), Management (83 | 11.4%), Education Instruction & Library (59 | 8.1%), Health Diagnosing & Treating (55 | 7.5%), and Education, Arts & Media (44 | 6.0%).
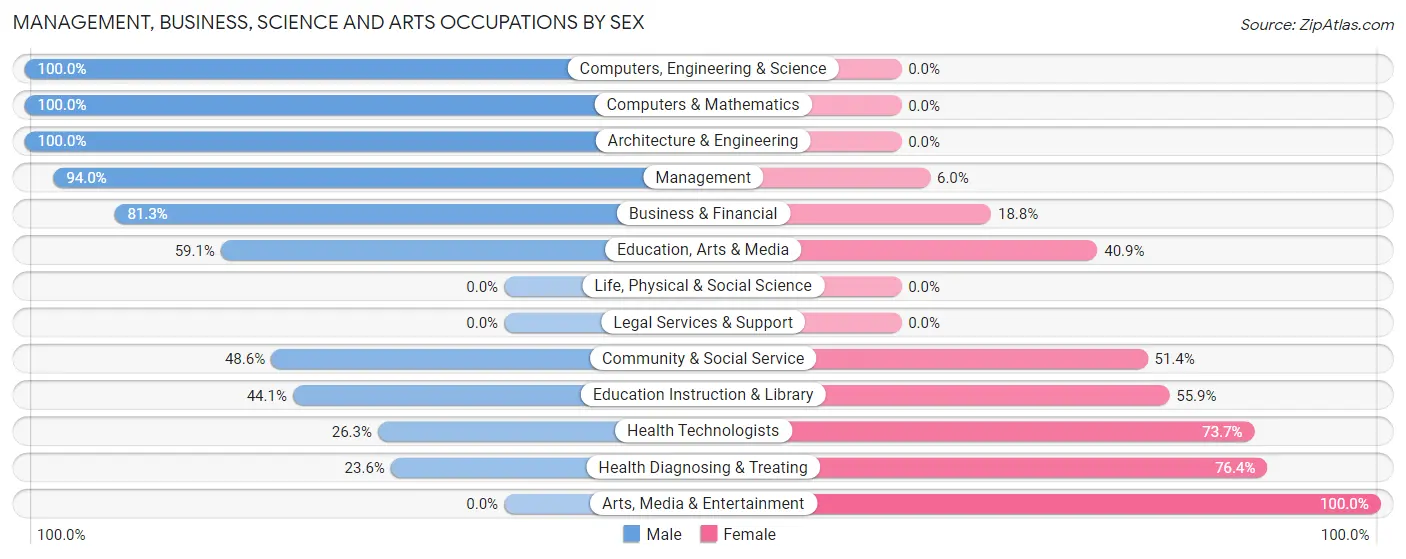
Management, Business, Science and Arts Occupations by Sex
Within the Management, Business, Science and Arts occupations in Davenport, the most male-oriented occupations are Computers, Engineering & Science (100.0%), Computers & Mathematics (100.0%), and Architecture & Engineering (100.0%), while the most female-oriented occupations are Arts, Media & Entertainment (100.0%), Health Diagnosing & Treating (76.4%), and Health Technologists (73.7%).
| Occupation | Male | Female |
| Management | 78 (94.0%) | 5 (6.0%) |
| Business & Financial | 13 (81.2%) | 3 (18.8%) |
| Computers, Engineering & Science | 33 (100.0%) | 0 (0.0%) |
| Computers & Mathematics | 22 (100.0%) | 0 (0.0%) |
| Architecture & Engineering | 11 (100.0%) | 0 (0.0%) |
| Life, Physical & Social Science | 0 (0.0%) | 0 (0.0%) |
| Community & Social Service | 52 (48.6%) | 55 (51.4%) |
| Education, Arts & Media | 26 (59.1%) | 18 (40.9%) |
| Legal Services & Support | 0 (0.0%) | 0 (0.0%) |
| Education Instruction & Library | 26 (44.1%) | 33 (55.9%) |
| Arts, Media & Entertainment | 0 (0.0%) | 4 (100.0%) |
| Health Diagnosing & Treating | 13 (23.6%) | 42 (76.4%) |
| Health Technologists | 5 (26.3%) | 14 (73.7%) |
| Total (Category) | 189 (64.3%) | 105 (35.7%) |
| Total (Overall) | 413 (56.7%) | 316 (43.3%) |
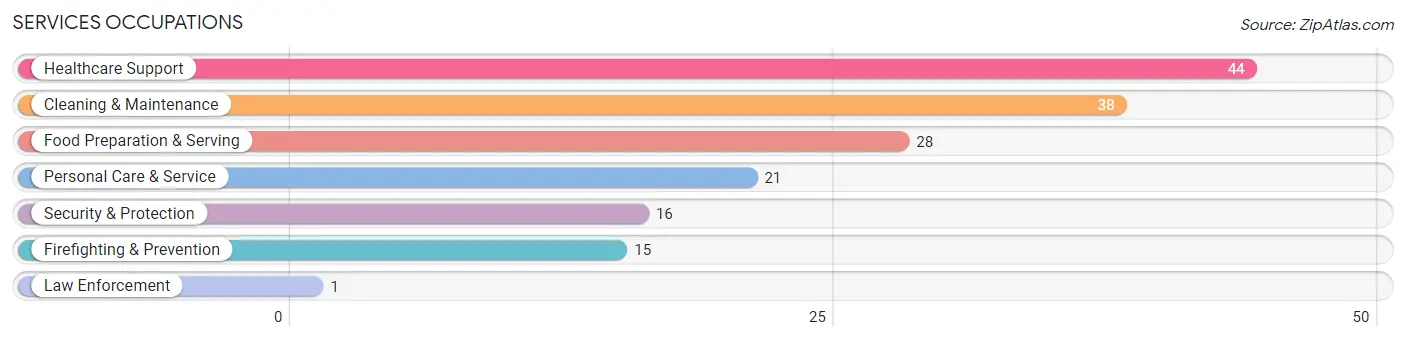
Services Occupations
The most common Services occupations in Davenport are Healthcare Support (44 | 6.0%), Cleaning & Maintenance (38 | 5.2%), Food Preparation & Serving (28 | 3.8%), Personal Care & Service (21 | 2.9%), and Security & Protection (16 | 2.2%).
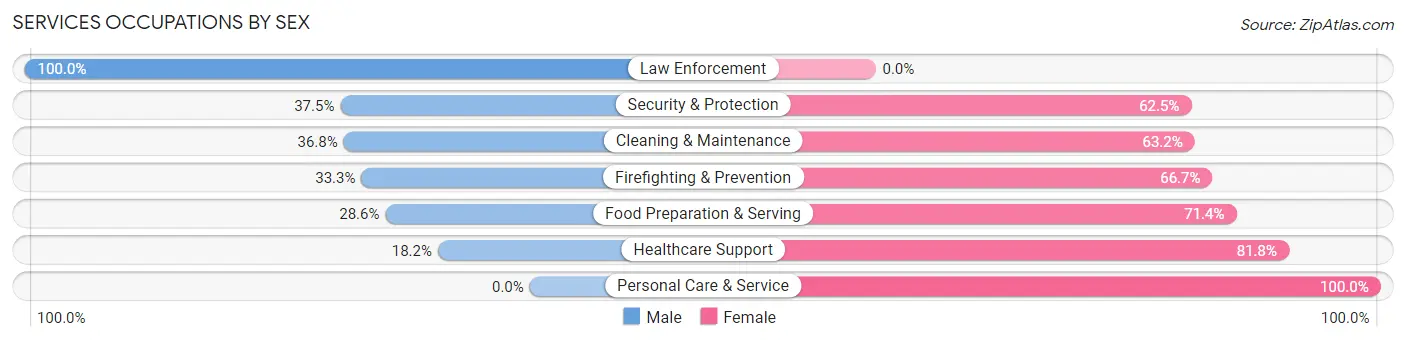
Services Occupations by Sex
Within the Services occupations in Davenport, the most male-oriented occupations are Law Enforcement (100.0%), Security & Protection (37.5%), and Cleaning & Maintenance (36.8%), while the most female-oriented occupations are Personal Care & Service (100.0%), Healthcare Support (81.8%), and Food Preparation & Serving (71.4%).
| Occupation | Male | Female |
| Healthcare Support | 8 (18.2%) | 36 (81.8%) |
| Security & Protection | 6 (37.5%) | 10 (62.5%) |
| Firefighting & Prevention | 5 (33.3%) | 10 (66.7%) |
| Law Enforcement | 1 (100.0%) | 0 (0.0%) |
| Food Preparation & Serving | 8 (28.6%) | 20 (71.4%) |
| Cleaning & Maintenance | 14 (36.8%) | 24 (63.2%) |
| Personal Care & Service | 0 (0.0%) | 21 (100.0%) |
| Total (Category) | 36 (24.5%) | 111 (75.5%) |
| Total (Overall) | 413 (56.7%) | 316 (43.3%) |
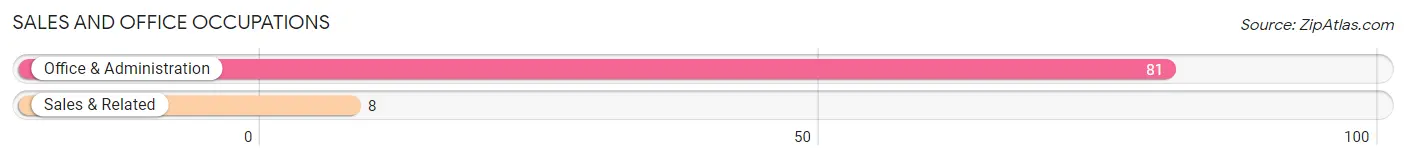
Sales and Office Occupations
The most common Sales and Office occupations in Davenport are Office & Administration (81 | 11.1%), and Sales & Related (8 | 1.1%).
Sales and Office Occupations by Sex
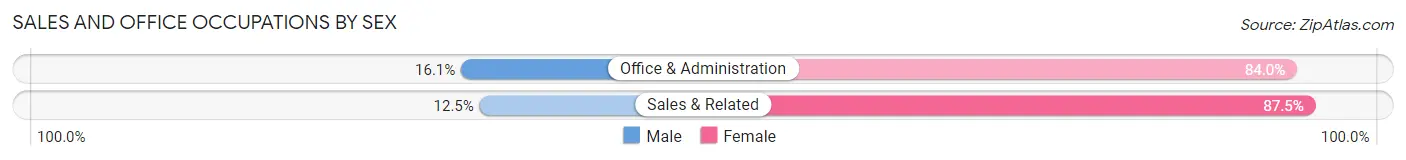
| Occupation | Male | Female |
| Sales & Related | 1 (12.5%) | 7 (87.5%) |
| Office & Administration | 13 (16.1%) | 68 (84.0%) |
| Total (Category) | 14 (15.7%) | 75 (84.3%) |
| Total (Overall) | 413 (56.7%) | 316 (43.3%) |
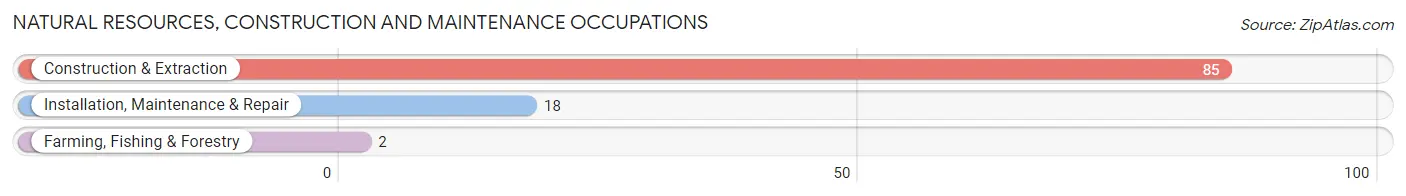
Natural Resources, Construction and Maintenance Occupations
The most common Natural Resources, Construction and Maintenance occupations in Davenport are Construction & Extraction (85 | 11.7%), Installation, Maintenance & Repair (18 | 2.5%), and Farming, Fishing & Forestry (2 | 0.3%).
Natural Resources, Construction and Maintenance Occupations by Sex
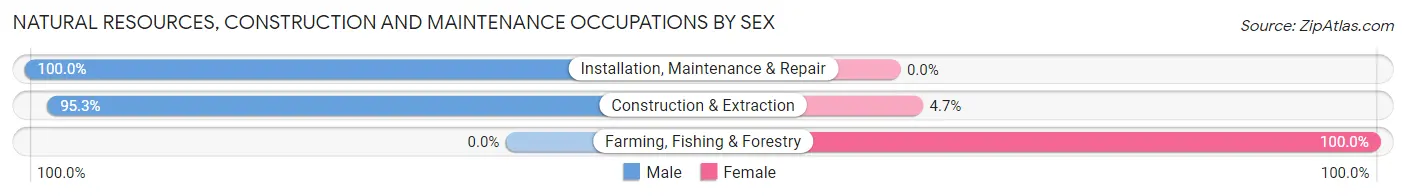
| Occupation | Male | Female |
| Farming, Fishing & Forestry | 0 (0.0%) | 2 (100.0%) |
| Construction & Extraction | 81 (95.3%) | 4 (4.7%) |
| Installation, Maintenance & Repair | 18 (100.0%) | 0 (0.0%) |
| Total (Category) | 99 (94.3%) | 6 (5.7%) |
| Total (Overall) | 413 (56.7%) | 316 (43.3%) |
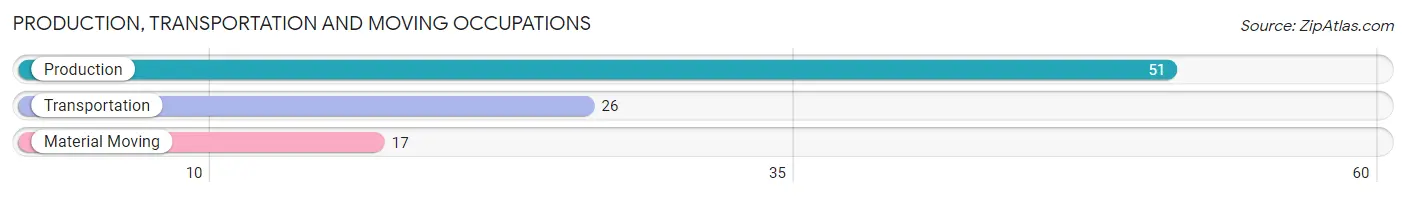
Production, Transportation and Moving Occupations
The most common Production, Transportation and Moving occupations in Davenport are Production (51 | 7.0%), Transportation (26 | 3.6%), and Material Moving (17 | 2.3%).
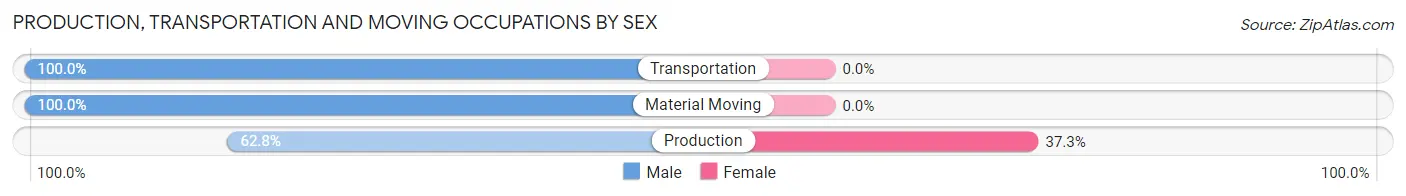
Production, Transportation and Moving Occupations by Sex
| Occupation | Male | Female |
| Production | 32 (62.7%) | 19 (37.2%) |
| Transportation | 26 (100.0%) | 0 (0.0%) |
| Material Moving | 17 (100.0%) | 0 (0.0%) |
| Total (Category) | 75 (79.8%) | 19 (20.2%) |
| Total (Overall) | 413 (56.7%) | 316 (43.3%) |
Employment Industries by Sex in Davenport
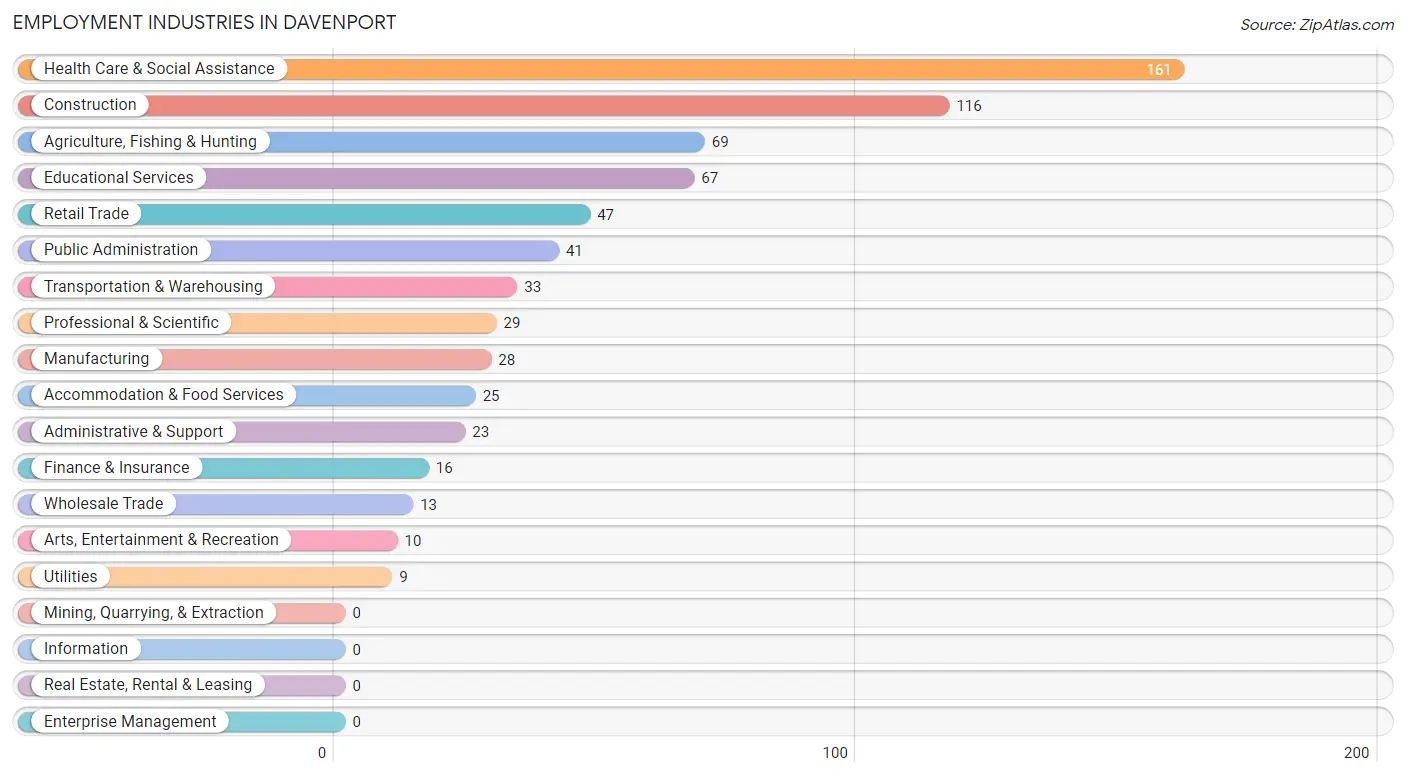
Employment Industries in Davenport
The major employment industries in Davenport include Health Care & Social Assistance (161 | 22.1%), Construction (116 | 15.9%), Agriculture, Fishing & Hunting (69 | 9.5%), Educational Services (67 | 9.2%), and Retail Trade (47 | 6.5%).
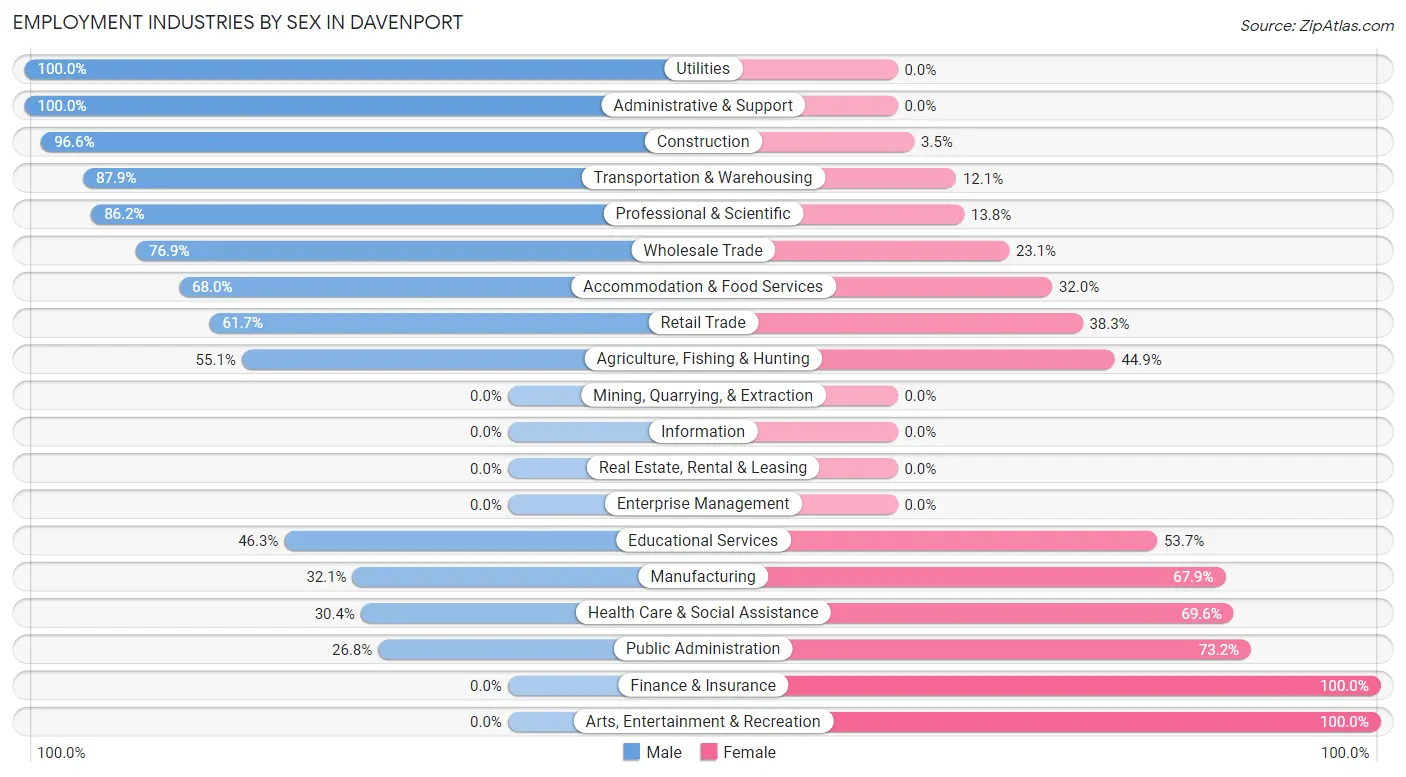
Employment Industries by Sex in Davenport
The Davenport industries that see more men than women are Utilities (100.0%), Administrative & Support (100.0%), and Construction (96.6%), whereas the industries that tend to have a higher number of women are Finance & Insurance (100.0%), Arts, Entertainment & Recreation (100.0%), and Public Administration (73.2%).
| Industry | Male | Female |
| Agriculture, Fishing & Hunting | 38 (55.1%) | 31 (44.9%) |
| Mining, Quarrying, & Extraction | 0 (0.0%) | 0 (0.0%) |
| Construction | 112 (96.6%) | 4 (3.5%) |
| Manufacturing | 9 (32.1%) | 19 (67.9%) |
| Wholesale Trade | 10 (76.9%) | 3 (23.1%) |
| Retail Trade | 29 (61.7%) | 18 (38.3%) |
| Transportation & Warehousing | 29 (87.9%) | 4 (12.1%) |
| Utilities | 9 (100.0%) | 0 (0.0%) |
| Information | 0 (0.0%) | 0 (0.0%) |
| Finance & Insurance | 0 (0.0%) | 16 (100.0%) |
| Real Estate, Rental & Leasing | 0 (0.0%) | 0 (0.0%) |
| Professional & Scientific | 25 (86.2%) | 4 (13.8%) |
| Enterprise Management | 0 (0.0%) | 0 (0.0%) |
| Administrative & Support | 23 (100.0%) | 0 (0.0%) |
| Educational Services | 31 (46.3%) | 36 (53.7%) |
| Health Care & Social Assistance | 49 (30.4%) | 112 (69.6%) |
| Arts, Entertainment & Recreation | 0 (0.0%) | 10 (100.0%) |
| Accommodation & Food Services | 17 (68.0%) | 8 (32.0%) |
| Public Administration | 11 (26.8%) | 30 (73.2%) |
| Total | 413 (56.7%) | 316 (43.3%) |
Education in Davenport
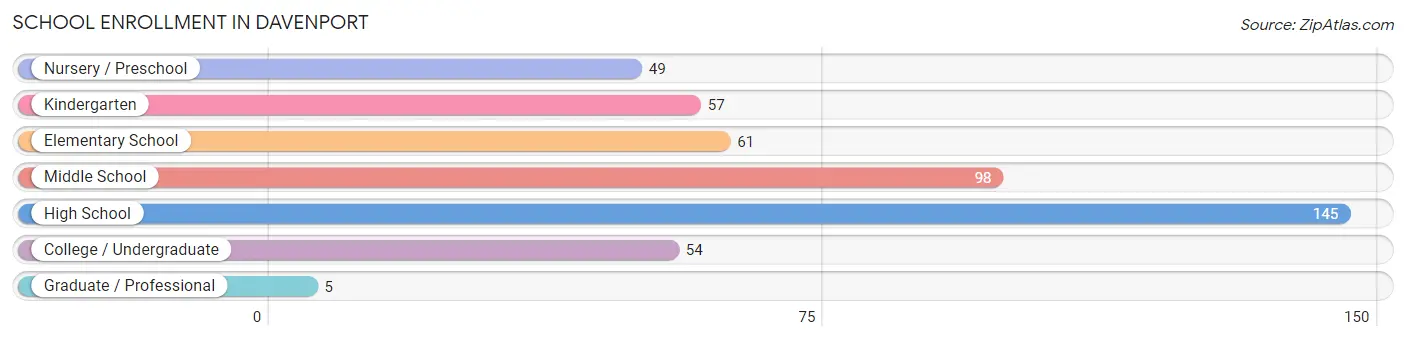
School Enrollment in Davenport
The most common levels of schooling among the 469 students in Davenport are high school (145 | 30.9%), middle school (98 | 20.9%), and elementary school (61 | 13.0%).
| School Level | # Students | % Students |
| Nursery / Preschool | 49 | 10.4% |
| Kindergarten | 57 | 12.1% |
| Elementary School | 61 | 13.0% |
| Middle School | 98 | 20.9% |
| High School | 145 | 30.9% |
| College / Undergraduate | 54 | 11.5% |
| Graduate / Professional | 5 | 1.1% |
| Total | 469 | 100.0% |
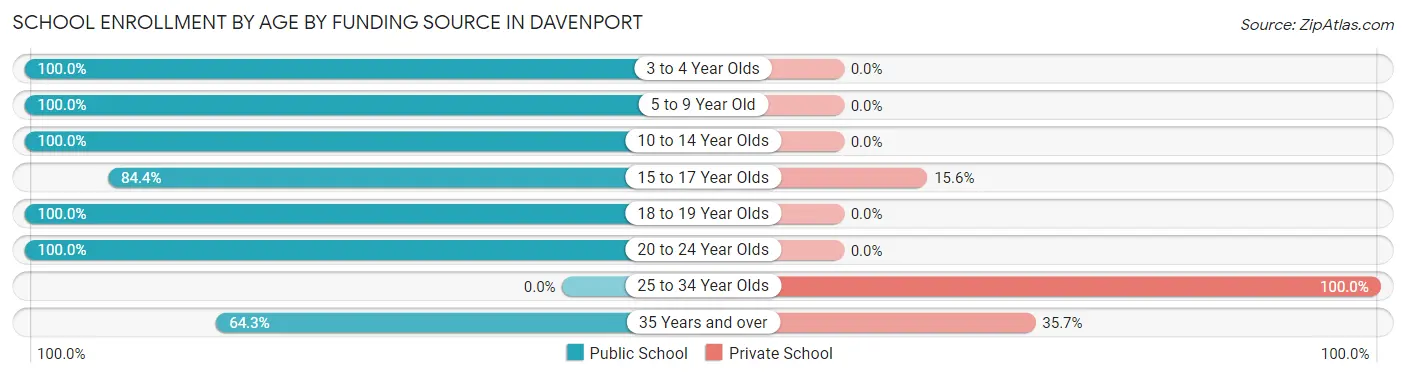
School Enrollment by Age by Funding Source in Davenport
Out of a total of 469 students who are enrolled in schools in Davenport, 21 (4.5%) attend a private institution, while the remaining 448 (95.5%) are enrolled in public schools. The age group of 25 to 34 year olds has the highest likelihood of being enrolled in private schools, with 2 (100.0% in the age bracket) enrolled. Conversely, the age group of 3 to 4 year olds has the lowest likelihood of being enrolled in a private school, with 51 (100.0% in the age bracket) attending a public institution.
| Age Bracket | Public School | Private School |
| 3 to 4 Year Olds | 51 (100.0%) | 0 (0.0%) |
| 5 to 9 Year Old | 116 (100.0%) | 0 (0.0%) |
| 10 to 14 Year Olds | 109 (100.0%) | 0 (0.0%) |
| 15 to 17 Year Olds | 76 (84.4%) | 14 (15.6%) |
| 18 to 19 Year Olds | 68 (100.0%) | 0 (0.0%) |
| 20 to 24 Year Olds | 19 (100.0%) | 0 (0.0%) |
| 25 to 34 Year Olds | 0 (0.0%) | 2 (100.0%) |
| 35 Years and over | 9 (64.3%) | 5 (35.7%) |
| Total | 448 (95.5%) | 21 (4.5%) |
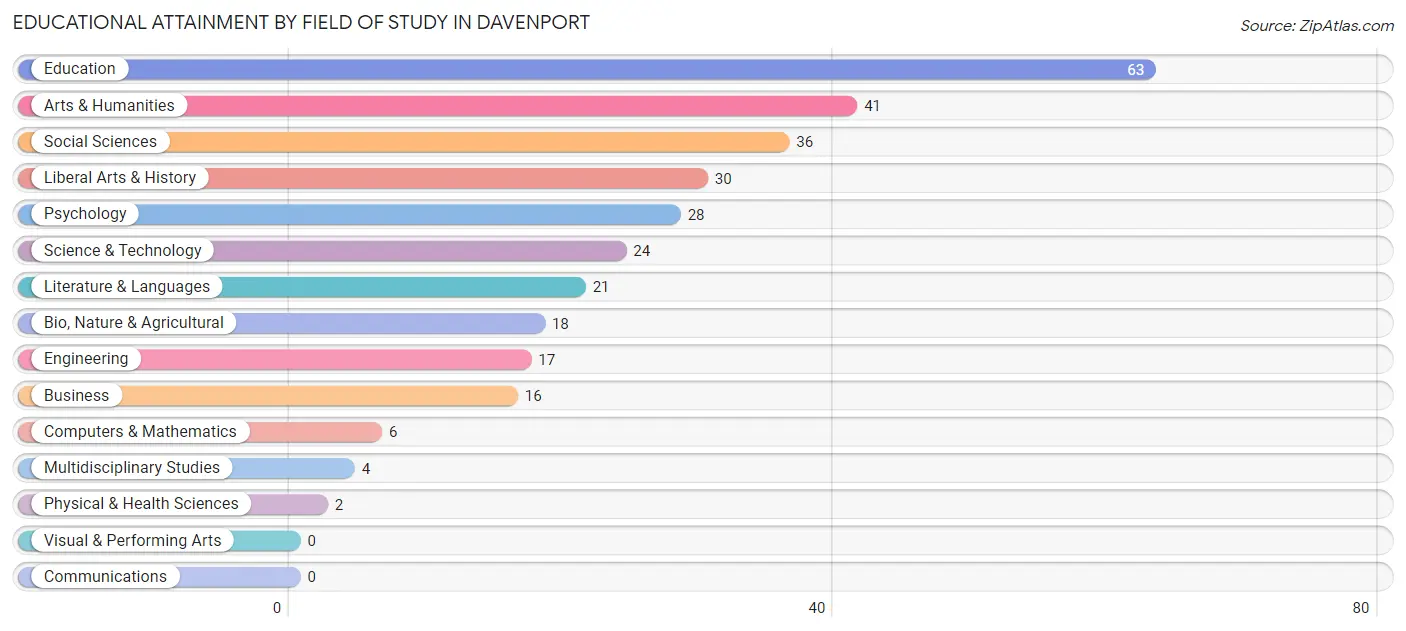
Educational Attainment by Field of Study in Davenport
Education (63 | 20.6%), arts & humanities (41 | 13.4%), social sciences (36 | 11.8%), liberal arts & history (30 | 9.8%), and psychology (28 | 9.1%) are the most common fields of study among 306 individuals in Davenport who have obtained a bachelor's degree or higher.
| Field of Study | # Graduates | % Graduates |
| Computers & Mathematics | 6 | 2.0% |
| Bio, Nature & Agricultural | 18 | 5.9% |
| Physical & Health Sciences | 2 | 0.6% |
| Psychology | 28 | 9.1% |
| Social Sciences | 36 | 11.8% |
| Engineering | 17 | 5.6% |
| Multidisciplinary Studies | 4 | 1.3% |
| Science & Technology | 24 | 7.8% |
| Business | 16 | 5.2% |
| Education | 63 | 20.6% |
| Literature & Languages | 21 | 6.9% |
| Liberal Arts & History | 30 | 9.8% |
| Visual & Performing Arts | 0 | 0.0% |
| Communications | 0 | 0.0% |
| Arts & Humanities | 41 | 13.4% |
| Total | 306 | 100.0% |
Transportation & Commute in Davenport
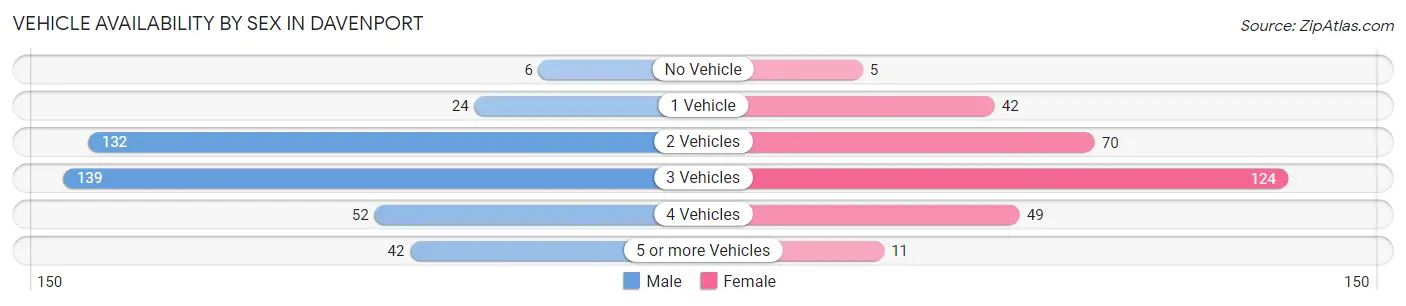
Vehicle Availability by Sex in Davenport
The most prevalent vehicle ownership categories in Davenport are males with 3 vehicles (139, accounting for 35.2%) and females with 3 vehicles (124, making up 46.2%).
| Vehicles Available | Male | Female |
| No Vehicle | 6 (1.5%) | 5 (1.7%) |
| 1 Vehicle | 24 (6.1%) | 42 (14.0%) |
| 2 Vehicles | 132 (33.4%) | 70 (23.3%) |
| 3 Vehicles | 139 (35.2%) | 124 (41.2%) |
| 4 Vehicles | 52 (13.2%) | 49 (16.3%) |
| 5 or more Vehicles | 42 (10.6%) | 11 (3.6%) |
| Total | 395 (100.0%) | 301 (100.0%) |
Commute Time in Davenport
The most frequently occuring commute durations in Davenport are 5 to 9 minutes (136 commuters, 21.0%), less than 5 minutes (134 commuters, 20.7%), and 45 to 59 minutes (71 commuters, 11.0%).
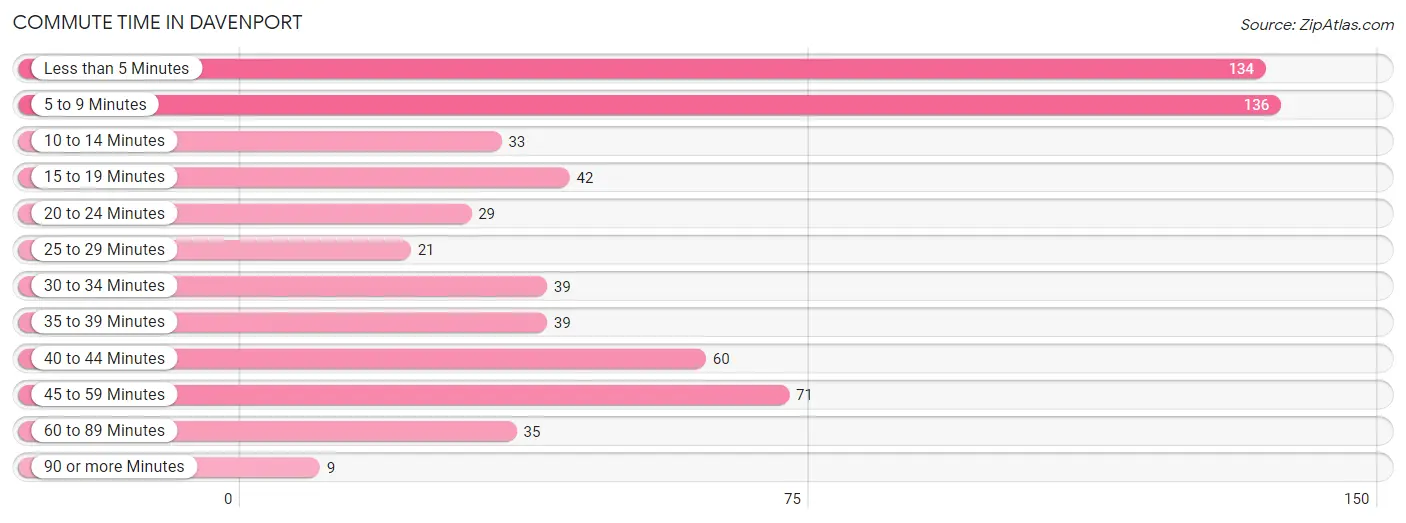
| Commute Time | # Commuters | % Commuters |
| Less than 5 Minutes | 134 | 20.7% |
| 5 to 9 Minutes | 136 | 21.0% |
| 10 to 14 Minutes | 33 | 5.1% |
| 15 to 19 Minutes | 42 | 6.5% |
| 20 to 24 Minutes | 29 | 4.5% |
| 25 to 29 Minutes | 21 | 3.2% |
| 30 to 34 Minutes | 39 | 6.0% |
| 35 to 39 Minutes | 39 | 6.0% |
| 40 to 44 Minutes | 60 | 9.3% |
| 45 to 59 Minutes | 71 | 11.0% |
| 60 to 89 Minutes | 35 | 5.4% |
| 90 or more Minutes | 9 | 1.4% |
Commute Time by Sex in Davenport
The most common commute times in Davenport are 5 to 9 minutes (55 commuters, 15.5%) for males and less than 5 minutes (84 commuters, 28.6%) for females.
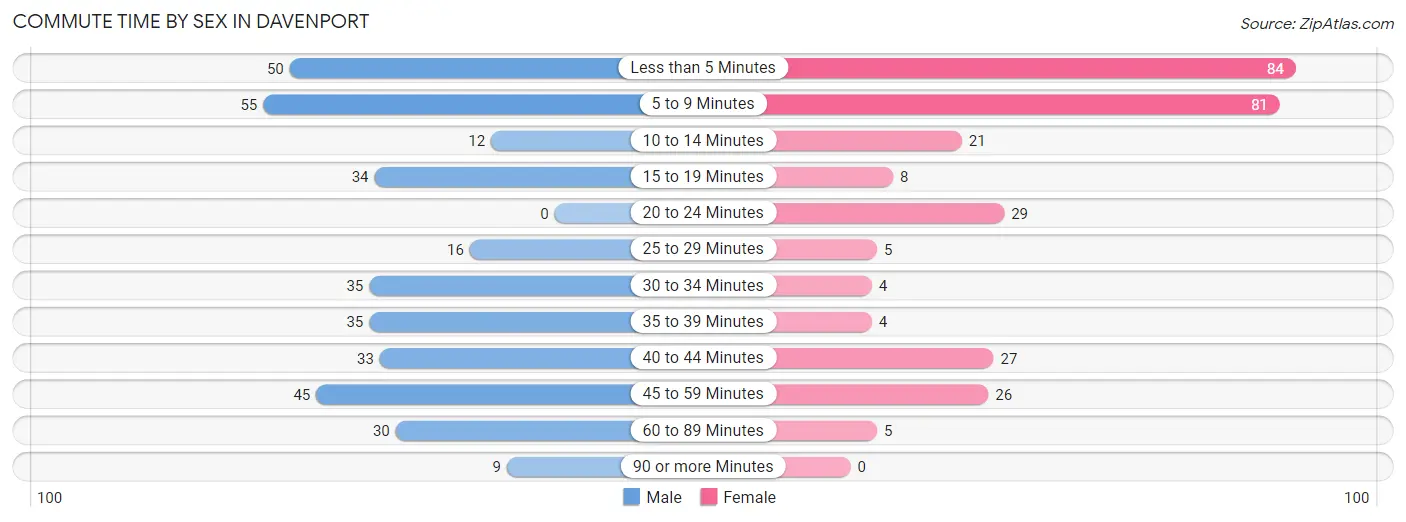
| Commute Time | Male | Female |
| Less than 5 Minutes | 50 (14.1%) | 84 (28.6%) |
| 5 to 9 Minutes | 55 (15.5%) | 81 (27.6%) |
| 10 to 14 Minutes | 12 (3.4%) | 21 (7.1%) |
| 15 to 19 Minutes | 34 (9.6%) | 8 (2.7%) |
| 20 to 24 Minutes | 0 (0.0%) | 29 (9.9%) |
| 25 to 29 Minutes | 16 (4.5%) | 5 (1.7%) |
| 30 to 34 Minutes | 35 (9.9%) | 4 (1.4%) |
| 35 to 39 Minutes | 35 (9.9%) | 4 (1.4%) |
| 40 to 44 Minutes | 33 (9.3%) | 27 (9.2%) |
| 45 to 59 Minutes | 45 (12.7%) | 26 (8.8%) |
| 60 to 89 Minutes | 30 (8.5%) | 5 (1.7%) |
| 90 or more Minutes | 9 (2.5%) | 0 (0.0%) |
Time of Departure to Work by Sex in Davenport
The most frequent times of departure to work in Davenport are 7:00 AM to 7:29 AM (63, 17.8%) for males and 7:00 AM to 7:29 AM (111, 37.8%) for females.
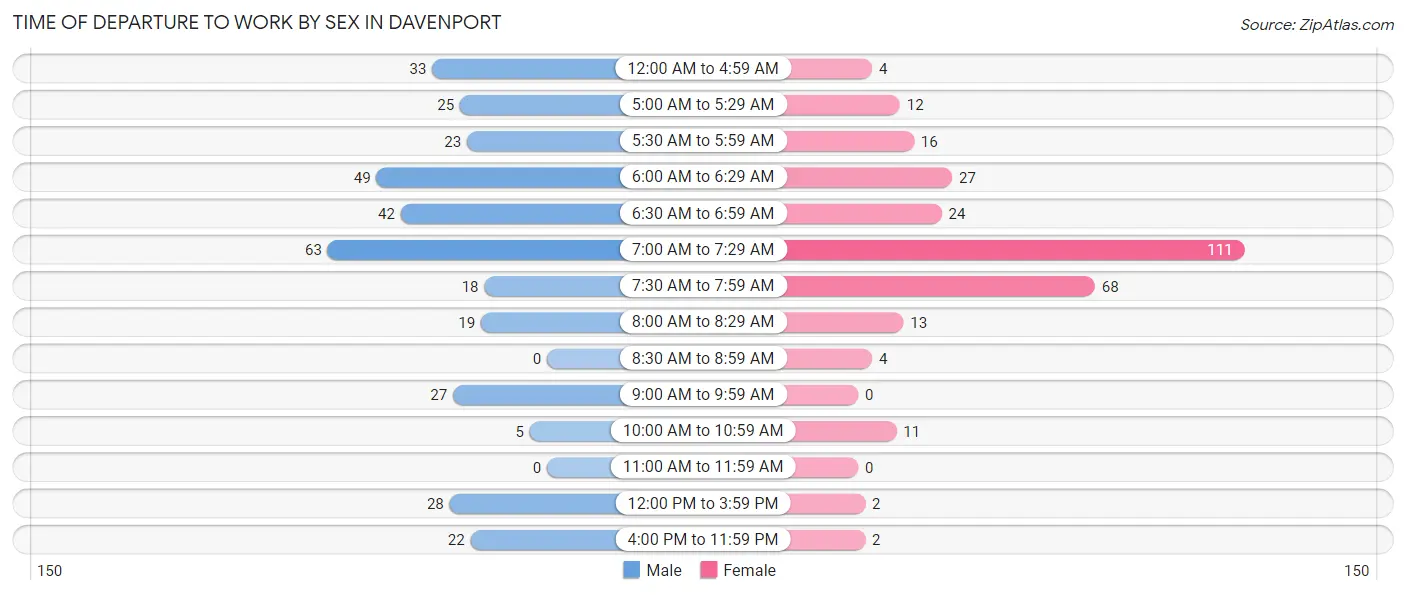
| Time of Departure | Male | Female |
| 12:00 AM to 4:59 AM | 33 (9.3%) | 4 (1.4%) |
| 5:00 AM to 5:29 AM | 25 (7.1%) | 12 (4.1%) |
| 5:30 AM to 5:59 AM | 23 (6.5%) | 16 (5.4%) |
| 6:00 AM to 6:29 AM | 49 (13.8%) | 27 (9.2%) |
| 6:30 AM to 6:59 AM | 42 (11.9%) | 24 (8.2%) |
| 7:00 AM to 7:29 AM | 63 (17.8%) | 111 (37.8%) |
| 7:30 AM to 7:59 AM | 18 (5.1%) | 68 (23.1%) |
| 8:00 AM to 8:29 AM | 19 (5.4%) | 13 (4.4%) |
| 8:30 AM to 8:59 AM | 0 (0.0%) | 4 (1.4%) |
| 9:00 AM to 9:59 AM | 27 (7.6%) | 0 (0.0%) |
| 10:00 AM to 10:59 AM | 5 (1.4%) | 11 (3.7%) |
| 11:00 AM to 11:59 AM | 0 (0.0%) | 0 (0.0%) |
| 12:00 PM to 3:59 PM | 28 (7.9%) | 2 (0.7%) |
| 4:00 PM to 11:59 PM | 22 (6.2%) | 2 (0.7%) |
| Total | 354 (100.0%) | 294 (100.0%) |
Housing Occupancy in Davenport
Occupancy by Ownership in Davenport
Of the total 683 dwellings in Davenport, owner-occupied units account for 487 (71.3%), while renter-occupied units make up 196 (28.7%).
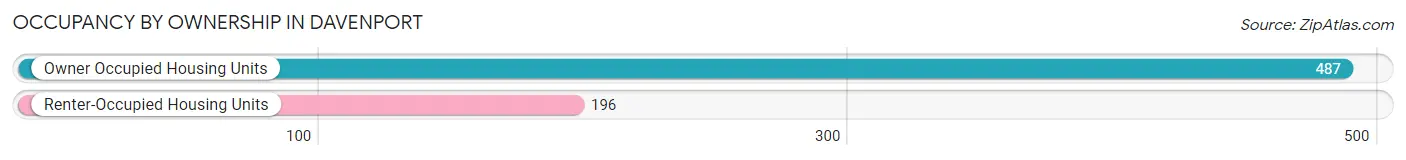
| Occupancy | # Housing Units | % Housing Units |
| Owner Occupied Housing Units | 487 | 71.3% |
| Renter-Occupied Housing Units | 196 | 28.7% |
| Total Occupied Housing Units | 683 | 100.0% |
Occupancy by Household Size in Davenport
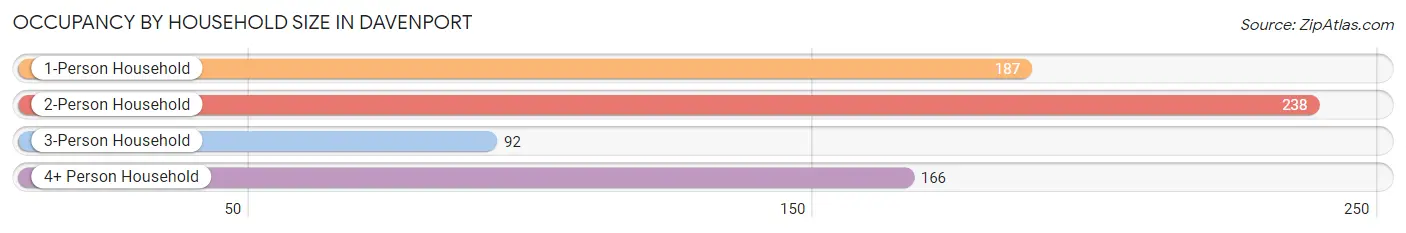
| Household Size | # Housing Units | % Housing Units |
| 1-Person Household | 187 | 27.4% |
| 2-Person Household | 238 | 34.8% |
| 3-Person Household | 92 | 13.5% |
| 4+ Person Household | 166 | 24.3% |
| Total Housing Units | 683 | 100.0% |
Occupancy by Ownership by Household Size in Davenport
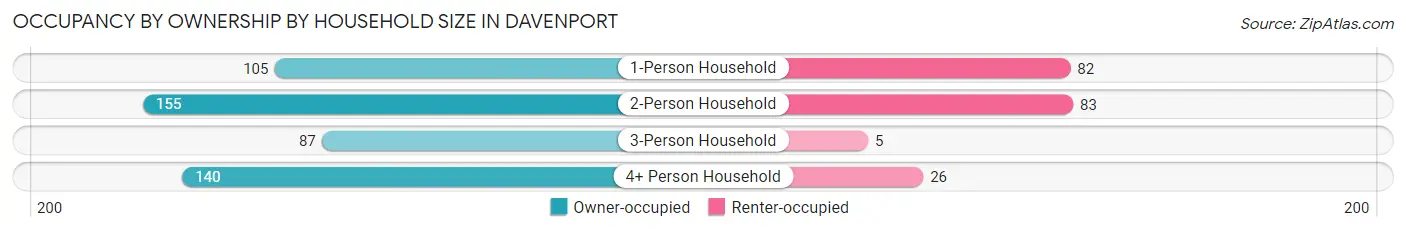
| Household Size | Owner-occupied | Renter-occupied |
| 1-Person Household | 105 (56.1%) | 82 (43.9%) |
| 2-Person Household | 155 (65.1%) | 83 (34.9%) |
| 3-Person Household | 87 (94.6%) | 5 (5.4%) |
| 4+ Person Household | 140 (84.3%) | 26 (15.7%) |
| Total Housing Units | 487 (71.3%) | 196 (28.7%) |
Occupancy by Educational Attainment in Davenport
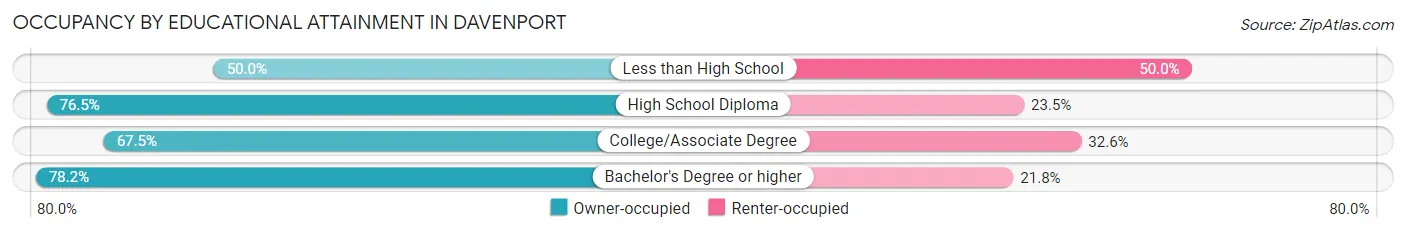
| Household Size | Owner-occupied | Renter-occupied |
| Less than High School | 21 (50.0%) | 21 (50.0%) |
| High School Diploma | 150 (76.5%) | 46 (23.5%) |
| College/Associate Degree | 201 (67.4%) | 97 (32.6%) |
| Bachelor's Degree or higher | 115 (78.2%) | 32 (21.8%) |
Occupancy by Age of Householder in Davenport
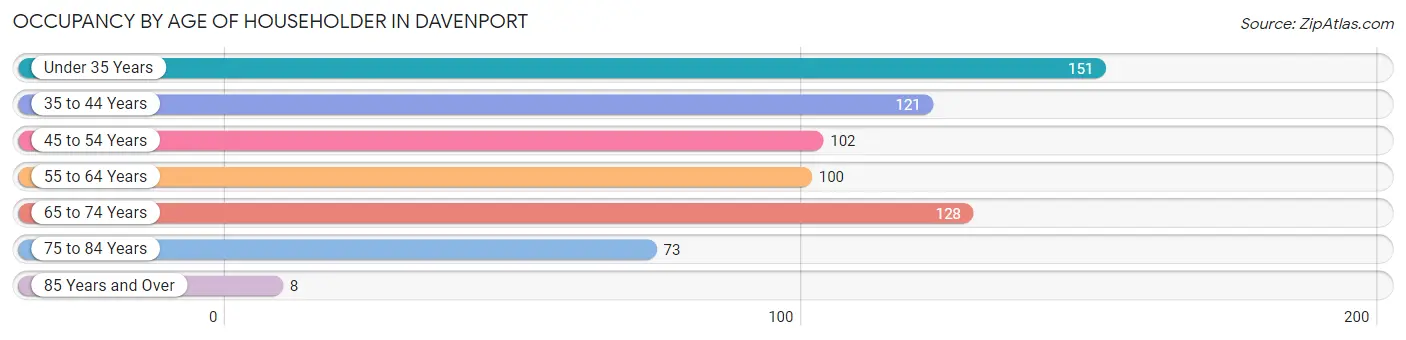
| Age Bracket | # Households | % Households |
| Under 35 Years | 151 | 22.1% |
| 35 to 44 Years | 121 | 17.7% |
| 45 to 54 Years | 102 | 14.9% |
| 55 to 64 Years | 100 | 14.6% |
| 65 to 74 Years | 128 | 18.7% |
| 75 to 84 Years | 73 | 10.7% |
| 85 Years and Over | 8 | 1.2% |
| Total | 683 | 100.0% |
Housing Finances in Davenport
Median Income by Occupancy in Davenport
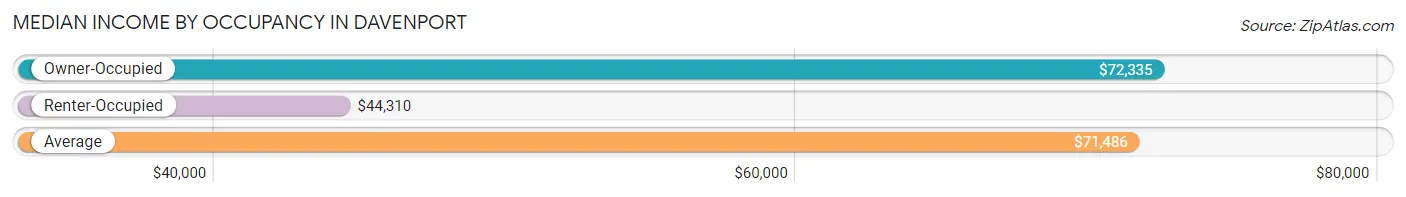
| Occupancy Type | # Households | Median Income |
| Owner-Occupied | 487 (71.3%) | $72,335 |
| Renter-Occupied | 196 (28.7%) | $44,310 |
| Average | 683 (100.0%) | $71,486 |
Occupancy by Householder Income Bracket in Davenport
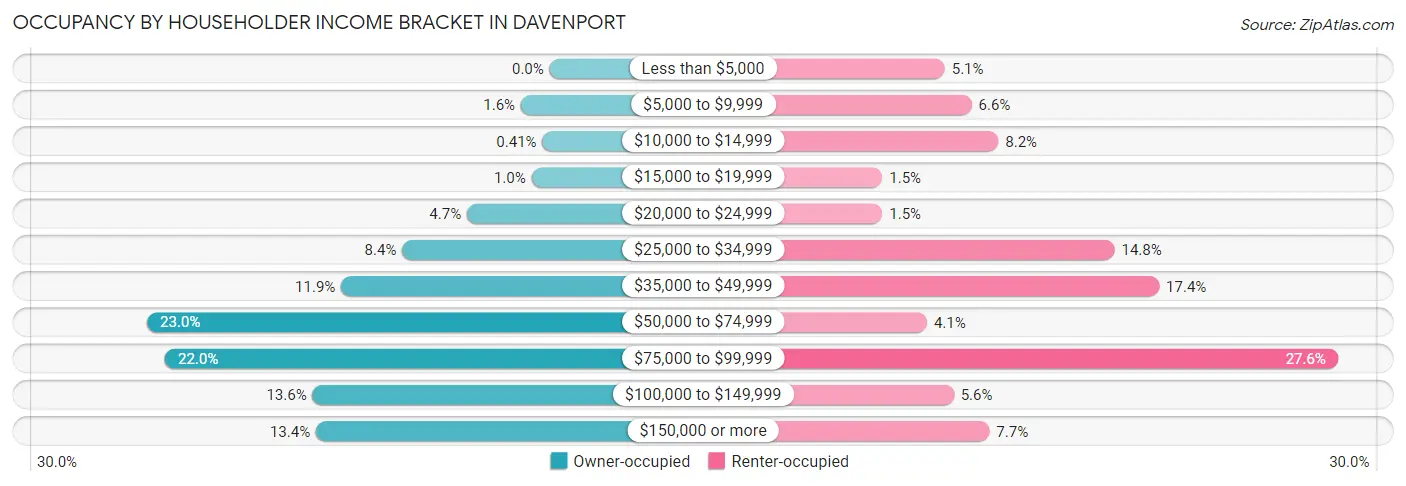
| Income Bracket | Owner-occupied | Renter-occupied |
| Less than $5,000 | 0 (0.0%) | 10 (5.1%) |
| $5,000 to $9,999 | 8 (1.6%) | 13 (6.6%) |
| $10,000 to $14,999 | 2 (0.4%) | 16 (8.2%) |
| $15,000 to $19,999 | 5 (1.0%) | 3 (1.5%) |
| $20,000 to $24,999 | 23 (4.7%) | 3 (1.5%) |
| $25,000 to $34,999 | 41 (8.4%) | 29 (14.8%) |
| $35,000 to $49,999 | 58 (11.9%) | 34 (17.3%) |
| $50,000 to $74,999 | 112 (23.0%) | 8 (4.1%) |
| $75,000 to $99,999 | 107 (22.0%) | 54 (27.6%) |
| $100,000 to $149,999 | 66 (13.6%) | 11 (5.6%) |
| $150,000 or more | 65 (13.4%) | 15 (7.6%) |
| Total | 487 (100.0%) | 196 (100.0%) |
Monthly Housing Cost Tiers in Davenport
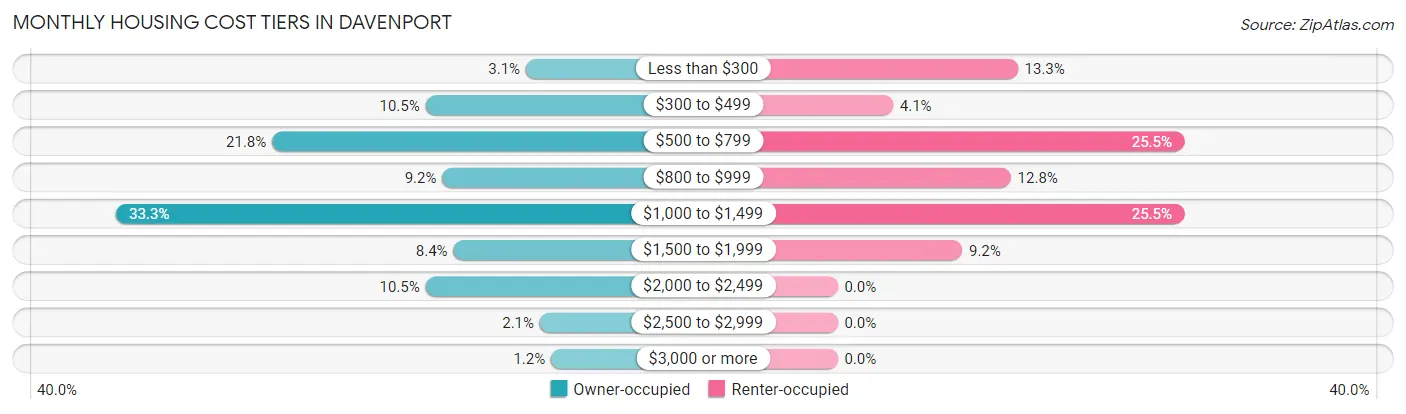
| Monthly Cost | Owner-occupied | Renter-occupied |
| Less than $300 | 15 (3.1%) | 26 (13.3%) |
| $300 to $499 | 51 (10.5%) | 8 (4.1%) |
| $500 to $799 | 106 (21.8%) | 50 (25.5%) |
| $800 to $999 | 45 (9.2%) | 25 (12.8%) |
| $1,000 to $1,499 | 162 (33.3%) | 50 (25.5%) |
| $1,500 to $1,999 | 41 (8.4%) | 18 (9.2%) |
| $2,000 to $2,499 | 51 (10.5%) | 0 (0.0%) |
| $2,500 to $2,999 | 10 (2.1%) | 0 (0.0%) |
| $3,000 or more | 6 (1.2%) | 0 (0.0%) |
| Total | 487 (100.0%) | 196 (100.0%) |
Physical Housing Characteristics in Davenport
Housing Structures in Davenport
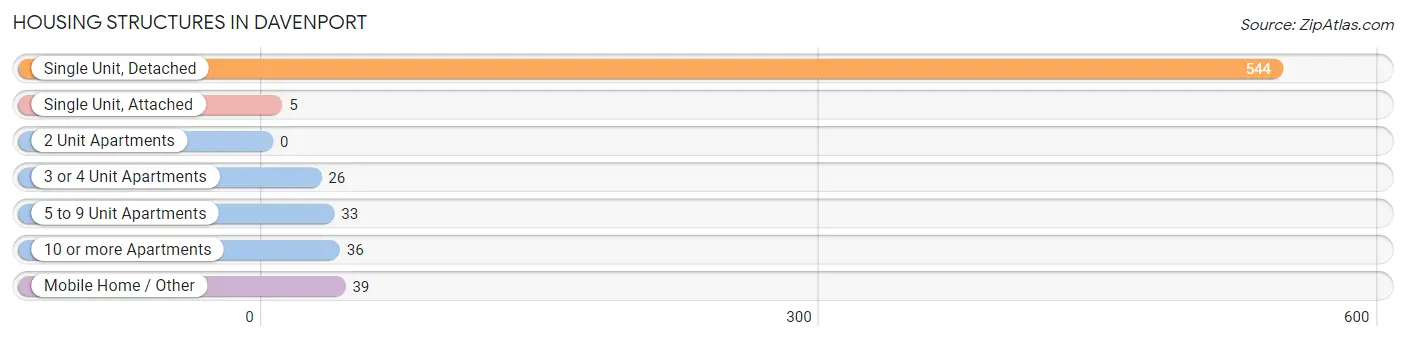
| Structure Type | # Housing Units | % Housing Units |
| Single Unit, Detached | 544 | 79.6% |
| Single Unit, Attached | 5 | 0.7% |
| 2 Unit Apartments | 0 | 0.0% |
| 3 or 4 Unit Apartments | 26 | 3.8% |
| 5 to 9 Unit Apartments | 33 | 4.8% |
| 10 or more Apartments | 36 | 5.3% |
| Mobile Home / Other | 39 | 5.7% |
| Total | 683 | 100.0% |
Housing Structures by Occupancy in Davenport
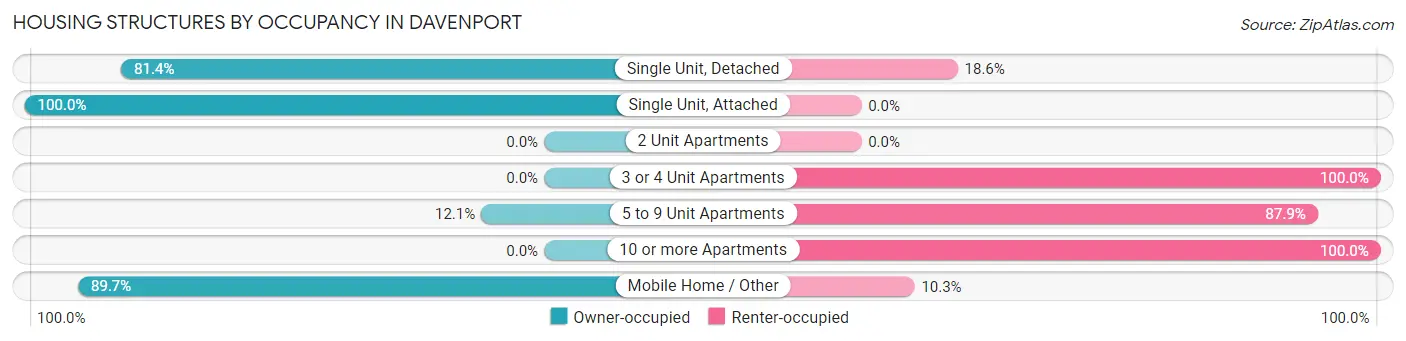
| Structure Type | Owner-occupied | Renter-occupied |
| Single Unit, Detached | 443 (81.4%) | 101 (18.6%) |
| Single Unit, Attached | 5 (100.0%) | 0 (0.0%) |
| 2 Unit Apartments | 0 (0.0%) | 0 (0.0%) |
| 3 or 4 Unit Apartments | 0 (0.0%) | 26 (100.0%) |
| 5 to 9 Unit Apartments | 4 (12.1%) | 29 (87.9%) |
| 10 or more Apartments | 0 (0.0%) | 36 (100.0%) |
| Mobile Home / Other | 35 (89.7%) | 4 (10.3%) |
| Total | 487 (71.3%) | 196 (28.7%) |
Housing Structures by Number of Rooms in Davenport
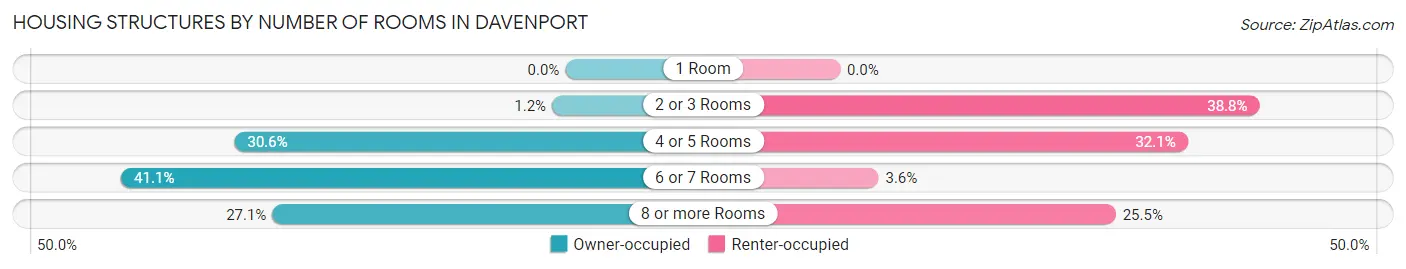
| Number of Rooms | Owner-occupied | Renter-occupied |
| 1 Room | 0 (0.0%) | 0 (0.0%) |
| 2 or 3 Rooms | 6 (1.2%) | 76 (38.8%) |
| 4 or 5 Rooms | 149 (30.6%) | 63 (32.1%) |
| 6 or 7 Rooms | 200 (41.1%) | 7 (3.6%) |
| 8 or more Rooms | 132 (27.1%) | 50 (25.5%) |
| Total | 487 (100.0%) | 196 (100.0%) |
Housing Structure by Heating Type in Davenport
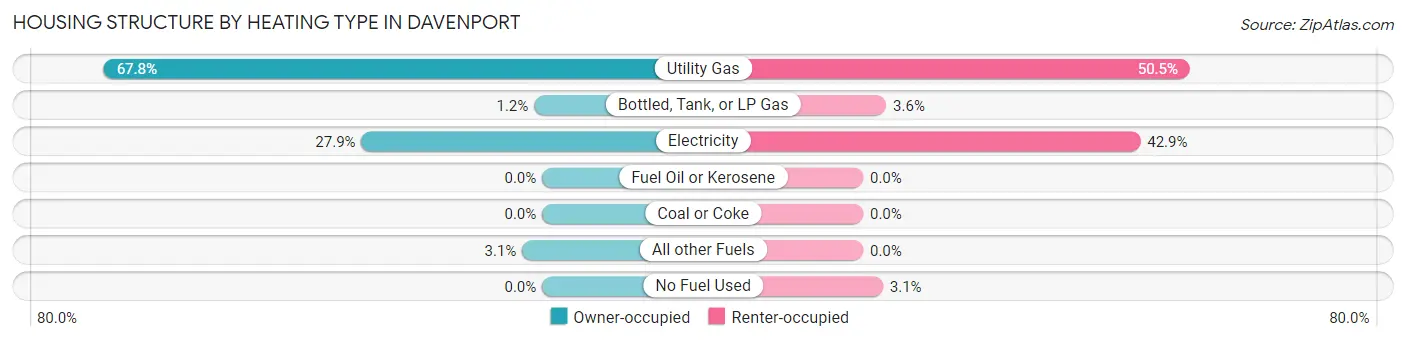
| Heating Type | Owner-occupied | Renter-occupied |
| Utility Gas | 330 (67.8%) | 99 (50.5%) |
| Bottled, Tank, or LP Gas | 6 (1.2%) | 7 (3.6%) |
| Electricity | 136 (27.9%) | 84 (42.9%) |
| Fuel Oil or Kerosene | 0 (0.0%) | 0 (0.0%) |
| Coal or Coke | 0 (0.0%) | 0 (0.0%) |
| All other Fuels | 15 (3.1%) | 0 (0.0%) |
| No Fuel Used | 0 (0.0%) | 6 (3.1%) |
| Total | 487 (100.0%) | 196 (100.0%) |
Household Vehicle Usage in Davenport
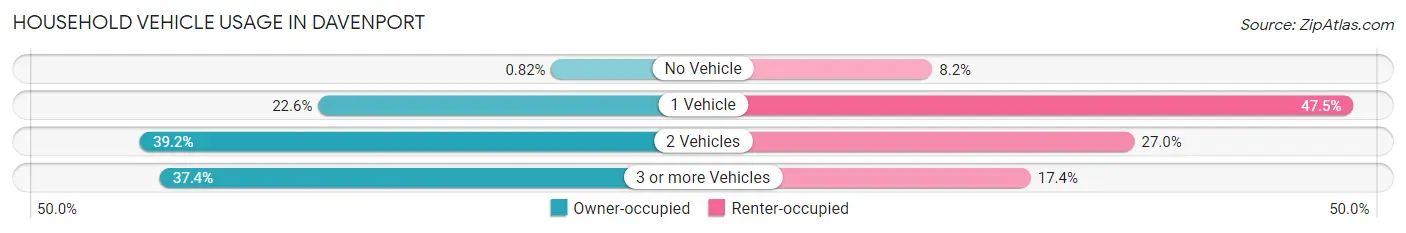
| Vehicles per Household | Owner-occupied | Renter-occupied |
| No Vehicle | 4 (0.8%) | 16 (8.2%) |
| 1 Vehicle | 110 (22.6%) | 93 (47.4%) |
| 2 Vehicles | 191 (39.2%) | 53 (27.0%) |
| 3 or more Vehicles | 182 (37.4%) | 34 (17.3%) |
| Total | 487 (100.0%) | 196 (100.0%) |
Real Estate & Mortgages in Davenport
Real Estate and Mortgage Overview in Davenport
| Characteristic | Without Mortgage | With Mortgage |
| Housing Units | 173 | 314 |
| Median Property Value | $288,400 | $198,100 |
| Median Household Income | $57,188 | $52 |
| Monthly Housing Costs | $541 | $6 |
| Real Estate Taxes | $1,927 | $7 |
Property Value by Mortgage Status in Davenport
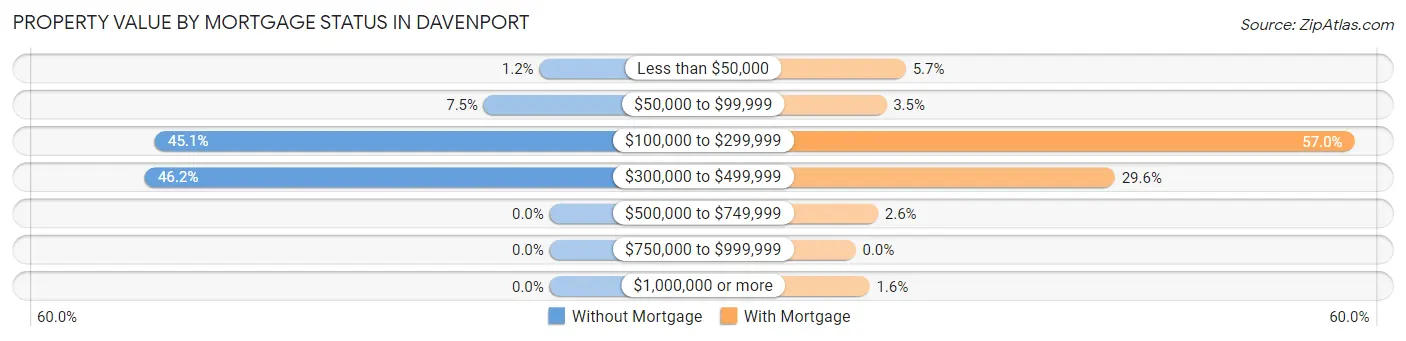
| Property Value | Without Mortgage | With Mortgage |
| Less than $50,000 | 2 (1.2%) | 18 (5.7%) |
| $50,000 to $99,999 | 13 (7.5%) | 11 (3.5%) |
| $100,000 to $299,999 | 78 (45.1%) | 179 (57.0%) |
| $300,000 to $499,999 | 80 (46.2%) | 93 (29.6%) |
| $500,000 to $749,999 | 0 (0.0%) | 8 (2.5%) |
| $750,000 to $999,999 | 0 (0.0%) | 0 (0.0%) |
| $1,000,000 or more | 0 (0.0%) | 5 (1.6%) |
| Total | 173 (100.0%) | 314 (100.0%) |
Household Income by Mortgage Status in Davenport
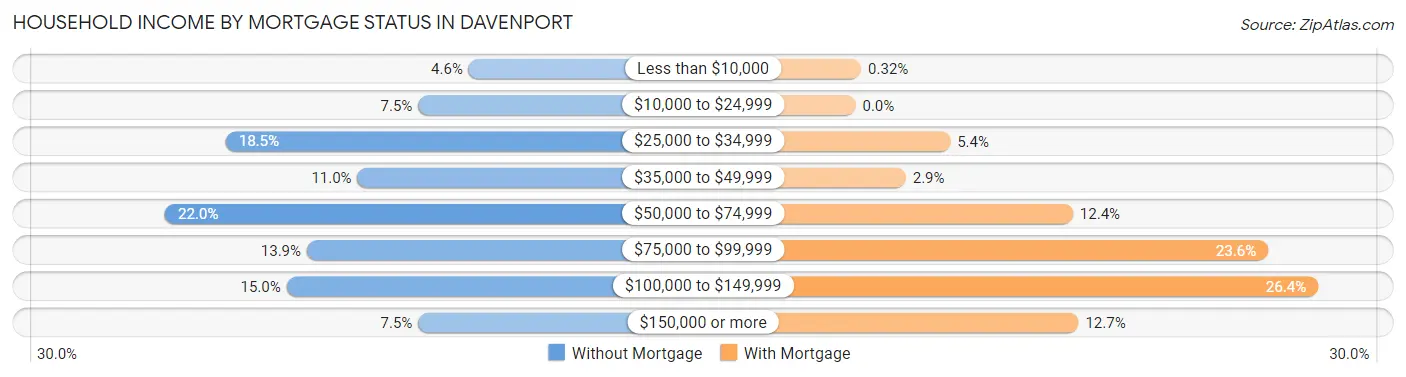
| Household Income | Without Mortgage | With Mortgage |
| Less than $10,000 | 8 (4.6%) | 1 (0.3%) |
| $10,000 to $24,999 | 13 (7.5%) | 0 (0.0%) |
| $25,000 to $34,999 | 32 (18.5%) | 17 (5.4%) |
| $35,000 to $49,999 | 19 (11.0%) | 9 (2.9%) |
| $50,000 to $74,999 | 38 (22.0%) | 39 (12.4%) |
| $75,000 to $99,999 | 24 (13.9%) | 74 (23.6%) |
| $100,000 to $149,999 | 26 (15.0%) | 83 (26.4%) |
| $150,000 or more | 13 (7.5%) | 40 (12.7%) |
| Total | 173 (100.0%) | 314 (100.0%) |
Property Value to Household Income Ratio in Davenport
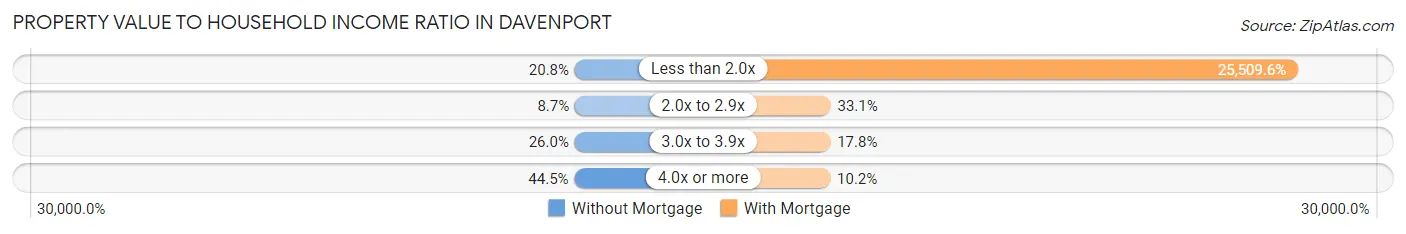
| Value-to-Income Ratio | Without Mortgage | With Mortgage |
| Less than 2.0x | 36 (20.8%) | 80,100 (25,509.5%) |
| 2.0x to 2.9x | 15 (8.7%) | 104 (33.1%) |
| 3.0x to 3.9x | 45 (26.0%) | 56 (17.8%) |
| 4.0x or more | 77 (44.5%) | 32 (10.2%) |
| Total | 173 (100.0%) | 314 (100.0%) |
Real Estate Taxes by Mortgage Status in Davenport
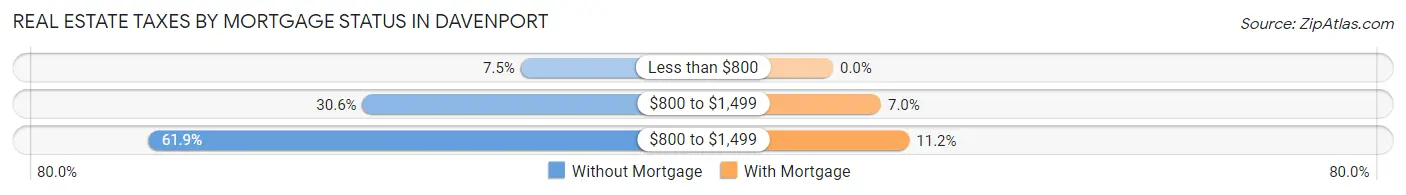
| Property Taxes | Without Mortgage | With Mortgage |
| Less than $800 | 13 (7.5%) | 0 (0.0%) |
| $800 to $1,499 | 53 (30.6%) | 22 (7.0%) |
| $800 to $1,499 | 107 (61.9%) | 35 (11.2%) |
| Total | 173 (100.0%) | 314 (100.0%) |
Health & Disability in Davenport
Health Insurance Coverage by Age in Davenport
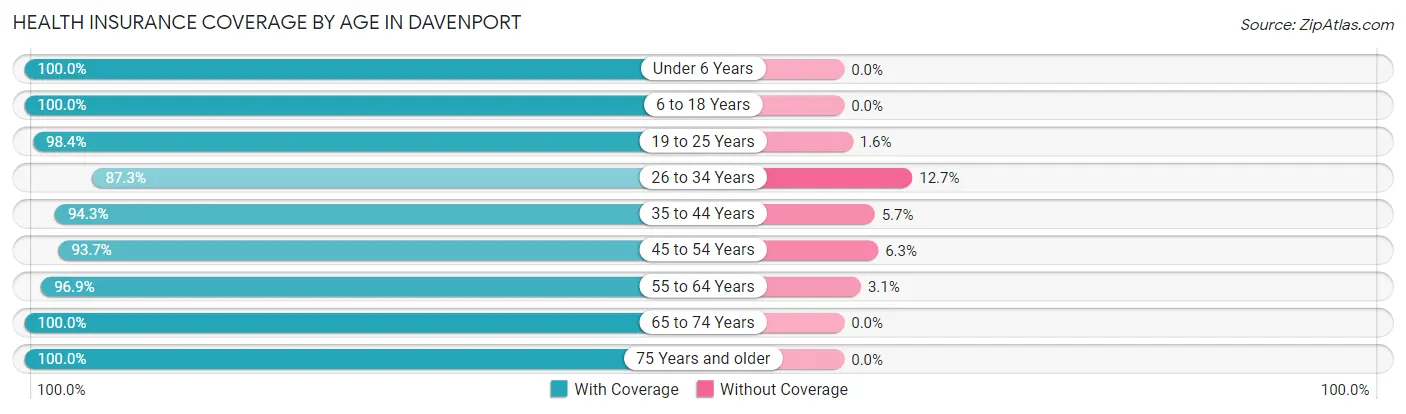
| Age Bracket | With Coverage | Without Coverage |
| Under 6 Years | 187 (100.0%) | 0 (0.0%) |
| 6 to 18 Years | 354 (100.0%) | 0 (0.0%) |
| 19 to 25 Years | 187 (98.4%) | 3 (1.6%) |
| 26 to 34 Years | 124 (87.3%) | 18 (12.7%) |
| 35 to 44 Years | 233 (94.3%) | 14 (5.7%) |
| 45 to 54 Years | 178 (93.7%) | 12 (6.3%) |
| 55 to 64 Years | 156 (96.9%) | 5 (3.1%) |
| 65 to 74 Years | 241 (100.0%) | 0 (0.0%) |
| 75 Years and older | 105 (100.0%) | 0 (0.0%) |
| Total | 1,765 (97.1%) | 52 (2.9%) |
Health Insurance Coverage by Citizenship Status in Davenport
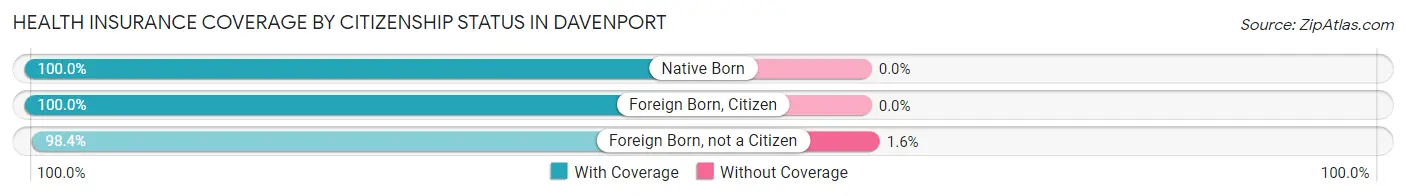
| Citizenship Status | With Coverage | Without Coverage |
| Native Born | 187 (100.0%) | 0 (0.0%) |
| Foreign Born, Citizen | 354 (100.0%) | 0 (0.0%) |
| Foreign Born, not a Citizen | 187 (98.4%) | 3 (1.6%) |
Health Insurance Coverage by Household Income in Davenport
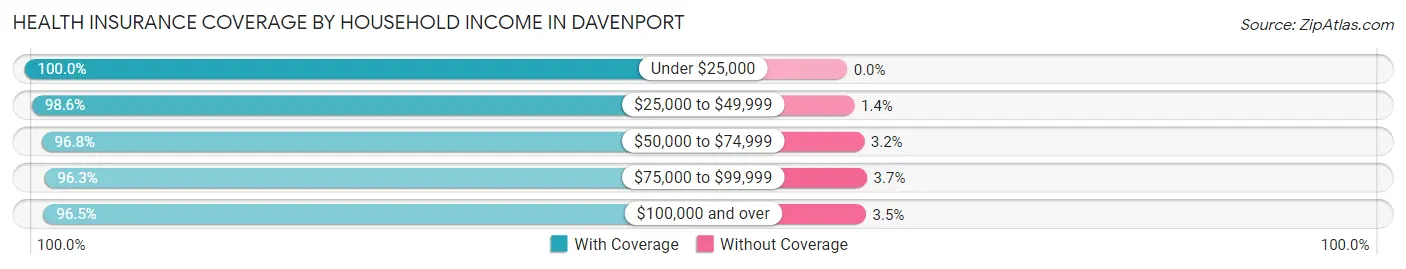
| Household Income | With Coverage | Without Coverage |
| Under $25,000 | 153 (100.0%) | 0 (0.0%) |
| $25,000 to $49,999 | 289 (98.6%) | 4 (1.4%) |
| $50,000 to $74,999 | 333 (96.8%) | 11 (3.2%) |
| $75,000 to $99,999 | 543 (96.3%) | 21 (3.7%) |
| $100,000 and over | 437 (96.5%) | 16 (3.5%) |
Public vs Private Health Insurance Coverage by Age in Davenport
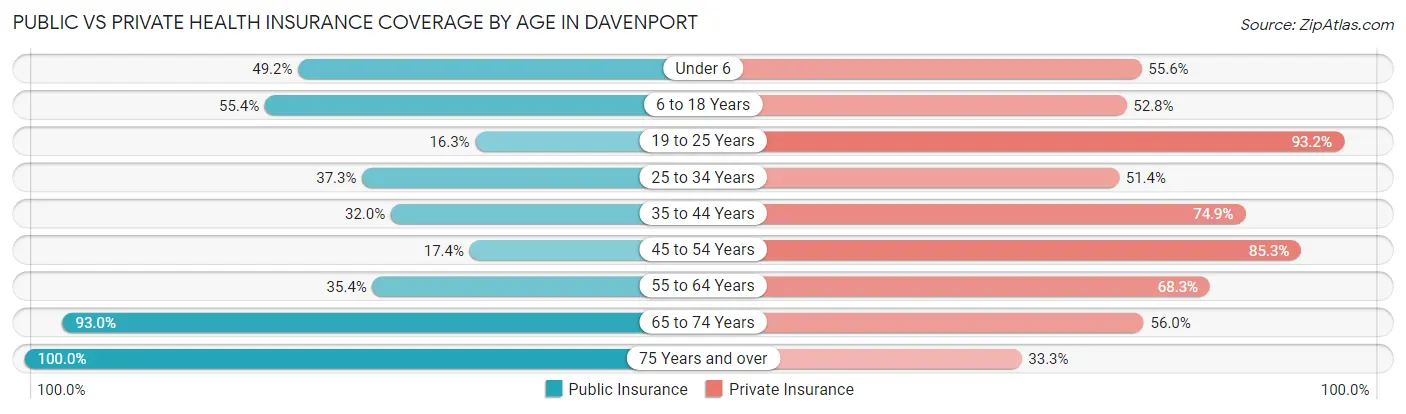
| Age Bracket | Public Insurance | Private Insurance |
| Under 6 | 92 (49.2%) | 104 (55.6%) |
| 6 to 18 Years | 196 (55.4%) | 187 (52.8%) |
| 19 to 25 Years | 31 (16.3%) | 177 (93.2%) |
| 25 to 34 Years | 53 (37.3%) | 73 (51.4%) |
| 35 to 44 Years | 79 (32.0%) | 185 (74.9%) |
| 45 to 54 Years | 33 (17.4%) | 162 (85.3%) |
| 55 to 64 Years | 57 (35.4%) | 110 (68.3%) |
| 65 to 74 Years | 224 (92.9%) | 135 (56.0%) |
| 75 Years and over | 105 (100.0%) | 35 (33.3%) |
| Total | 870 (47.9%) | 1,168 (64.3%) |
Disability Status by Sex by Age in Davenport
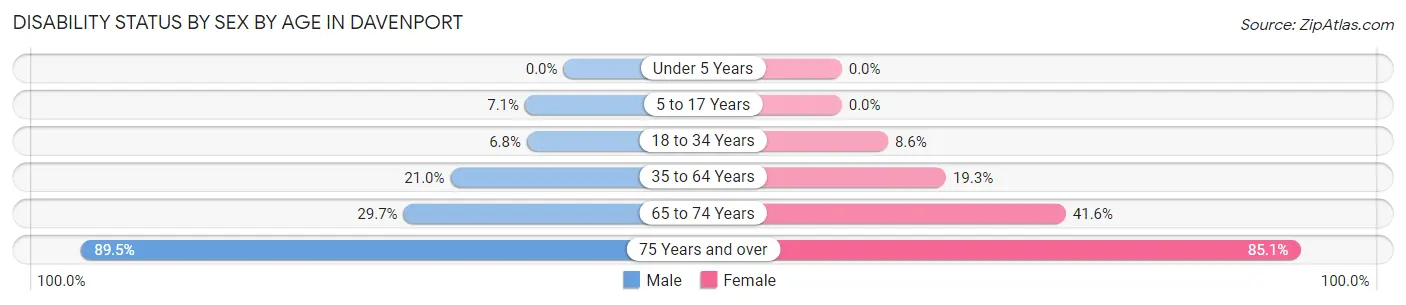
| Age Bracket | Male | Female |
| Under 5 Years | 0 (0.0%) | 0 (0.0%) |
| 5 to 17 Years | 14 (7.1%) | 0 (0.0%) |
| 18 to 34 Years | 12 (6.8%) | 18 (8.6%) |
| 35 to 64 Years | 56 (21.0%) | 64 (19.3%) |
| 65 to 74 Years | 38 (29.7%) | 47 (41.6%) |
| 75 Years and over | 34 (89.5%) | 57 (85.1%) |
Disability Class by Sex by Age in Davenport
Disability Class: Hearing Difficulty
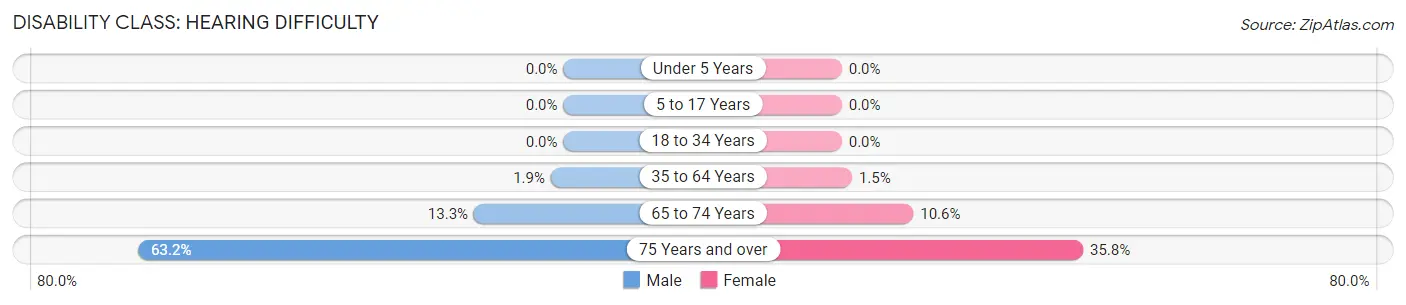
| Age Bracket | Male | Female |
| Under 5 Years | 0 (0.0%) | 0 (0.0%) |
| 5 to 17 Years | 0 (0.0%) | 0 (0.0%) |
| 18 to 34 Years | 0 (0.0%) | 0 (0.0%) |
| 35 to 64 Years | 5 (1.9%) | 5 (1.5%) |
| 65 to 74 Years | 17 (13.3%) | 12 (10.6%) |
| 75 Years and over | 24 (63.2%) | 24 (35.8%) |
Disability Class: Vision Difficulty
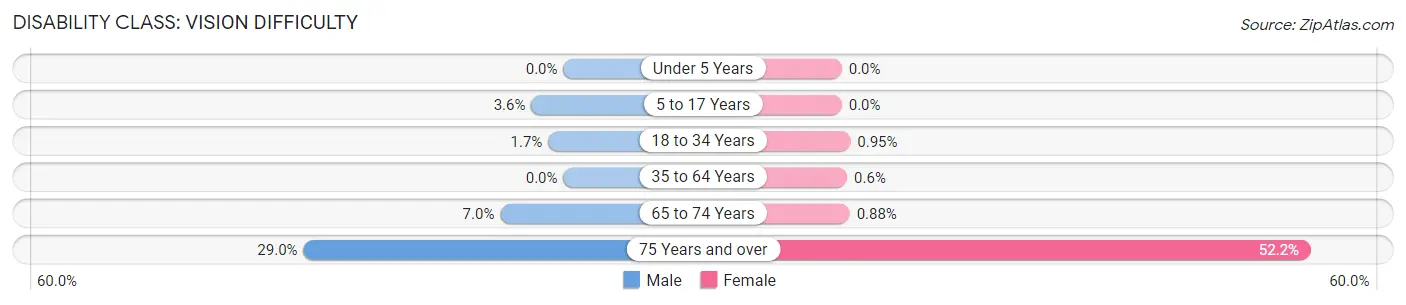
| Age Bracket | Male | Female |
| Under 5 Years | 0 (0.0%) | 0 (0.0%) |
| 5 to 17 Years | 7 (3.6%) | 0 (0.0%) |
| 18 to 34 Years | 3 (1.7%) | 2 (0.9%) |
| 35 to 64 Years | 0 (0.0%) | 2 (0.6%) |
| 65 to 74 Years | 9 (7.0%) | 1 (0.9%) |
| 75 Years and over | 11 (28.9%) | 35 (52.2%) |
Disability Class: Cognitive Difficulty
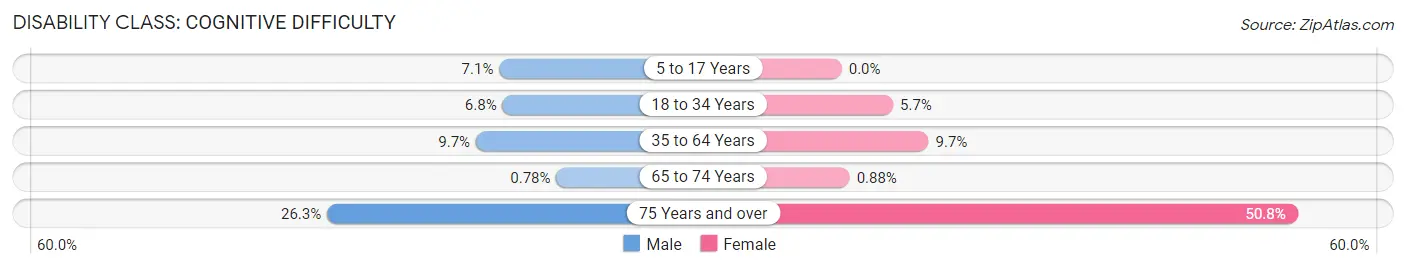
| Age Bracket | Male | Female |
| 5 to 17 Years | 14 (7.1%) | 0 (0.0%) |
| 18 to 34 Years | 12 (6.8%) | 12 (5.7%) |
| 35 to 64 Years | 26 (9.7%) | 32 (9.7%) |
| 65 to 74 Years | 1 (0.8%) | 1 (0.9%) |
| 75 Years and over | 10 (26.3%) | 34 (50.7%) |
Disability Class: Ambulatory Difficulty
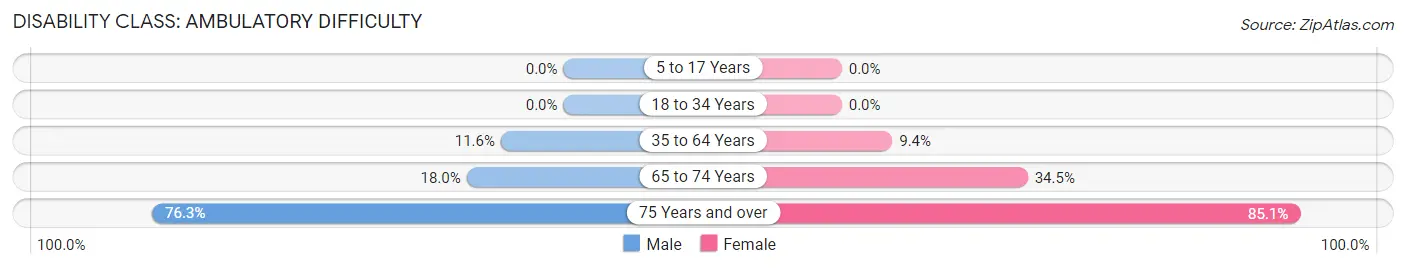
| Age Bracket | Male | Female |
| 5 to 17 Years | 0 (0.0%) | 0 (0.0%) |
| 18 to 34 Years | 0 (0.0%) | 0 (0.0%) |
| 35 to 64 Years | 31 (11.6%) | 31 (9.4%) |
| 65 to 74 Years | 23 (18.0%) | 39 (34.5%) |
| 75 Years and over | 29 (76.3%) | 57 (85.1%) |
Disability Class: Self-Care Difficulty
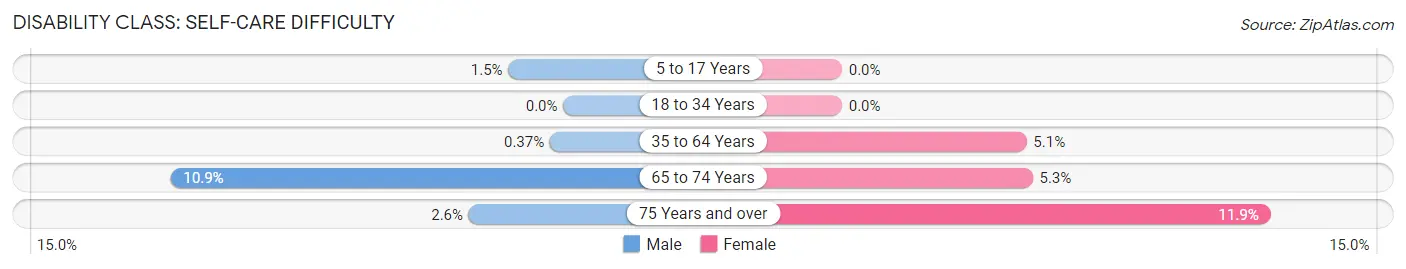
| Age Bracket | Male | Female |
| 5 to 17 Years | 3 (1.5%) | 0 (0.0%) |
| 18 to 34 Years | 0 (0.0%) | 0 (0.0%) |
| 35 to 64 Years | 1 (0.4%) | 17 (5.1%) |
| 65 to 74 Years | 14 (10.9%) | 6 (5.3%) |
| 75 Years and over | 1 (2.6%) | 8 (11.9%) |
Technology Access in Davenport
Computing Device Access in Davenport
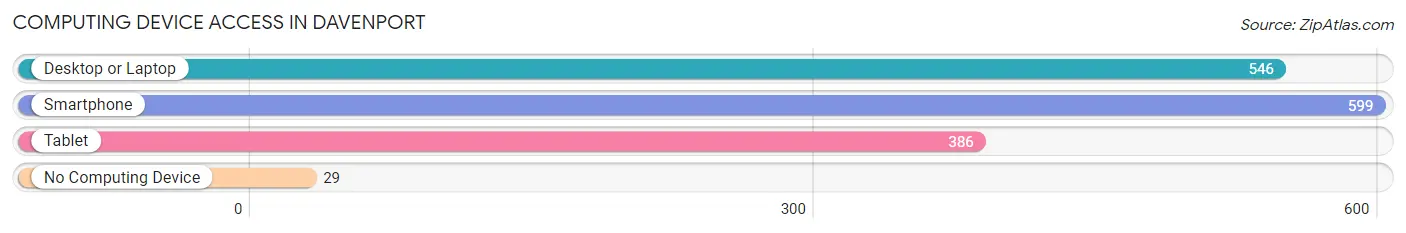
| Device Type | # Households | % Households |
| Desktop or Laptop | 546 | 79.9% |
| Smartphone | 599 | 87.7% |
| Tablet | 386 | 56.5% |
| No Computing Device | 29 | 4.3% |
| Total | 683 | 100.0% |
Internet Access in Davenport
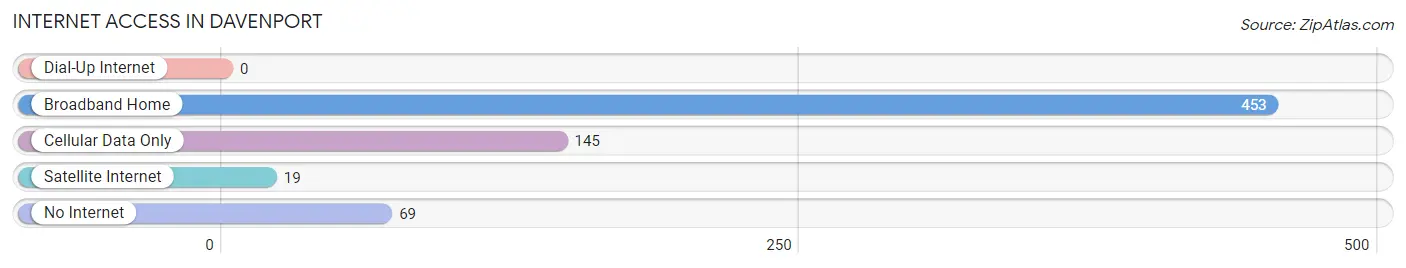
| Internet Type | # Households | % Households |
| Dial-Up Internet | 0 | 0.0% |
| Broadband Home | 453 | 66.3% |
| Cellular Data Only | 145 | 21.2% |
| Satellite Internet | 19 | 2.8% |
| No Internet | 69 | 10.1% |
| Total | 683 | 100.0% |
Davenport Summary
Davenport is a small city located in Lincoln County, Washington, United States. It is situated on the banks of the Columbia River, approximately 25 miles west of Spokane. The city has a population of approximately 2,500 people and is the county seat of Lincoln County.
History
The area that is now Davenport was first inhabited by the Spokane Tribe of Native Americans. The first white settlers arrived in the area in the late 1800s, and the town was officially incorporated in 1891. The town was named after the nearby Davenport Hotel, which was built in 1889.
The town was initially a farming and ranching community, but in the early 1900s, the economy shifted to focus on the mining and timber industries. The town was also home to a number of sawmills and lumber mills.
In the 1950s, the economy shifted again to focus on tourism and recreation. The town is now home to a number of tourist attractions, including the Lincoln County Historical Museum, the Davenport Hotel, and the Davenport Rodeo.
Geography
Davenport is located in the Columbia Plateau region of Washington State. The city is situated on the banks of the Columbia River, approximately 25 miles west of Spokane. The city is surrounded by rolling hills and is located at an elevation of 1,890 feet.
The climate in Davenport is semi-arid, with hot summers and cold winters. The average annual temperature is 48°F, and the average annual precipitation is 16 inches.
Economy
The economy of Davenport is largely based on tourism and recreation. The city is home to a number of tourist attractions, including the Lincoln County Historical Museum, the Davenport Hotel, and the Davenport Rodeo.
The city is also home to a number of businesses, including restaurants, retail stores, and service providers. The city is also home to a number of manufacturing companies, including a wood products plant and a metal fabrication plant.
Demographics
As of the 2010 census, the population of Davenport was 2,500. The racial makeup of the city was 94.2% White, 0.8% African American, 0.4% Native American, 0.4% Asian, 0.2% Pacific Islander, and 3.8% from other races. The median household income was $37,500, and the median family income was $45,000.
The city is served by the Davenport School District, which includes one elementary school, one middle school, and one high school. The city is also home to a number of churches, including the First Presbyterian Church, the First Baptist Church, and the Church of Jesus Christ of Latter-day Saints.
Common Questions
What is Per Capita Income in Davenport?
Per Capita income in Davenport is $30,297.
What is the Median Family Income in Davenport?
Median Family Income in Davenport is $72,500.
What is the Median Household income in Davenport?
Median Household Income in Davenport is $71,486.
What is Income or Wage Gap in Davenport?
Income or Wage Gap in Davenport is 19.3%.
Women in Davenport earn 80.7 cents for every dollar earned by a man.
What is Inequality or Gini Index in Davenport?
Inequality or Gini Index in Davenport is 0.37.
What is the Total Population of Davenport?
Total Population of Davenport is 1,850.
What is the Total Male Population of Davenport?
Total Male Population of Davenport is 928.
What is the Total Female Population of Davenport?
Total Female Population of Davenport is 922.
What is the Ratio of Males per 100 Females in Davenport?
There are 100.65 Males per 100 Females in Davenport.
What is the Ratio of Females per 100 Males in Davenport?
There are 99.35 Females per 100 Males in Davenport.
What is the Median Population Age in Davenport?
Median Population Age in Davenport is 36.2 Years.
What is the Average Family Size in Davenport
Average Family Size in Davenport is 3.3 People.
What is the Average Household Size in Davenport
Average Household Size in Davenport is 2.7 People.
How Large is the Labor Force in Davenport?
There are 779 People in the Labor Forcein in Davenport.
What is the Percentage of People in the Labor Force in Davenport?
54.6% of People are in the Labor Force in Davenport.
What is the Unemployment Rate in Davenport?
Unemployment Rate in Davenport is 5.6%.