Manson, WA Map & Demographics
Manson Map
Manson Overview
$40,039
PER CAPITA INCOME
$58,935
AVG FAMILY INCOME
$55,283
AVG HOUSEHOLD INCOME
31.6%
WAGE / INCOME GAP [ % ]
68.4¢/ $1
WAGE / INCOME GAP [ $ ]
0.53
INEQUALITY / GINI INDEX
1,385
TOTAL POPULATION
647
MALE POPULATION
738
FEMALE POPULATION
87.67
MALES / 100 FEMALES
114.06
FEMALES / 100 MALES
54.8
MEDIAN AGE
2.8
AVG FAMILY SIZE
2.2
AVG HOUSEHOLD SIZE
638
LABOR FORCE [ PEOPLE ]
50.7%
PERCENT IN LABOR FORCE
7.7%
UNEMPLOYMENT RATE
Manson Zip Codes
Manson Area Codes
Income in Manson
Income Overview in Manson
Per Capita Income in Manson is $40,039, while median incomes of families and households are $58,935 and $55,283 respectively.
| Characteristic | Number | Measure |
| Per Capita Income | 1,385 | $40,039 |
| Median Family Income | 321 | $58,935 |
| Mean Family Income | 321 | $99,825 |
| Median Household Income | 623 | $55,283 |
| Mean Household Income | 623 | $86,845 |
| Income Deficit | 321 | $0 |
| Wage / Income Gap (%) | 1,385 | 31.60% |
| Wage / Income Gap ($) | 1,385 | 68.40¢ per $1 |
| Gini / Inequality Index | 1,385 | 0.53 |
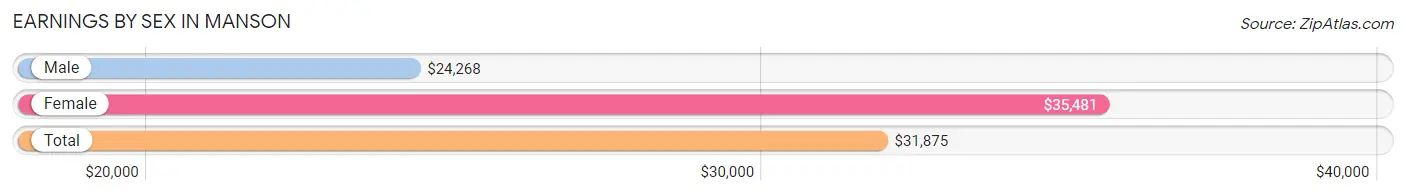
Earnings by Sex in Manson
Average Earnings in Manson are $31,875, $24,268 for men and $35,481 for women, a difference of 31.6%.
| Sex | Number | Average Earnings |
| Male | 362 (53.7%) | $24,268 |
| Female | 312 (46.3%) | $35,481 |
| Total | 674 (100.0%) | $31,875 |
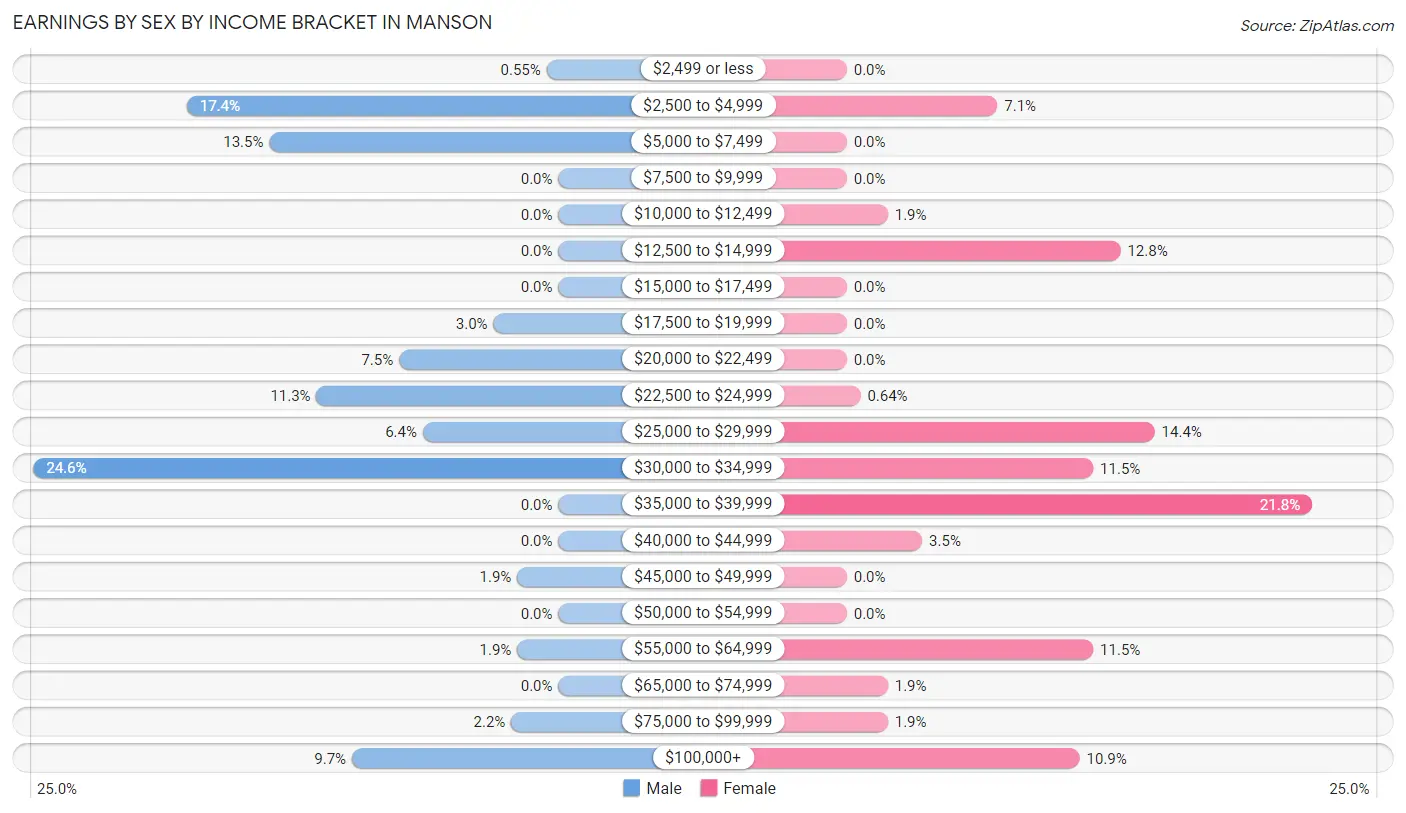
Earnings by Sex by Income Bracket in Manson
The most common earnings brackets in Manson are $30,000 to $34,999 for men (89 | 24.6%) and $35,000 to $39,999 for women (68 | 21.8%).
| Income | Male | Female |
| $2,499 or less | 2 (0.5%) | 0 (0.0%) |
| $2,500 to $4,999 | 63 (17.4%) | 22 (7.0%) |
| $5,000 to $7,499 | 49 (13.5%) | 0 (0.0%) |
| $7,500 to $9,999 | 0 (0.0%) | 0 (0.0%) |
| $10,000 to $12,499 | 0 (0.0%) | 6 (1.9%) |
| $12,500 to $14,999 | 0 (0.0%) | 40 (12.8%) |
| $15,000 to $17,499 | 0 (0.0%) | 0 (0.0%) |
| $17,500 to $19,999 | 11 (3.0%) | 0 (0.0%) |
| $20,000 to $22,499 | 27 (7.5%) | 0 (0.0%) |
| $22,500 to $24,999 | 41 (11.3%) | 2 (0.6%) |
| $25,000 to $29,999 | 23 (6.4%) | 45 (14.4%) |
| $30,000 to $34,999 | 89 (24.6%) | 36 (11.5%) |
| $35,000 to $39,999 | 0 (0.0%) | 68 (21.8%) |
| $40,000 to $44,999 | 0 (0.0%) | 11 (3.5%) |
| $45,000 to $49,999 | 7 (1.9%) | 0 (0.0%) |
| $50,000 to $54,999 | 0 (0.0%) | 0 (0.0%) |
| $55,000 to $64,999 | 7 (1.9%) | 36 (11.5%) |
| $65,000 to $74,999 | 0 (0.0%) | 6 (1.9%) |
| $75,000 to $99,999 | 8 (2.2%) | 6 (1.9%) |
| $100,000+ | 35 (9.7%) | 34 (10.9%) |
| Total | 362 (100.0%) | 312 (100.0%) |
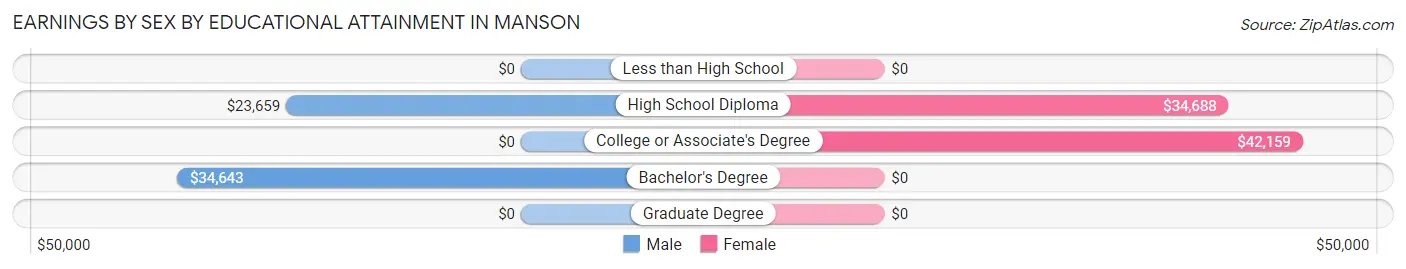
Earnings by Sex by Educational Attainment in Manson
Average earnings in Manson are $27,609 for men and $36,827 for women, a difference of 25.0%. Men with an educational attainment of bachelor's degree enjoy the highest average annual earnings of $34,643, while those with high school diploma education earn the least with $23,659. Women with an educational attainment of college or associate's degree earn the most with the average annual earnings of $42,159, while those with high school diploma education have the smallest earnings of $34,688.
| Educational Attainment | Male Income | Female Income |
| Less than High School | - | - |
| High School Diploma | $23,659 | $34,688 |
| College or Associate's Degree | - | - |
| Bachelor's Degree | $34,643 | $0 |
| Graduate Degree | - | - |
| Total | $27,609 | $36,827 |
Family Income in Manson
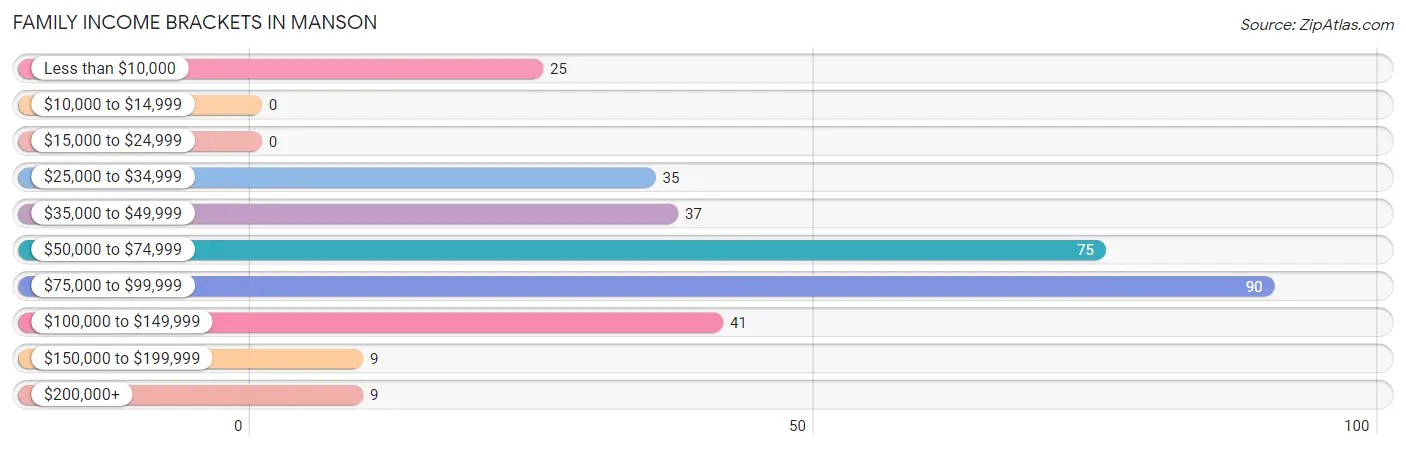
Family Income Brackets in Manson
According to the Manson family income data, there are 90 families falling into the $75,000 to $99,999 income range, which is the most common income bracket and makes up 28.0% of all families.
| Income Bracket | # Families | % Families |
| Less than $10,000 | 25 | 7.8% |
| $10,000 to $14,999 | 0 | 0.0% |
| $15,000 to $24,999 | 0 | 0.0% |
| $25,000 to $34,999 | 35 | 10.9% |
| $35,000 to $49,999 | 37 | 11.5% |
| $50,000 to $74,999 | 75 | 23.4% |
| $75,000 to $99,999 | 90 | 28.0% |
| $100,000 to $149,999 | 41 | 12.8% |
| $150,000 to $199,999 | 9 | 2.8% |
| $200,000+ | 9 | 2.8% |
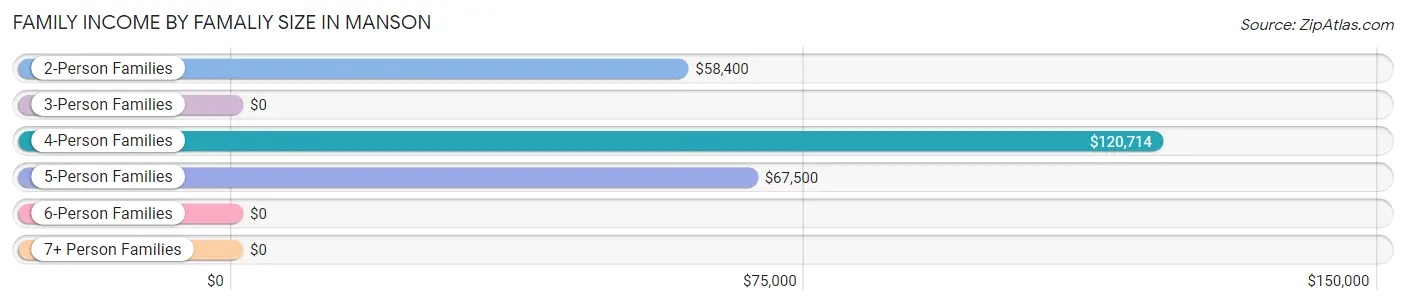
Family Income by Famaliy Size in Manson
4-person families (20 | 6.2%) account for the highest median family income in Manson with $120,714 per family, while 4-person families (20 | 6.2%) have the highest median income of $30,178 per family member.
| Income Bracket | # Families | Median Income |
| 2-Person Families | 216 (67.3%) | $58,400 |
| 3-Person Families | 41 (12.8%) | $0 |
| 4-Person Families | 20 (6.2%) | $120,714 |
| 5-Person Families | 44 (13.7%) | $67,500 |
| 6-Person Families | 0 (0.0%) | $0 |
| 7+ Person Families | 0 (0.0%) | $0 |
| Total | 321 (100.0%) | $58,935 |
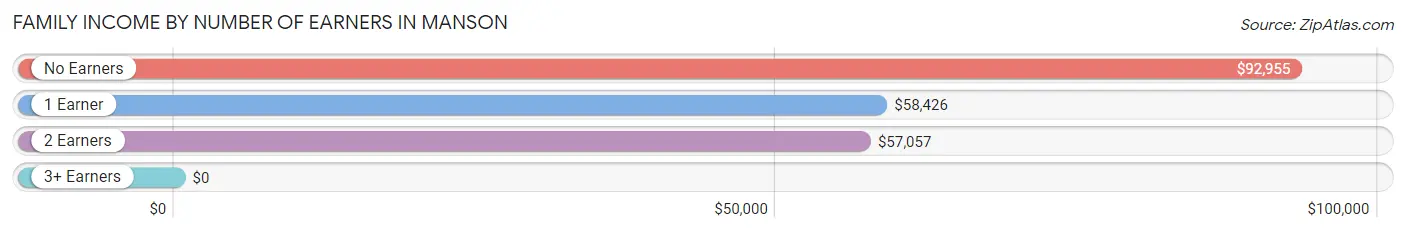
Family Income by Number of Earners in Manson
| Number of Earners | # Families | Median Income |
| No Earners | 116 (36.1%) | $92,955 |
| 1 Earner | 72 (22.4%) | $58,426 |
| 2 Earners | 117 (36.4%) | $57,057 |
| 3+ Earners | 16 (5.0%) | $0 |
| Total | 321 (100.0%) | $58,935 |
Household Income in Manson
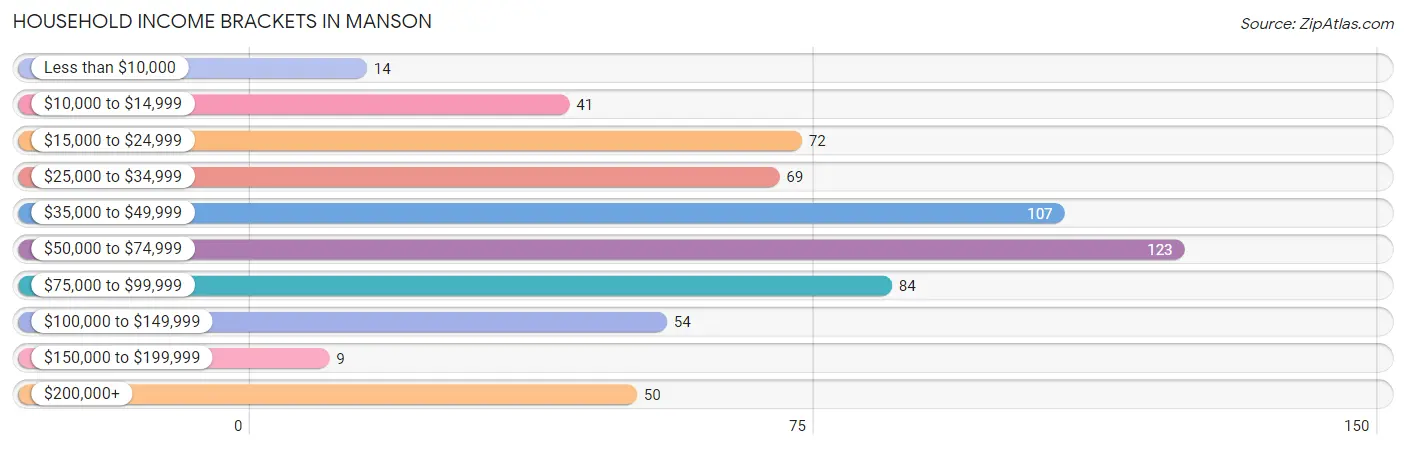
Household Income Brackets in Manson
With 123 households falling in the category, the $50,000 to $74,999 income range is the most frequent in Manson, accounting for 19.7% of all households. In contrast, only 9 households (1.4%) fall into the $150,000 to $199,999 income bracket, making it the least populous group.
| Income Bracket | # Households | % Households |
| Less than $10,000 | 14 | 2.2% |
| $10,000 to $14,999 | 41 | 6.6% |
| $15,000 to $24,999 | 72 | 11.6% |
| $25,000 to $34,999 | 69 | 11.1% |
| $35,000 to $49,999 | 107 | 17.2% |
| $50,000 to $74,999 | 123 | 19.7% |
| $75,000 to $99,999 | 84 | 13.5% |
| $100,000 to $149,999 | 54 | 8.7% |
| $150,000 to $199,999 | 9 | 1.4% |
| $200,000+ | 50 | 8.0% |
Household Income by Householder Age in Manson
The median household income in Manson is $55,283, with the highest median household income of $57,031 found in the 45 to 64 years age bracket for the primary householder. A total of 246 households (39.5%) fall into this category. Meanwhile, the 15 to 24 years age bracket for the primary householder has the lowest median household income of $0, with 21 households (3.4%) in this group.
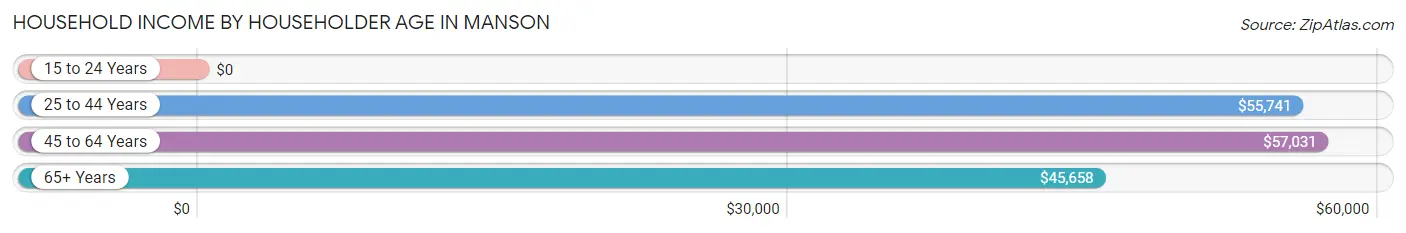
| Income Bracket | # Households | Median Income |
| 15 to 24 Years | 21 (3.4%) | $0 |
| 25 to 44 Years | 64 (10.3%) | $55,741 |
| 45 to 64 Years | 246 (39.5%) | $57,031 |
| 65+ Years | 292 (46.9%) | $45,658 |
| Total | 623 (100.0%) | $55,283 |
Poverty in Manson
Income Below Poverty by Sex and Age in Manson
With 19.9% poverty level for males and 3.0% for females among the residents of Manson, 45 to 54 year old males and 65 to 74 year old females are the most vulnerable to poverty, with 81 males (66.4%) and 22 females (21.6%) in their respective age groups living below the poverty level.
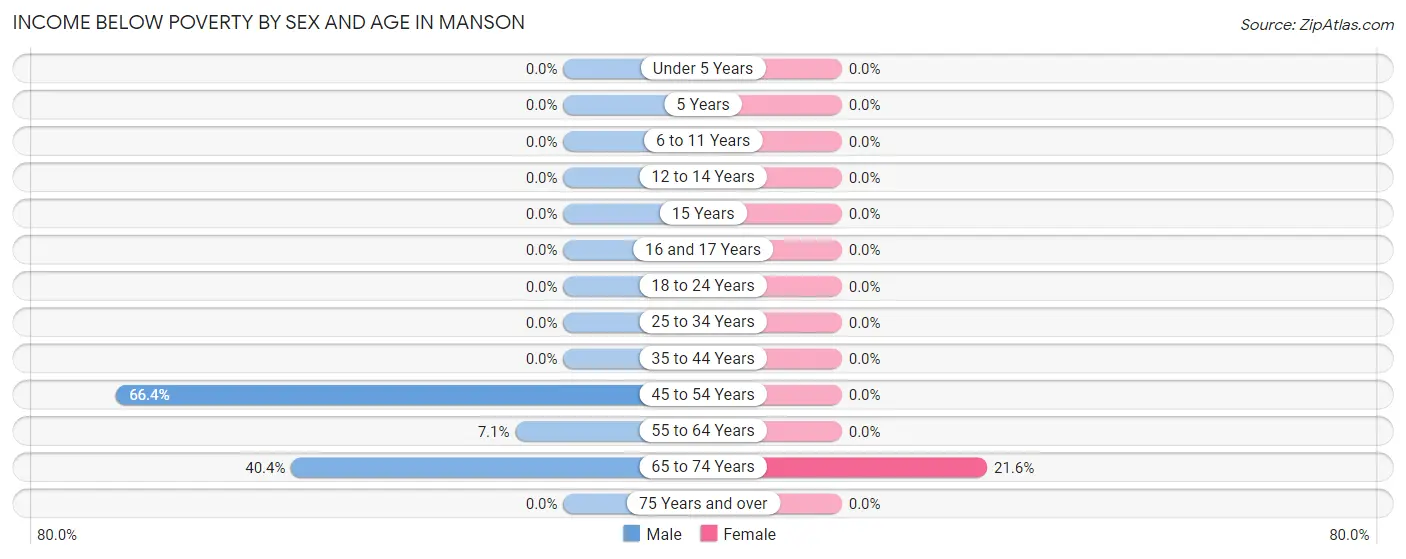
| Age Bracket | Male | Female |
| Under 5 Years | 0 (0.0%) | 0 (0.0%) |
| 5 Years | 0 (0.0%) | 0 (0.0%) |
| 6 to 11 Years | 0 (0.0%) | 0 (0.0%) |
| 12 to 14 Years | 0 (0.0%) | 0 (0.0%) |
| 15 Years | 0 (0.0%) | 0 (0.0%) |
| 16 and 17 Years | 0 (0.0%) | 0 (0.0%) |
| 18 to 24 Years | 0 (0.0%) | 0 (0.0%) |
| 25 to 34 Years | 0 (0.0%) | 0 (0.0%) |
| 35 to 44 Years | 0 (0.0%) | 0 (0.0%) |
| 45 to 54 Years | 81 (66.4%) | 0 (0.0%) |
| 55 to 64 Years | 8 (7.1%) | 0 (0.0%) |
| 65 to 74 Years | 40 (40.4%) | 22 (21.6%) |
| 75 Years and over | 0 (0.0%) | 0 (0.0%) |
| Total | 129 (19.9%) | 22 (3.0%) |
Income Above Poverty by Sex and Age in Manson
According to the poverty statistics in Manson, males aged 12 to 14 years and females aged under 5 years are the age groups that are most secure financially, with 100.0% of males and 100.0% of females in these age groups living above the poverty line.
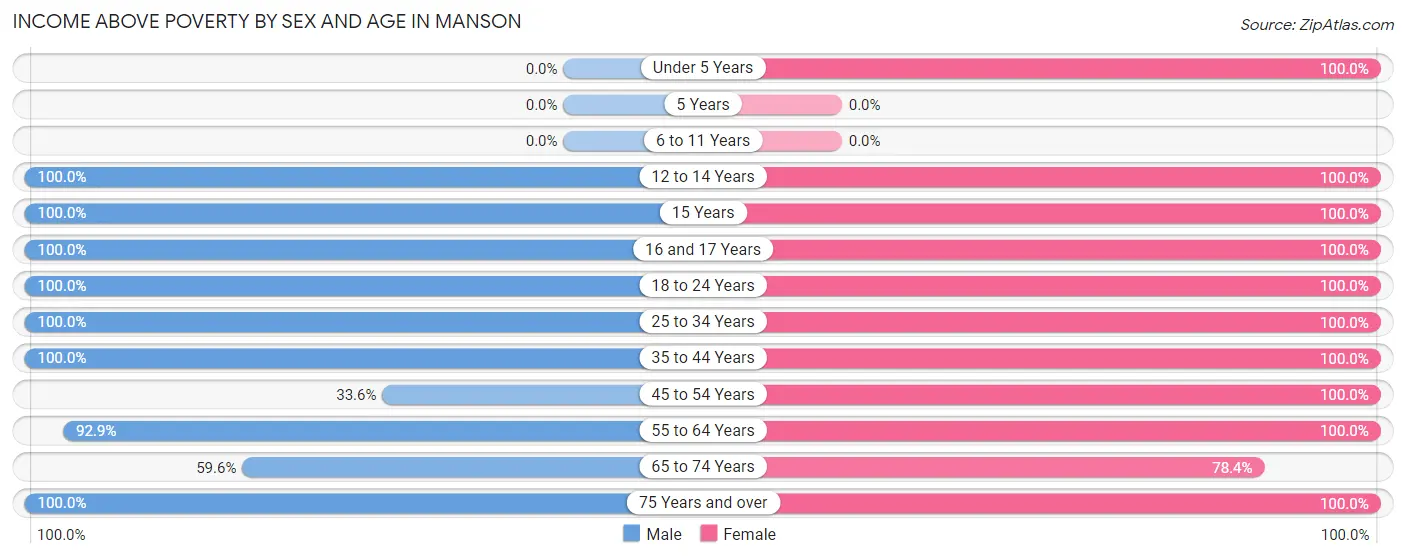
| Age Bracket | Male | Female |
| Under 5 Years | 0 (0.0%) | 13 (100.0%) |
| 5 Years | 0 (0.0%) | 0 (0.0%) |
| 6 to 11 Years | 0 (0.0%) | 0 (0.0%) |
| 12 to 14 Years | 33 (100.0%) | 54 (100.0%) |
| 15 Years | 11 (100.0%) | 12 (100.0%) |
| 16 and 17 Years | 29 (100.0%) | 19 (100.0%) |
| 18 to 24 Years | 125 (100.0%) | 59 (100.0%) |
| 25 to 34 Years | 48 (100.0%) | 33 (100.0%) |
| 35 to 44 Years | 8 (100.0%) | 55 (100.0%) |
| 45 to 54 Years | 41 (33.6%) | 85 (100.0%) |
| 55 to 64 Years | 104 (92.9%) | 139 (100.0%) |
| 65 to 74 Years | 59 (59.6%) | 80 (78.4%) |
| 75 Years and over | 60 (100.0%) | 164 (100.0%) |
| Total | 518 (80.1%) | 713 (97.0%) |
Income Below Poverty Among Married-Couple Families in Manson
The poverty statistics for married-couple families in Manson show that 9.4% or 25 of the total 266 families live below the poverty line. Families with no children have the highest poverty rate of 13.0%, comprising of 25 families. On the other hand, families with 1 or 2 children have the lowest poverty rate of 0.0%, which includes 0 families.
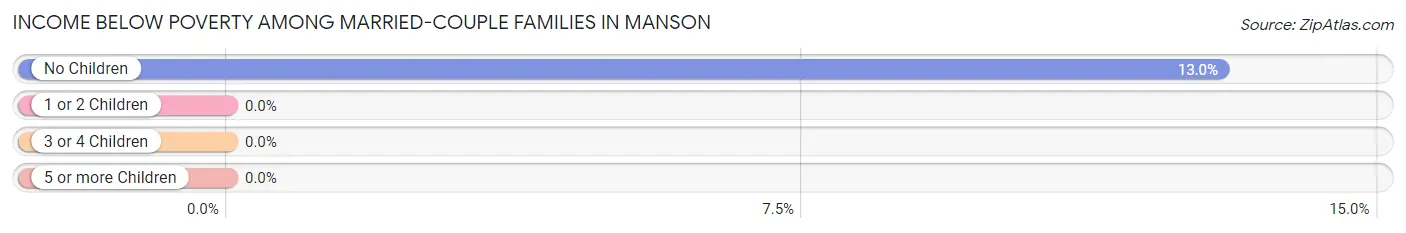
| Children | Above Poverty | Below Poverty |
| No Children | 168 (87.1%) | 25 (13.0%) |
| 1 or 2 Children | 73 (100.0%) | 0 (0.0%) |
| 3 or 4 Children | 0 (0.0%) | 0 (0.0%) |
| 5 or more Children | 0 (0.0%) | 0 (0.0%) |
| Total | 241 (90.6%) | 25 (9.4%) |
Income Below Poverty Among Single-Parent Households in Manson
| Children | Single Father | Single Mother |
| No Children | 0 (0.0%) | 0 (0.0%) |
| 1 or 2 Children | 0 (0.0%) | 0 (0.0%) |
| 3 or 4 Children | 0 (0.0%) | 0 (0.0%) |
| 5 or more Children | 0 (0.0%) | 0 (0.0%) |
| Total | 0 (0.0%) | 0 (0.0%) |
Income Below Poverty Among Married-Couple vs Single-Parent Households in Manson
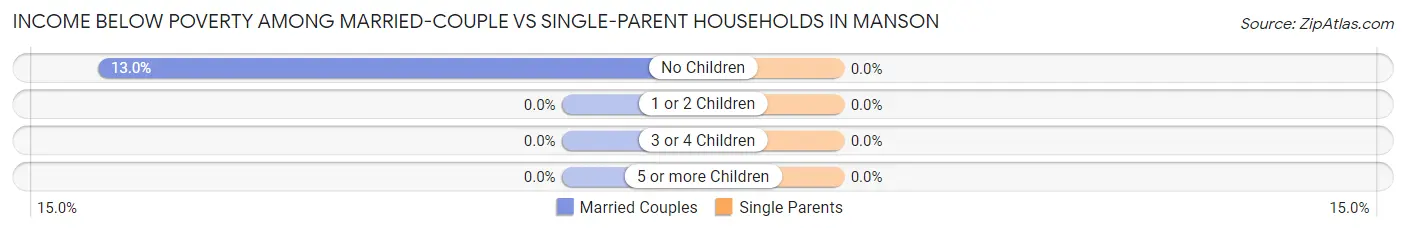
| Children | Married-Couple Families | Single-Parent Households |
| No Children | 25 (13.0%) | 0 (0.0%) |
| 1 or 2 Children | 0 (0.0%) | 0 (0.0%) |
| 3 or 4 Children | 0 (0.0%) | 0 (0.0%) |
| 5 or more Children | 0 (0.0%) | 0 (0.0%) |
| Total | 25 (9.4%) | 0 (0.0%) |
Race in Manson
The most populous races in Manson are White / Caucasian (1,003 | 72.4%), Hispanic or Latino (427 | 30.8%), and Some other Race (357 | 25.8%).
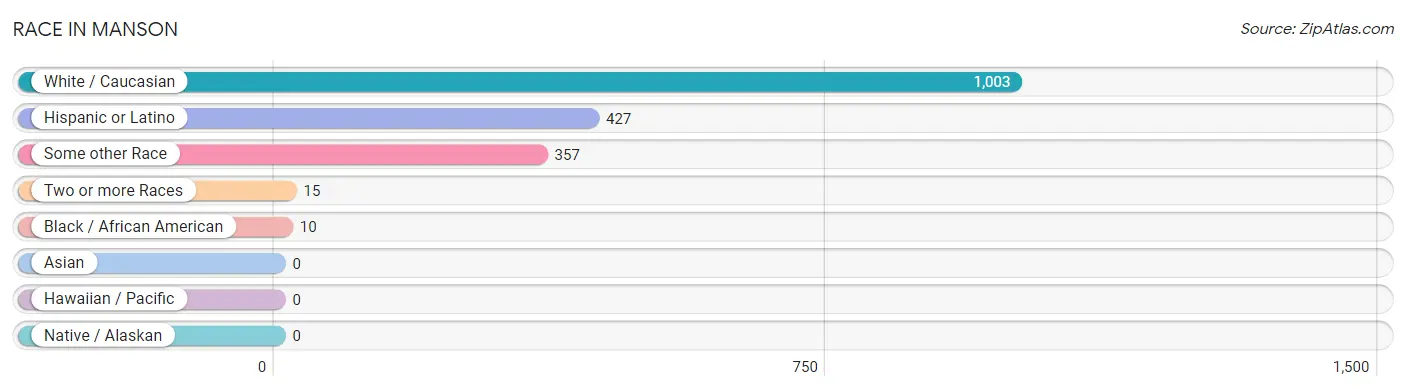
| Race | # Population | % Population |
| Asian | 0 | 0.0% |
| Black / African American | 10 | 0.7% |
| Hawaiian / Pacific | 0 | 0.0% |
| Hispanic or Latino | 427 | 30.8% |
| Native / Alaskan | 0 | 0.0% |
| White / Caucasian | 1,003 | 72.4% |
| Two or more Races | 15 | 1.1% |
| Some other Race | 357 | 25.8% |
| Total | 1,385 | 100.0% |
Ancestry in Manson
The most populous ancestries reported in Manson are Mexican (427 | 30.8%), German (198 | 14.3%), Norwegian (134 | 9.7%), Irish (106 | 7.6%), and English (60 | 4.3%), together accounting for 66.8% of all Manson residents.
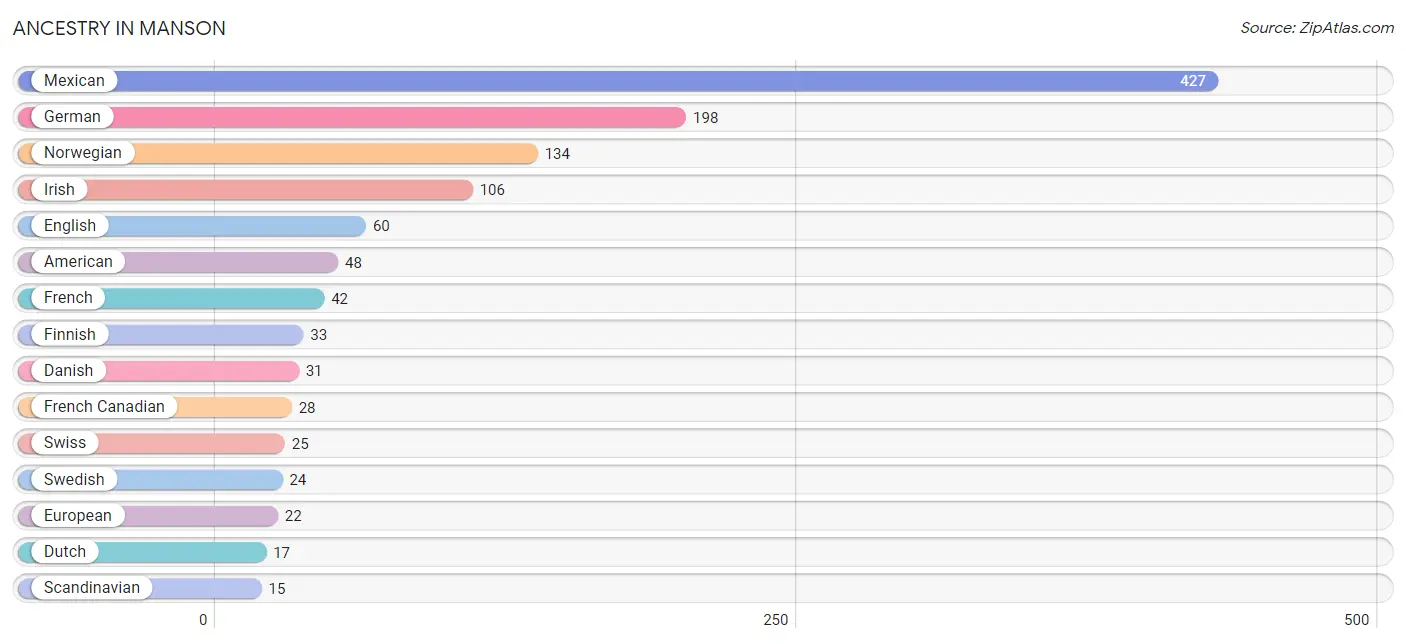
| Ancestry | # Population | % Population |
| American | 48 | 3.5% |
| Armenian | 8 | 0.6% |
| Austrian | 8 | 0.6% |
| Canadian | 9 | 0.6% |
| Danish | 31 | 2.2% |
| Dutch | 17 | 1.2% |
| English | 60 | 4.3% |
| European | 22 | 1.6% |
| Finnish | 33 | 2.4% |
| French | 42 | 3.0% |
| French Canadian | 28 | 2.0% |
| German | 198 | 14.3% |
| Indian (Asian) | 7 | 0.5% |
| Irish | 106 | 7.6% |
| Mexican | 427 | 30.8% |
| Norwegian | 134 | 9.7% |
| Scandinavian | 15 | 1.1% |
| Scottish | 11 | 0.8% |
| Swedish | 24 | 1.7% |
| Swiss | 25 | 1.8% |
| Welsh | 9 | 0.6% | View All 21 Rows |
Immigrants in Manson
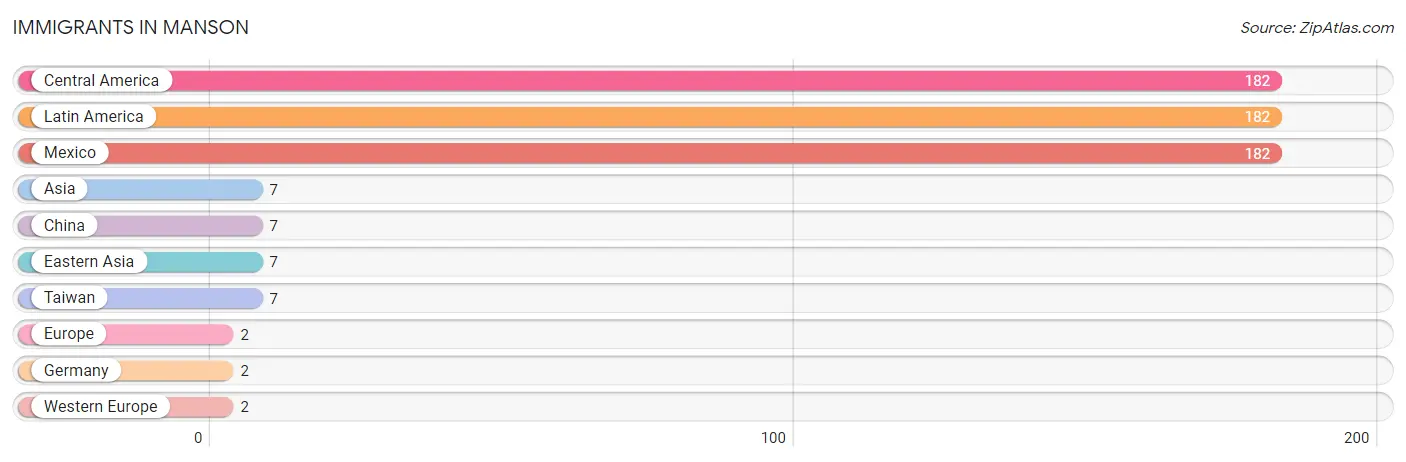
The most numerous immigrant groups reported in Manson came from Central America (182 | 13.1%), Latin America (182 | 13.1%), Mexico (182 | 13.1%), Asia (7 | 0.5%), and China (7 | 0.5%), together accounting for 40.4% of all Manson residents.
| Immigration Origin | # Population | % Population |
| Asia | 7 | 0.5% |
| Central America | 182 | 13.1% |
| China | 7 | 0.5% |
| Eastern Asia | 7 | 0.5% |
| Europe | 2 | 0.1% |
| Germany | 2 | 0.1% |
| Latin America | 182 | 13.1% |
| Mexico | 182 | 13.1% |
| Taiwan | 7 | 0.5% |
| Western Europe | 2 | 0.1% | View All 10 Rows |
Sex and Age in Manson
Sex and Age in Manson
The most populous age groups in Manson are 50 to 54 Years (119 | 18.4%) for men and 60 to 64 Years (82 | 11.1%) for women.
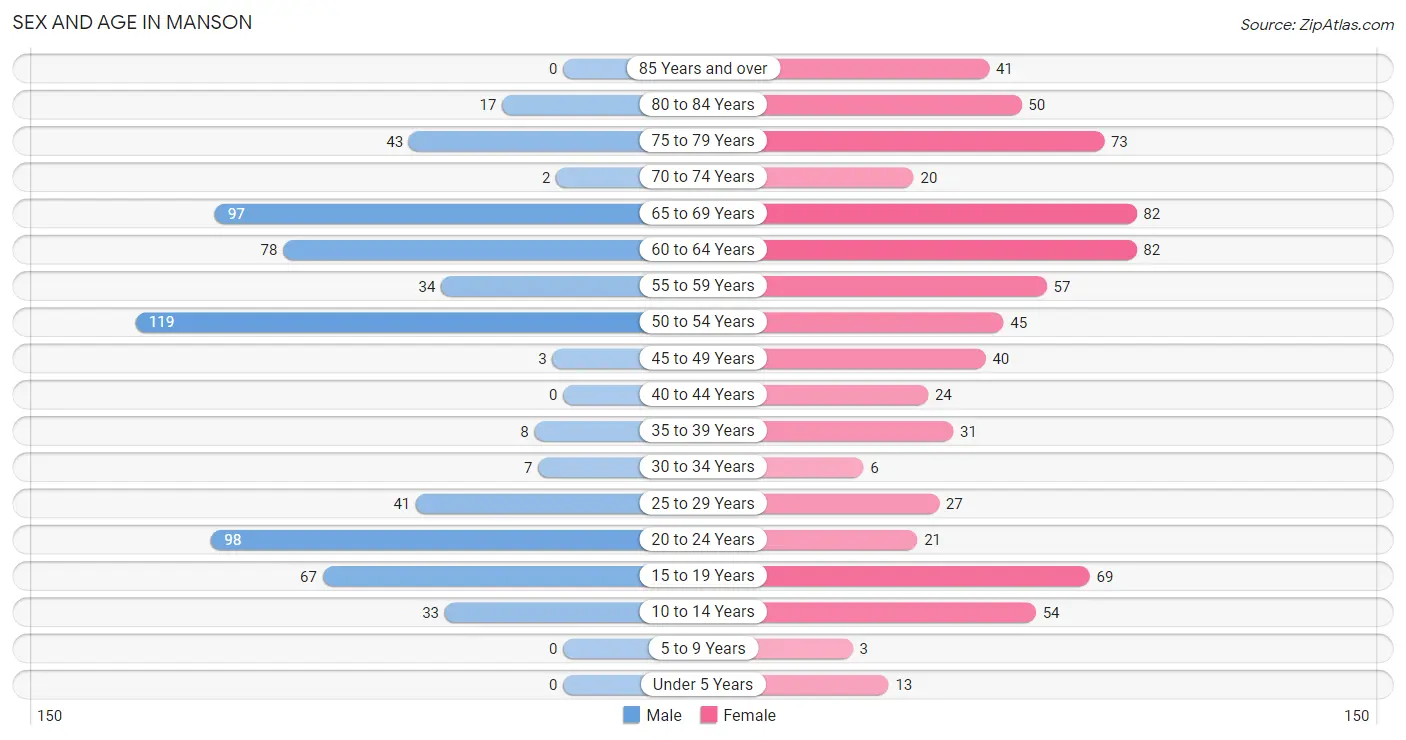
| Age Bracket | Male | Female |
| Under 5 Years | 0 (0.0%) | 13 (1.8%) |
| 5 to 9 Years | 0 (0.0%) | 3 (0.4%) |
| 10 to 14 Years | 33 (5.1%) | 54 (7.3%) |
| 15 to 19 Years | 67 (10.4%) | 69 (9.3%) |
| 20 to 24 Years | 98 (15.1%) | 21 (2.9%) |
| 25 to 29 Years | 41 (6.3%) | 27 (3.7%) |
| 30 to 34 Years | 7 (1.1%) | 6 (0.8%) |
| 35 to 39 Years | 8 (1.2%) | 31 (4.2%) |
| 40 to 44 Years | 0 (0.0%) | 24 (3.3%) |
| 45 to 49 Years | 3 (0.5%) | 40 (5.4%) |
| 50 to 54 Years | 119 (18.4%) | 45 (6.1%) |
| 55 to 59 Years | 34 (5.3%) | 57 (7.7%) |
| 60 to 64 Years | 78 (12.1%) | 82 (11.1%) |
| 65 to 69 Years | 97 (15.0%) | 82 (11.1%) |
| 70 to 74 Years | 2 (0.3%) | 20 (2.7%) |
| 75 to 79 Years | 43 (6.7%) | 73 (9.9%) |
| 80 to 84 Years | 17 (2.6%) | 50 (6.8%) |
| 85 Years and over | 0 (0.0%) | 41 (5.6%) |
| Total | 647 (100.0%) | 738 (100.0%) |
Families and Households in Manson
Median Family Size in Manson
The median family size in Manson is 2.78 persons per family, with single male/father families (6 | 1.9%) accounting for the largest median family size of 5.67 persons per family. On the other hand, married-couple families (266 | 82.9%) represent the smallest median family size with 2.70 persons per family.
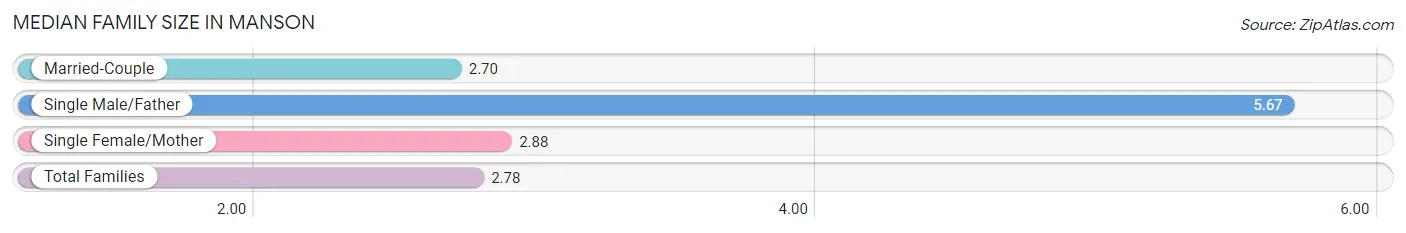
| Family Type | # Families | Family Size |
| Married-Couple | 266 (82.9%) | 2.70 |
| Single Male/Father | 6 (1.9%) | 5.67 |
| Single Female/Mother | 49 (15.3%) | 2.88 |
| Total Families | 321 (100.0%) | 2.78 |
Median Household Size in Manson
The median household size in Manson is 2.22 persons per household, with single male/father households (6 | 1.0%) accounting for the largest median household size of 7 persons per household. non-family households (302 | 48.5%) represent the smallest median household size with 1.42 persons per household.
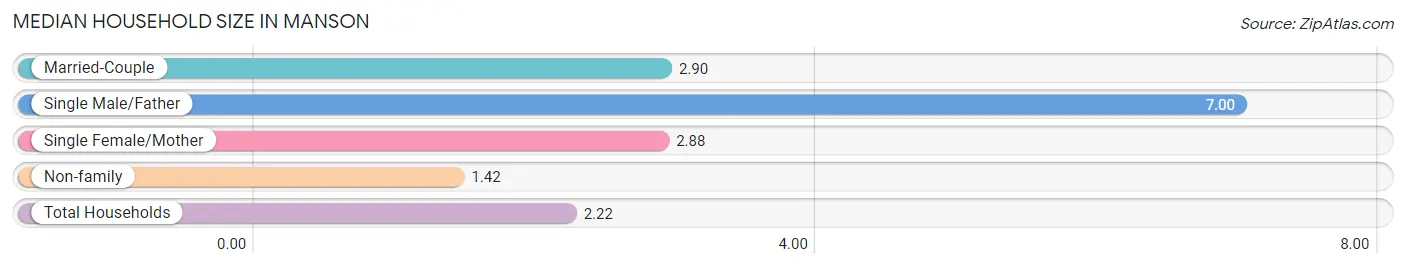
| Household Type | # Households | Household Size |
| Married-Couple | 266 (42.7%) | 2.90 |
| Single Male/Father | 6 (1.0%) | 7.00 |
| Single Female/Mother | 49 (7.9%) | 2.88 |
| Non-family | 302 (48.5%) | 1.42 |
| Total Households | 623 (100.0%) | 2.22 |
Household Size by Marriage Status in Manson
Out of a total of 623 households in Manson, 321 (51.5%) are family households, while 302 (48.5%) are nonfamily households. The most numerous type of family households are 2-person households, comprising 191, and the most common type of nonfamily households are 1-person households, comprising 219.
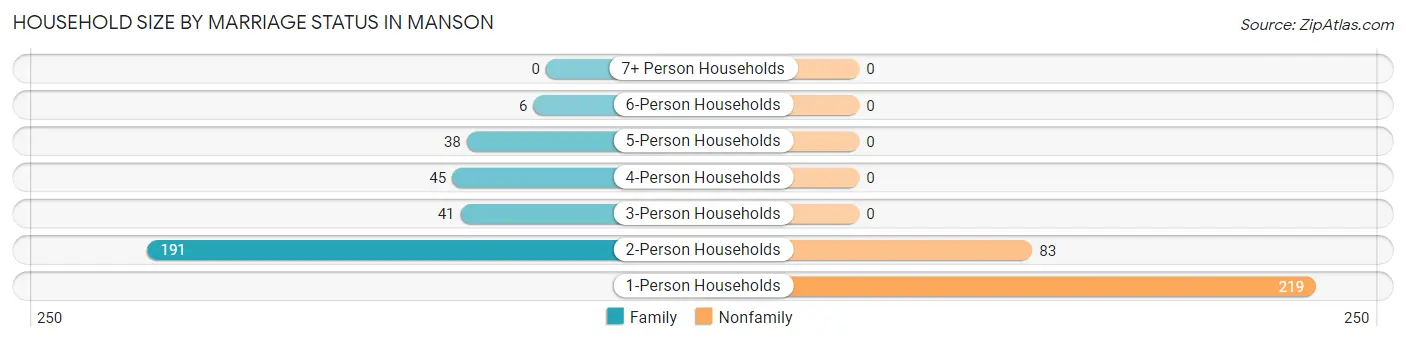
| Household Size | Family Households | Nonfamily Households |
| 1-Person Households | - | 219 (35.1%) |
| 2-Person Households | 191 (30.7%) | 83 (13.3%) |
| 3-Person Households | 41 (6.6%) | 0 (0.0%) |
| 4-Person Households | 45 (7.2%) | 0 (0.0%) |
| 5-Person Households | 38 (6.1%) | 0 (0.0%) |
| 6-Person Households | 6 (1.0%) | 0 (0.0%) |
| 7+ Person Households | 0 (0.0%) | 0 (0.0%) |
| Total | 321 (51.5%) | 302 (48.5%) |
Female Fertility in Manson
Fertility by Age in Manson
| Age Bracket | Women with Births | Births / 1,000 Women |
| 15 to 19 years | 0 (0.0%) | 0.0 |
| 20 to 34 years | 0 (0.0%) | 0.0 |
| 35 to 50 years | 0 (0.0%) | 0.0 |
| Total | 0 (0.0%) | 0.0 |
Fertility by Age by Marriage Status in Manson
| Age Bracket | Married | Unmarried |
| 15 to 19 years | 0 (0.0%) | 0 (0.0%) |
| 20 to 34 years | 0 (0.0%) | 0 (0.0%) |
| 35 to 50 years | 0 (0.0%) | 0 (0.0%) |
| Total | 0 (0.0%) | 0 (0.0%) |
Fertility by Education in Manson
| Educational Attainment | Women with Births | Births / 1,000 Women |
| Less than High School | 0 (0.0%) | 0.0 |
| High School Diploma | 0 (0.0%) | 0.0 |
| College or Associate's Degree | 0 (0.0%) | 0.0 |
| Bachelor's Degree | 0 (0.0%) | 0.0 |
| Graduate Degree | 0 (0.0%) | 0.0 |
| Total | 0 (0.0%) | 0.0 |
Fertility by Education by Marriage Status in Manson
| Educational Attainment | Married | Unmarried |
| Less than High School | 0 (0.0%) | 0 (0.0%) |
| High School Diploma | 0 (0.0%) | 0 (0.0%) |
| College or Associate's Degree | 0 (0.0%) | 0 (0.0%) |
| Bachelor's Degree | 0 (0.0%) | 0 (0.0%) |
| Graduate Degree | 0 (0.0%) | 0 (0.0%) |
| Total | 0 (0.0%) | 0 (0.0%) |
Employment Characteristics in Manson
Employment by Class of Employer in Manson
Among the 589 employed individuals in Manson, private company employees (417 | 70.8%), self-employed (not incorporated) (73 | 12.4%), and local government employees (53 | 9.0%) make up the most common classes of employment.
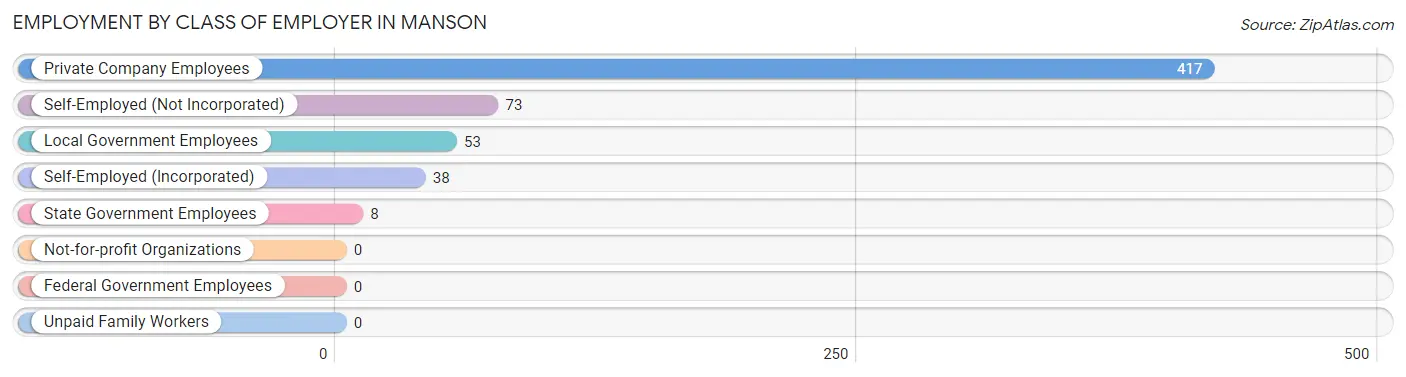
| Employer Class | # Employees | % Employees |
| Private Company Employees | 417 | 70.8% |
| Self-Employed (Incorporated) | 38 | 6.5% |
| Self-Employed (Not Incorporated) | 73 | 12.4% |
| Not-for-profit Organizations | 0 | 0.0% |
| Local Government Employees | 53 | 9.0% |
| State Government Employees | 8 | 1.4% |
| Federal Government Employees | 0 | 0.0% |
| Unpaid Family Workers | 0 | 0.0% |
| Total | 589 | 100.0% |
Employment Status by Age in Manson
According to the labor force statistics for Manson, out of the total population over 16 years of age (1,259), 50.7% or 638 individuals are in the labor force, with 7.7% or 49 of them unemployed. The age group with the highest labor force participation rate is 25 to 29 years, with 100.0% or 68 individuals in the labor force. Within the labor force, the 45 to 54 years age range has the highest percentage of unemployed individuals, with 36.3% or 49 of them being unemployed.
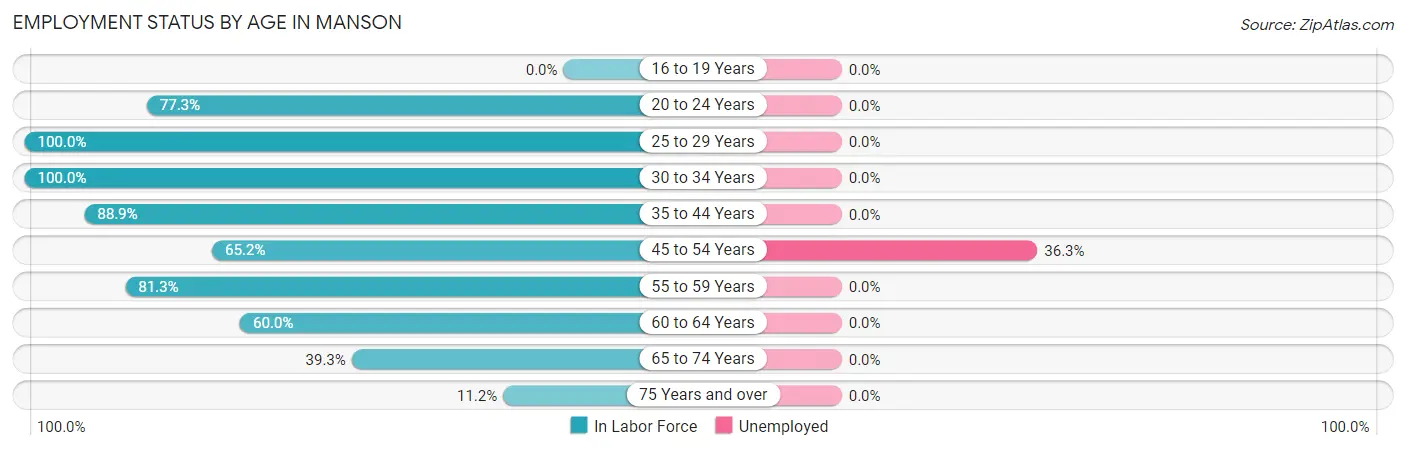
| Age Bracket | In Labor Force | Unemployed |
| 16 to 19 Years | 0 (0.0%) | 0 (0.0%) |
| 20 to 24 Years | 92 (77.3%) | 0 (0.0%) |
| 25 to 29 Years | 68 (100.0%) | 0 (0.0%) |
| 30 to 34 Years | 13 (100.0%) | 0 (0.0%) |
| 35 to 44 Years | 56 (88.9%) | 0 (0.0%) |
| 45 to 54 Years | 135 (65.2%) | 49 (36.3%) |
| 55 to 59 Years | 74 (81.3%) | 0 (0.0%) |
| 60 to 64 Years | 96 (60.0%) | 0 (0.0%) |
| 65 to 74 Years | 79 (39.3%) | 0 (0.0%) |
| 75 Years and over | 25 (11.2%) | 0 (0.0%) |
| Total | 638 (50.7%) | 49 (7.7%) |
Employment Status by Educational Attainment in Manson
According to labor force statistics for Manson, 73.4% of individuals (442) out of the total population between 25 and 64 years of age (602) are in the labor force, with 11.1% or 49 of them being unemployed. The group with the highest labor force participation rate are those with the educational attainment of high school diploma, with 84.8% or 234 individuals in the labor force. Within the labor force, individuals with high school diploma education have the highest percentage of unemployment, with 20.9% or 49 of them being unemployed.
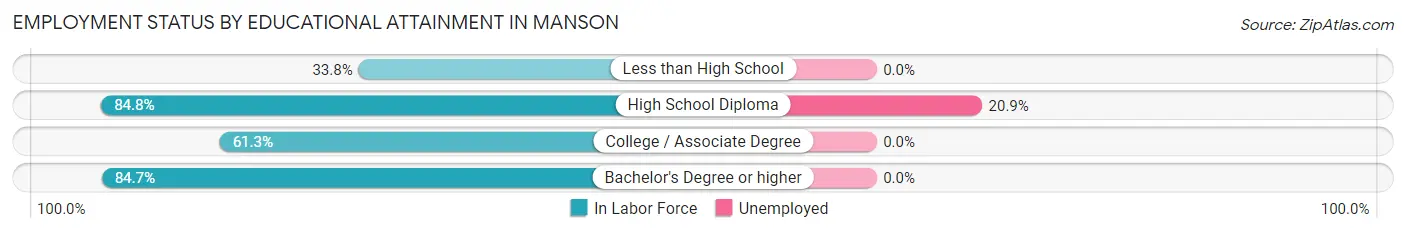
| Educational Attainment | In Labor Force | Unemployed |
| Less than High School | 22 (33.8%) | 0 (0.0%) |
| High School Diploma | 234 (84.8%) | 58 (20.9%) |
| College / Associate Degree | 92 (61.3%) | 0 (0.0%) |
| Bachelor's Degree or higher | 94 (84.7%) | 0 (0.0%) |
| Total | 442 (73.4%) | 67 (11.1%) |
Employment Occupations by Sex in Manson
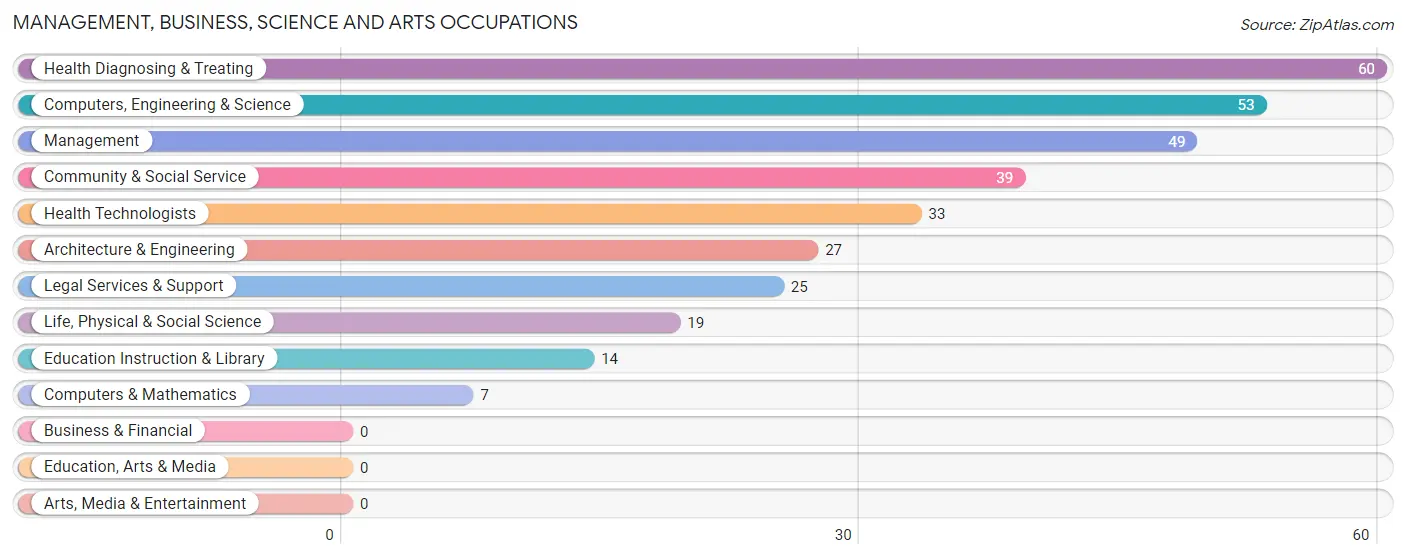
Management, Business, Science and Arts Occupations
The most common Management, Business, Science and Arts occupations in Manson are Health Diagnosing & Treating (60 | 10.2%), Computers, Engineering & Science (53 | 9.0%), Management (49 | 8.3%), Community & Social Service (39 | 6.6%), and Health Technologists (33 | 5.6%).
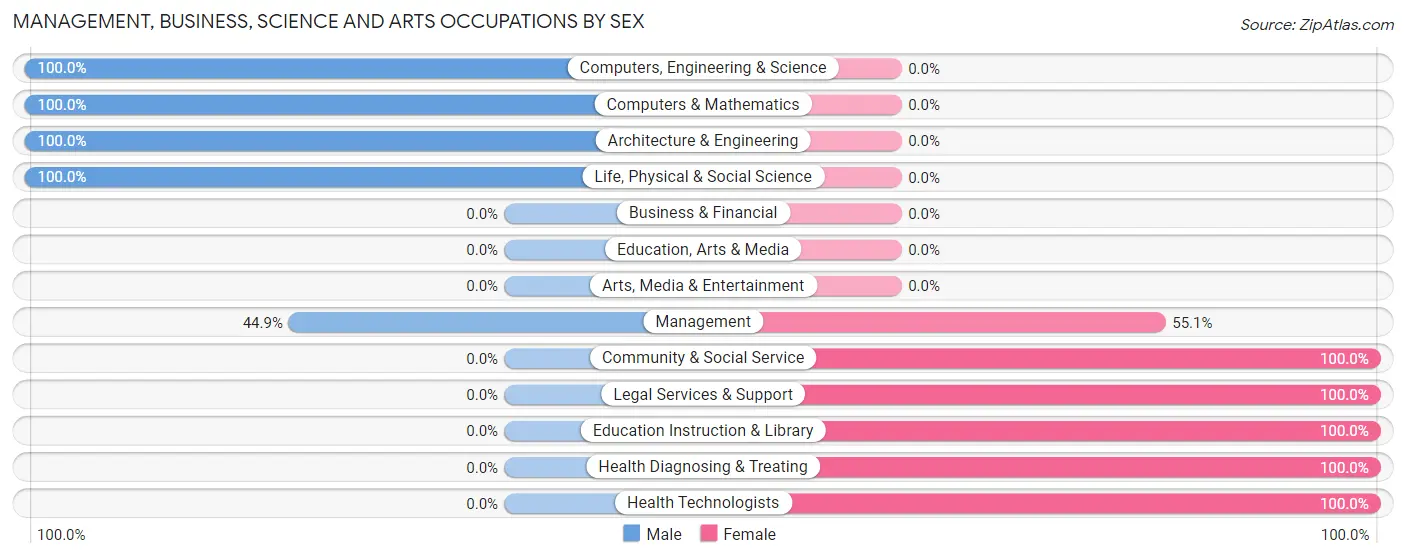
Management, Business, Science and Arts Occupations by Sex
Within the Management, Business, Science and Arts occupations in Manson, the most male-oriented occupations are Computers, Engineering & Science (100.0%), Computers & Mathematics (100.0%), and Architecture & Engineering (100.0%), while the most female-oriented occupations are Community & Social Service (100.0%), Legal Services & Support (100.0%), and Education Instruction & Library (100.0%).
| Occupation | Male | Female |
| Management | 22 (44.9%) | 27 (55.1%) |
| Business & Financial | 0 (0.0%) | 0 (0.0%) |
| Computers, Engineering & Science | 53 (100.0%) | 0 (0.0%) |
| Computers & Mathematics | 7 (100.0%) | 0 (0.0%) |
| Architecture & Engineering | 27 (100.0%) | 0 (0.0%) |
| Life, Physical & Social Science | 19 (100.0%) | 0 (0.0%) |
| Community & Social Service | 0 (0.0%) | 39 (100.0%) |
| Education, Arts & Media | 0 (0.0%) | 0 (0.0%) |
| Legal Services & Support | 0 (0.0%) | 25 (100.0%) |
| Education Instruction & Library | 0 (0.0%) | 14 (100.0%) |
| Arts, Media & Entertainment | 0 (0.0%) | 0 (0.0%) |
| Health Diagnosing & Treating | 0 (0.0%) | 60 (100.0%) |
| Health Technologists | 0 (0.0%) | 33 (100.0%) |
| Total (Category) | 75 (37.3%) | 126 (62.7%) |
| Total (Overall) | 284 (48.2%) | 305 (51.8%) |
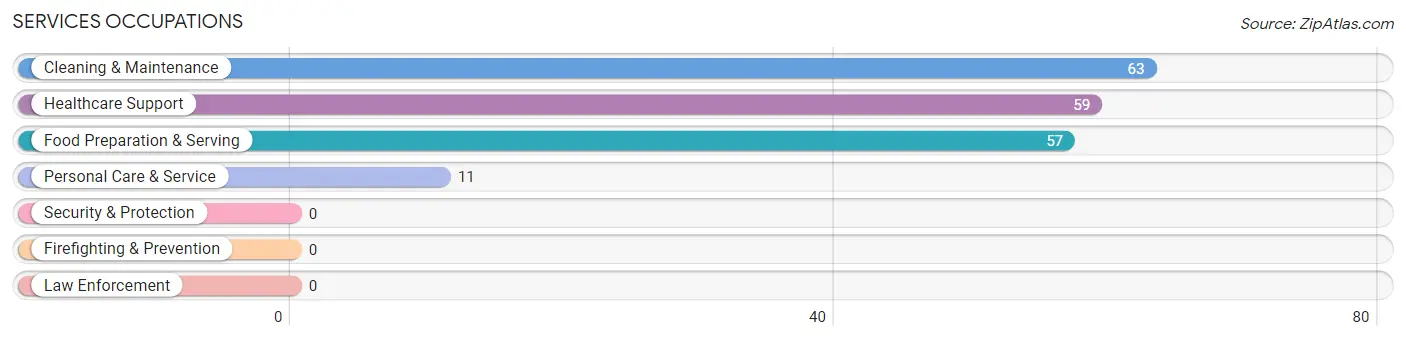
Services Occupations
The most common Services occupations in Manson are Cleaning & Maintenance (63 | 10.7%), Healthcare Support (59 | 10.0%), Food Preparation & Serving (57 | 9.7%), and Personal Care & Service (11 | 1.9%).
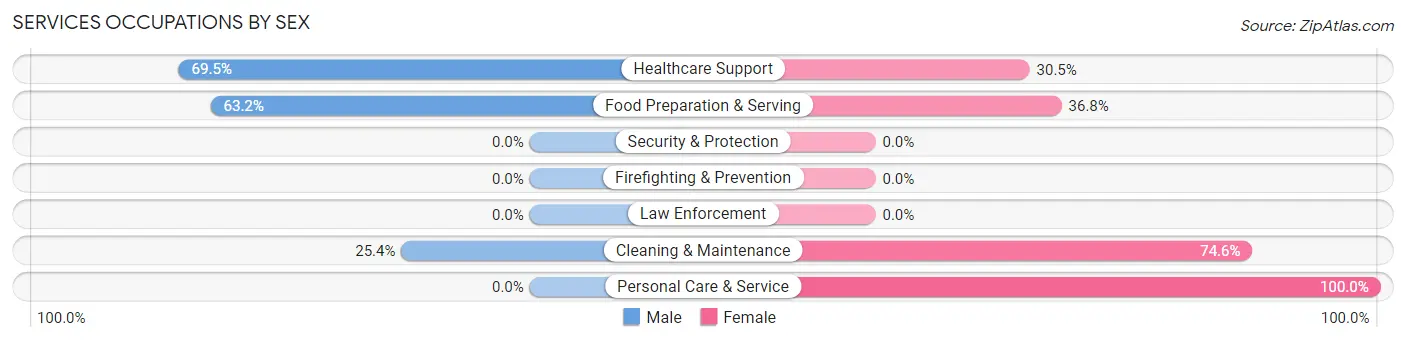
Services Occupations by Sex
Within the Services occupations in Manson, the most male-oriented occupations are Healthcare Support (69.5%), Food Preparation & Serving (63.2%), and Cleaning & Maintenance (25.4%), while the most female-oriented occupations are Personal Care & Service (100.0%), Cleaning & Maintenance (74.6%), and Food Preparation & Serving (36.8%).
| Occupation | Male | Female |
| Healthcare Support | 41 (69.5%) | 18 (30.5%) |
| Security & Protection | 0 (0.0%) | 0 (0.0%) |
| Firefighting & Prevention | 0 (0.0%) | 0 (0.0%) |
| Law Enforcement | 0 (0.0%) | 0 (0.0%) |
| Food Preparation & Serving | 36 (63.2%) | 21 (36.8%) |
| Cleaning & Maintenance | 16 (25.4%) | 47 (74.6%) |
| Personal Care & Service | 0 (0.0%) | 11 (100.0%) |
| Total (Category) | 93 (48.9%) | 97 (51.0%) |
| Total (Overall) | 284 (48.2%) | 305 (51.8%) |
Sales and Office Occupations
The most common Sales and Office occupations in Manson are Sales & Related (39 | 6.6%), and Office & Administration (39 | 6.6%).
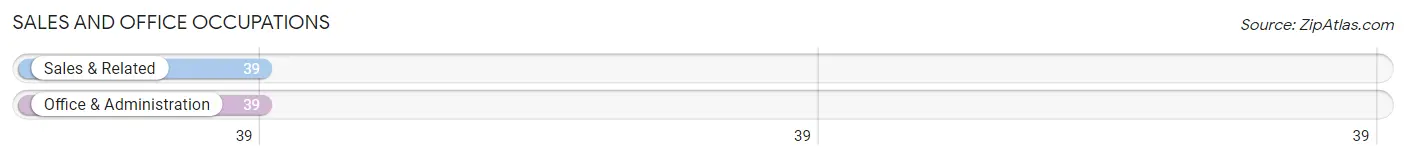
Sales and Office Occupations by Sex
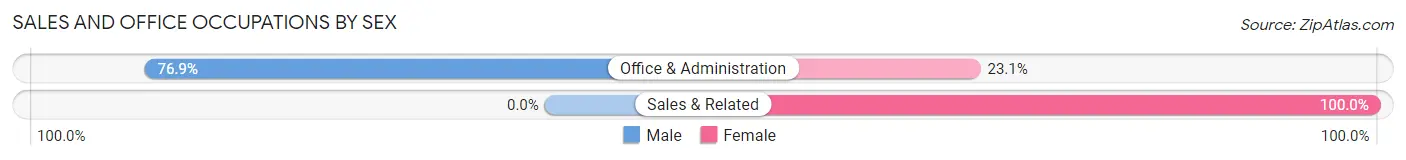
| Occupation | Male | Female |
| Sales & Related | 0 (0.0%) | 39 (100.0%) |
| Office & Administration | 30 (76.9%) | 9 (23.1%) |
| Total (Category) | 30 (38.5%) | 48 (61.5%) |
| Total (Overall) | 284 (48.2%) | 305 (51.8%) |
Natural Resources, Construction and Maintenance Occupations
The most common Natural Resources, Construction and Maintenance occupations in Manson are Farming, Fishing & Forestry (31 | 5.3%), and Construction & Extraction (8 | 1.4%).
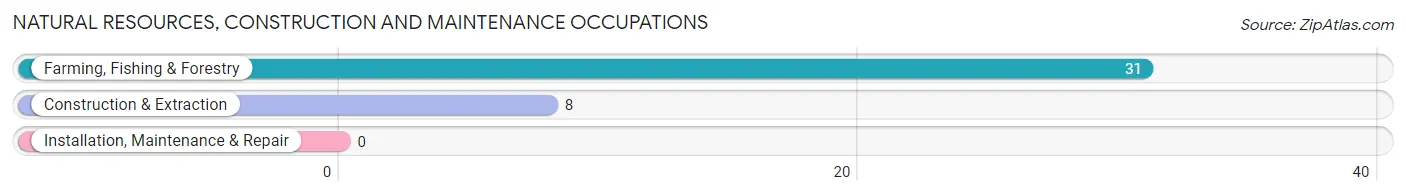
Natural Resources, Construction and Maintenance Occupations by Sex
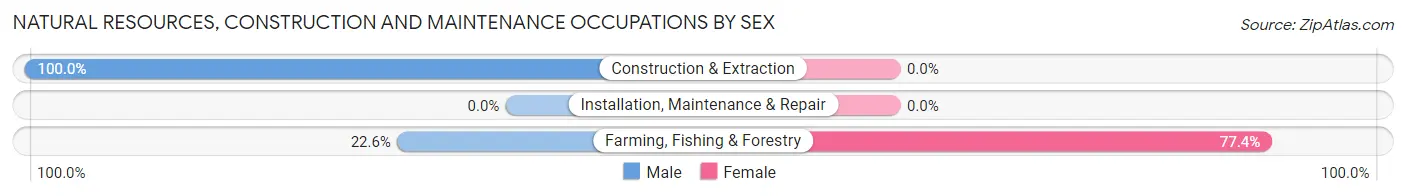
| Occupation | Male | Female |
| Farming, Fishing & Forestry | 7 (22.6%) | 24 (77.4%) |
| Construction & Extraction | 8 (100.0%) | 0 (0.0%) |
| Installation, Maintenance & Repair | 0 (0.0%) | 0 (0.0%) |
| Total (Category) | 15 (38.5%) | 24 (61.5%) |
| Total (Overall) | 284 (48.2%) | 305 (51.8%) |
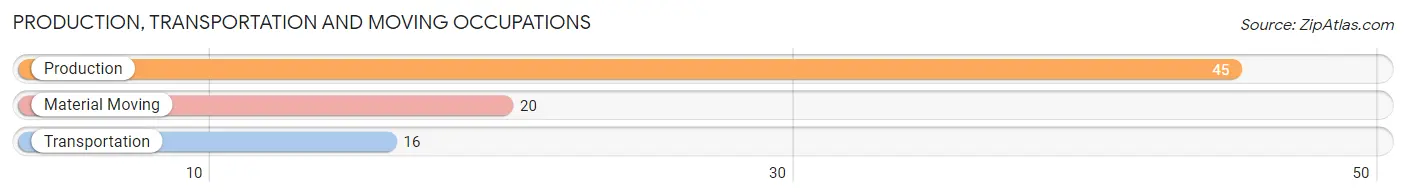
Production, Transportation and Moving Occupations
The most common Production, Transportation and Moving occupations in Manson are Production (45 | 7.6%), Material Moving (20 | 3.4%), and Transportation (16 | 2.7%).
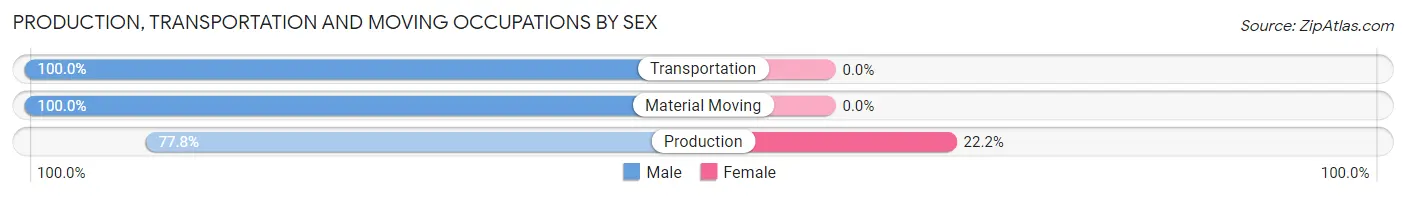
Production, Transportation and Moving Occupations by Sex
| Occupation | Male | Female |
| Production | 35 (77.8%) | 10 (22.2%) |
| Transportation | 16 (100.0%) | 0 (0.0%) |
| Material Moving | 20 (100.0%) | 0 (0.0%) |
| Total (Category) | 71 (87.6%) | 10 (12.3%) |
| Total (Overall) | 284 (48.2%) | 305 (51.8%) |
Employment Industries by Sex in Manson
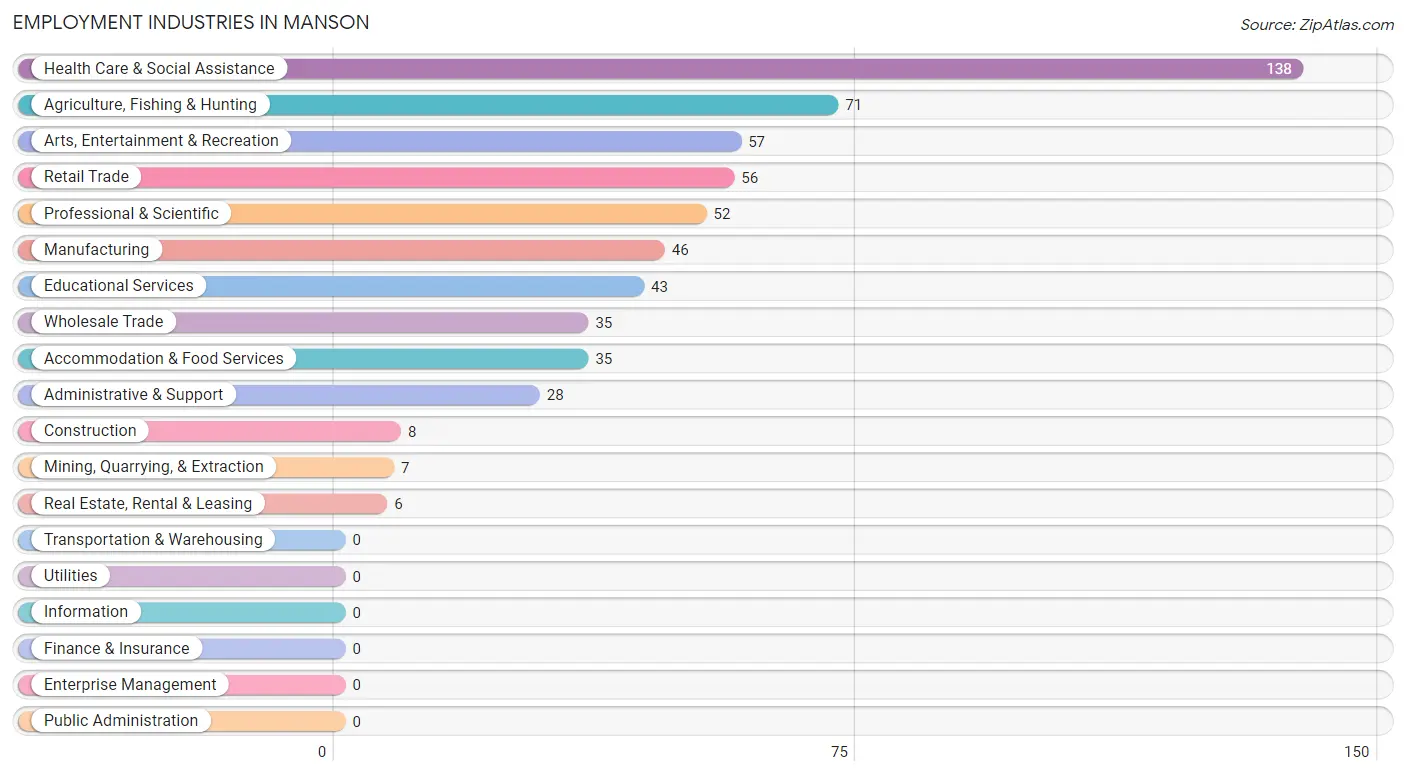
Employment Industries in Manson
The major employment industries in Manson include Health Care & Social Assistance (138 | 23.4%), Agriculture, Fishing & Hunting (71 | 12.0%), Arts, Entertainment & Recreation (57 | 9.7%), Retail Trade (56 | 9.5%), and Professional & Scientific (52 | 8.8%).
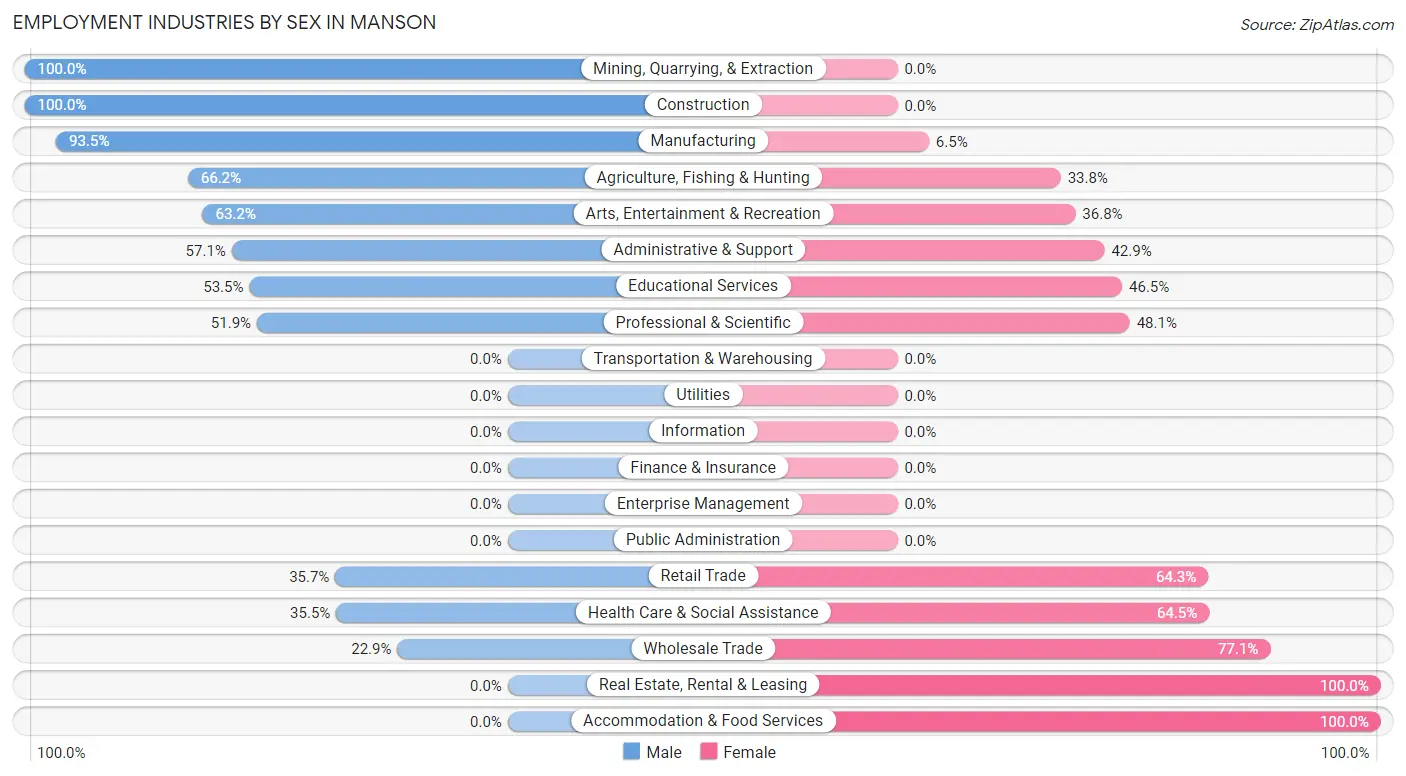
Employment Industries by Sex in Manson
The Manson industries that see more men than women are Mining, Quarrying, & Extraction (100.0%), Construction (100.0%), and Manufacturing (93.5%), whereas the industries that tend to have a higher number of women are Real Estate, Rental & Leasing (100.0%), Accommodation & Food Services (100.0%), and Wholesale Trade (77.1%).
| Industry | Male | Female |
| Agriculture, Fishing & Hunting | 47 (66.2%) | 24 (33.8%) |
| Mining, Quarrying, & Extraction | 7 (100.0%) | 0 (0.0%) |
| Construction | 8 (100.0%) | 0 (0.0%) |
| Manufacturing | 43 (93.5%) | 3 (6.5%) |
| Wholesale Trade | 8 (22.9%) | 27 (77.1%) |
| Retail Trade | 20 (35.7%) | 36 (64.3%) |
| Transportation & Warehousing | 0 (0.0%) | 0 (0.0%) |
| Utilities | 0 (0.0%) | 0 (0.0%) |
| Information | 0 (0.0%) | 0 (0.0%) |
| Finance & Insurance | 0 (0.0%) | 0 (0.0%) |
| Real Estate, Rental & Leasing | 0 (0.0%) | 6 (100.0%) |
| Professional & Scientific | 27 (51.9%) | 25 (48.1%) |
| Enterprise Management | 0 (0.0%) | 0 (0.0%) |
| Administrative & Support | 16 (57.1%) | 12 (42.9%) |
| Educational Services | 23 (53.5%) | 20 (46.5%) |
| Health Care & Social Assistance | 49 (35.5%) | 89 (64.5%) |
| Arts, Entertainment & Recreation | 36 (63.2%) | 21 (36.8%) |
| Accommodation & Food Services | 0 (0.0%) | 35 (100.0%) |
| Public Administration | 0 (0.0%) | 0 (0.0%) |
| Total | 284 (48.2%) | 305 (51.8%) |
Education in Manson
School Enrollment in Manson
The most common levels of schooling among the 306 students in Manson are college / undergraduate (111 | 36.3%), middle school (87 | 28.4%), and high school (71 | 23.2%).
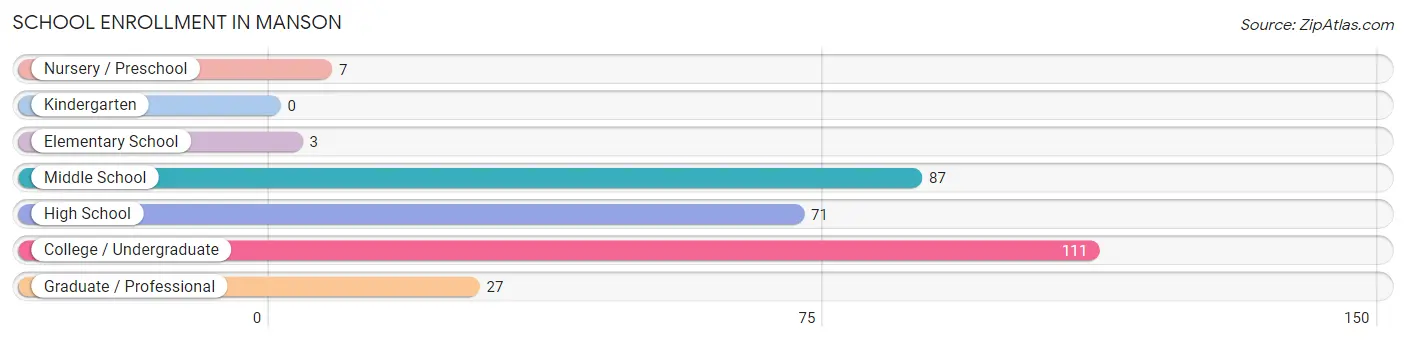
| School Level | # Students | % Students |
| Nursery / Preschool | 7 | 2.3% |
| Kindergarten | 0 | 0.0% |
| Elementary School | 3 | 1.0% |
| Middle School | 87 | 28.4% |
| High School | 71 | 23.2% |
| College / Undergraduate | 111 | 36.3% |
| Graduate / Professional | 27 | 8.8% |
| Total | 306 | 100.0% |
School Enrollment by Age by Funding Source in Manson
Out of a total of 306 students who are enrolled in schools in Manson, 53 (17.3%) attend a private institution, while the remaining 253 (82.7%) are enrolled in public schools. The age group of 35 years and over has the highest likelihood of being enrolled in private schools, with 38 (100.0% in the age bracket) enrolled. Conversely, the age group of 3 to 4 year olds has the lowest likelihood of being enrolled in a private school, with 7 (100.0% in the age bracket) attending a public institution.
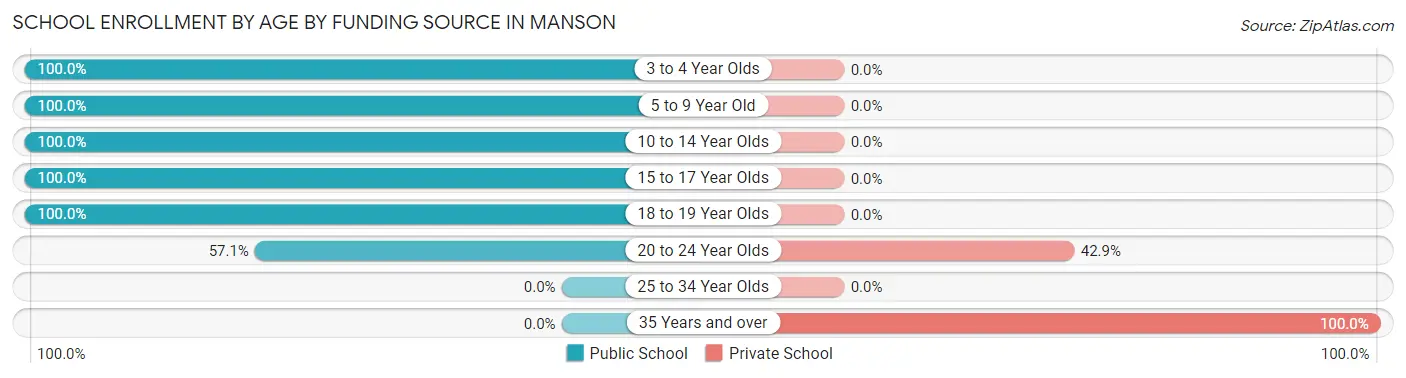
| Age Bracket | Public School | Private School |
| 3 to 4 Year Olds | 7 (100.0%) | 0 (0.0%) |
| 5 to 9 Year Old | 3 (100.0%) | 0 (0.0%) |
| 10 to 14 Year Olds | 87 (100.0%) | 0 (0.0%) |
| 15 to 17 Year Olds | 71 (100.0%) | 0 (0.0%) |
| 18 to 19 Year Olds | 65 (100.0%) | 0 (0.0%) |
| 20 to 24 Year Olds | 20 (57.1%) | 15 (42.9%) |
| 25 to 34 Year Olds | 0 (0.0%) | 0 (0.0%) |
| 35 Years and over | 0 (0.0%) | 38 (100.0%) |
| Total | 253 (82.7%) | 53 (17.3%) |
Educational Attainment by Field of Study in Manson
Education (107 | 36.0%), psychology (43 | 14.5%), science & technology (41 | 13.8%), business (35 | 11.8%), and literature & languages (25 | 8.4%) are the most common fields of study among 297 individuals in Manson who have obtained a bachelor's degree or higher.
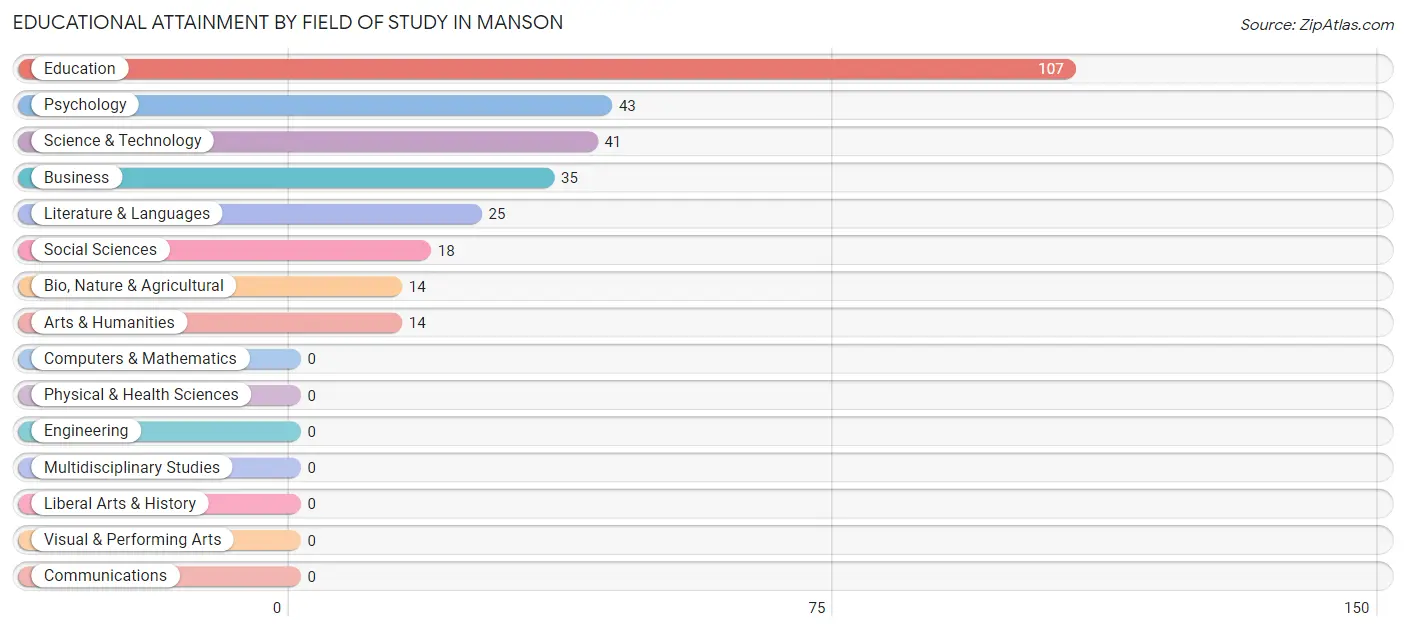
| Field of Study | # Graduates | % Graduates |
| Computers & Mathematics | 0 | 0.0% |
| Bio, Nature & Agricultural | 14 | 4.7% |
| Physical & Health Sciences | 0 | 0.0% |
| Psychology | 43 | 14.5% |
| Social Sciences | 18 | 6.1% |
| Engineering | 0 | 0.0% |
| Multidisciplinary Studies | 0 | 0.0% |
| Science & Technology | 41 | 13.8% |
| Business | 35 | 11.8% |
| Education | 107 | 36.0% |
| Literature & Languages | 25 | 8.4% |
| Liberal Arts & History | 0 | 0.0% |
| Visual & Performing Arts | 0 | 0.0% |
| Communications | 0 | 0.0% |
| Arts & Humanities | 14 | 4.7% |
| Total | 297 | 100.0% |
Transportation & Commute in Manson
Vehicle Availability by Sex in Manson
The most prevalent vehicle ownership categories in Manson are males with 2 vehicles (179, accounting for 63.0%) and females with 2 vehicles (210, making up 58.7%).
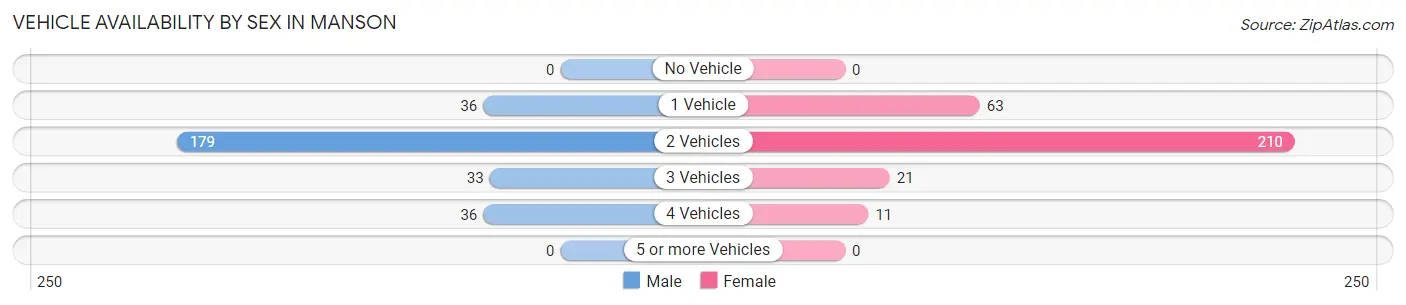
| Vehicles Available | Male | Female |
| No Vehicle | 0 (0.0%) | 0 (0.0%) |
| 1 Vehicle | 36 (12.7%) | 63 (20.7%) |
| 2 Vehicles | 179 (63.0%) | 210 (68.9%) |
| 3 Vehicles | 33 (11.6%) | 21 (6.9%) |
| 4 Vehicles | 36 (12.7%) | 11 (3.6%) |
| 5 or more Vehicles | 0 (0.0%) | 0 (0.0%) |
| Total | 284 (100.0%) | 305 (100.0%) |
Commute Time in Manson
The most frequently occuring commute durations in Manson are 5 to 9 minutes (172 commuters, 33.1%), 20 to 24 minutes (122 commuters, 23.5%), and 15 to 19 minutes (81 commuters, 15.6%).
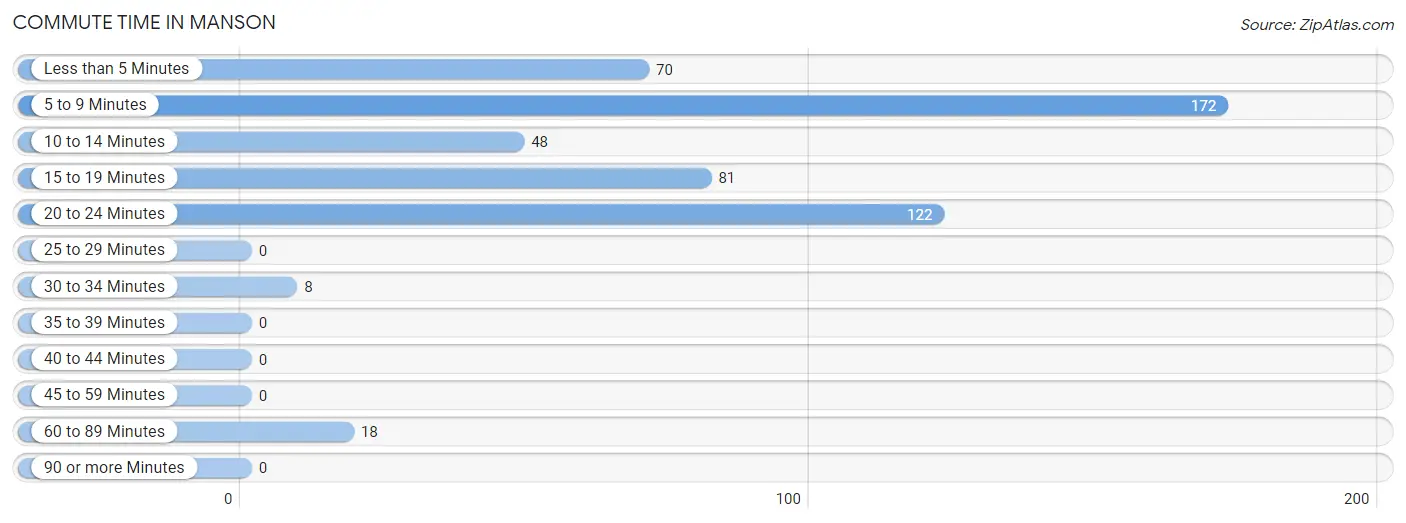
| Commute Time | # Commuters | % Commuters |
| Less than 5 Minutes | 70 | 13.5% |
| 5 to 9 Minutes | 172 | 33.1% |
| 10 to 14 Minutes | 48 | 9.2% |
| 15 to 19 Minutes | 81 | 15.6% |
| 20 to 24 Minutes | 122 | 23.5% |
| 25 to 29 Minutes | 0 | 0.0% |
| 30 to 34 Minutes | 8 | 1.5% |
| 35 to 39 Minutes | 0 | 0.0% |
| 40 to 44 Minutes | 0 | 0.0% |
| 45 to 59 Minutes | 0 | 0.0% |
| 60 to 89 Minutes | 18 | 3.5% |
| 90 or more Minutes | 0 | 0.0% |
Commute Time by Sex in Manson
The most common commute times in Manson are 20 to 24 minutes (83 commuters, 35.5%) for males and 5 to 9 minutes (100 commuters, 35.1%) for females.
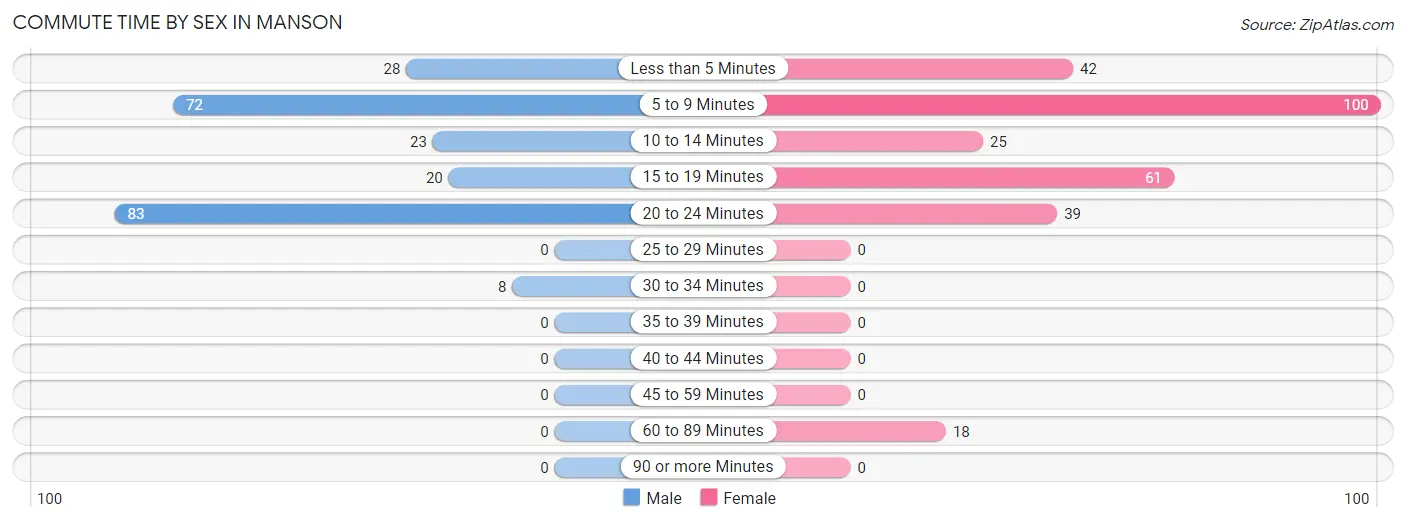
| Commute Time | Male | Female |
| Less than 5 Minutes | 28 (12.0%) | 42 (14.7%) |
| 5 to 9 Minutes | 72 (30.8%) | 100 (35.1%) |
| 10 to 14 Minutes | 23 (9.8%) | 25 (8.8%) |
| 15 to 19 Minutes | 20 (8.6%) | 61 (21.4%) |
| 20 to 24 Minutes | 83 (35.5%) | 39 (13.7%) |
| 25 to 29 Minutes | 0 (0.0%) | 0 (0.0%) |
| 30 to 34 Minutes | 8 (3.4%) | 0 (0.0%) |
| 35 to 39 Minutes | 0 (0.0%) | 0 (0.0%) |
| 40 to 44 Minutes | 0 (0.0%) | 0 (0.0%) |
| 45 to 59 Minutes | 0 (0.0%) | 0 (0.0%) |
| 60 to 89 Minutes | 0 (0.0%) | 18 (6.3%) |
| 90 or more Minutes | 0 (0.0%) | 0 (0.0%) |
Time of Departure to Work by Sex in Manson
The most frequent times of departure to work in Manson are 8:30 AM to 8:59 AM (52, 22.2%) for males and 9:00 AM to 9:59 AM (76, 26.7%) for females.
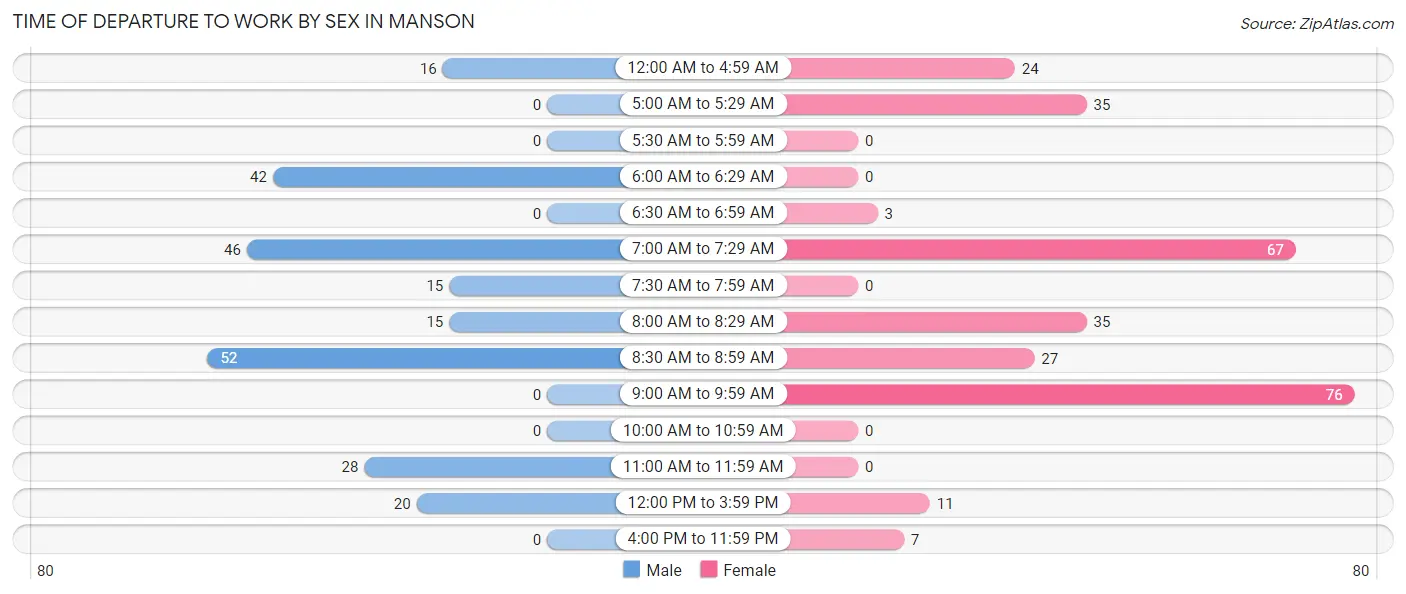
| Time of Departure | Male | Female |
| 12:00 AM to 4:59 AM | 16 (6.8%) | 24 (8.4%) |
| 5:00 AM to 5:29 AM | 0 (0.0%) | 35 (12.3%) |
| 5:30 AM to 5:59 AM | 0 (0.0%) | 0 (0.0%) |
| 6:00 AM to 6:29 AM | 42 (17.9%) | 0 (0.0%) |
| 6:30 AM to 6:59 AM | 0 (0.0%) | 3 (1.1%) |
| 7:00 AM to 7:29 AM | 46 (19.7%) | 67 (23.5%) |
| 7:30 AM to 7:59 AM | 15 (6.4%) | 0 (0.0%) |
| 8:00 AM to 8:29 AM | 15 (6.4%) | 35 (12.3%) |
| 8:30 AM to 8:59 AM | 52 (22.2%) | 27 (9.5%) |
| 9:00 AM to 9:59 AM | 0 (0.0%) | 76 (26.7%) |
| 10:00 AM to 10:59 AM | 0 (0.0%) | 0 (0.0%) |
| 11:00 AM to 11:59 AM | 28 (12.0%) | 0 (0.0%) |
| 12:00 PM to 3:59 PM | 20 (8.6%) | 11 (3.9%) |
| 4:00 PM to 11:59 PM | 0 (0.0%) | 7 (2.5%) |
| Total | 234 (100.0%) | 285 (100.0%) |
Housing Occupancy in Manson
Occupancy by Ownership in Manson
Of the total 623 dwellings in Manson, owner-occupied units account for 457 (73.4%), while renter-occupied units make up 166 (26.7%).
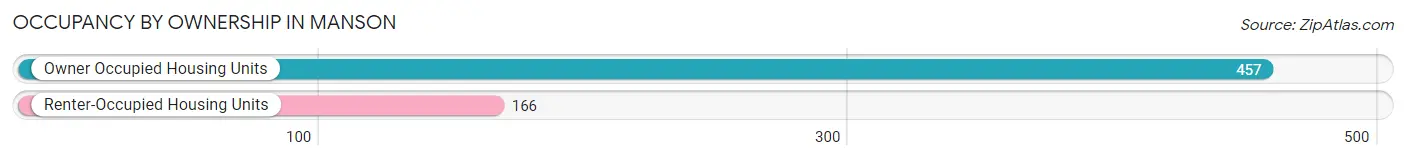
| Occupancy | # Housing Units | % Housing Units |
| Owner Occupied Housing Units | 457 | 73.4% |
| Renter-Occupied Housing Units | 166 | 26.7% |
| Total Occupied Housing Units | 623 | 100.0% |
Occupancy by Household Size in Manson
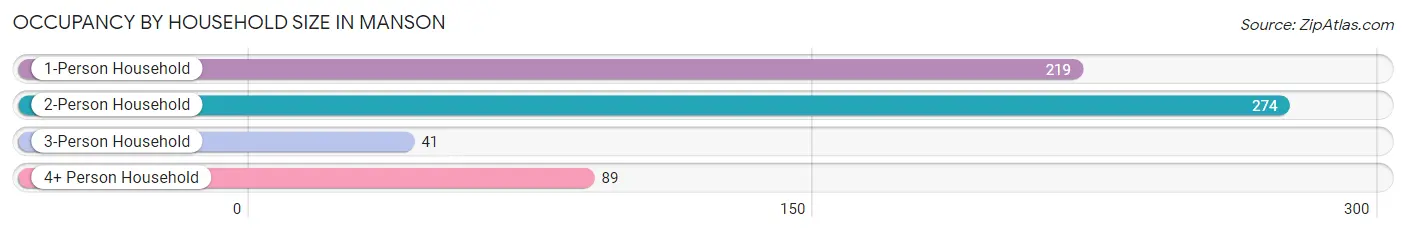
| Household Size | # Housing Units | % Housing Units |
| 1-Person Household | 219 | 35.1% |
| 2-Person Household | 274 | 44.0% |
| 3-Person Household | 41 | 6.6% |
| 4+ Person Household | 89 | 14.3% |
| Total Housing Units | 623 | 100.0% |
Occupancy by Ownership by Household Size in Manson
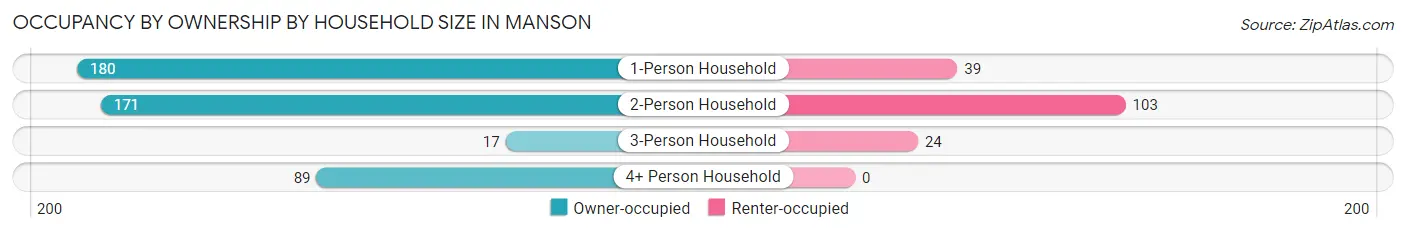
| Household Size | Owner-occupied | Renter-occupied |
| 1-Person Household | 180 (82.2%) | 39 (17.8%) |
| 2-Person Household | 171 (62.4%) | 103 (37.6%) |
| 3-Person Household | 17 (41.5%) | 24 (58.5%) |
| 4+ Person Household | 89 (100.0%) | 0 (0.0%) |
| Total Housing Units | 457 (73.4%) | 166 (26.7%) |
Occupancy by Educational Attainment in Manson
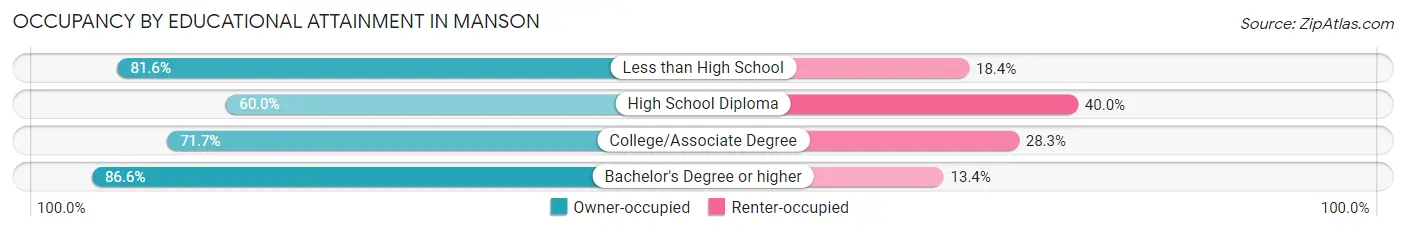
| Household Size | Owner-occupied | Renter-occupied |
| Less than High School | 62 (81.6%) | 14 (18.4%) |
| High School Diploma | 129 (60.0%) | 86 (40.0%) |
| College/Associate Degree | 104 (71.7%) | 41 (28.3%) |
| Bachelor's Degree or higher | 162 (86.6%) | 25 (13.4%) |
Occupancy by Age of Householder in Manson
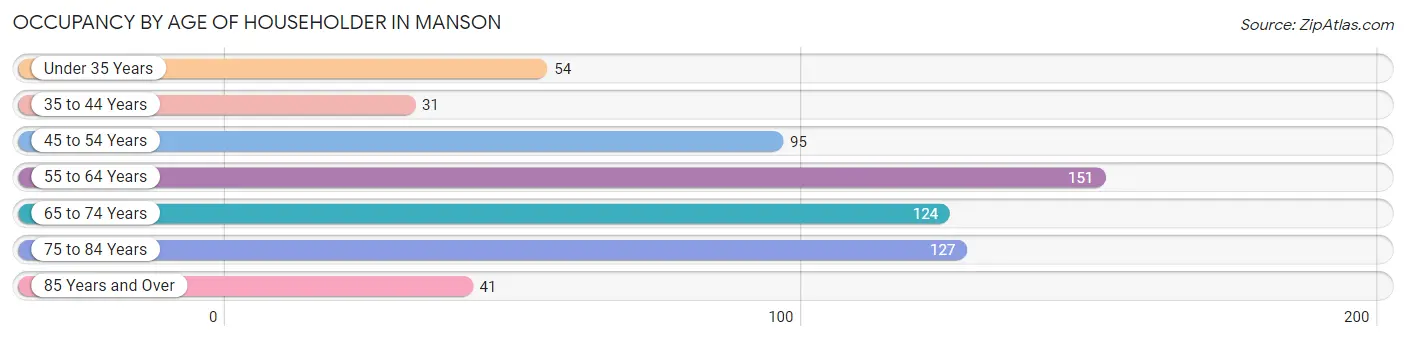
| Age Bracket | # Households | % Households |
| Under 35 Years | 54 | 8.7% |
| 35 to 44 Years | 31 | 5.0% |
| 45 to 54 Years | 95 | 15.2% |
| 55 to 64 Years | 151 | 24.2% |
| 65 to 74 Years | 124 | 19.9% |
| 75 to 84 Years | 127 | 20.4% |
| 85 Years and Over | 41 | 6.6% |
| Total | 623 | 100.0% |
Housing Finances in Manson
Median Income by Occupancy in Manson
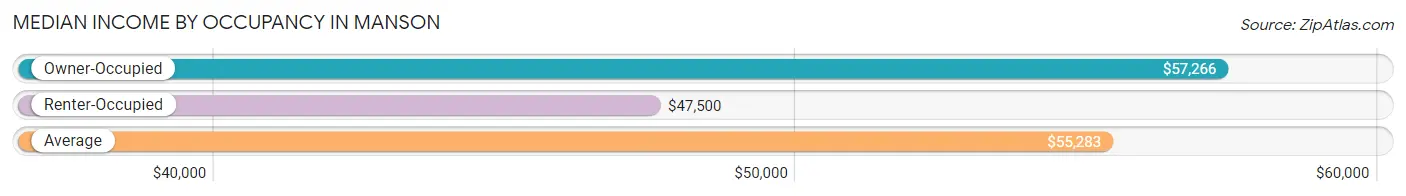
| Occupancy Type | # Households | Median Income |
| Owner-Occupied | 457 (73.4%) | $57,266 |
| Renter-Occupied | 166 (26.7%) | $47,500 |
| Average | 623 (100.0%) | $55,283 |
Occupancy by Householder Income Bracket in Manson
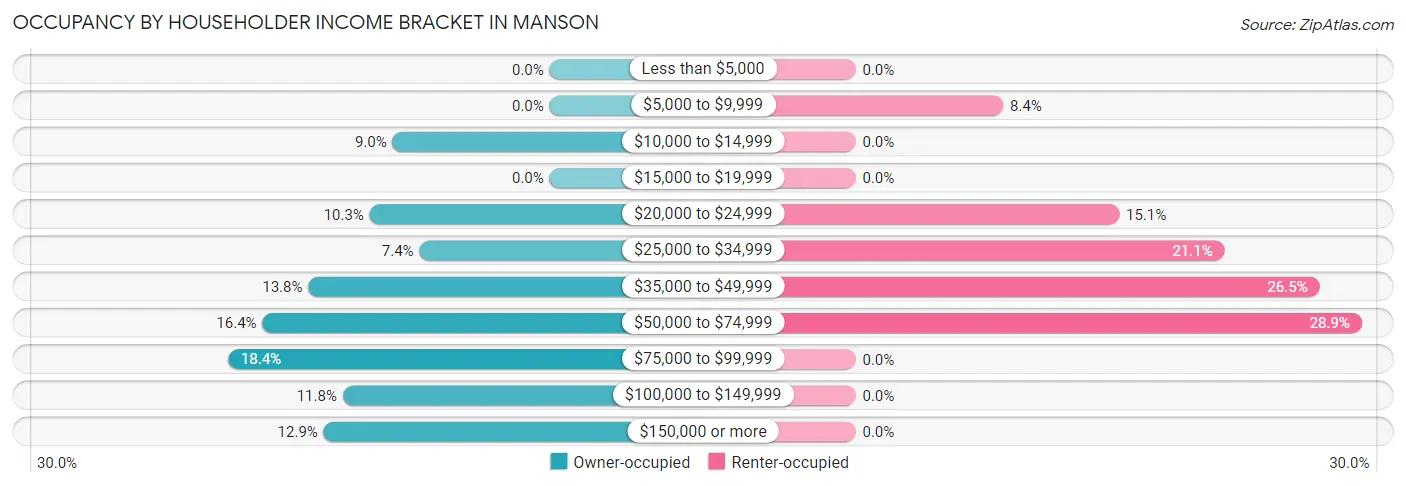
| Income Bracket | Owner-occupied | Renter-occupied |
| Less than $5,000 | 0 (0.0%) | 0 (0.0%) |
| $5,000 to $9,999 | 0 (0.0%) | 14 (8.4%) |
| $10,000 to $14,999 | 41 (9.0%) | 0 (0.0%) |
| $15,000 to $19,999 | 0 (0.0%) | 0 (0.0%) |
| $20,000 to $24,999 | 47 (10.3%) | 25 (15.1%) |
| $25,000 to $34,999 | 34 (7.4%) | 35 (21.1%) |
| $35,000 to $49,999 | 63 (13.8%) | 44 (26.5%) |
| $50,000 to $74,999 | 75 (16.4%) | 48 (28.9%) |
| $75,000 to $99,999 | 84 (18.4%) | 0 (0.0%) |
| $100,000 to $149,999 | 54 (11.8%) | 0 (0.0%) |
| $150,000 or more | 59 (12.9%) | 0 (0.0%) |
| Total | 457 (100.0%) | 166 (100.0%) |
Monthly Housing Cost Tiers in Manson
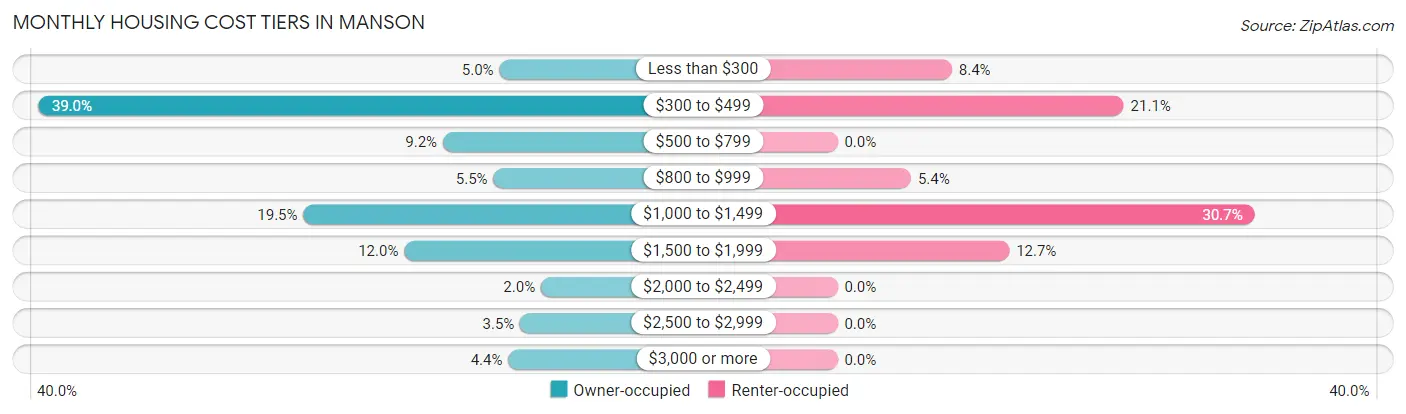
| Monthly Cost | Owner-occupied | Renter-occupied |
| Less than $300 | 23 (5.0%) | 14 (8.4%) |
| $300 to $499 | 178 (39.0%) | 35 (21.1%) |
| $500 to $799 | 42 (9.2%) | 0 (0.0%) |
| $800 to $999 | 25 (5.5%) | 9 (5.4%) |
| $1,000 to $1,499 | 89 (19.5%) | 51 (30.7%) |
| $1,500 to $1,999 | 55 (12.0%) | 21 (12.7%) |
| $2,000 to $2,499 | 9 (2.0%) | 0 (0.0%) |
| $2,500 to $2,999 | 16 (3.5%) | 0 (0.0%) |
| $3,000 or more | 20 (4.4%) | 0 (0.0%) |
| Total | 457 (100.0%) | 166 (100.0%) |
Physical Housing Characteristics in Manson
Housing Structures in Manson
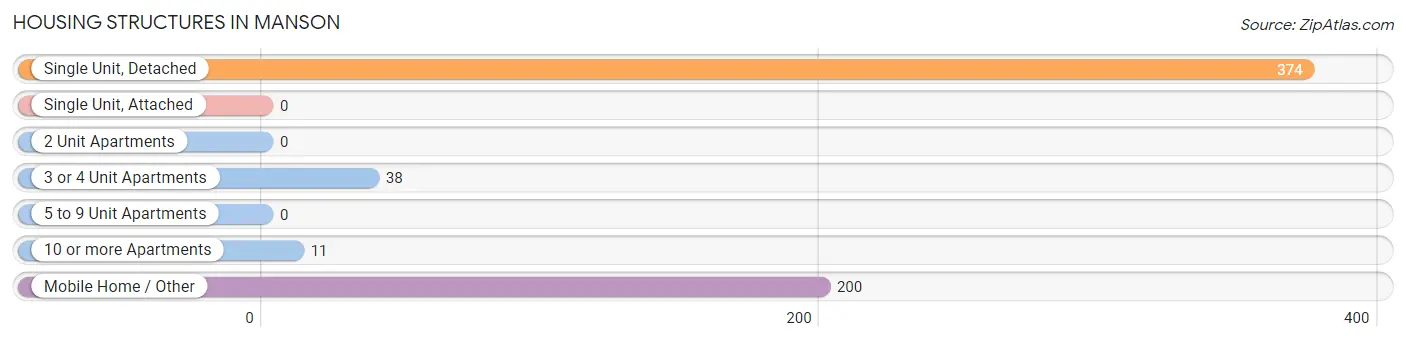
| Structure Type | # Housing Units | % Housing Units |
| Single Unit, Detached | 374 | 60.0% |
| Single Unit, Attached | 0 | 0.0% |
| 2 Unit Apartments | 0 | 0.0% |
| 3 or 4 Unit Apartments | 38 | 6.1% |
| 5 to 9 Unit Apartments | 0 | 0.0% |
| 10 or more Apartments | 11 | 1.8% |
| Mobile Home / Other | 200 | 32.1% |
| Total | 623 | 100.0% |
Housing Structures by Occupancy in Manson
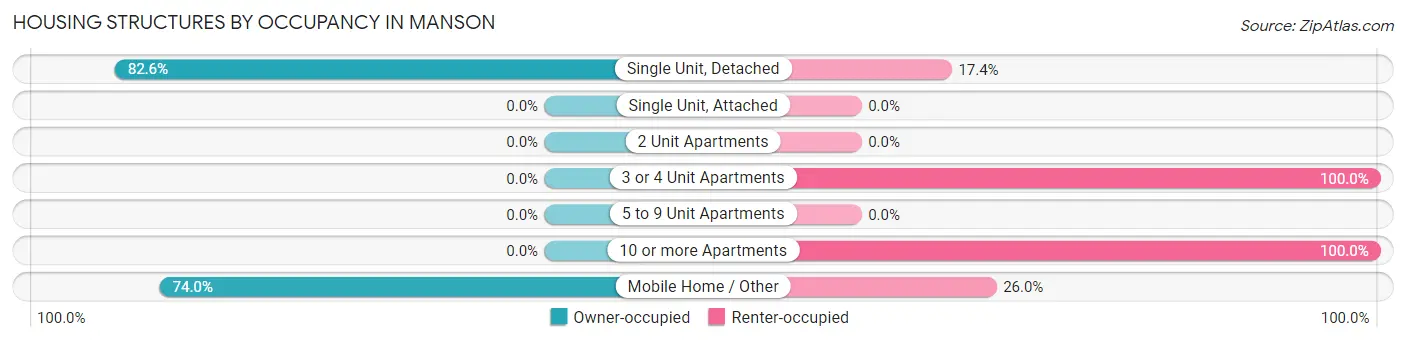
| Structure Type | Owner-occupied | Renter-occupied |
| Single Unit, Detached | 309 (82.6%) | 65 (17.4%) |
| Single Unit, Attached | 0 (0.0%) | 0 (0.0%) |
| 2 Unit Apartments | 0 (0.0%) | 0 (0.0%) |
| 3 or 4 Unit Apartments | 0 (0.0%) | 38 (100.0%) |
| 5 to 9 Unit Apartments | 0 (0.0%) | 0 (0.0%) |
| 10 or more Apartments | 0 (0.0%) | 11 (100.0%) |
| Mobile Home / Other | 148 (74.0%) | 52 (26.0%) |
| Total | 457 (73.4%) | 166 (26.7%) |
Housing Structures by Number of Rooms in Manson
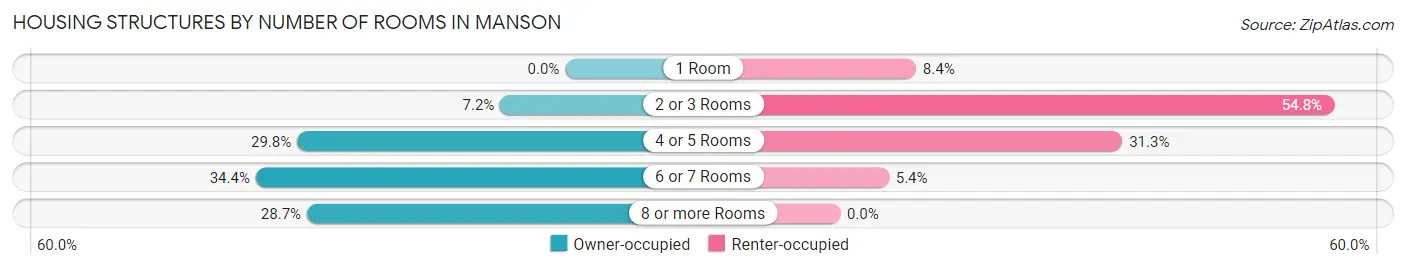
| Number of Rooms | Owner-occupied | Renter-occupied |
| 1 Room | 0 (0.0%) | 14 (8.4%) |
| 2 or 3 Rooms | 33 (7.2%) | 91 (54.8%) |
| 4 or 5 Rooms | 136 (29.8%) | 52 (31.3%) |
| 6 or 7 Rooms | 157 (34.4%) | 9 (5.4%) |
| 8 or more Rooms | 131 (28.7%) | 0 (0.0%) |
| Total | 457 (100.0%) | 166 (100.0%) |
Housing Structure by Heating Type in Manson
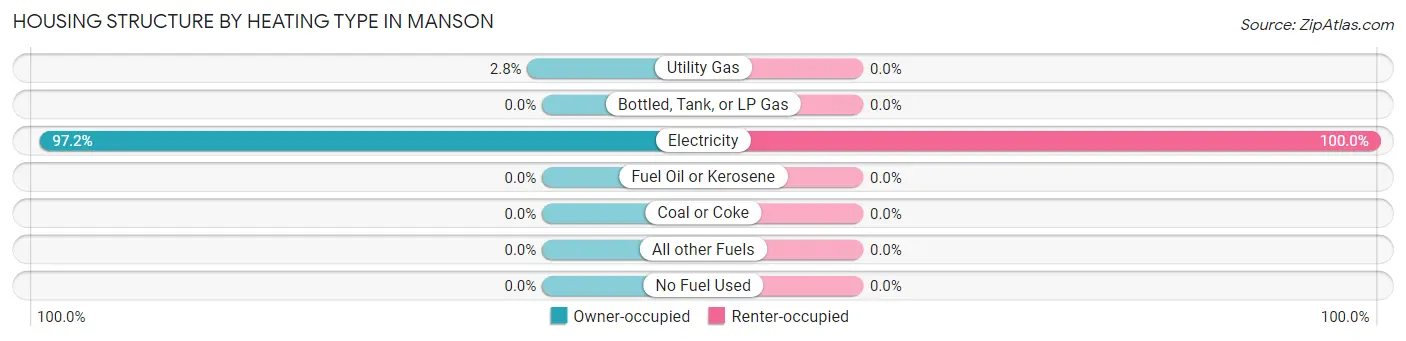
| Heating Type | Owner-occupied | Renter-occupied |
| Utility Gas | 13 (2.8%) | 0 (0.0%) |
| Bottled, Tank, or LP Gas | 0 (0.0%) | 0 (0.0%) |
| Electricity | 444 (97.2%) | 166 (100.0%) |
| Fuel Oil or Kerosene | 0 (0.0%) | 0 (0.0%) |
| Coal or Coke | 0 (0.0%) | 0 (0.0%) |
| All other Fuels | 0 (0.0%) | 0 (0.0%) |
| No Fuel Used | 0 (0.0%) | 0 (0.0%) |
| Total | 457 (100.0%) | 166 (100.0%) |
Household Vehicle Usage in Manson
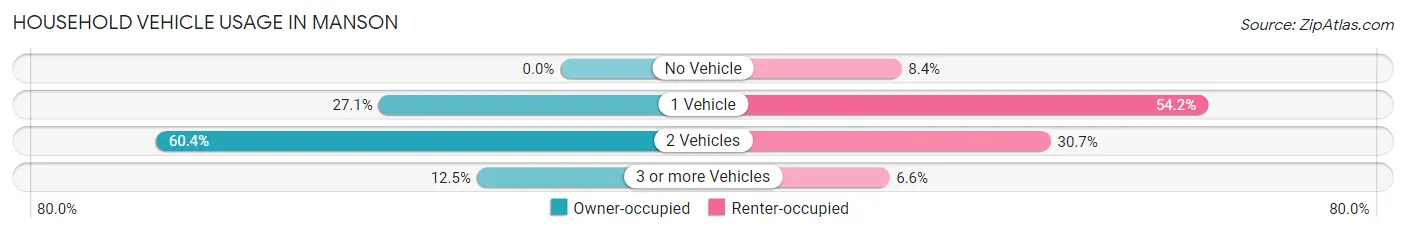
| Vehicles per Household | Owner-occupied | Renter-occupied |
| No Vehicle | 0 (0.0%) | 14 (8.4%) |
| 1 Vehicle | 124 (27.1%) | 90 (54.2%) |
| 2 Vehicles | 276 (60.4%) | 51 (30.7%) |
| 3 or more Vehicles | 57 (12.5%) | 11 (6.6%) |
| Total | 457 (100.0%) | 166 (100.0%) |
Real Estate & Mortgages in Manson
Real Estate and Mortgage Overview in Manson
| Characteristic | Without Mortgage | With Mortgage |
| Housing Units | 251 | 206 |
| Median Property Value | $362,000 | $472,500 |
| Median Household Income | $56,587 | $24 |
| Monthly Housing Costs | $394 | $13 |
| Real Estate Taxes | $1,970 | $25 |
Property Value by Mortgage Status in Manson
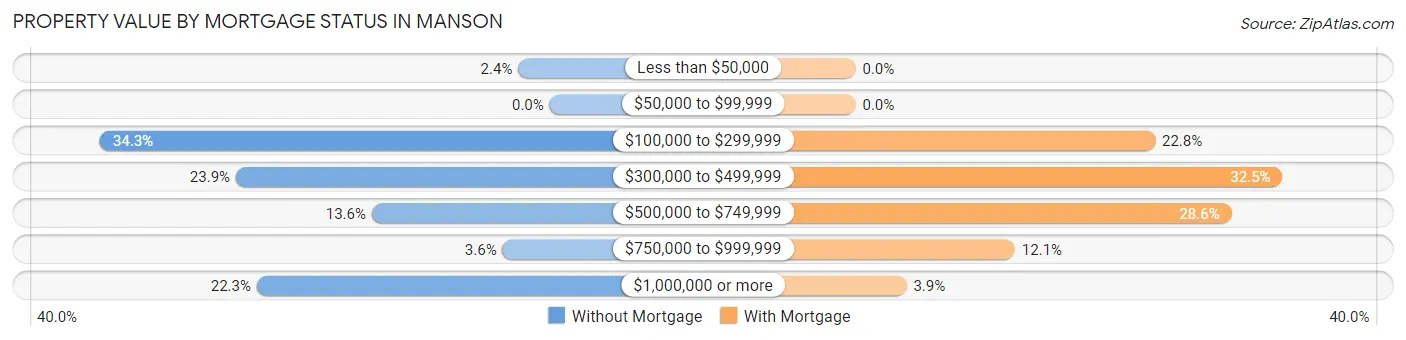
| Property Value | Without Mortgage | With Mortgage |
| Less than $50,000 | 6 (2.4%) | 0 (0.0%) |
| $50,000 to $99,999 | 0 (0.0%) | 0 (0.0%) |
| $100,000 to $299,999 | 86 (34.3%) | 47 (22.8%) |
| $300,000 to $499,999 | 60 (23.9%) | 67 (32.5%) |
| $500,000 to $749,999 | 34 (13.6%) | 59 (28.6%) |
| $750,000 to $999,999 | 9 (3.6%) | 25 (12.1%) |
| $1,000,000 or more | 56 (22.3%) | 8 (3.9%) |
| Total | 251 (100.0%) | 206 (100.0%) |
Household Income by Mortgage Status in Manson
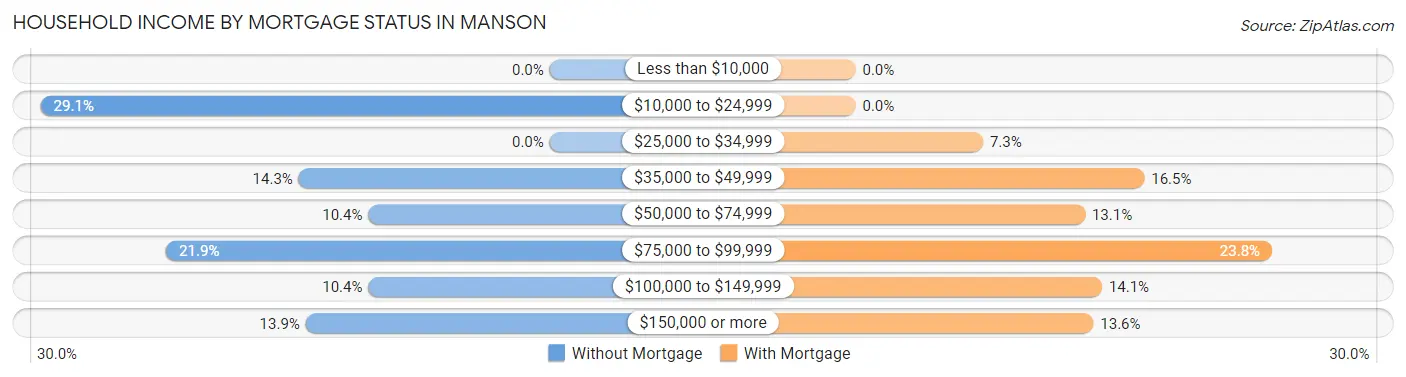
| Household Income | Without Mortgage | With Mortgage |
| Less than $10,000 | 0 (0.0%) | 0 (0.0%) |
| $10,000 to $24,999 | 73 (29.1%) | 0 (0.0%) |
| $25,000 to $34,999 | 0 (0.0%) | 15 (7.3%) |
| $35,000 to $49,999 | 36 (14.3%) | 34 (16.5%) |
| $50,000 to $74,999 | 26 (10.4%) | 27 (13.1%) |
| $75,000 to $99,999 | 55 (21.9%) | 49 (23.8%) |
| $100,000 to $149,999 | 26 (10.4%) | 29 (14.1%) |
| $150,000 or more | 35 (13.9%) | 28 (13.6%) |
| Total | 251 (100.0%) | 206 (100.0%) |
Property Value to Household Income Ratio in Manson
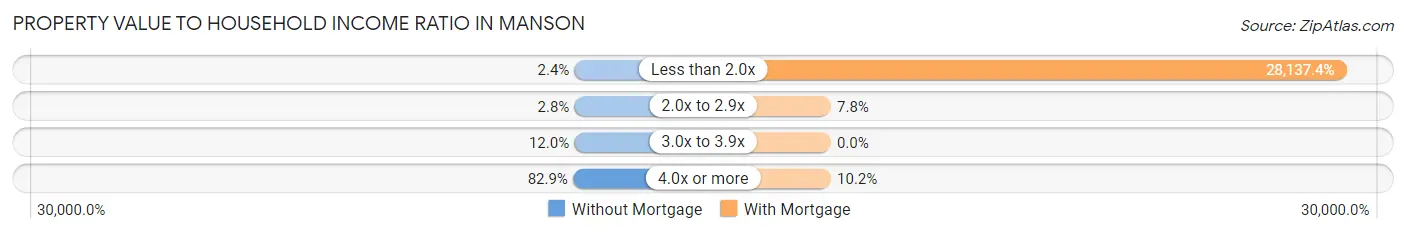
| Value-to-Income Ratio | Without Mortgage | With Mortgage |
| Less than 2.0x | 6 (2.4%) | 57,963 (28,137.4%) |
| 2.0x to 2.9x | 7 (2.8%) | 16 (7.8%) |
| 3.0x to 3.9x | 30 (11.9%) | 0 (0.0%) |
| 4.0x or more | 208 (82.9%) | 21 (10.2%) |
| Total | 251 (100.0%) | 206 (100.0%) |
Real Estate Taxes by Mortgage Status in Manson
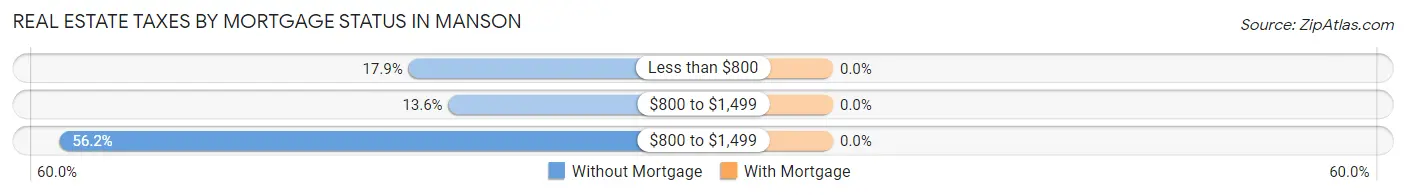
| Property Taxes | Without Mortgage | With Mortgage |
| Less than $800 | 45 (17.9%) | 0 (0.0%) |
| $800 to $1,499 | 34 (13.6%) | 0 (0.0%) |
| $800 to $1,499 | 141 (56.2%) | 0 (0.0%) |
| Total | 251 (100.0%) | 206 (100.0%) |
Health & Disability in Manson
Health Insurance Coverage by Age in Manson
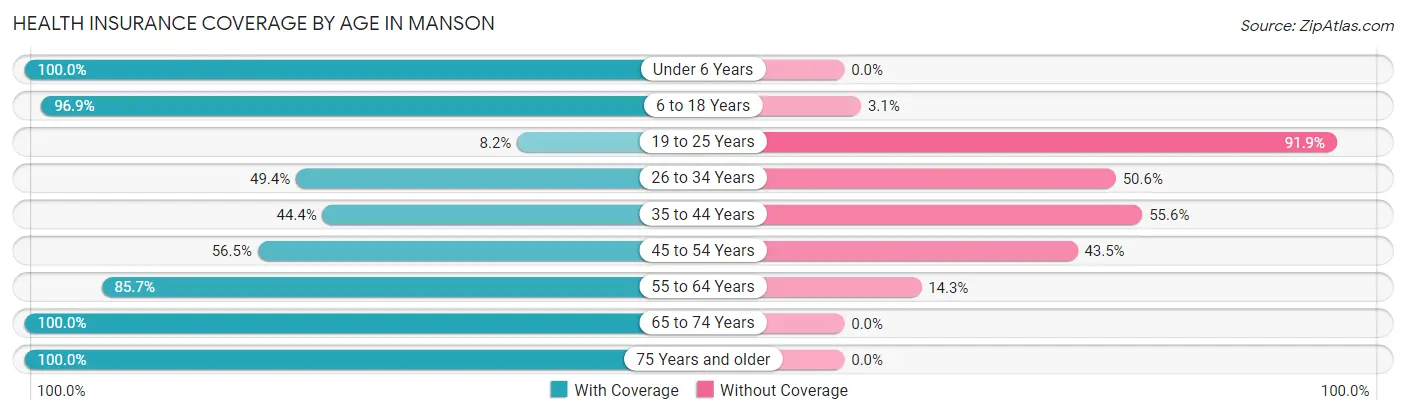
| Age Bracket | With Coverage | Without Coverage |
| Under 6 Years | 13 (100.0%) | 0 (0.0%) |
| 6 to 18 Years | 156 (96.9%) | 5 (3.1%) |
| 19 to 25 Years | 15 (8.2%) | 169 (91.8%) |
| 26 to 34 Years | 40 (49.4%) | 41 (50.6%) |
| 35 to 44 Years | 28 (44.4%) | 35 (55.6%) |
| 45 to 54 Years | 117 (56.5%) | 90 (43.5%) |
| 55 to 64 Years | 215 (85.7%) | 36 (14.3%) |
| 65 to 74 Years | 201 (100.0%) | 0 (0.0%) |
| 75 Years and older | 224 (100.0%) | 0 (0.0%) |
| Total | 1,009 (72.9%) | 376 (27.2%) |
Health Insurance Coverage by Citizenship Status in Manson
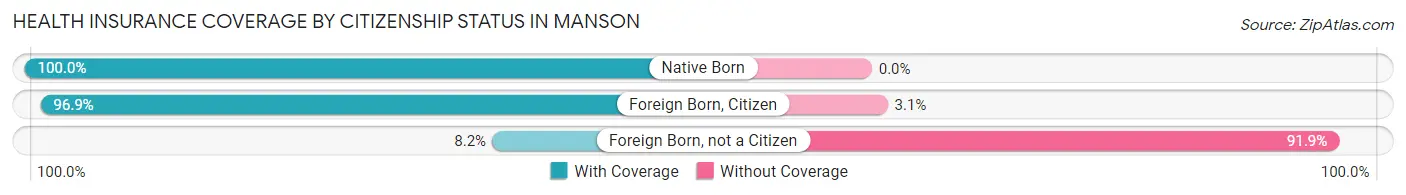
| Citizenship Status | With Coverage | Without Coverage |
| Native Born | 13 (100.0%) | 0 (0.0%) |
| Foreign Born, Citizen | 156 (96.9%) | 5 (3.1%) |
| Foreign Born, not a Citizen | 15 (8.2%) | 169 (91.8%) |
Health Insurance Coverage by Household Income in Manson
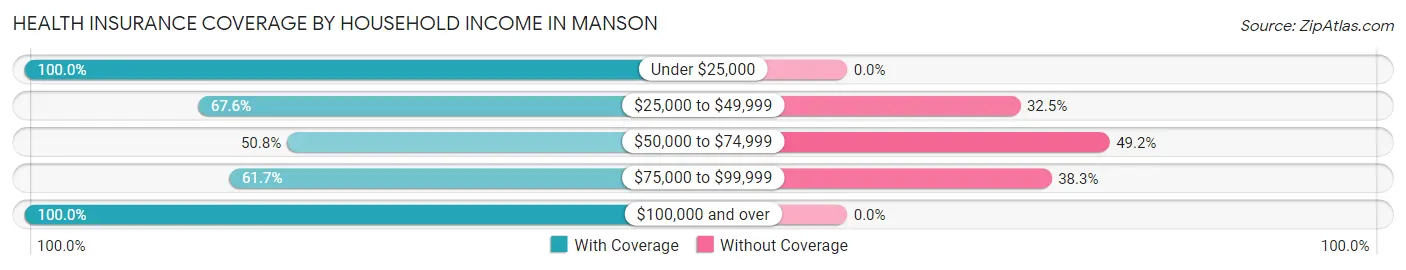
| Household Income | With Coverage | Without Coverage |
| Under $25,000 | 127 (100.0%) | 0 (0.0%) |
| $25,000 to $49,999 | 229 (67.5%) | 110 (32.5%) |
| $50,000 to $74,999 | 182 (50.8%) | 176 (49.2%) |
| $75,000 to $99,999 | 145 (61.7%) | 90 (38.3%) |
| $100,000 and over | 323 (100.0%) | 0 (0.0%) |
Public vs Private Health Insurance Coverage by Age in Manson
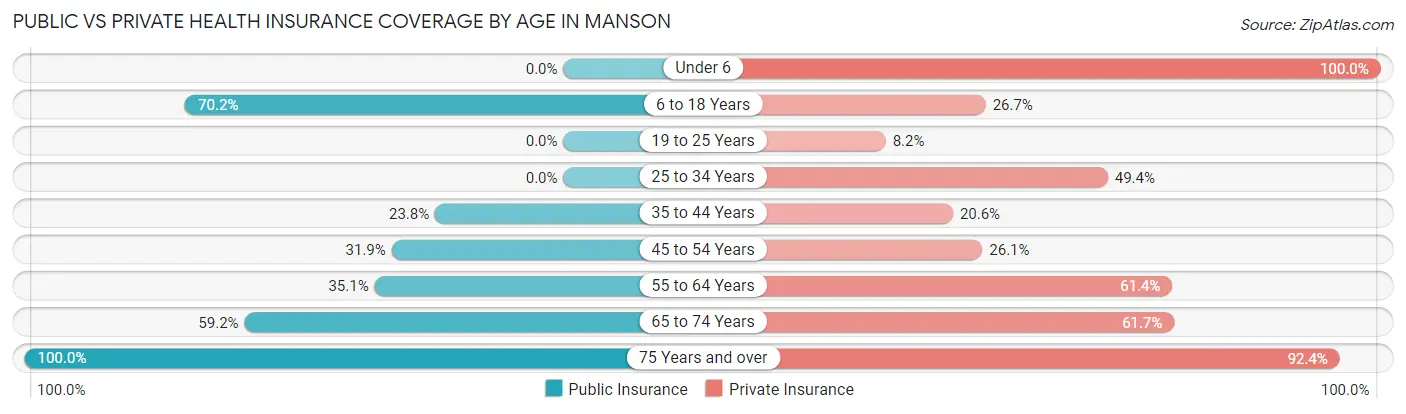
| Age Bracket | Public Insurance | Private Insurance |
| Under 6 | 0 (0.0%) | 13 (100.0%) |
| 6 to 18 Years | 113 (70.2%) | 43 (26.7%) |
| 19 to 25 Years | 0 (0.0%) | 15 (8.2%) |
| 25 to 34 Years | 0 (0.0%) | 40 (49.4%) |
| 35 to 44 Years | 15 (23.8%) | 13 (20.6%) |
| 45 to 54 Years | 66 (31.9%) | 54 (26.1%) |
| 55 to 64 Years | 88 (35.1%) | 154 (61.4%) |
| 65 to 74 Years | 119 (59.2%) | 124 (61.7%) |
| 75 Years and over | 224 (100.0%) | 207 (92.4%) |
| Total | 625 (45.1%) | 663 (47.9%) |
Disability Status by Sex by Age in Manson
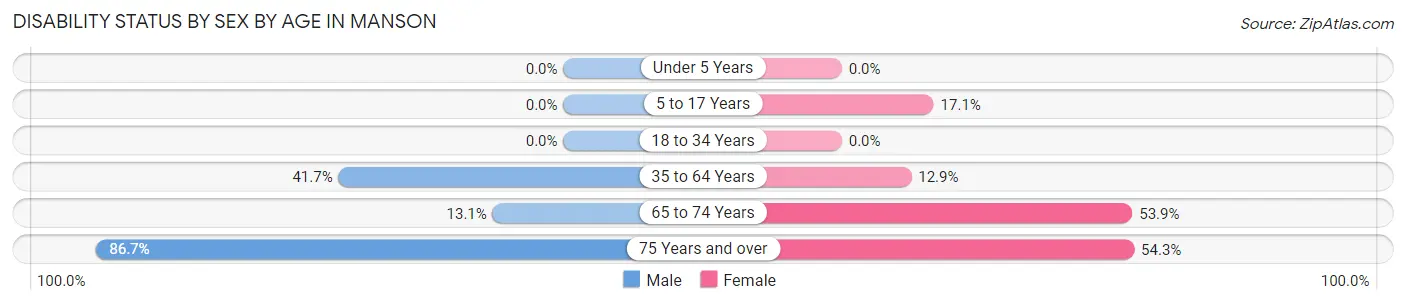
| Age Bracket | Male | Female |
| Under 5 Years | 0 (0.0%) | 0 (0.0%) |
| 5 to 17 Years | 0 (0.0%) | 15 (17.1%) |
| 18 to 34 Years | 0 (0.0%) | 0 (0.0%) |
| 35 to 64 Years | 101 (41.7%) | 36 (12.9%) |
| 65 to 74 Years | 13 (13.1%) | 55 (53.9%) |
| 75 Years and over | 52 (86.7%) | 89 (54.3%) |
Disability Class by Sex by Age in Manson
Disability Class: Hearing Difficulty
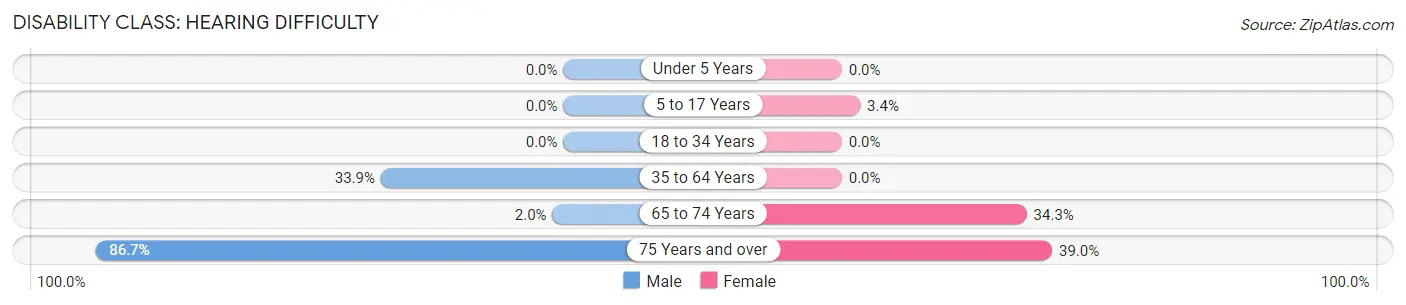
| Age Bracket | Male | Female |
| Under 5 Years | 0 (0.0%) | 0 (0.0%) |
| 5 to 17 Years | 0 (0.0%) | 3 (3.4%) |
| 18 to 34 Years | 0 (0.0%) | 0 (0.0%) |
| 35 to 64 Years | 82 (33.9%) | 0 (0.0%) |
| 65 to 74 Years | 2 (2.0%) | 35 (34.3%) |
| 75 Years and over | 52 (86.7%) | 64 (39.0%) |
Disability Class: Vision Difficulty
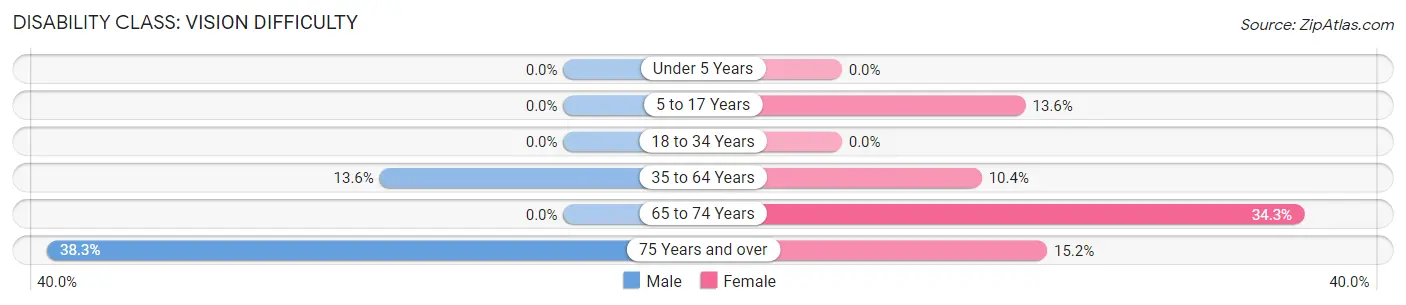
| Age Bracket | Male | Female |
| Under 5 Years | 0 (0.0%) | 0 (0.0%) |
| 5 to 17 Years | 0 (0.0%) | 12 (13.6%) |
| 18 to 34 Years | 0 (0.0%) | 0 (0.0%) |
| 35 to 64 Years | 33 (13.6%) | 29 (10.4%) |
| 65 to 74 Years | 0 (0.0%) | 35 (34.3%) |
| 75 Years and over | 23 (38.3%) | 25 (15.2%) |
Disability Class: Cognitive Difficulty
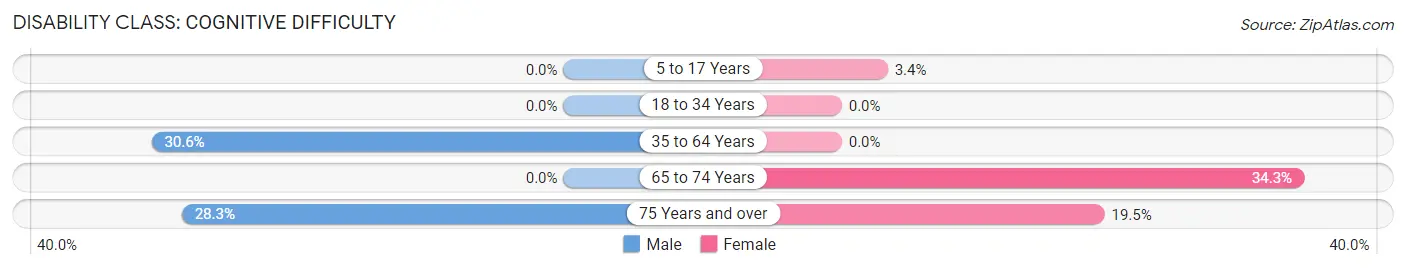
| Age Bracket | Male | Female |
| 5 to 17 Years | 0 (0.0%) | 3 (3.4%) |
| 18 to 34 Years | 0 (0.0%) | 0 (0.0%) |
| 35 to 64 Years | 74 (30.6%) | 0 (0.0%) |
| 65 to 74 Years | 0 (0.0%) | 35 (34.3%) |
| 75 Years and over | 17 (28.3%) | 32 (19.5%) |
Disability Class: Ambulatory Difficulty
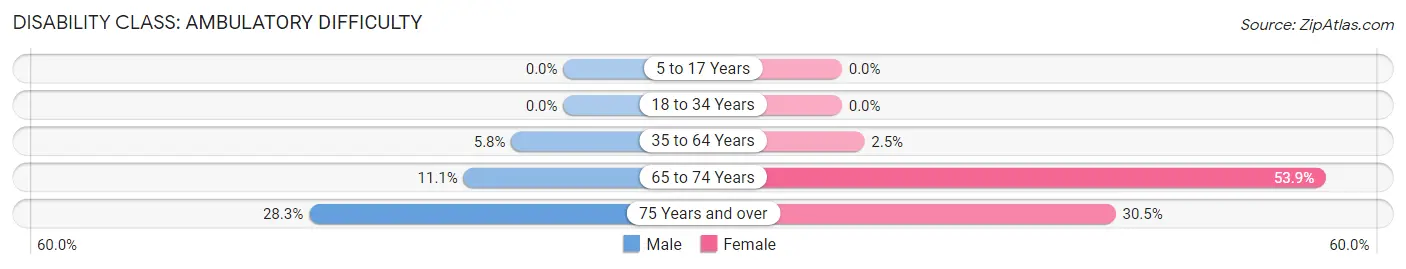
| Age Bracket | Male | Female |
| 5 to 17 Years | 0 (0.0%) | 0 (0.0%) |
| 18 to 34 Years | 0 (0.0%) | 0 (0.0%) |
| 35 to 64 Years | 14 (5.8%) | 7 (2.5%) |
| 65 to 74 Years | 11 (11.1%) | 55 (53.9%) |
| 75 Years and over | 17 (28.3%) | 50 (30.5%) |
Disability Class: Self-Care Difficulty
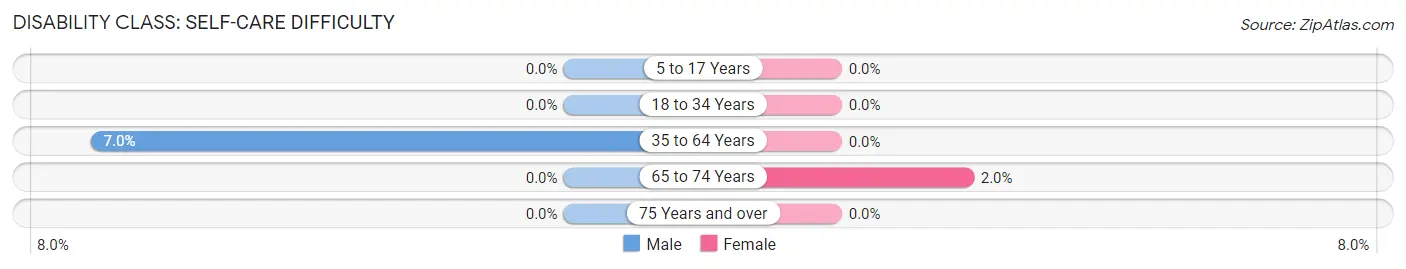
| Age Bracket | Male | Female |
| 5 to 17 Years | 0 (0.0%) | 0 (0.0%) |
| 18 to 34 Years | 0 (0.0%) | 0 (0.0%) |
| 35 to 64 Years | 17 (7.0%) | 0 (0.0%) |
| 65 to 74 Years | 0 (0.0%) | 2 (2.0%) |
| 75 Years and over | 0 (0.0%) | 0 (0.0%) |
Technology Access in Manson
Computing Device Access in Manson
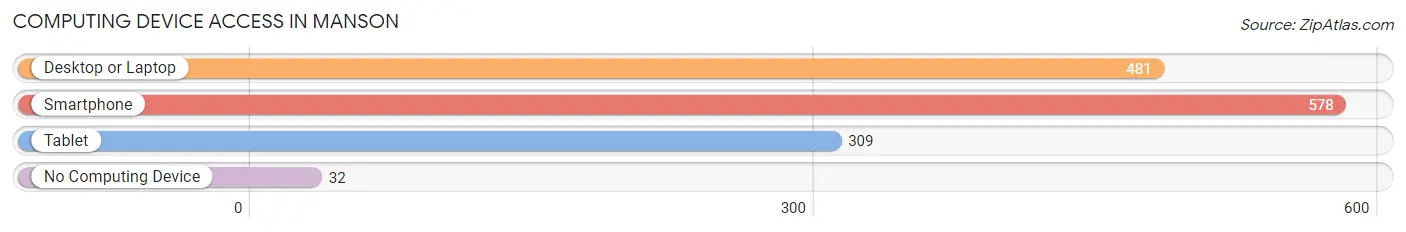
| Device Type | # Households | % Households |
| Desktop or Laptop | 481 | 77.2% |
| Smartphone | 578 | 92.8% |
| Tablet | 309 | 49.6% |
| No Computing Device | 32 | 5.1% |
| Total | 623 | 100.0% |
Internet Access in Manson
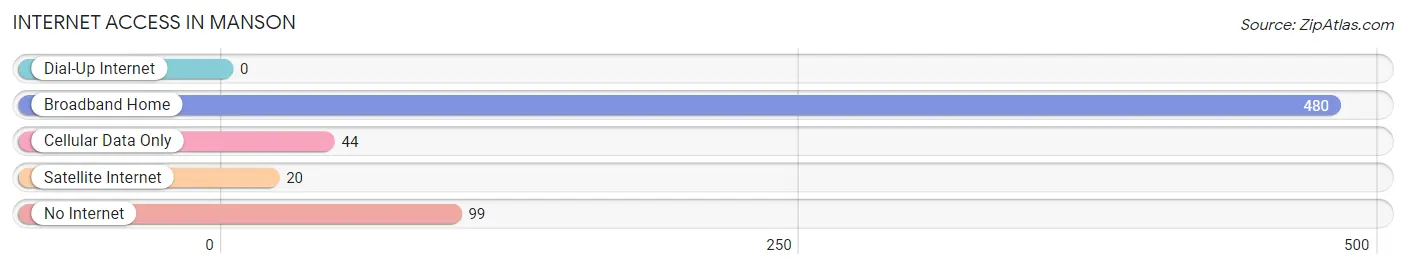
| Internet Type | # Households | % Households |
| Dial-Up Internet | 0 | 0.0% |
| Broadband Home | 480 | 77.0% |
| Cellular Data Only | 44 | 7.1% |
| Satellite Internet | 20 | 3.2% |
| No Internet | 99 | 15.9% |
| Total | 623 | 100.0% |
Manson Summary
Manson is a small town located in Chelan County, Washington, United States. It is situated on the north shore of Lake Chelan, approximately 25 miles south of the city of Chelan. The population of Manson was 1,093 at the 2010 census.
History
Manson was first settled in 1891 by a group of homesteaders led by William Manson. The town was named after him. The first post office was established in 1892. The town was incorporated in 1909.
Manson was originally a logging and farming community. In the early 1900s, the town was home to a sawmill, a flour mill, a creamery, and a cannery. The town also had a hotel, a general store, and a school.
In the 1920s, Manson became a popular tourist destination. The town was home to several resorts, including the Manson Hotel, the Manson Inn, and the Manson Beach Resort.
Geography
Manson is located at the northern end of Lake Chelan, approximately 25 miles south of the city of Chelan. The town is situated at an elevation of 1,093 feet above sea level.
The town is surrounded by the Cascade Mountains to the east and the Wenatchee National Forest to the west. The Chelan River flows through the town.
Economy
Manson’s economy is largely based on tourism. The town is home to several resorts, including the Manson Hotel, the Manson Inn, and the Manson Beach Resort.
The town is also home to several wineries, including the Manson Cellars, the Manson Valley Winery, and the Manson Vineyards.
The town is also home to several restaurants, including the Manson Cafe, the Manson Grill, and the Manson Pub.
Demographics
As of the 2010 census, the population of Manson was 1,093. The racial makeup of the town was 94.3% White, 0.7% African American, 0.7% Native American, 0.7% Asian, 0.7% Pacific Islander, 0.7% from other races, and 2.2% from two or more races.
The median household income in Manson was $41,250, and the median family income was $48,750. The per capita income for the town was $20,945.
Conclusion
Manson is a small town located in Chelan County, Washington, United States. It is situated on the north shore of Lake Chelan, approximately 25 miles south of the city of Chelan. The population of Manson was 1,093 at the 2010 census. The town was originally a logging and farming community, but is now largely based on tourism. The town is home to several resorts, wineries, restaurants, and other businesses. The median household income in Manson was $41,250, and the median family income was $48,750.
Common Questions
What is Per Capita Income in Manson?
Per Capita income in Manson is $40,039.
What is the Median Family Income in Manson?
Median Family Income in Manson is $58,935.
What is the Median Household income in Manson?
Median Household Income in Manson is $55,283.
What is Income or Wage Gap in Manson?
Income or Wage Gap in Manson is 31.6%.
Women in Manson earn 68.4 cents for every dollar earned by a man.
What is Inequality or Gini Index in Manson?
Inequality or Gini Index in Manson is 0.53.
What is the Total Population of Manson?
Total Population of Manson is 1,385.
What is the Total Male Population of Manson?
Total Male Population of Manson is 647.
What is the Total Female Population of Manson?
Total Female Population of Manson is 738.
What is the Ratio of Males per 100 Females in Manson?
There are 87.67 Males per 100 Females in Manson.
What is the Ratio of Females per 100 Males in Manson?
There are 114.06 Females per 100 Males in Manson.
What is the Median Population Age in Manson?
Median Population Age in Manson is 54.8 Years.
What is the Average Family Size in Manson
Average Family Size in Manson is 2.8 People.
What is the Average Household Size in Manson
Average Household Size in Manson is 2.2 People.
How Large is the Labor Force in Manson?
There are 638 People in the Labor Forcein in Manson.
What is the Percentage of People in the Labor Force in Manson?
50.7% of People are in the Labor Force in Manson.
What is the Unemployment Rate in Manson?
Unemployment Rate in Manson is 7.7%.