Vaughn, WA Map & Demographics
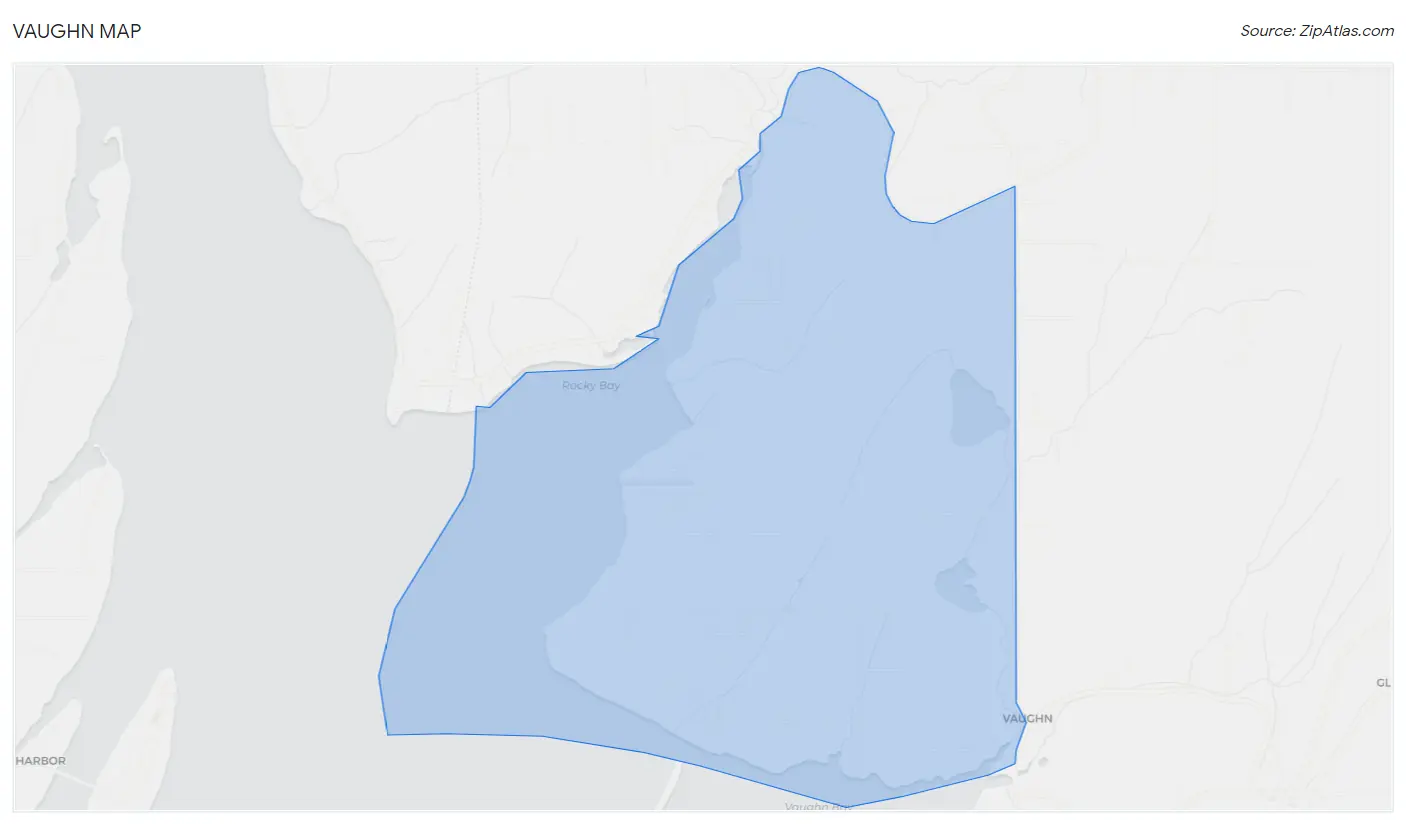
Vaughn Map
Vaughn Overview
$43,439
PER CAPITA INCOME
$158,869
AVG FAMILY INCOME
$103,286
AVG HOUSEHOLD INCOME
0.31
INEQUALITY / GINI INDEX
1,313
TOTAL POPULATION
728
MALE POPULATION
585
FEMALE POPULATION
124.44
MALES / 100 FEMALES
80.36
FEMALES / 100 MALES
46.9
MEDIAN AGE
3.2
AVG FAMILY SIZE
2.6
AVG HOUSEHOLD SIZE
859
LABOR FORCE [ PEOPLE ]
75.3%
PERCENT IN LABOR FORCE
6.1%
UNEMPLOYMENT RATE
Vaughn Zip Codes
Income in Vaughn
Income Overview in Vaughn
Per Capita Income in Vaughn is $43,439, while median incomes of families and households are $158,869 and $103,286 respectively.
| Characteristic | Number | Measure |
| Per Capita Income | 1,313 | $43,439 |
| Median Family Income | 347 | $158,869 |
| Mean Family Income | 347 | $143,433 |
| Median Household Income | 486 | $103,286 |
| Mean Household Income | 486 | $117,497 |
| Income Deficit | 347 | $0 |
| Wage / Income Gap (%) | 1,313 | 0.00% |
| Wage / Income Gap ($) | 1,313 | 100.00¢ per $1 |
| Gini / Inequality Index | 1,313 | 0.31 |
Earnings by Sex in Vaughn
| Sex | Number | Average Earnings |
| Male | 436 (51.5%) | $0 |
| Female | 411 (48.5%) | $0 |
| Total | 847 (100.0%) | $0 |
Earnings by Sex by Income Bracket in Vaughn
The most common earnings brackets in Vaughn are $75,000 to $99,999 for men (116 | 26.6%) and $100,000+ for women (94 | 22.9%).
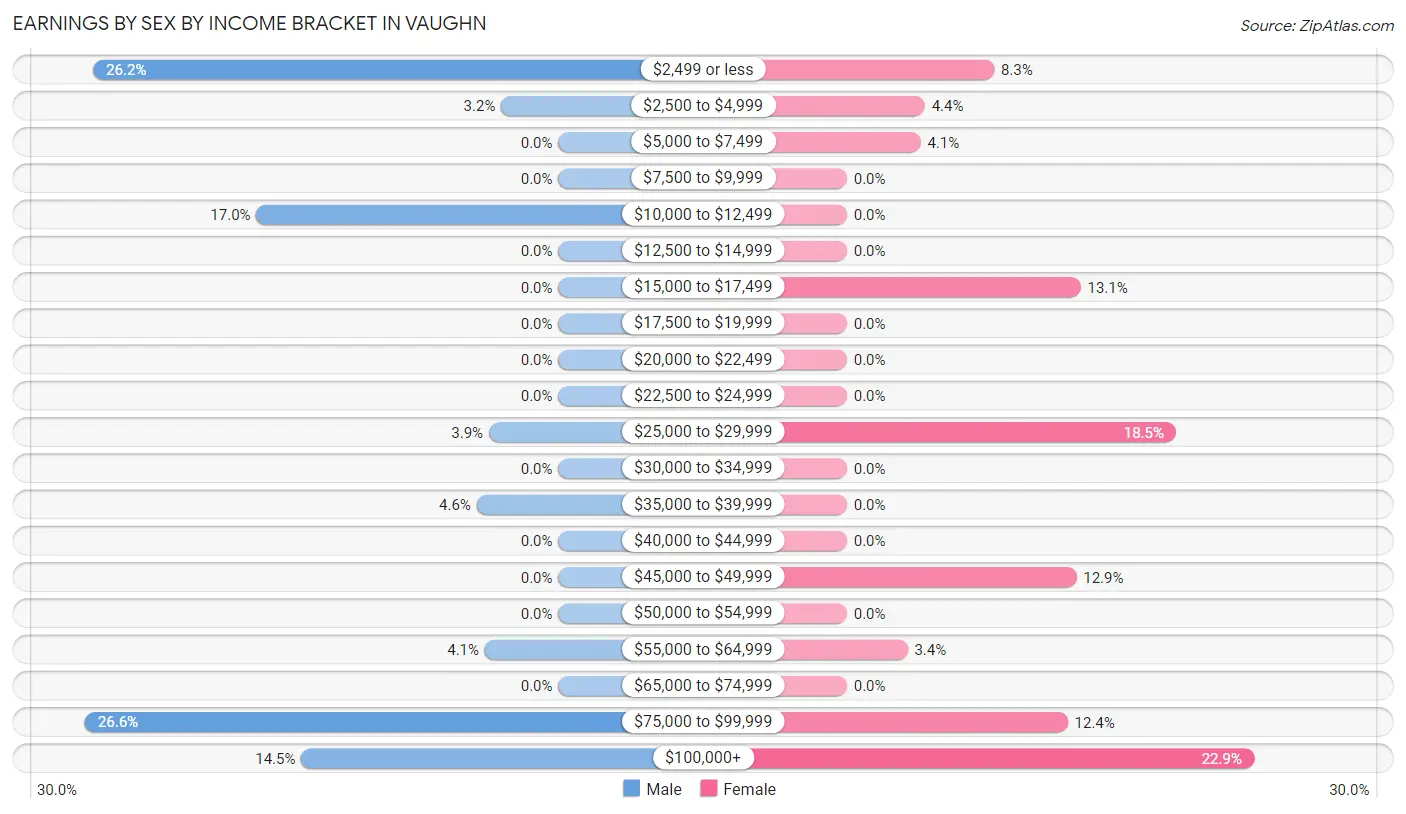
| Income | Male | Female |
| $2,499 or less | 114 (26.2%) | 34 (8.3%) |
| $2,500 to $4,999 | 14 (3.2%) | 18 (4.4%) |
| $5,000 to $7,499 | 0 (0.0%) | 17 (4.1%) |
| $7,500 to $9,999 | 0 (0.0%) | 0 (0.0%) |
| $10,000 to $12,499 | 74 (17.0%) | 0 (0.0%) |
| $12,500 to $14,999 | 0 (0.0%) | 0 (0.0%) |
| $15,000 to $17,499 | 0 (0.0%) | 54 (13.1%) |
| $17,500 to $19,999 | 0 (0.0%) | 0 (0.0%) |
| $20,000 to $22,499 | 0 (0.0%) | 0 (0.0%) |
| $22,500 to $24,999 | 0 (0.0%) | 0 (0.0%) |
| $25,000 to $29,999 | 17 (3.9%) | 76 (18.5%) |
| $30,000 to $34,999 | 0 (0.0%) | 0 (0.0%) |
| $35,000 to $39,999 | 20 (4.6%) | 0 (0.0%) |
| $40,000 to $44,999 | 0 (0.0%) | 0 (0.0%) |
| $45,000 to $49,999 | 0 (0.0%) | 53 (12.9%) |
| $50,000 to $54,999 | 0 (0.0%) | 0 (0.0%) |
| $55,000 to $64,999 | 18 (4.1%) | 14 (3.4%) |
| $65,000 to $74,999 | 0 (0.0%) | 0 (0.0%) |
| $75,000 to $99,999 | 116 (26.6%) | 51 (12.4%) |
| $100,000+ | 63 (14.4%) | 94 (22.9%) |
| Total | 436 (100.0%) | 411 (100.0%) |
Earnings by Sex by Educational Attainment in Vaughn
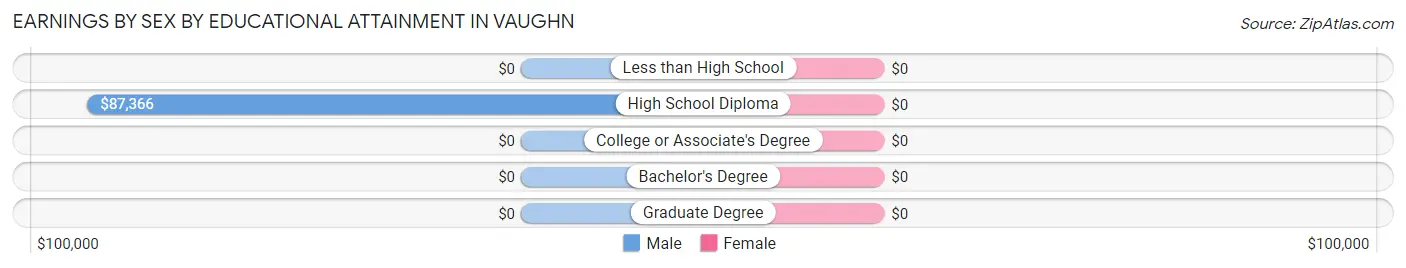
| Educational Attainment | Male Income | Female Income |
| Less than High School | - | - |
| High School Diploma | $87,366 | $0 |
| College or Associate's Degree | - | - |
| Bachelor's Degree | - | - |
| Graduate Degree | - | - |
| Total | $87,372 | $0 |
Family Income in Vaughn
Family Income Brackets in Vaughn
According to the Vaughn family income data, there are 191 families falling into the $150,000 to $199,999 income range, which is the most common income bracket and makes up 55.0% of all families.
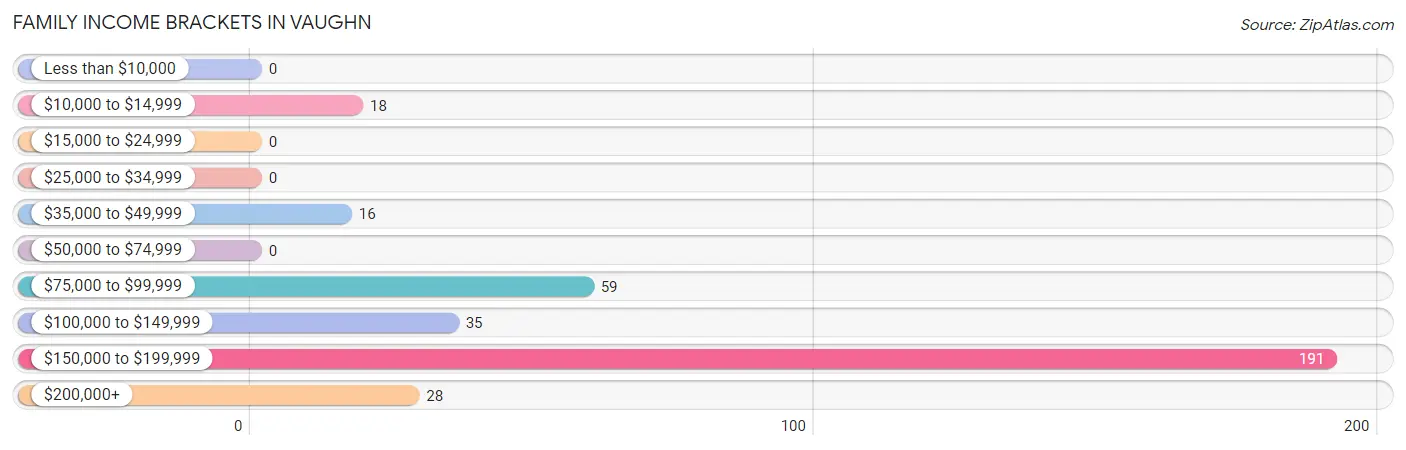
| Income Bracket | # Families | % Families |
| Less than $10,000 | 0 | 0.0% |
| $10,000 to $14,999 | 18 | 5.2% |
| $15,000 to $24,999 | 0 | 0.0% |
| $25,000 to $34,999 | 0 | 0.0% |
| $35,000 to $49,999 | 16 | 4.6% |
| $50,000 to $74,999 | 0 | 0.0% |
| $75,000 to $99,999 | 59 | 17.0% |
| $100,000 to $149,999 | 35 | 10.1% |
| $150,000 to $199,999 | 191 | 55.0% |
| $200,000+ | 28 | 8.1% |
Family Income by Famaliy Size in Vaughn
2-person families (134 | 38.6%) account for the highest median family income in Vaughn with $164,167 per family, while 2-person families (134 | 38.6%) have the highest median income of $82,084 per family member.
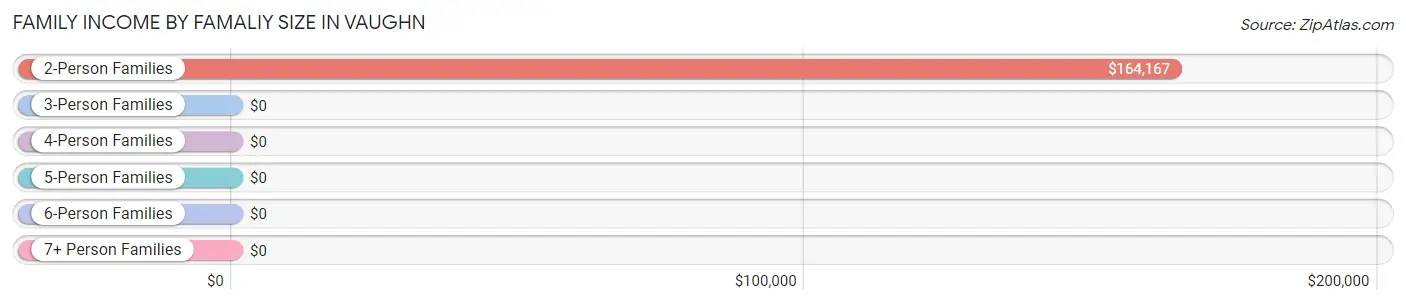
| Income Bracket | # Families | Median Income |
| 2-Person Families | 134 (38.6%) | $164,167 |
| 3-Person Families | 62 (17.9%) | $0 |
| 4-Person Families | 89 (25.7%) | $0 |
| 5-Person Families | 46 (13.3%) | $0 |
| 6-Person Families | 16 (4.6%) | $0 |
| 7+ Person Families | 0 (0.0%) | $0 |
| Total | 347 (100.0%) | $158,869 |
Family Income by Number of Earners in Vaughn
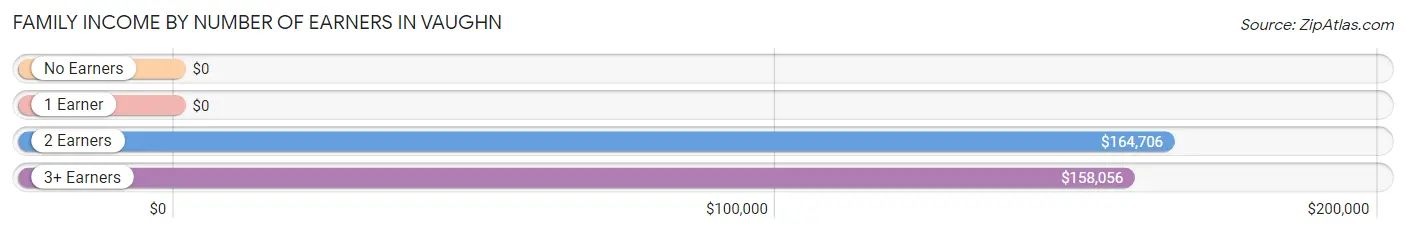
| Number of Earners | # Families | Median Income |
| No Earners | 33 (9.5%) | $0 |
| 1 Earner | 72 (20.7%) | $0 |
| 2 Earners | 112 (32.3%) | $164,706 |
| 3+ Earners | 130 (37.5%) | $158,056 |
| Total | 347 (100.0%) | $158,869 |
Household Income in Vaughn
Household Income Brackets in Vaughn
With 191 households falling in the category, the $150,000 to $199,999 income range is the most frequent in Vaughn, accounting for 39.3% of all households.
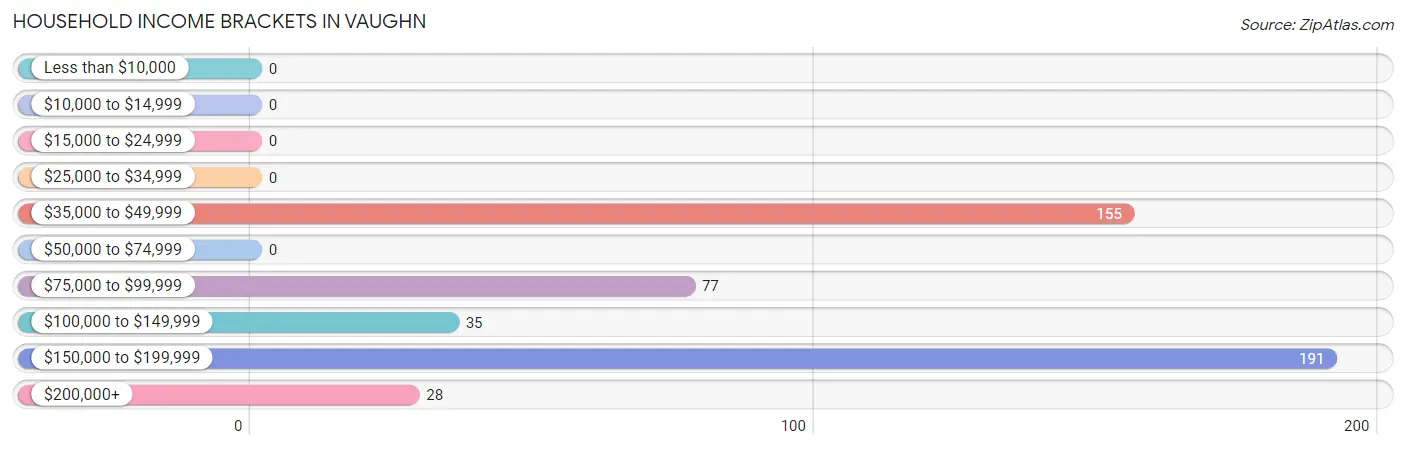
| Income Bracket | # Households | % Households |
| Less than $10,000 | 0 | 0.0% |
| $10,000 to $14,999 | 0 | 0.0% |
| $15,000 to $24,999 | 0 | 0.0% |
| $25,000 to $34,999 | 0 | 0.0% |
| $35,000 to $49,999 | 155 | 31.9% |
| $50,000 to $74,999 | 0 | 0.0% |
| $75,000 to $99,999 | 77 | 15.8% |
| $100,000 to $149,999 | 35 | 7.2% |
| $150,000 to $199,999 | 191 | 39.3% |
| $200,000+ | 28 | 5.8% |
Household Income by Householder Age in Vaughn
The median household income in Vaughn is $103,286, with the highest median household income of $158,710 found in the 45 to 64 years age bracket for the primary householder. A total of 323 households (66.5%) fall into this category.
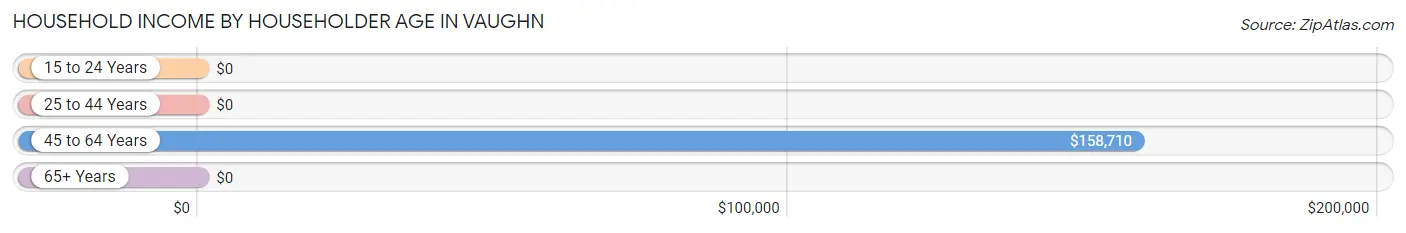
| Income Bracket | # Households | Median Income |
| 15 to 24 Years | 0 (0.0%) | $0 |
| 25 to 44 Years | 98 (20.2%) | $0 |
| 45 to 64 Years | 323 (66.5%) | $158,710 |
| 65+ Years | 65 (13.4%) | $0 |
| Total | 486 (100.0%) | $103,286 |
Poverty in Vaughn
Income Below Poverty by Sex and Age in Vaughn
With 0.1% poverty level for males and 9.3% for females among the residents of Vaughn, 55 to 64 year old males and under 5 year old females are the most vulnerable to poverty, with 1 males (1.0%) and 17 females (100.0%) in their respective age groups living below the poverty level.
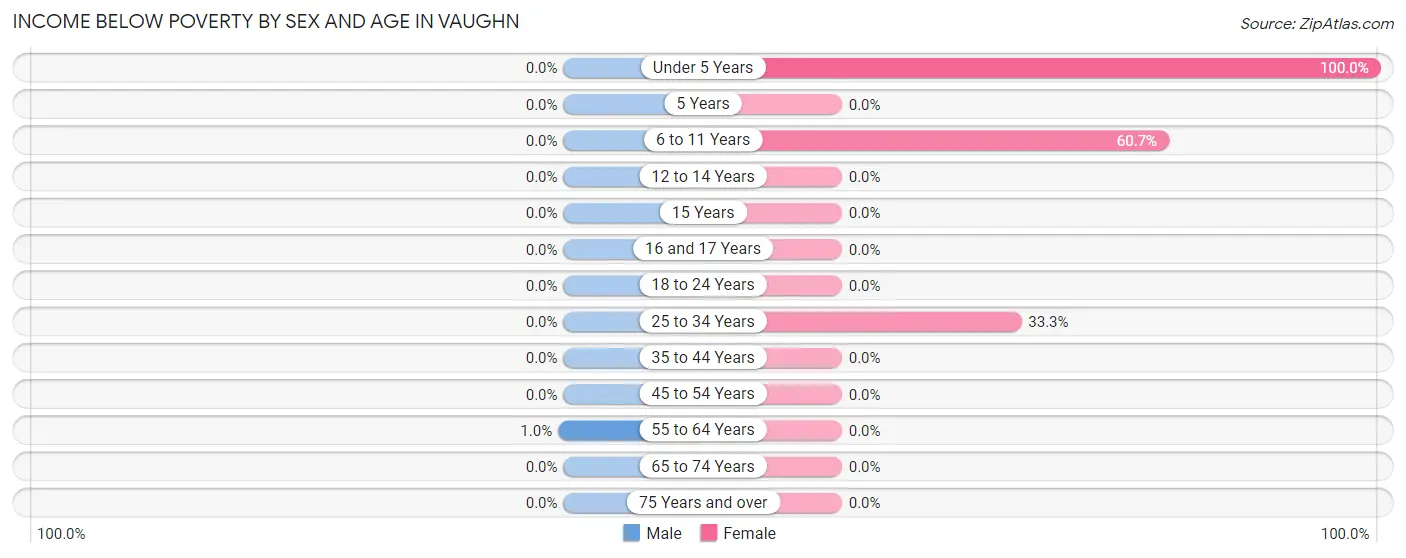
| Age Bracket | Male | Female |
| Under 5 Years | 0 (0.0%) | 17 (100.0%) |
| 5 Years | 0 (0.0%) | 0 (0.0%) |
| 6 to 11 Years | 0 (0.0%) | 17 (60.7%) |
| 12 to 14 Years | 0 (0.0%) | 0 (0.0%) |
| 15 Years | 0 (0.0%) | 0 (0.0%) |
| 16 and 17 Years | 0 (0.0%) | 0 (0.0%) |
| 18 to 24 Years | 0 (0.0%) | 0 (0.0%) |
| 25 to 34 Years | 0 (0.0%) | 18 (33.3%) |
| 35 to 44 Years | 0 (0.0%) | 0 (0.0%) |
| 45 to 54 Years | 0 (0.0%) | 0 (0.0%) |
| 55 to 64 Years | 1 (1.0%) | 0 (0.0%) |
| 65 to 74 Years | 0 (0.0%) | 0 (0.0%) |
| 75 Years and over | 0 (0.0%) | 0 (0.0%) |
| Total | 1 (0.1%) | 52 (9.3%) |
Income Above Poverty by Sex and Age in Vaughn
According to the poverty statistics in Vaughn, males aged under 5 years and females aged 18 to 24 years are the age groups that are most secure financially, with 100.0% of males and 100.0% of females in these age groups living above the poverty line.
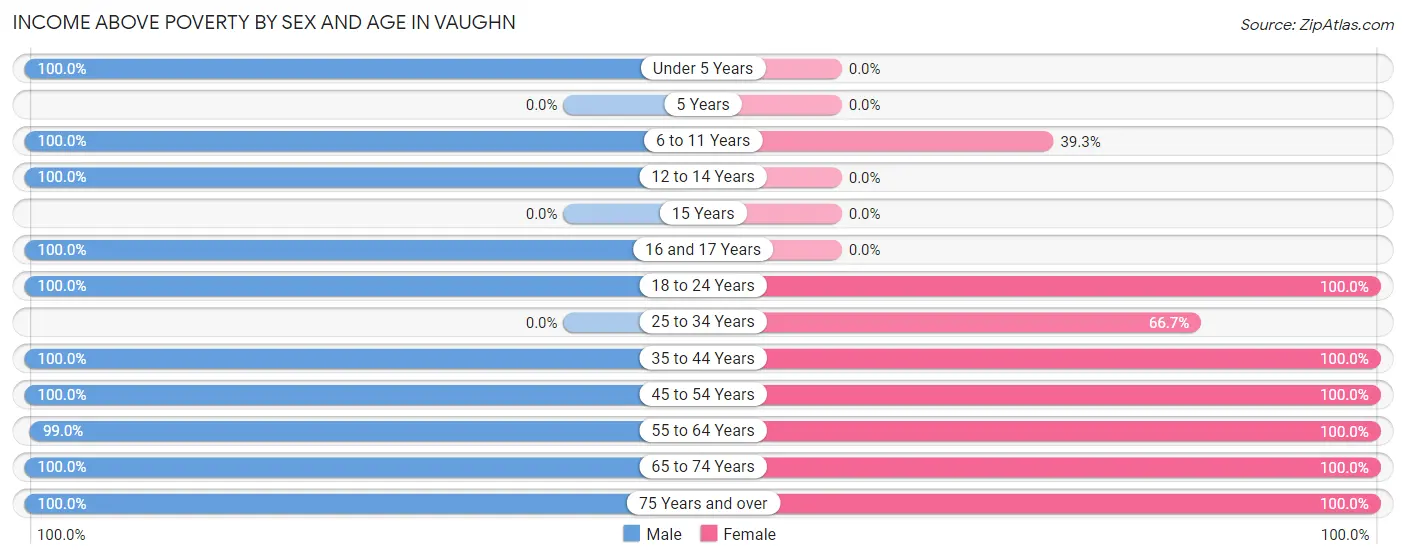
| Age Bracket | Male | Female |
| Under 5 Years | 17 (100.0%) | 0 (0.0%) |
| 5 Years | 0 (0.0%) | 0 (0.0%) |
| 6 to 11 Years | 63 (100.0%) | 11 (39.3%) |
| 12 to 14 Years | 46 (100.0%) | 0 (0.0%) |
| 15 Years | 0 (0.0%) | 0 (0.0%) |
| 16 and 17 Years | 100 (100.0%) | 0 (0.0%) |
| 18 to 24 Years | 90 (100.0%) | 90 (100.0%) |
| 25 to 34 Years | 0 (0.0%) | 36 (66.7%) |
| 35 to 44 Years | 28 (100.0%) | 64 (100.0%) |
| 45 to 54 Years | 167 (100.0%) | 197 (100.0%) |
| 55 to 64 Years | 99 (99.0%) | 50 (100.0%) |
| 65 to 74 Years | 67 (100.0%) | 15 (100.0%) |
| 75 Years and over | 49 (100.0%) | 42 (100.0%) |
| Total | 726 (99.9%) | 505 (90.7%) |
Income Below Poverty Among Married-Couple Families in Vaughn
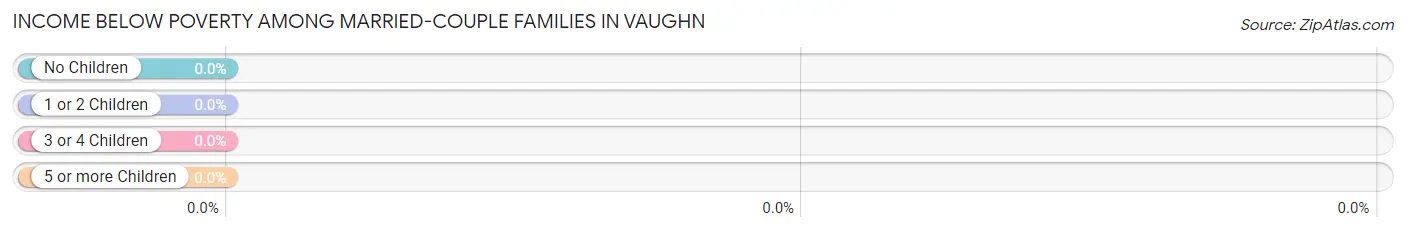
| Children | Above Poverty | Below Poverty |
| No Children | 150 (100.0%) | 0 (0.0%) |
| 1 or 2 Children | 168 (100.0%) | 0 (0.0%) |
| 3 or 4 Children | 11 (100.0%) | 0 (0.0%) |
| 5 or more Children | 0 (0.0%) | 0 (0.0%) |
| Total | 329 (100.0%) | 0 (0.0%) |
Income Below Poverty Among Single-Parent Households in Vaughn
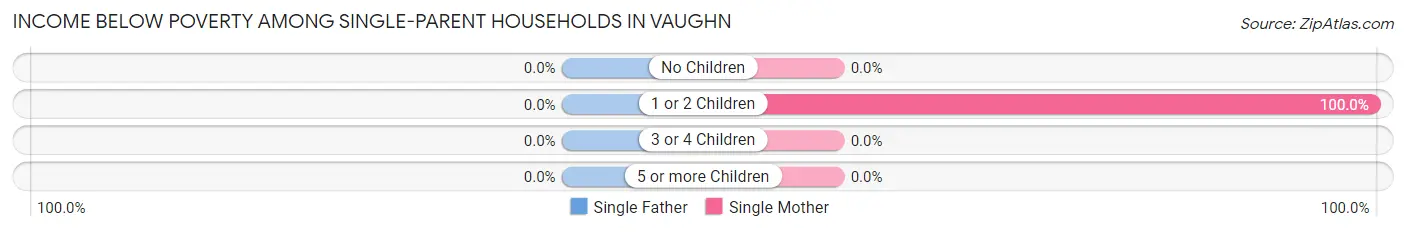
| Children | Single Father | Single Mother |
| No Children | 0 (0.0%) | 0 (0.0%) |
| 1 or 2 Children | 0 (0.0%) | 18 (100.0%) |
| 3 or 4 Children | 0 (0.0%) | 0 (0.0%) |
| 5 or more Children | 0 (0.0%) | 0 (0.0%) |
| Total | 0 (0.0%) | 18 (100.0%) |
Income Below Poverty Among Married-Couple vs Single-Parent Households in Vaughn
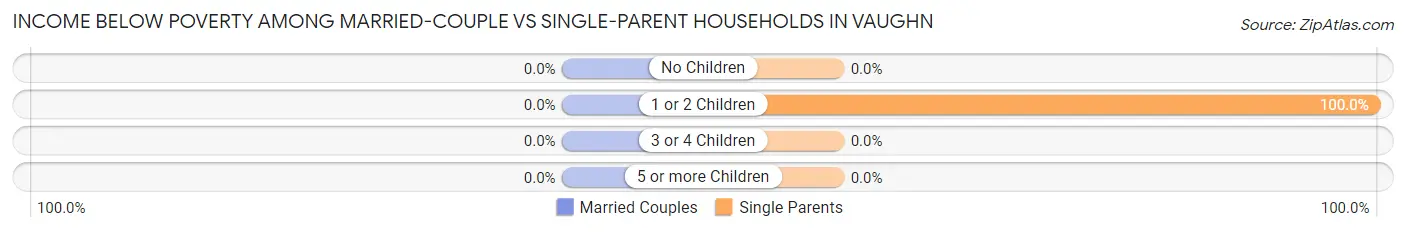
| Children | Married-Couple Families | Single-Parent Households |
| No Children | 0 (0.0%) | 0 (0.0%) |
| 1 or 2 Children | 0 (0.0%) | 18 (100.0%) |
| 3 or 4 Children | 0 (0.0%) | 0 (0.0%) |
| 5 or more Children | 0 (0.0%) | 0 (0.0%) |
| Total | 0 (0.0%) | 18 (100.0%) |
Race in Vaughn
The most populous races in Vaughn are White / Caucasian (1,095 | 83.4%), Two or more Races (182 | 13.9%), and Hispanic or Latino (65 | 5.0%).
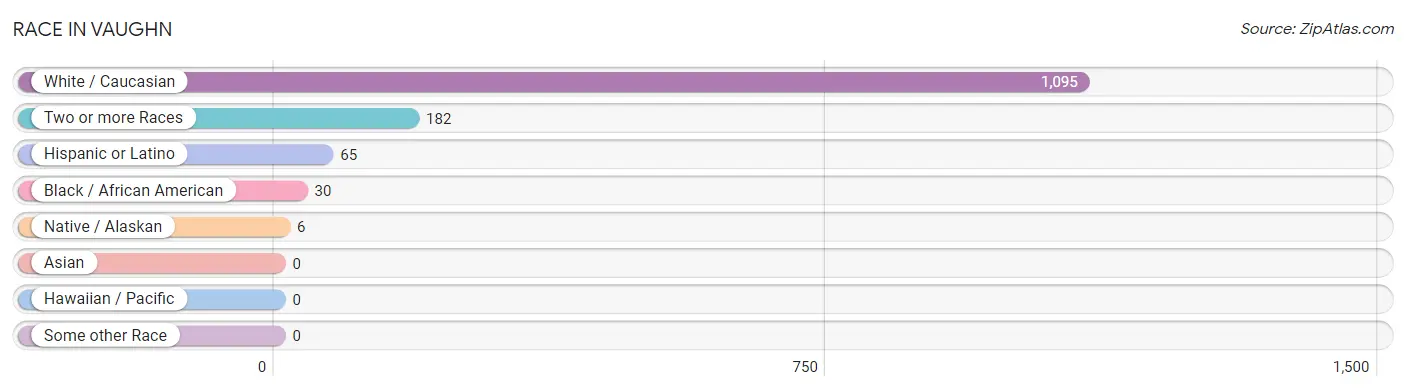
| Race | # Population | % Population |
| Asian | 0 | 0.0% |
| Black / African American | 30 | 2.3% |
| Hawaiian / Pacific | 0 | 0.0% |
| Hispanic or Latino | 65 | 5.0% |
| Native / Alaskan | 6 | 0.5% |
| White / Caucasian | 1,095 | 83.4% |
| Two or more Races | 182 | 13.9% |
| Some other Race | 0 | 0.0% |
| Total | 1,313 | 100.0% |
Ancestry in Vaughn
The most populous ancestries reported in Vaughn are English (405 | 30.8%), Irish (191 | 14.5%), Korean (182 | 13.9%), German (125 | 9.5%), and Scotch-Irish (105 | 8.0%), together accounting for 76.8% of all Vaughn residents.
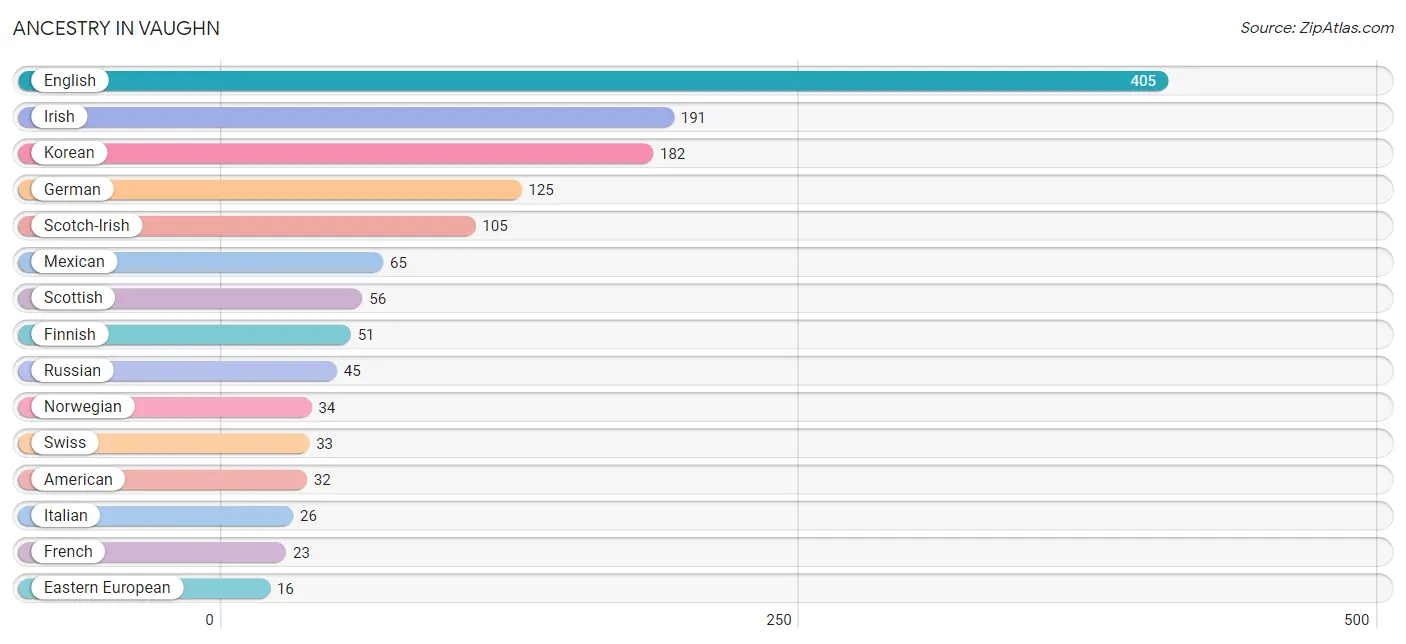
| Ancestry | # Population | % Population |
| American | 32 | 2.4% |
| Colville | 6 | 0.5% |
| Eastern European | 16 | 1.2% |
| English | 405 | 30.8% |
| Finnish | 51 | 3.9% |
| French | 23 | 1.8% |
| German | 125 | 9.5% |
| Irish | 191 | 14.5% |
| Italian | 26 | 2.0% |
| Korean | 182 | 13.9% |
| Mexican | 65 | 5.0% |
| Norwegian | 34 | 2.6% |
| Russian | 45 | 3.4% |
| Scotch-Irish | 105 | 8.0% |
| Scottish | 56 | 4.3% |
| Swiss | 33 | 2.5% | View All 16 Rows |
Immigrants in Vaughn
The most numerous immigrant groups reported in Vaughn came from Central America (65 | 5.0%), Latin America (65 | 5.0%), and Mexico (65 | 5.0%), together accounting for 14.9% of all Vaughn residents.
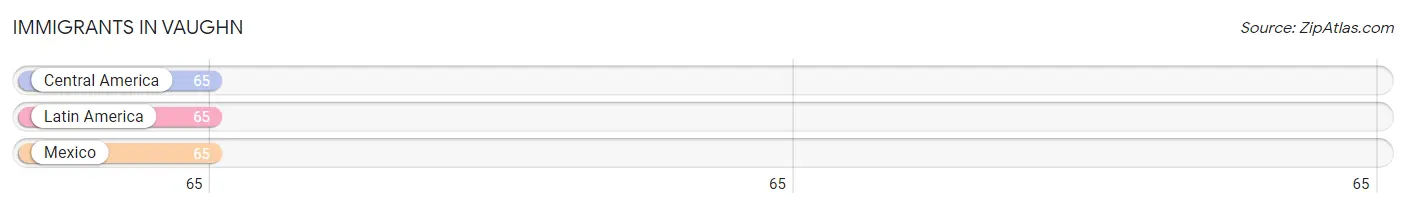
| Immigration Origin | # Population | % Population |
| Central America | 65 | 5.0% |
| Latin America | 65 | 5.0% |
| Mexico | 65 | 5.0% | View All 3 Rows |
Sex and Age in Vaughn
Sex and Age in Vaughn
The most populous age groups in Vaughn are 15 to 19 Years (114 | 15.7%) for men and 45 to 49 Years (118 | 20.2%) for women.
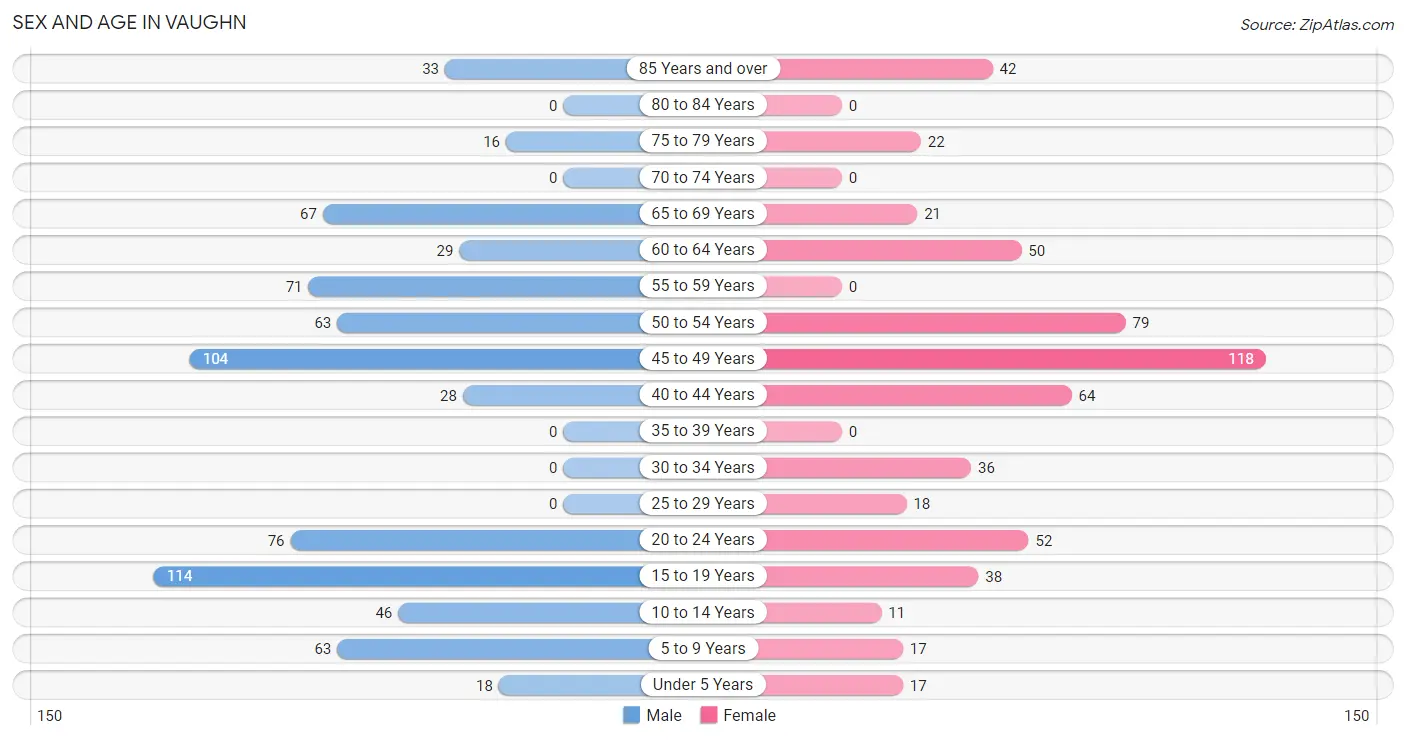
| Age Bracket | Male | Female |
| Under 5 Years | 18 (2.5%) | 17 (2.9%) |
| 5 to 9 Years | 63 (8.6%) | 17 (2.9%) |
| 10 to 14 Years | 46 (6.3%) | 11 (1.9%) |
| 15 to 19 Years | 114 (15.7%) | 38 (6.5%) |
| 20 to 24 Years | 76 (10.4%) | 52 (8.9%) |
| 25 to 29 Years | 0 (0.0%) | 18 (3.1%) |
| 30 to 34 Years | 0 (0.0%) | 36 (6.1%) |
| 35 to 39 Years | 0 (0.0%) | 0 (0.0%) |
| 40 to 44 Years | 28 (3.8%) | 64 (10.9%) |
| 45 to 49 Years | 104 (14.3%) | 118 (20.2%) |
| 50 to 54 Years | 63 (8.6%) | 79 (13.5%) |
| 55 to 59 Years | 71 (9.8%) | 0 (0.0%) |
| 60 to 64 Years | 29 (4.0%) | 50 (8.6%) |
| 65 to 69 Years | 67 (9.2%) | 21 (3.6%) |
| 70 to 74 Years | 0 (0.0%) | 0 (0.0%) |
| 75 to 79 Years | 16 (2.2%) | 22 (3.8%) |
| 80 to 84 Years | 0 (0.0%) | 0 (0.0%) |
| 85 Years and over | 33 (4.5%) | 42 (7.2%) |
| Total | 728 (100.0%) | 585 (100.0%) |
Families and Households in Vaughn
Median Family Size in Vaughn
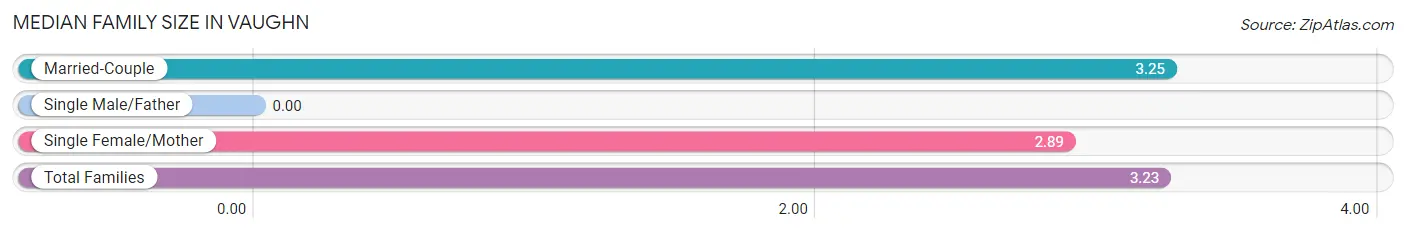
| Family Type | # Families | Family Size |
| Married-Couple | 329 (94.8%) | 3.25 |
| Single Male/Father | 0 (0.0%) | - |
| Single Female/Mother | 18 (5.2%) | 2.89 |
| Total Families | 347 (100.0%) | 3.23 |
Median Household Size in Vaughn
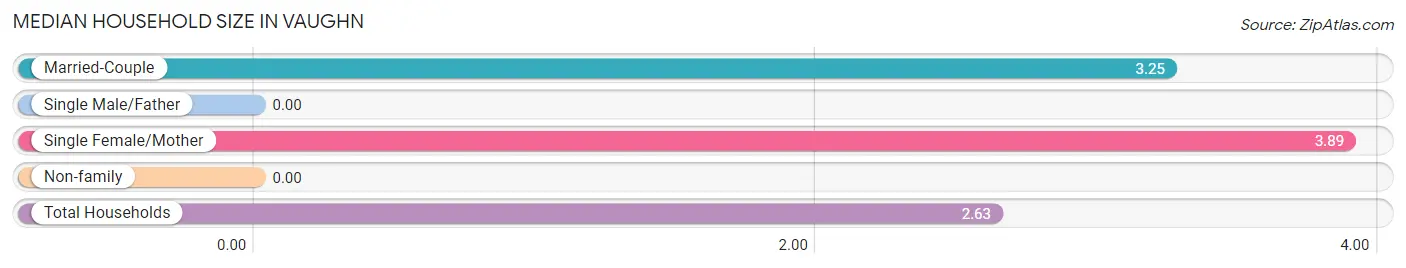
| Household Type | # Households | Household Size |
| Married-Couple | 329 (67.7%) | 3.25 |
| Single Male/Father | 0 (0.0%) | - |
| Single Female/Mother | 18 (3.7%) | 3.89 |
| Non-family | 139 (28.6%) | - |
| Total Households | 486 (100.0%) | 2.63 |
Household Size by Marriage Status in Vaughn
Out of a total of 486 households in Vaughn, 347 (71.4%) are family households, while 139 (28.6%) are nonfamily households. The most numerous type of family households are 2-person households, comprising 134, and the most common type of nonfamily households are 1-person households, comprising 139.
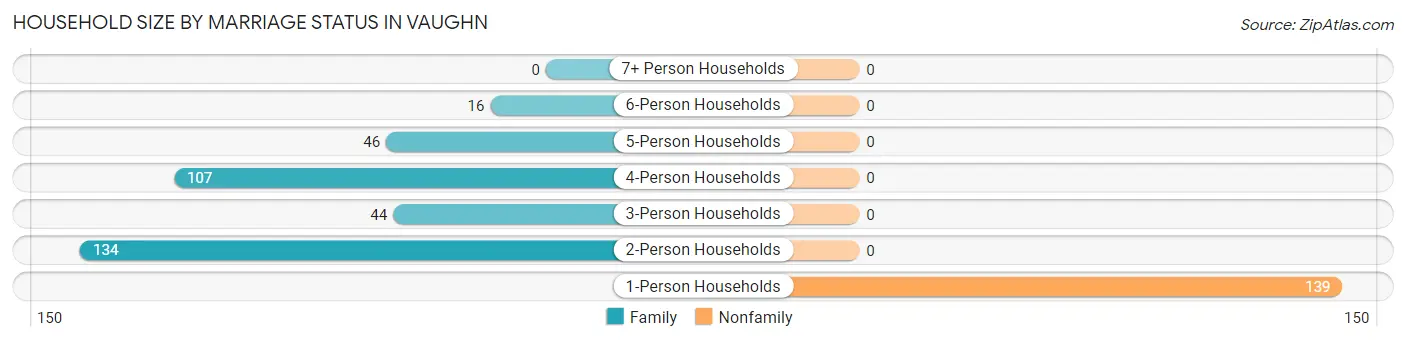
| Household Size | Family Households | Nonfamily Households |
| 1-Person Households | - | 139 (28.6%) |
| 2-Person Households | 134 (27.6%) | 0 (0.0%) |
| 3-Person Households | 44 (9.0%) | 0 (0.0%) |
| 4-Person Households | 107 (22.0%) | 0 (0.0%) |
| 5-Person Households | 46 (9.5%) | 0 (0.0%) |
| 6-Person Households | 16 (3.3%) | 0 (0.0%) |
| 7+ Person Households | 0 (0.0%) | 0 (0.0%) |
| Total | 347 (71.4%) | 139 (28.6%) |
Female Fertility in Vaughn
Fertility by Age in Vaughn
| Age Bracket | Women with Births | Births / 1,000 Women |
| 15 to 19 years | 0 (0.0%) | 0.0 |
| 20 to 34 years | 0 (0.0%) | 0.0 |
| 35 to 50 years | 0 (0.0%) | 0.0 |
| Total | 0 (0.0%) | 0.0 |
Fertility by Age by Marriage Status in Vaughn
| Age Bracket | Married | Unmarried |
| 15 to 19 years | 0 (0.0%) | 0 (0.0%) |
| 20 to 34 years | 0 (0.0%) | 0 (0.0%) |
| 35 to 50 years | 0 (0.0%) | 0 (0.0%) |
| Total | 0 (0.0%) | 0 (0.0%) |
Fertility by Education in Vaughn
| Educational Attainment | Women with Births | Births / 1,000 Women |
| Less than High School | 0 (0.0%) | 0.0 |
| High School Diploma | 0 (0.0%) | 0.0 |
| College or Associate's Degree | 0 (0.0%) | 0.0 |
| Bachelor's Degree | 0 (0.0%) | 0.0 |
| Graduate Degree | 0 (0.0%) | 0.0 |
| Total | 0 (0.0%) | 0.0 |
Fertility by Education by Marriage Status in Vaughn
| Educational Attainment | Married | Unmarried |
| Less than High School | 0 (0.0%) | 0 (0.0%) |
| High School Diploma | 0 (0.0%) | 0 (0.0%) |
| College or Associate's Degree | 0 (0.0%) | 0 (0.0%) |
| Bachelor's Degree | 0 (0.0%) | 0 (0.0%) |
| Graduate Degree | 0 (0.0%) | 0 (0.0%) |
| Total | 0 (0.0%) | 0 (0.0%) |
Employment Characteristics in Vaughn
Employment by Class of Employer in Vaughn
Among the 807 employed individuals in Vaughn, private company employees (558 | 69.1%), federal government employees (114 | 14.1%), and not-for-profit organizations (59 | 7.3%) make up the most common classes of employment.
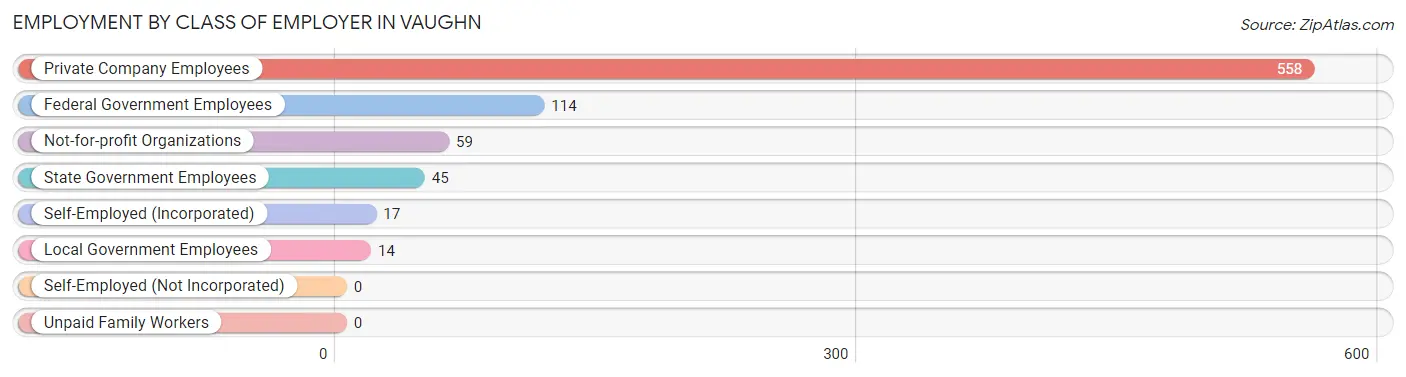
| Employer Class | # Employees | % Employees |
| Private Company Employees | 558 | 69.1% |
| Self-Employed (Incorporated) | 17 | 2.1% |
| Self-Employed (Not Incorporated) | 0 | 0.0% |
| Not-for-profit Organizations | 59 | 7.3% |
| Local Government Employees | 14 | 1.7% |
| State Government Employees | 45 | 5.6% |
| Federal Government Employees | 114 | 14.1% |
| Unpaid Family Workers | 0 | 0.0% |
| Total | 807 | 100.0% |
Employment Status by Age in Vaughn
According to the labor force statistics for Vaughn, out of the total population over 16 years of age (1,141), 75.3% or 859 individuals are in the labor force, with 6.1% or 52 of them unemployed. The age group with the highest labor force participation rate is 30 to 34 years, with 100.0% or 36 individuals in the labor force. Within the labor force, the 16 to 19 years age range has the highest percentage of unemployed individuals, with 19.1% or 27 of them being unemployed.
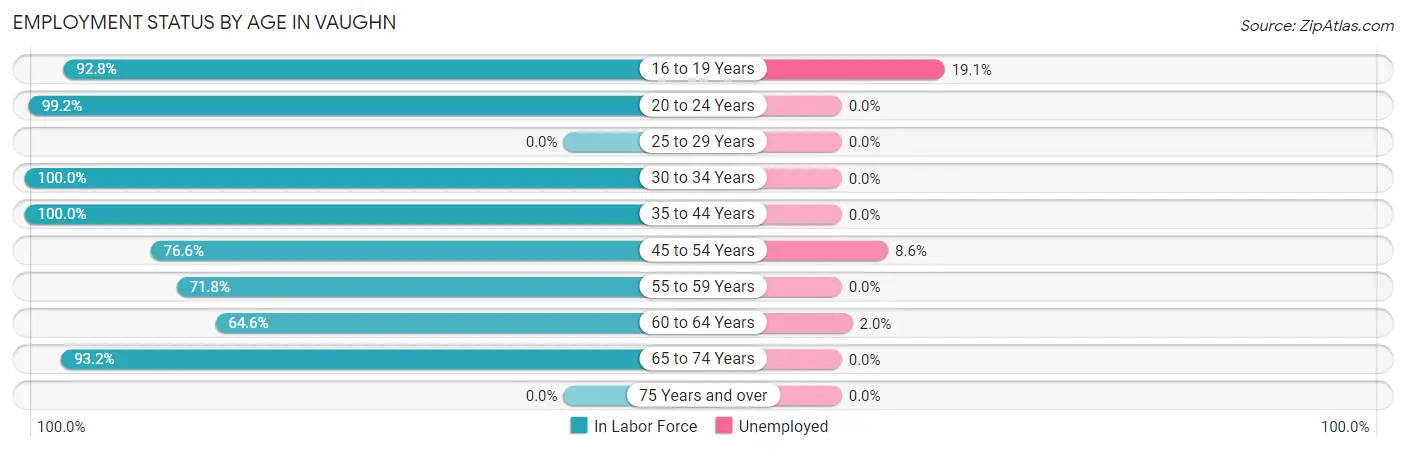
| Age Bracket | In Labor Force | Unemployed |
| 16 to 19 Years | 141 (92.8%) | 27 (19.1%) |
| 20 to 24 Years | 127 (99.2%) | 0 (0.0%) |
| 25 to 29 Years | 0 (0.0%) | 0 (0.0%) |
| 30 to 34 Years | 36 (100.0%) | 0 (0.0%) |
| 35 to 44 Years | 92 (100.0%) | 0 (0.0%) |
| 45 to 54 Years | 279 (76.6%) | 24 (8.6%) |
| 55 to 59 Years | 51 (71.8%) | 0 (0.0%) |
| 60 to 64 Years | 51 (64.6%) | 1 (2.0%) |
| 65 to 74 Years | 82 (93.2%) | 0 (0.0%) |
| 75 Years and over | 0 (0.0%) | 0 (0.0%) |
| Total | 859 (75.3%) | 52 (6.1%) |
Employment Status by Educational Attainment in Vaughn
According to labor force statistics for Vaughn, 77.1% of individuals (509) out of the total population between 25 and 64 years of age (660) are in the labor force, with 4.9% or 25 of them being unemployed. The group with the highest labor force participation rate are those with the educational attainment of high school diploma, with 100.0% or 72 individuals in the labor force. Within the labor force, individuals with college / associate degree education have the highest percentage of unemployment, with 8.0% or 24 of them being unemployed.
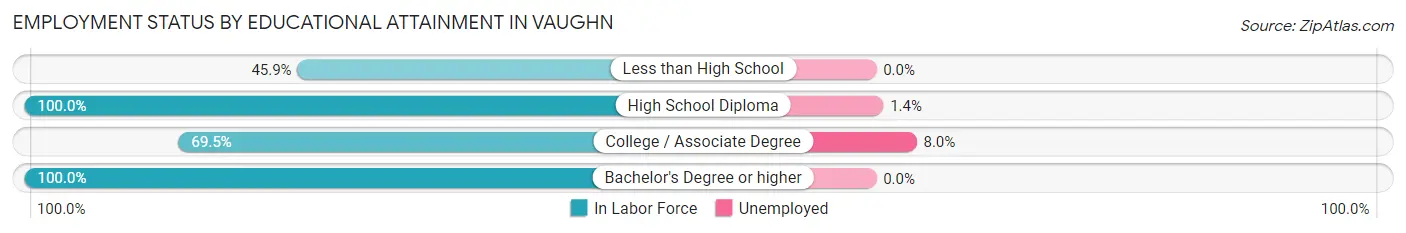
| Educational Attainment | In Labor Force | Unemployed |
| Less than High School | 17 (45.9%) | 0 (0.0%) |
| High School Diploma | 72 (100.0%) | 1 (1.4%) |
| College / Associate Degree | 299 (69.5%) | 34 (8.0%) |
| Bachelor's Degree or higher | 121 (100.0%) | 0 (0.0%) |
| Total | 509 (77.1%) | 32 (4.9%) |
Employment Occupations by Sex in Vaughn
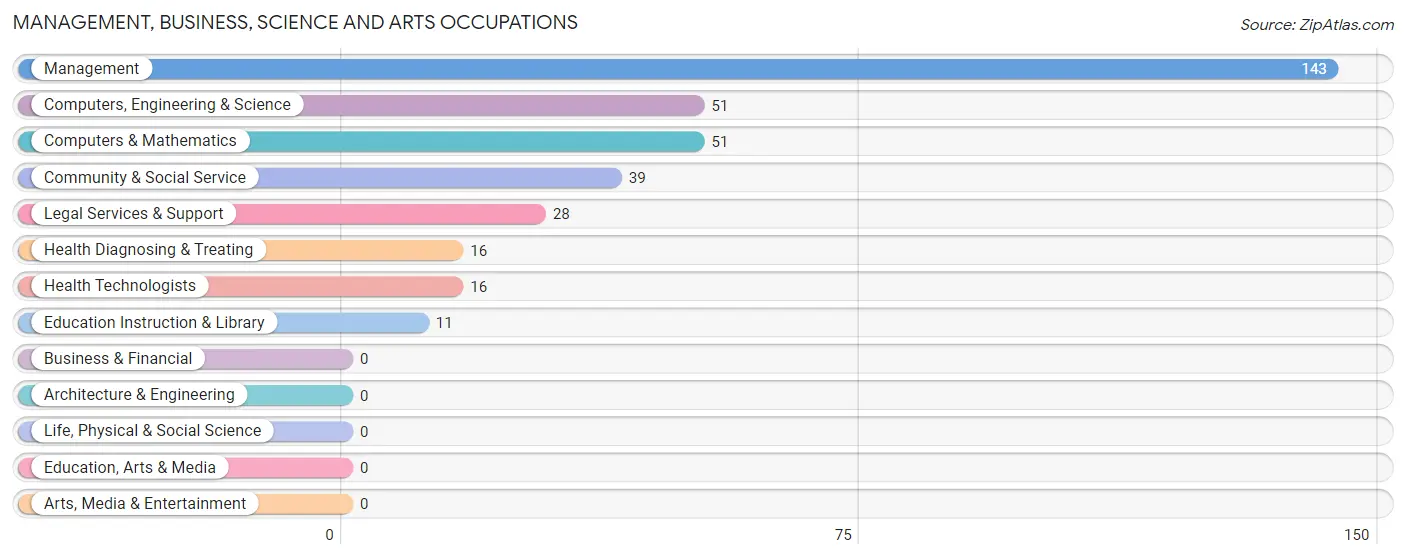
Management, Business, Science and Arts Occupations
The most common Management, Business, Science and Arts occupations in Vaughn are Management (143 | 17.7%), Computers, Engineering & Science (51 | 6.3%), Computers & Mathematics (51 | 6.3%), Community & Social Service (39 | 4.8%), and Legal Services & Support (28 | 3.5%).
Management, Business, Science and Arts Occupations by Sex
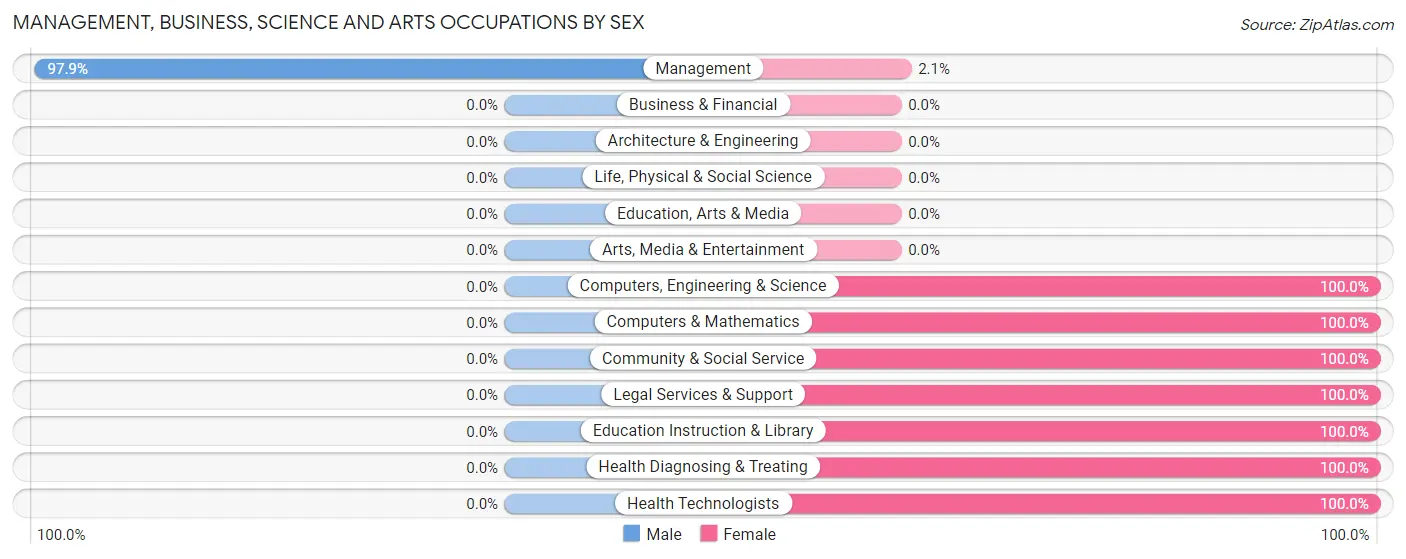
| Occupation | Male | Female |
| Management | 140 (97.9%) | 3 (2.1%) |
| Business & Financial | 0 (0.0%) | 0 (0.0%) |
| Computers, Engineering & Science | 0 (0.0%) | 51 (100.0%) |
| Computers & Mathematics | 0 (0.0%) | 51 (100.0%) |
| Architecture & Engineering | 0 (0.0%) | 0 (0.0%) |
| Life, Physical & Social Science | 0 (0.0%) | 0 (0.0%) |
| Community & Social Service | 0 (0.0%) | 39 (100.0%) |
| Education, Arts & Media | 0 (0.0%) | 0 (0.0%) |
| Legal Services & Support | 0 (0.0%) | 28 (100.0%) |
| Education Instruction & Library | 0 (0.0%) | 11 (100.0%) |
| Arts, Media & Entertainment | 0 (0.0%) | 0 (0.0%) |
| Health Diagnosing & Treating | 0 (0.0%) | 16 (100.0%) |
| Health Technologists | 0 (0.0%) | 16 (100.0%) |
| Total (Category) | 140 (56.2%) | 109 (43.8%) |
| Total (Overall) | 415 (51.4%) | 392 (48.6%) |
Services Occupations
The most common Services occupations in Vaughn are Food Preparation & Serving (151 | 18.7%), Healthcare Support (102 | 12.6%), Security & Protection (61 | 7.6%), Personal Care & Service (59 | 7.3%), and Firefighting & Prevention (50 | 6.2%).
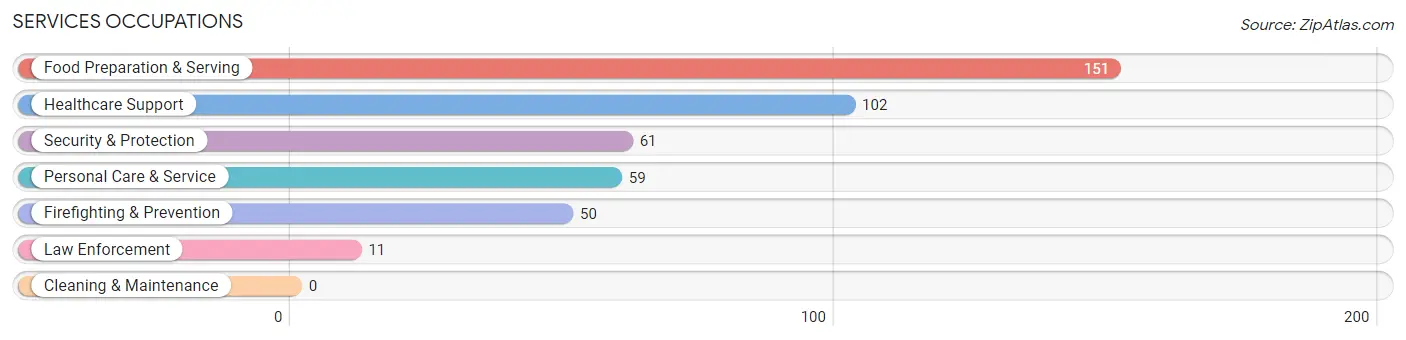
Services Occupations by Sex
Within the Services occupations in Vaughn, the most male-oriented occupations are Law Enforcement (100.0%), Food Preparation & Serving (88.7%), and Security & Protection (18.0%), while the most female-oriented occupations are Healthcare Support (100.0%), Firefighting & Prevention (100.0%), and Personal Care & Service (100.0%).
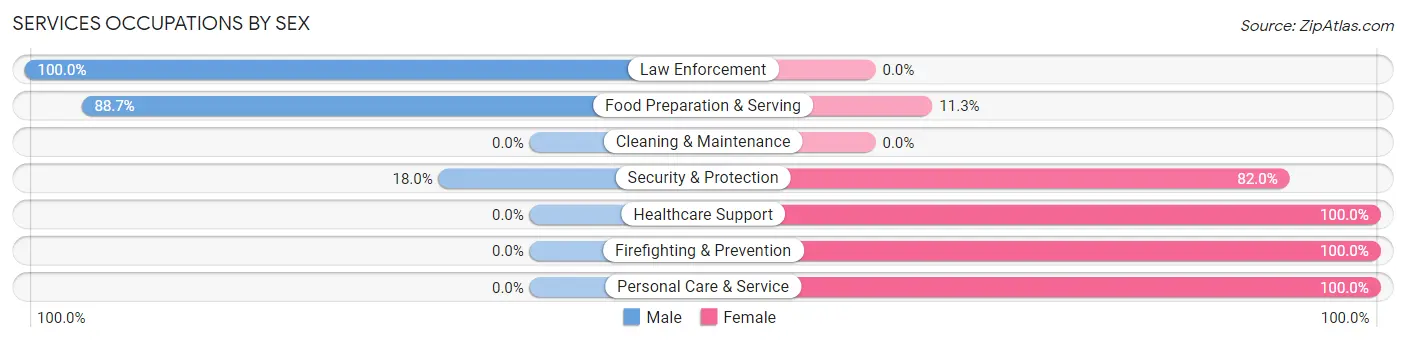
| Occupation | Male | Female |
| Healthcare Support | 0 (0.0%) | 102 (100.0%) |
| Security & Protection | 11 (18.0%) | 50 (82.0%) |
| Firefighting & Prevention | 0 (0.0%) | 50 (100.0%) |
| Law Enforcement | 11 (100.0%) | 0 (0.0%) |
| Food Preparation & Serving | 134 (88.7%) | 17 (11.3%) |
| Cleaning & Maintenance | 0 (0.0%) | 0 (0.0%) |
| Personal Care & Service | 0 (0.0%) | 59 (100.0%) |
| Total (Category) | 145 (38.9%) | 228 (61.1%) |
| Total (Overall) | 415 (51.4%) | 392 (48.6%) |
Sales and Office Occupations
Sales and Office Occupations by Sex
| Occupation | Male | Female |
| Sales & Related | 0 (0.0%) | 0 (0.0%) |
| Office & Administration | 0 (0.0%) | 0 (0.0%) |
| Total (Category) | 0 (0.0%) | 0 (0.0%) |
| Total (Overall) | 415 (51.4%) | 392 (48.6%) |
Natural Resources, Construction and Maintenance Occupations
The most common Natural Resources, Construction and Maintenance occupations in Vaughn are Installation, Maintenance & Repair (28 | 3.5%), and Construction & Extraction (18 | 2.2%).
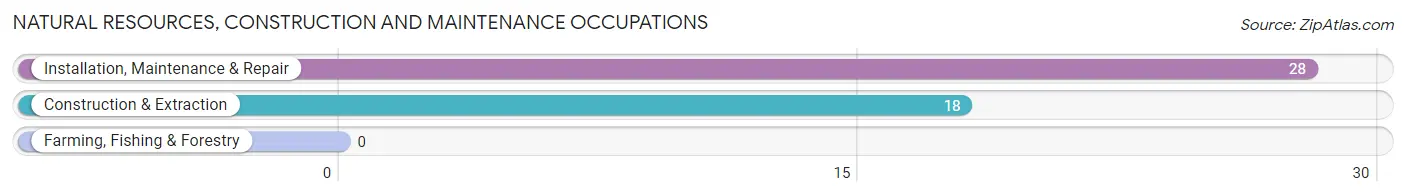
Natural Resources, Construction and Maintenance Occupations by Sex
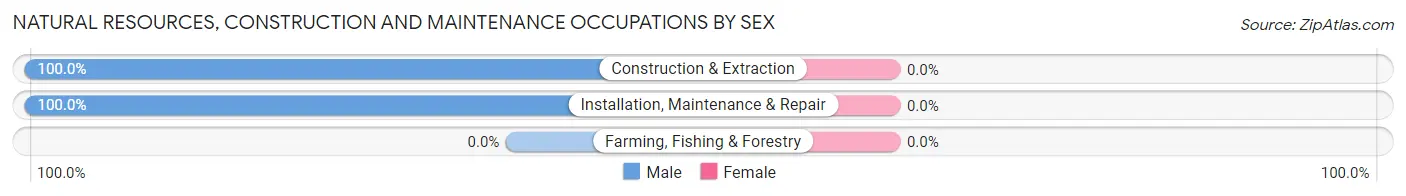
| Occupation | Male | Female |
| Farming, Fishing & Forestry | 0 (0.0%) | 0 (0.0%) |
| Construction & Extraction | 18 (100.0%) | 0 (0.0%) |
| Installation, Maintenance & Repair | 28 (100.0%) | 0 (0.0%) |
| Total (Category) | 46 (100.0%) | 0 (0.0%) |
| Total (Overall) | 415 (51.4%) | 392 (48.6%) |
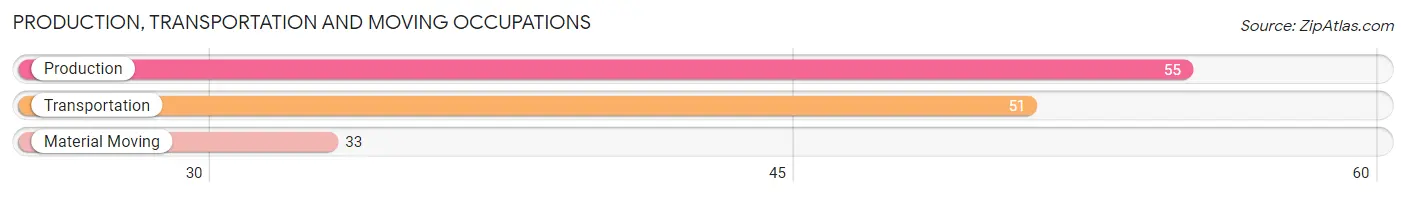
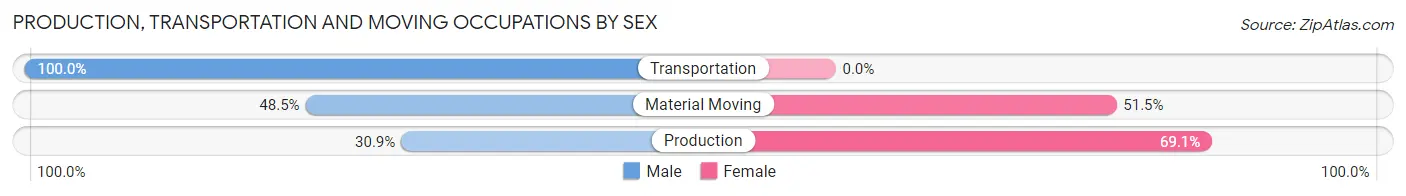
Production, Transportation and Moving Occupations
The most common Production, Transportation and Moving occupations in Vaughn are Production (55 | 6.8%), Transportation (51 | 6.3%), and Material Moving (33 | 4.1%).
Production, Transportation and Moving Occupations by Sex
| Occupation | Male | Female |
| Production | 17 (30.9%) | 38 (69.1%) |
| Transportation | 51 (100.0%) | 0 (0.0%) |
| Material Moving | 16 (48.5%) | 17 (51.5%) |
| Total (Category) | 84 (60.4%) | 55 (39.6%) |
| Total (Overall) | 415 (51.4%) | 392 (48.6%) |
Employment Industries by Sex in Vaughn
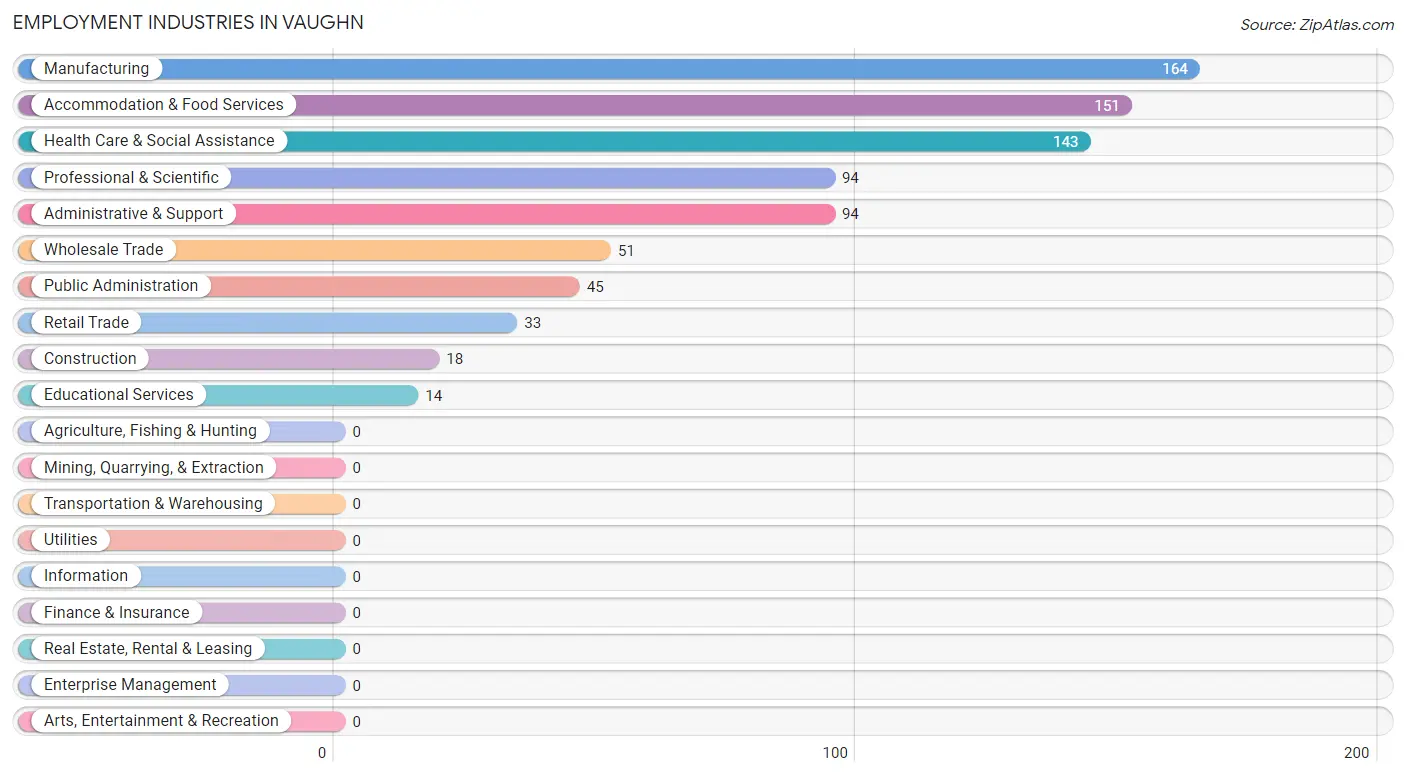
Employment Industries in Vaughn
The major employment industries in Vaughn include Manufacturing (164 | 20.3%), Accommodation & Food Services (151 | 18.7%), Health Care & Social Assistance (143 | 17.7%), Professional & Scientific (94 | 11.7%), and Administrative & Support (94 | 11.7%).
Employment Industries by Sex in Vaughn
The Vaughn industries that see more men than women are Construction (100.0%), Wholesale Trade (100.0%), and Retail Trade (100.0%), whereas the industries that tend to have a higher number of women are Educational Services (100.0%), Health Care & Social Assistance (100.0%), and Public Administration (75.6%).
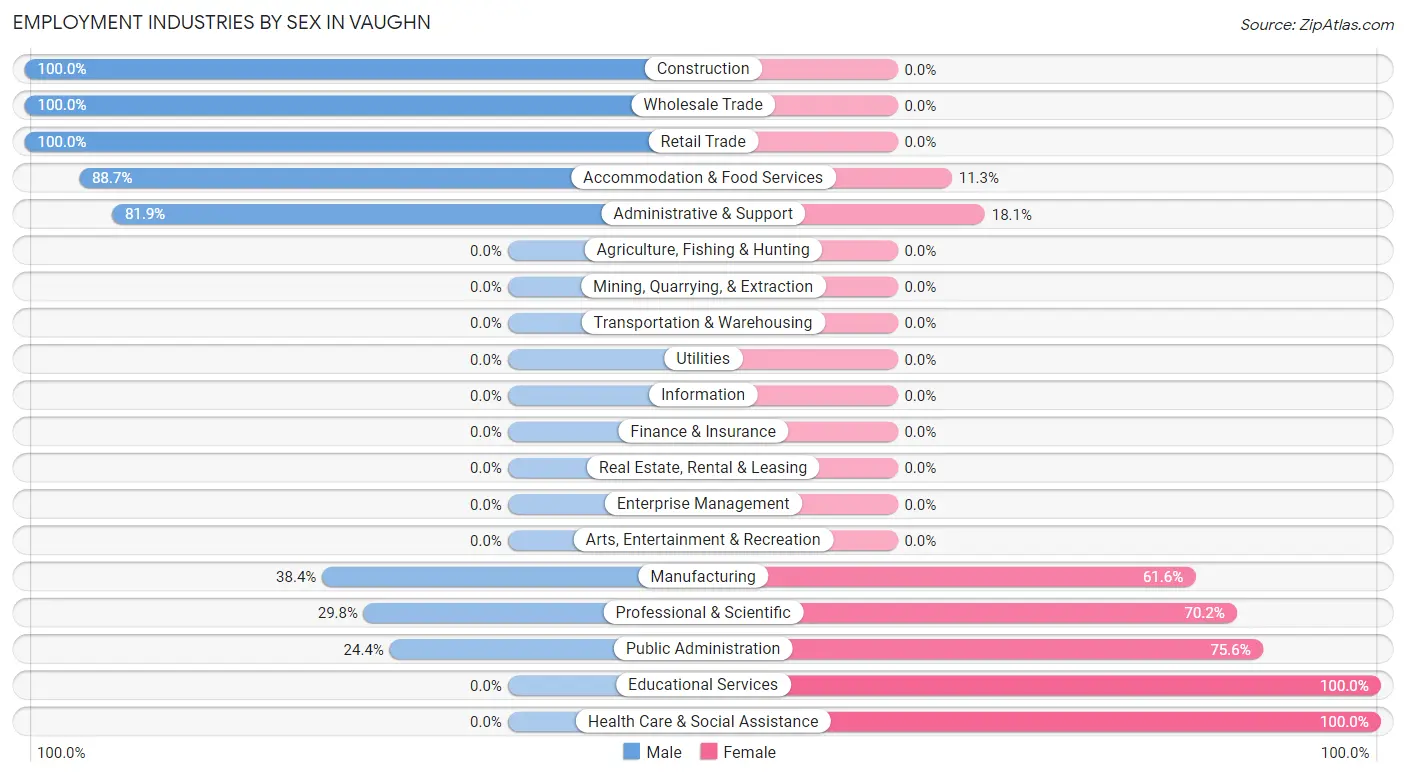
| Industry | Male | Female |
| Agriculture, Fishing & Hunting | 0 (0.0%) | 0 (0.0%) |
| Mining, Quarrying, & Extraction | 0 (0.0%) | 0 (0.0%) |
| Construction | 18 (100.0%) | 0 (0.0%) |
| Manufacturing | 63 (38.4%) | 101 (61.6%) |
| Wholesale Trade | 51 (100.0%) | 0 (0.0%) |
| Retail Trade | 33 (100.0%) | 0 (0.0%) |
| Transportation & Warehousing | 0 (0.0%) | 0 (0.0%) |
| Utilities | 0 (0.0%) | 0 (0.0%) |
| Information | 0 (0.0%) | 0 (0.0%) |
| Finance & Insurance | 0 (0.0%) | 0 (0.0%) |
| Real Estate, Rental & Leasing | 0 (0.0%) | 0 (0.0%) |
| Professional & Scientific | 28 (29.8%) | 66 (70.2%) |
| Enterprise Management | 0 (0.0%) | 0 (0.0%) |
| Administrative & Support | 77 (81.9%) | 17 (18.1%) |
| Educational Services | 0 (0.0%) | 14 (100.0%) |
| Health Care & Social Assistance | 0 (0.0%) | 143 (100.0%) |
| Arts, Entertainment & Recreation | 0 (0.0%) | 0 (0.0%) |
| Accommodation & Food Services | 134 (88.7%) | 17 (11.3%) |
| Public Administration | 11 (24.4%) | 34 (75.6%) |
| Total | 415 (51.4%) | 392 (48.6%) |
Education in Vaughn
School Enrollment in Vaughn
The most common levels of schooling among the 394 students in Vaughn are college / undergraduate (157 | 39.9%), high school (100 | 25.4%), and elementary school (63 | 16.0%).
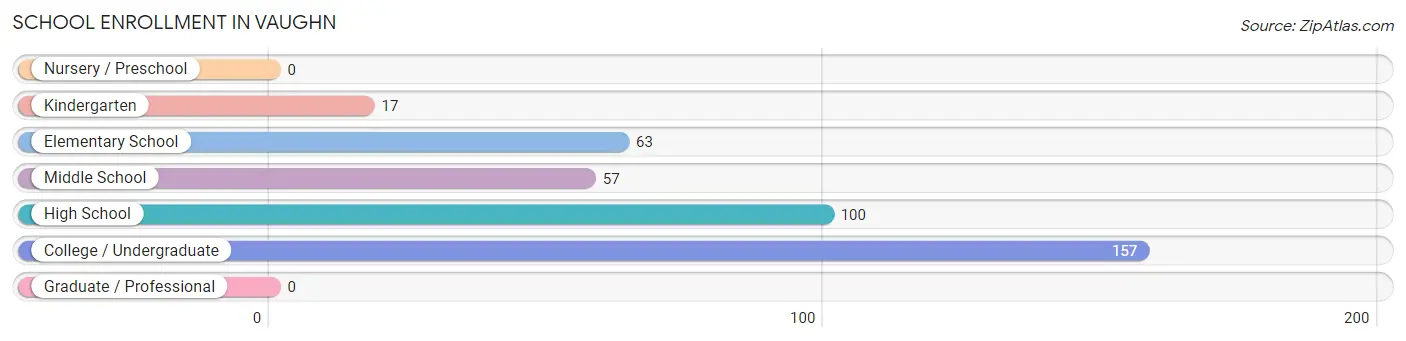
| School Level | # Students | % Students |
| Nursery / Preschool | 0 | 0.0% |
| Kindergarten | 17 | 4.3% |
| Elementary School | 63 | 16.0% |
| Middle School | 57 | 14.5% |
| High School | 100 | 25.4% |
| College / Undergraduate | 157 | 39.9% |
| Graduate / Professional | 0 | 0.0% |
| Total | 394 | 100.0% |
School Enrollment by Age by Funding Source in Vaughn
Out of a total of 394 students who are enrolled in schools in Vaughn, 17 (4.3%) attend a private institution, while the remaining 377 (95.7%) are enrolled in public schools. The age group of 5 to 9 year old has the highest likelihood of being enrolled in private schools, with 17 (21.2% in the age bracket) enrolled. Conversely, the age group of 10 to 14 year olds has the lowest likelihood of being enrolled in a private school, with 57 (100.0% in the age bracket) attending a public institution.
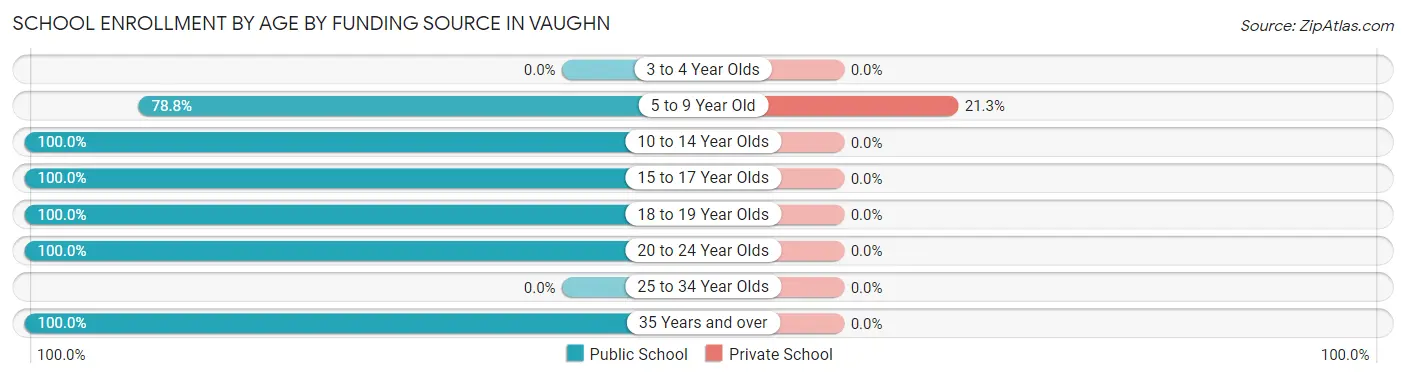
| Age Bracket | Public School | Private School |
| 3 to 4 Year Olds | 0 (0.0%) | 0 (0.0%) |
| 5 to 9 Year Old | 63 (78.7%) | 17 (21.2%) |
| 10 to 14 Year Olds | 57 (100.0%) | 0 (0.0%) |
| 15 to 17 Year Olds | 100 (100.0%) | 0 (0.0%) |
| 18 to 19 Year Olds | 14 (100.0%) | 0 (0.0%) |
| 20 to 24 Year Olds | 93 (100.0%) | 0 (0.0%) |
| 25 to 34 Year Olds | 0 (0.0%) | 0 (0.0%) |
| 35 Years and over | 50 (100.0%) | 0 (0.0%) |
| Total | 377 (95.7%) | 17 (4.3%) |
Educational Attainment by Field of Study in Vaughn
Literature & languages (63 | 37.1%), education (44 | 25.9%), psychology (28 | 16.5%), science & technology (16 | 9.4%), and business (16 | 9.4%) are the most common fields of study among 170 individuals in Vaughn who have obtained a bachelor's degree or higher.
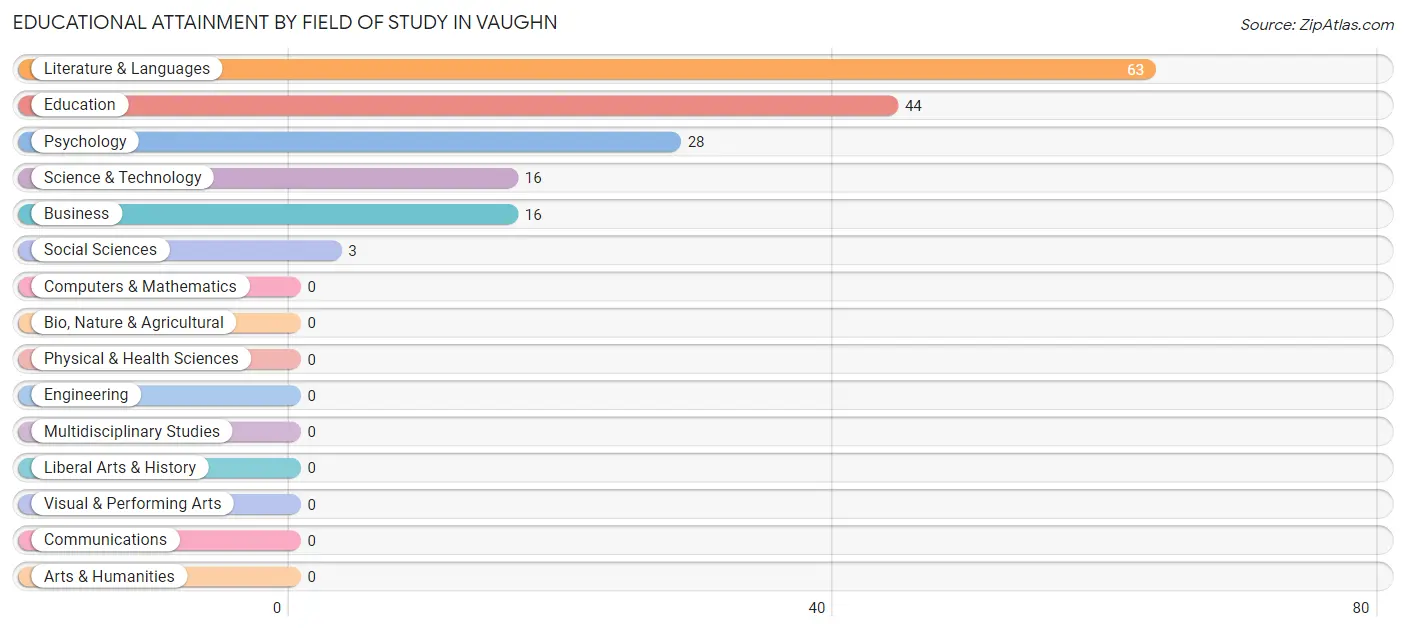
| Field of Study | # Graduates | % Graduates |
| Computers & Mathematics | 0 | 0.0% |
| Bio, Nature & Agricultural | 0 | 0.0% |
| Physical & Health Sciences | 0 | 0.0% |
| Psychology | 28 | 16.5% |
| Social Sciences | 3 | 1.8% |
| Engineering | 0 | 0.0% |
| Multidisciplinary Studies | 0 | 0.0% |
| Science & Technology | 16 | 9.4% |
| Business | 16 | 9.4% |
| Education | 44 | 25.9% |
| Literature & Languages | 63 | 37.1% |
| Liberal Arts & History | 0 | 0.0% |
| Visual & Performing Arts | 0 | 0.0% |
| Communications | 0 | 0.0% |
| Arts & Humanities | 0 | 0.0% |
| Total | 170 | 100.0% |
Transportation & Commute in Vaughn
Vehicle Availability by Sex in Vaughn
The most prevalent vehicle ownership categories in Vaughn are males with 3 vehicles (305, accounting for 73.5%) and females with 3 vehicles (153, making up 78.4%).
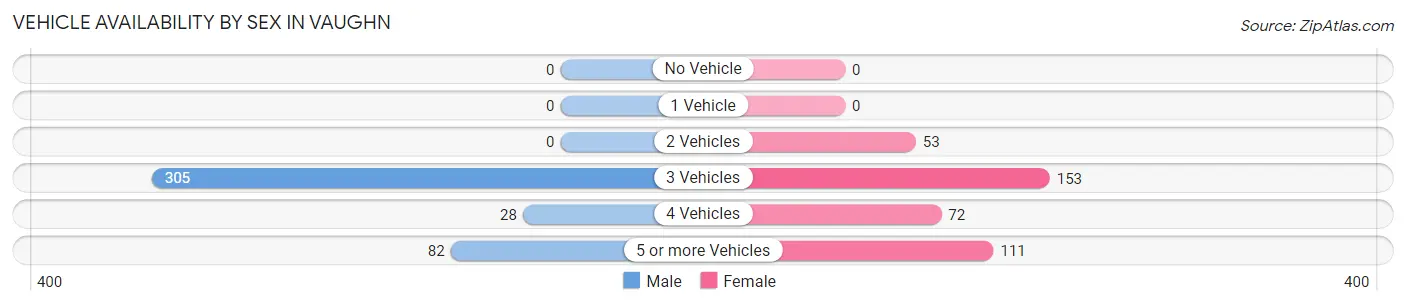
| Vehicles Available | Male | Female |
| No Vehicle | 0 (0.0%) | 0 (0.0%) |
| 1 Vehicle | 0 (0.0%) | 0 (0.0%) |
| 2 Vehicles | 0 (0.0%) | 53 (13.6%) |
| 3 Vehicles | 305 (73.5%) | 153 (39.3%) |
| 4 Vehicles | 28 (6.8%) | 72 (18.5%) |
| 5 or more Vehicles | 82 (19.8%) | 111 (28.5%) |
| Total | 415 (100.0%) | 389 (100.0%) |
Commute Time in Vaughn
The most frequently occuring commute durations in Vaughn are 20 to 24 minutes (137 commuters, 20.7%), 30 to 34 minutes (127 commuters, 19.2%), and 45 to 59 minutes (104 commuters, 15.7%).
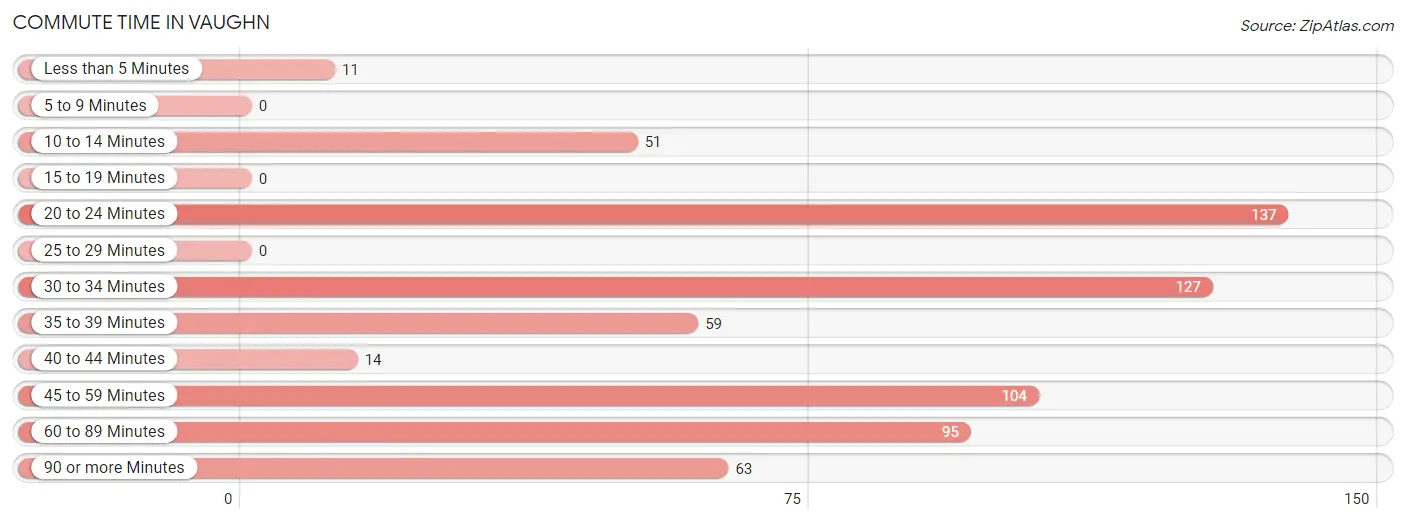
| Commute Time | # Commuters | % Commuters |
| Less than 5 Minutes | 11 | 1.7% |
| 5 to 9 Minutes | 0 | 0.0% |
| 10 to 14 Minutes | 51 | 7.7% |
| 15 to 19 Minutes | 0 | 0.0% |
| 20 to 24 Minutes | 137 | 20.7% |
| 25 to 29 Minutes | 0 | 0.0% |
| 30 to 34 Minutes | 127 | 19.2% |
| 35 to 39 Minutes | 59 | 8.9% |
| 40 to 44 Minutes | 14 | 2.1% |
| 45 to 59 Minutes | 104 | 15.7% |
| 60 to 89 Minutes | 95 | 14.4% |
| 90 or more Minutes | 63 | 9.5% |
Commute Time by Sex in Vaughn
The most common commute times in Vaughn are 20 to 24 minutes (120 commuters, 30.8%) for males and 30 to 34 minutes (116 commuters, 42.6%) for females.
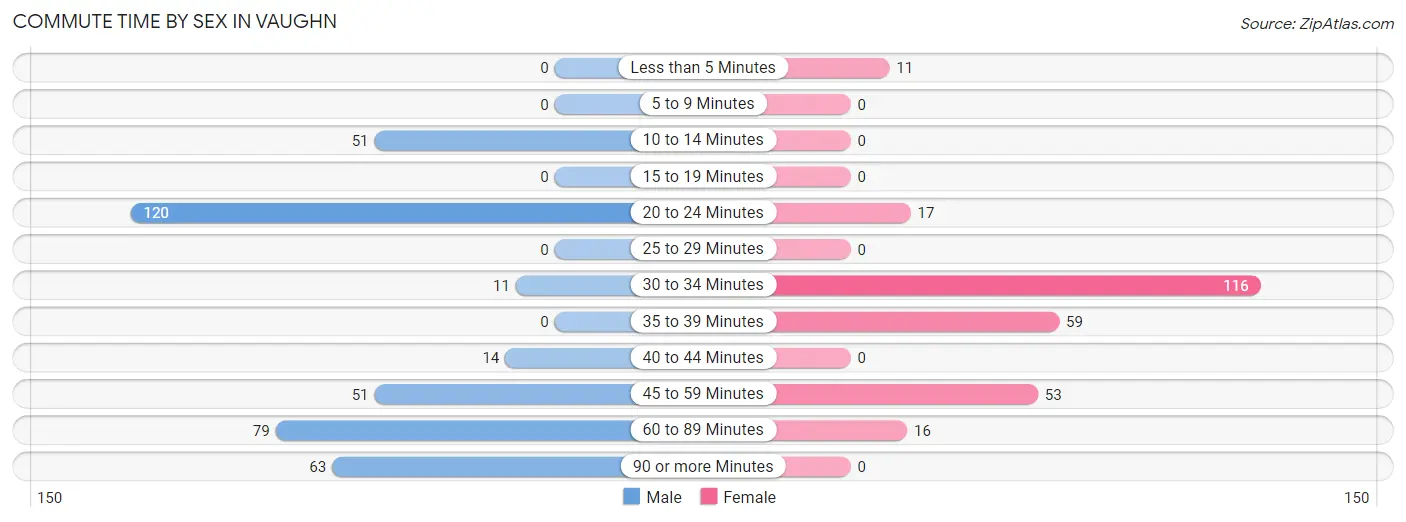
| Commute Time | Male | Female |
| Less than 5 Minutes | 0 (0.0%) | 11 (4.0%) |
| 5 to 9 Minutes | 0 (0.0%) | 0 (0.0%) |
| 10 to 14 Minutes | 51 (13.1%) | 0 (0.0%) |
| 15 to 19 Minutes | 0 (0.0%) | 0 (0.0%) |
| 20 to 24 Minutes | 120 (30.8%) | 17 (6.2%) |
| 25 to 29 Minutes | 0 (0.0%) | 0 (0.0%) |
| 30 to 34 Minutes | 11 (2.8%) | 116 (42.6%) |
| 35 to 39 Minutes | 0 (0.0%) | 59 (21.7%) |
| 40 to 44 Minutes | 14 (3.6%) | 0 (0.0%) |
| 45 to 59 Minutes | 51 (13.1%) | 53 (19.5%) |
| 60 to 89 Minutes | 79 (20.3%) | 16 (5.9%) |
| 90 or more Minutes | 63 (16.2%) | 0 (0.0%) |
Time of Departure to Work by Sex in Vaughn
The most frequent times of departure to work in Vaughn are 12:00 PM to 3:59 PM (183, 47.0%) for males and 7:00 AM to 7:29 AM (59, 21.7%) for females.
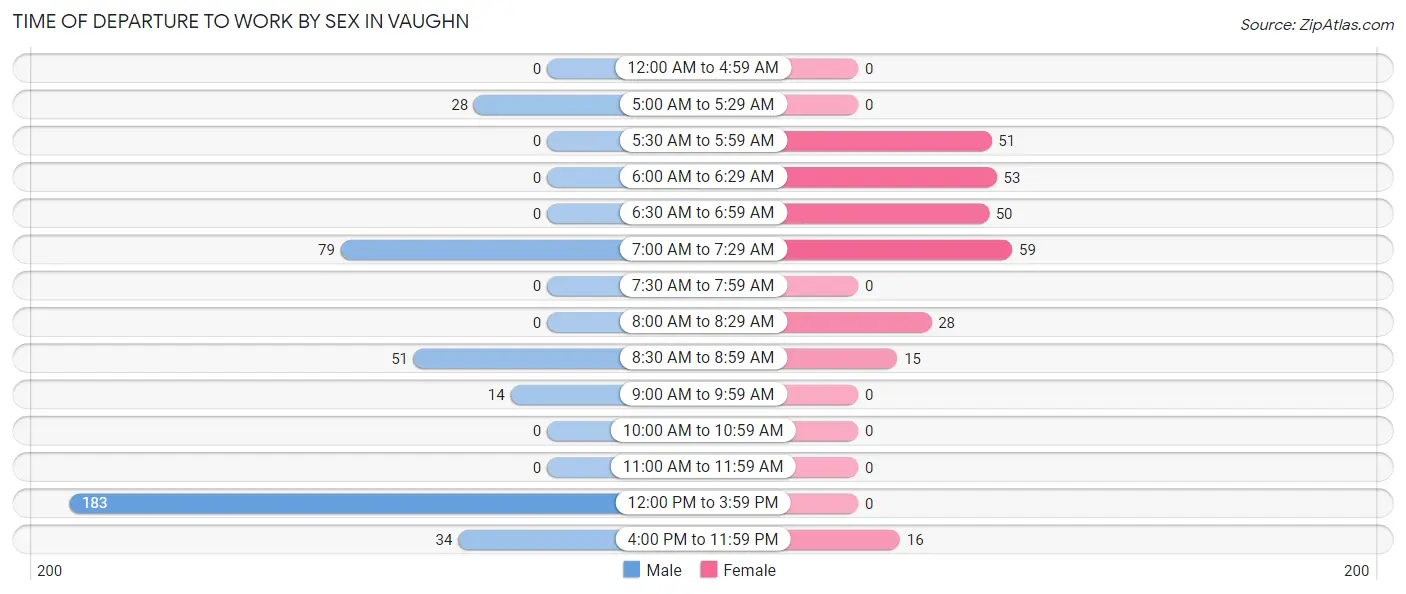
| Time of Departure | Male | Female |
| 12:00 AM to 4:59 AM | 0 (0.0%) | 0 (0.0%) |
| 5:00 AM to 5:29 AM | 28 (7.2%) | 0 (0.0%) |
| 5:30 AM to 5:59 AM | 0 (0.0%) | 51 (18.8%) |
| 6:00 AM to 6:29 AM | 0 (0.0%) | 53 (19.5%) |
| 6:30 AM to 6:59 AM | 0 (0.0%) | 50 (18.4%) |
| 7:00 AM to 7:29 AM | 79 (20.3%) | 59 (21.7%) |
| 7:30 AM to 7:59 AM | 0 (0.0%) | 0 (0.0%) |
| 8:00 AM to 8:29 AM | 0 (0.0%) | 28 (10.3%) |
| 8:30 AM to 8:59 AM | 51 (13.1%) | 15 (5.5%) |
| 9:00 AM to 9:59 AM | 14 (3.6%) | 0 (0.0%) |
| 10:00 AM to 10:59 AM | 0 (0.0%) | 0 (0.0%) |
| 11:00 AM to 11:59 AM | 0 (0.0%) | 0 (0.0%) |
| 12:00 PM to 3:59 PM | 183 (47.0%) | 0 (0.0%) |
| 4:00 PM to 11:59 PM | 34 (8.7%) | 16 (5.9%) |
| Total | 389 (100.0%) | 272 (100.0%) |
Housing Occupancy in Vaughn
Occupancy by Ownership in Vaughn
Of the total 486 dwellings in Vaughn, owner-occupied units account for 468 (96.3%), while renter-occupied units make up 18 (3.7%).
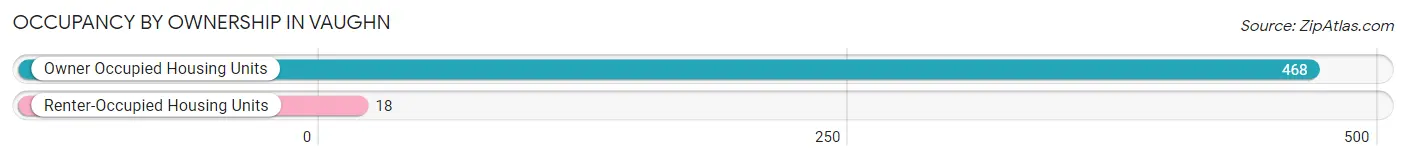
| Occupancy | # Housing Units | % Housing Units |
| Owner Occupied Housing Units | 468 | 96.3% |
| Renter-Occupied Housing Units | 18 | 3.7% |
| Total Occupied Housing Units | 486 | 100.0% |
Occupancy by Household Size in Vaughn
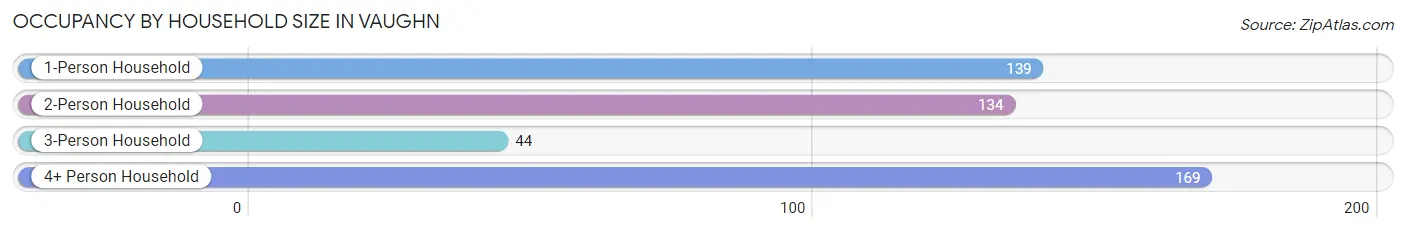
| Household Size | # Housing Units | % Housing Units |
| 1-Person Household | 139 | 28.6% |
| 2-Person Household | 134 | 27.6% |
| 3-Person Household | 44 | 9.0% |
| 4+ Person Household | 169 | 34.8% |
| Total Housing Units | 486 | 100.0% |
Occupancy by Ownership by Household Size in Vaughn
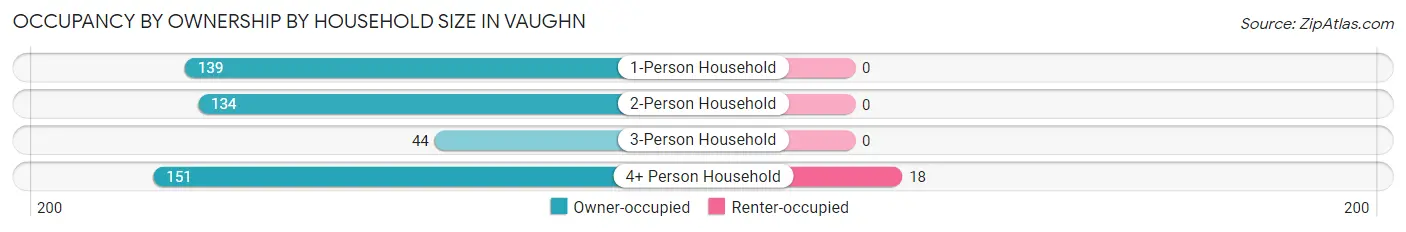
| Household Size | Owner-occupied | Renter-occupied |
| 1-Person Household | 139 (100.0%) | 0 (0.0%) |
| 2-Person Household | 134 (100.0%) | 0 (0.0%) |
| 3-Person Household | 44 (100.0%) | 0 (0.0%) |
| 4+ Person Household | 151 (89.3%) | 18 (10.6%) |
| Total Housing Units | 468 (96.3%) | 18 (3.7%) |
Occupancy by Educational Attainment in Vaughn
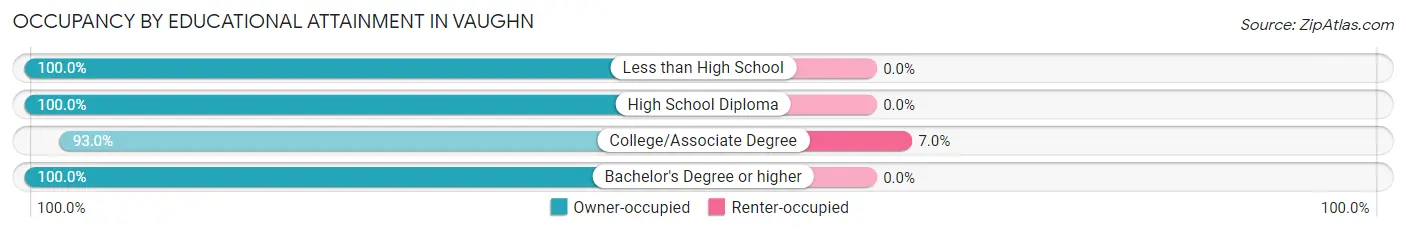
| Household Size | Owner-occupied | Renter-occupied |
| Less than High School | 20 (100.0%) | 0 (0.0%) |
| High School Diploma | 42 (100.0%) | 0 (0.0%) |
| College/Associate Degree | 239 (93.0%) | 18 (7.0%) |
| Bachelor's Degree or higher | 167 (100.0%) | 0 (0.0%) |
Occupancy by Age of Householder in Vaughn
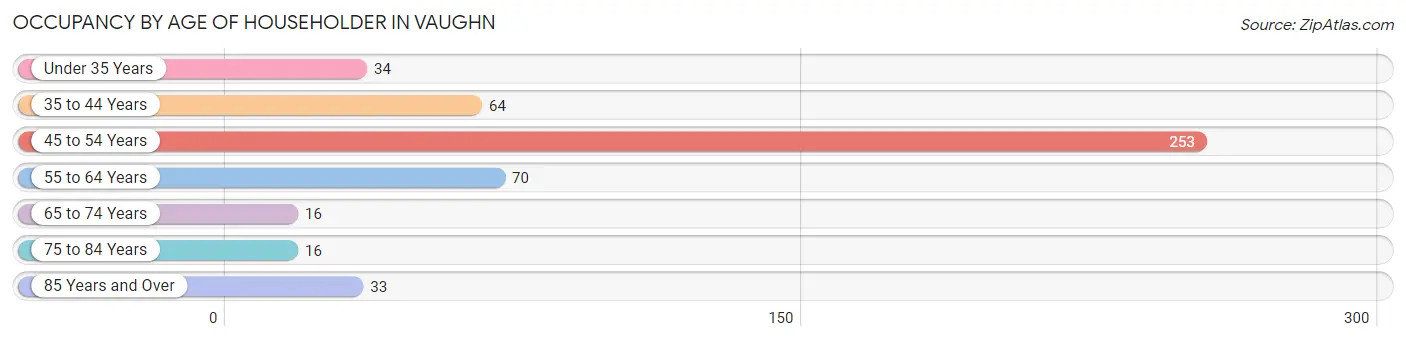
| Age Bracket | # Households | % Households |
| Under 35 Years | 34 | 7.0% |
| 35 to 44 Years | 64 | 13.2% |
| 45 to 54 Years | 253 | 52.1% |
| 55 to 64 Years | 70 | 14.4% |
| 65 to 74 Years | 16 | 3.3% |
| 75 to 84 Years | 16 | 3.3% |
| 85 Years and Over | 33 | 6.8% |
| Total | 486 | 100.0% |
Housing Finances in Vaughn
Median Income by Occupancy in Vaughn
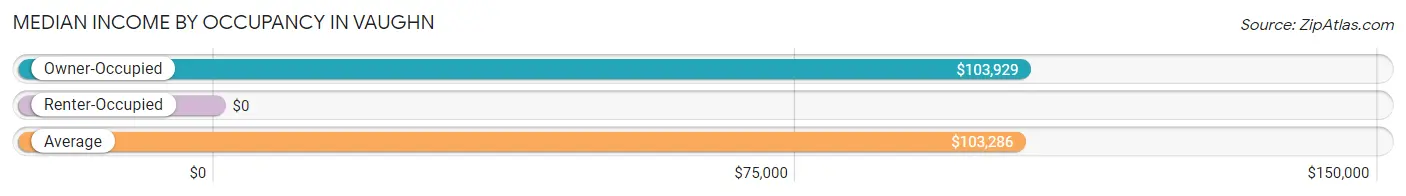
| Occupancy Type | # Households | Median Income |
| Owner-Occupied | 468 (96.3%) | $103,929 |
| Renter-Occupied | 18 (3.7%) | $0 |
| Average | 486 (100.0%) | $103,286 |
Occupancy by Householder Income Bracket in Vaughn
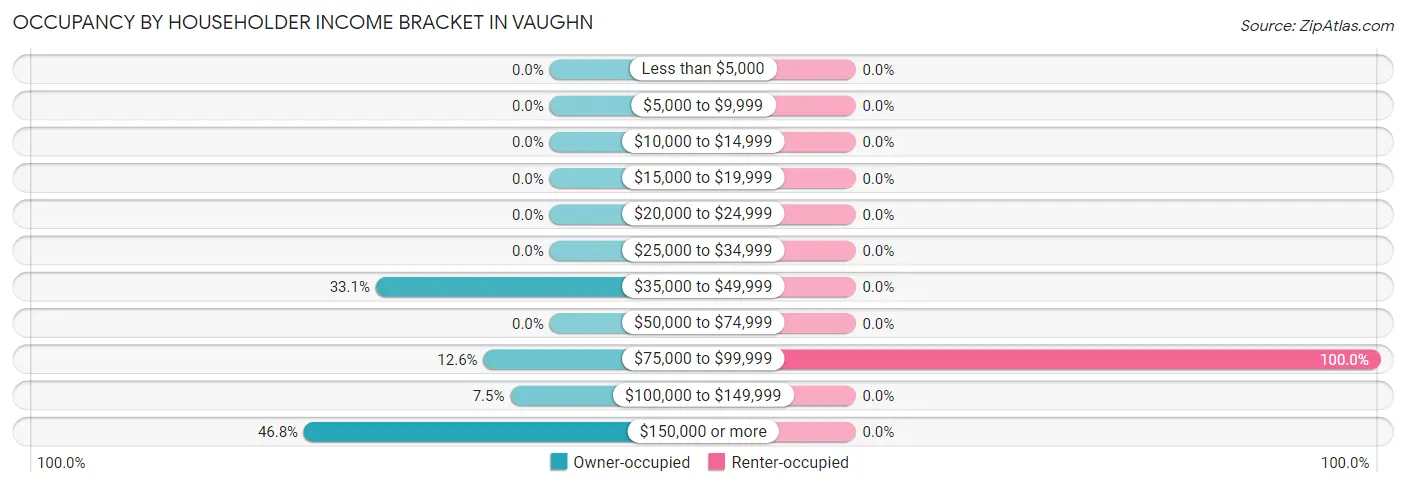
| Income Bracket | Owner-occupied | Renter-occupied |
| Less than $5,000 | 0 (0.0%) | 0 (0.0%) |
| $5,000 to $9,999 | 0 (0.0%) | 0 (0.0%) |
| $10,000 to $14,999 | 0 (0.0%) | 0 (0.0%) |
| $15,000 to $19,999 | 0 (0.0%) | 0 (0.0%) |
| $20,000 to $24,999 | 0 (0.0%) | 0 (0.0%) |
| $25,000 to $34,999 | 0 (0.0%) | 0 (0.0%) |
| $35,000 to $49,999 | 155 (33.1%) | 0 (0.0%) |
| $50,000 to $74,999 | 0 (0.0%) | 0 (0.0%) |
| $75,000 to $99,999 | 59 (12.6%) | 18 (100.0%) |
| $100,000 to $149,999 | 35 (7.5%) | 0 (0.0%) |
| $150,000 or more | 219 (46.8%) | 0 (0.0%) |
| Total | 468 (100.0%) | 18 (100.0%) |
Monthly Housing Cost Tiers in Vaughn
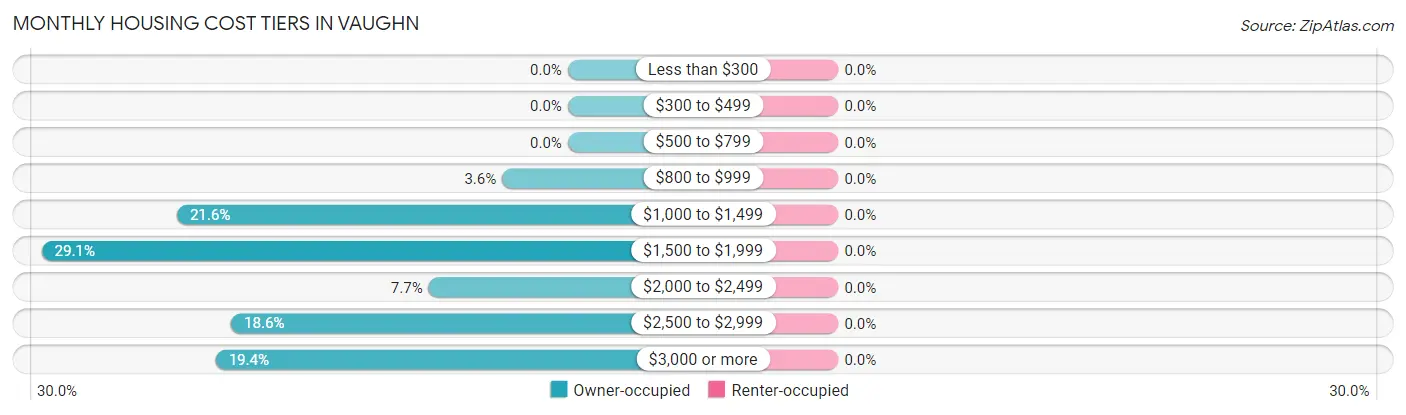
| Monthly Cost | Owner-occupied | Renter-occupied |
| Less than $300 | 0 (0.0%) | 0 (0.0%) |
| $300 to $499 | 0 (0.0%) | 0 (0.0%) |
| $500 to $799 | 0 (0.0%) | 0 (0.0%) |
| $800 to $999 | 17 (3.6%) | 0 (0.0%) |
| $1,000 to $1,499 | 101 (21.6%) | 0 (0.0%) |
| $1,500 to $1,999 | 136 (29.1%) | 0 (0.0%) |
| $2,000 to $2,499 | 36 (7.7%) | 0 (0.0%) |
| $2,500 to $2,999 | 87 (18.6%) | 0 (0.0%) |
| $3,000 or more | 91 (19.4%) | 0 (0.0%) |
| Total | 468 (100.0%) | 18 (100.0%) |
Physical Housing Characteristics in Vaughn
Housing Structures in Vaughn
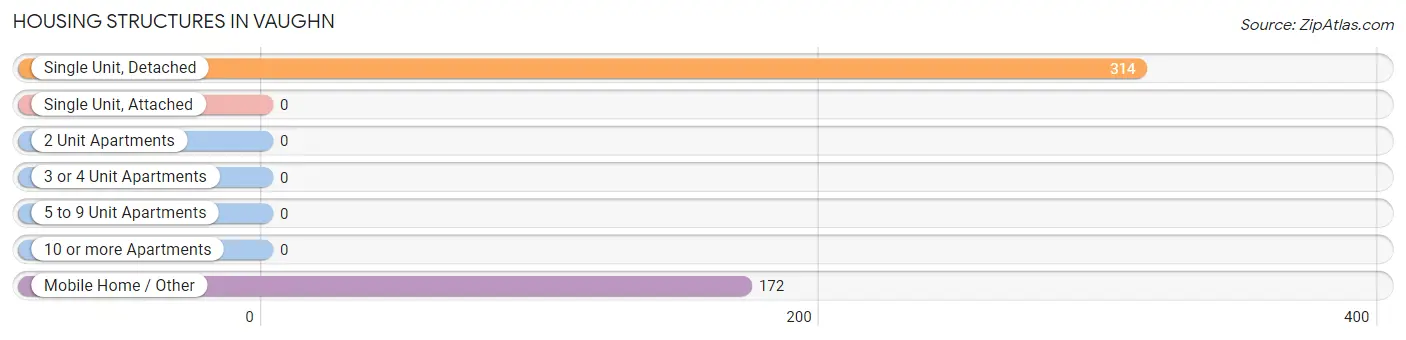
| Structure Type | # Housing Units | % Housing Units |
| Single Unit, Detached | 314 | 64.6% |
| Single Unit, Attached | 0 | 0.0% |
| 2 Unit Apartments | 0 | 0.0% |
| 3 or 4 Unit Apartments | 0 | 0.0% |
| 5 to 9 Unit Apartments | 0 | 0.0% |
| 10 or more Apartments | 0 | 0.0% |
| Mobile Home / Other | 172 | 35.4% |
| Total | 486 | 100.0% |
Housing Structures by Occupancy in Vaughn
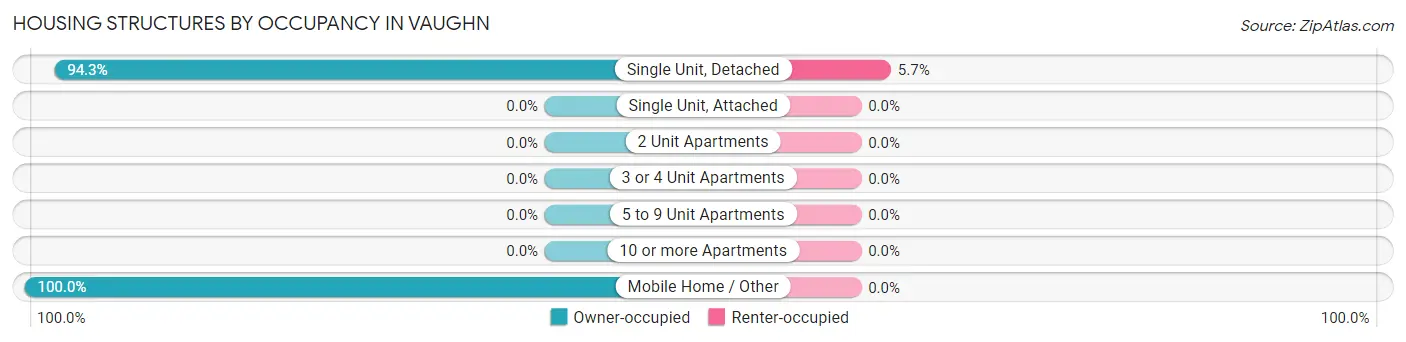
| Structure Type | Owner-occupied | Renter-occupied |
| Single Unit, Detached | 296 (94.3%) | 18 (5.7%) |
| Single Unit, Attached | 0 (0.0%) | 0 (0.0%) |
| 2 Unit Apartments | 0 (0.0%) | 0 (0.0%) |
| 3 or 4 Unit Apartments | 0 (0.0%) | 0 (0.0%) |
| 5 to 9 Unit Apartments | 0 (0.0%) | 0 (0.0%) |
| 10 or more Apartments | 0 (0.0%) | 0 (0.0%) |
| Mobile Home / Other | 172 (100.0%) | 0 (0.0%) |
| Total | 468 (96.3%) | 18 (3.7%) |
Housing Structures by Number of Rooms in Vaughn
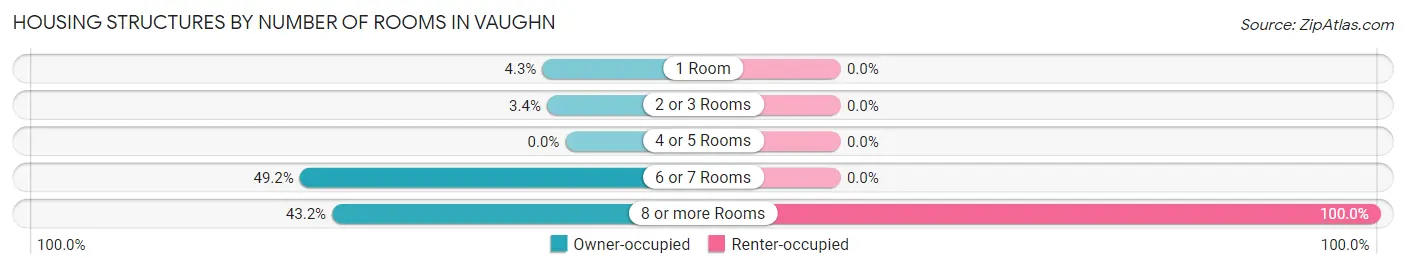
| Number of Rooms | Owner-occupied | Renter-occupied |
| 1 Room | 20 (4.3%) | 0 (0.0%) |
| 2 or 3 Rooms | 16 (3.4%) | 0 (0.0%) |
| 4 or 5 Rooms | 0 (0.0%) | 0 (0.0%) |
| 6 or 7 Rooms | 230 (49.1%) | 0 (0.0%) |
| 8 or more Rooms | 202 (43.2%) | 18 (100.0%) |
| Total | 468 (100.0%) | 18 (100.0%) |
Housing Structure by Heating Type in Vaughn
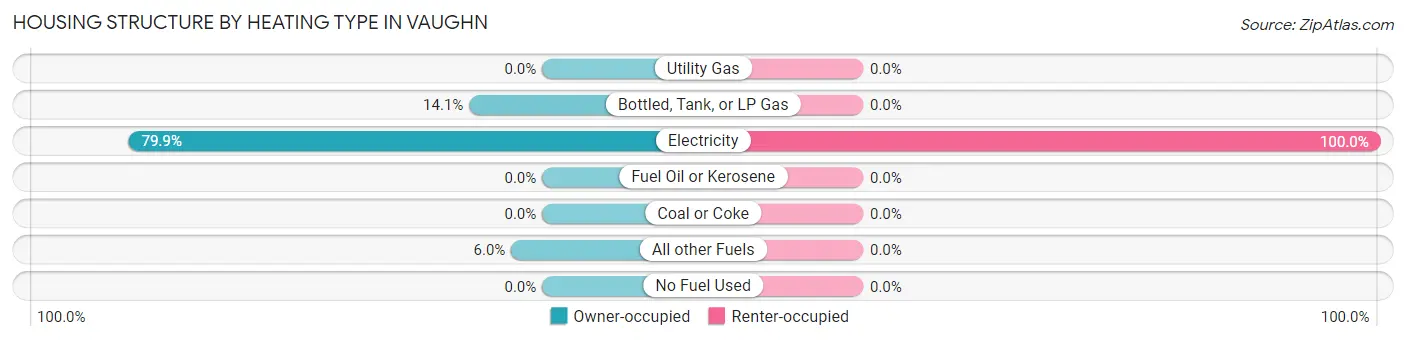
| Heating Type | Owner-occupied | Renter-occupied |
| Utility Gas | 0 (0.0%) | 0 (0.0%) |
| Bottled, Tank, or LP Gas | 66 (14.1%) | 0 (0.0%) |
| Electricity | 374 (79.9%) | 18 (100.0%) |
| Fuel Oil or Kerosene | 0 (0.0%) | 0 (0.0%) |
| Coal or Coke | 0 (0.0%) | 0 (0.0%) |
| All other Fuels | 28 (6.0%) | 0 (0.0%) |
| No Fuel Used | 0 (0.0%) | 0 (0.0%) |
| Total | 468 (100.0%) | 18 (100.0%) |
Household Vehicle Usage in Vaughn
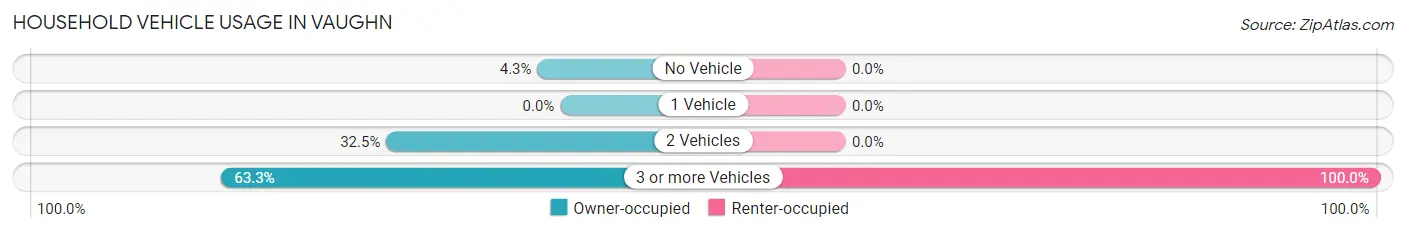
| Vehicles per Household | Owner-occupied | Renter-occupied |
| No Vehicle | 20 (4.3%) | 0 (0.0%) |
| 1 Vehicle | 0 (0.0%) | 0 (0.0%) |
| 2 Vehicles | 152 (32.5%) | 0 (0.0%) |
| 3 or more Vehicles | 296 (63.2%) | 18 (100.0%) |
| Total | 468 (100.0%) | 18 (100.0%) |
Real Estate & Mortgages in Vaughn
Real Estate and Mortgage Overview in Vaughn
| Characteristic | Without Mortgage | With Mortgage |
| Housing Units | 17 | 451 |
| Median Property Value | - | - |
| Median Household Income | - | - |
| Monthly Housing Costs | - | - |
| Real Estate Taxes | - | - |
Property Value by Mortgage Status in Vaughn
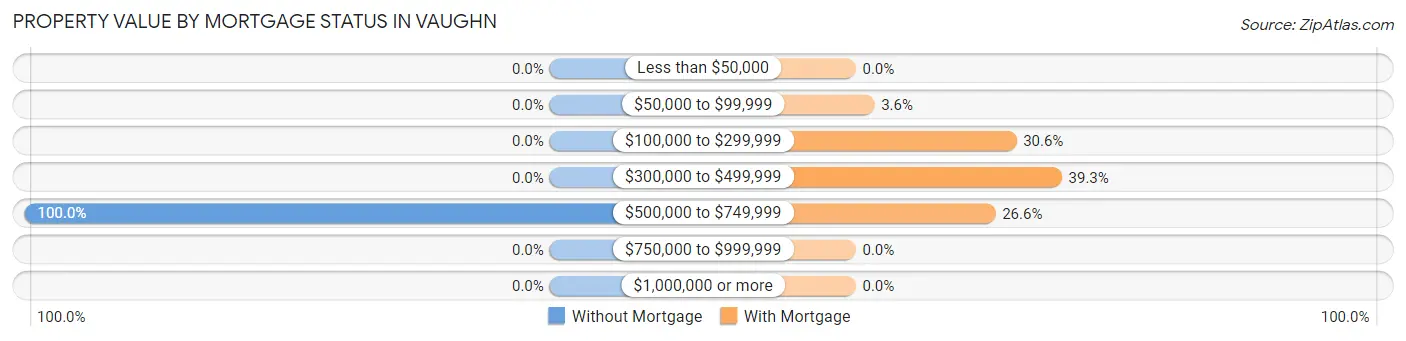
| Property Value | Without Mortgage | With Mortgage |
| Less than $50,000 | 0 (0.0%) | 0 (0.0%) |
| $50,000 to $99,999 | 0 (0.0%) | 16 (3.5%) |
| $100,000 to $299,999 | 0 (0.0%) | 138 (30.6%) |
| $300,000 to $499,999 | 0 (0.0%) | 177 (39.3%) |
| $500,000 to $749,999 | 17 (100.0%) | 120 (26.6%) |
| $750,000 to $999,999 | 0 (0.0%) | 0 (0.0%) |
| $1,000,000 or more | 0 (0.0%) | 0 (0.0%) |
| Total | 17 (100.0%) | 451 (100.0%) |
Household Income by Mortgage Status in Vaughn
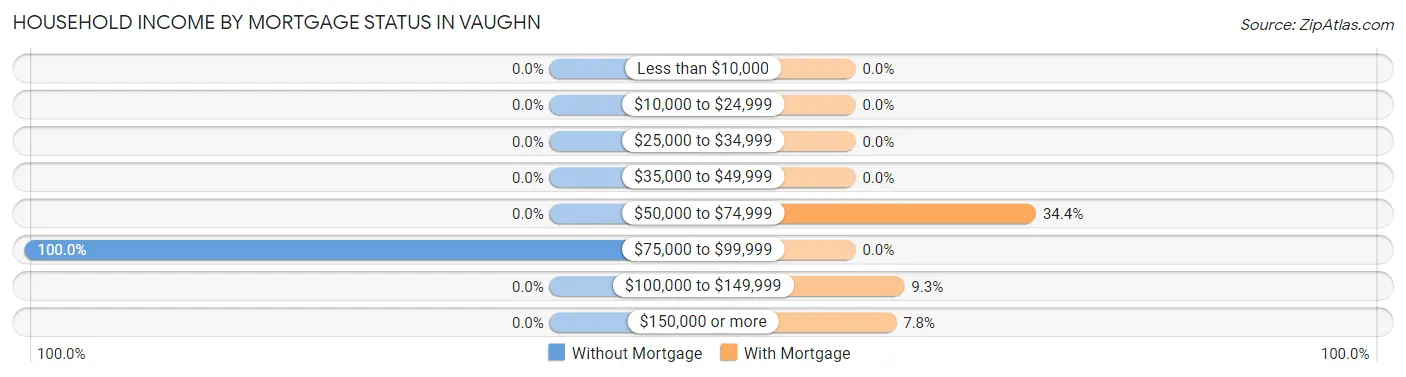
| Household Income | Without Mortgage | With Mortgage |
| Less than $10,000 | 0 (0.0%) | 0 (0.0%) |
| $10,000 to $24,999 | 0 (0.0%) | 0 (0.0%) |
| $25,000 to $34,999 | 0 (0.0%) | 0 (0.0%) |
| $35,000 to $49,999 | 0 (0.0%) | 0 (0.0%) |
| $50,000 to $74,999 | 0 (0.0%) | 155 (34.4%) |
| $75,000 to $99,999 | 17 (100.0%) | 0 (0.0%) |
| $100,000 to $149,999 | 0 (0.0%) | 42 (9.3%) |
| $150,000 or more | 0 (0.0%) | 35 (7.8%) |
| Total | 17 (100.0%) | 451 (100.0%) |
Property Value to Household Income Ratio in Vaughn
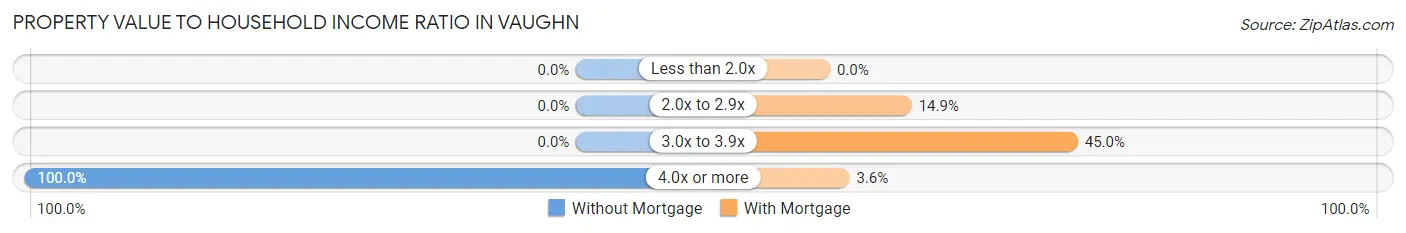
| Value-to-Income Ratio | Without Mortgage | With Mortgage |
| Less than 2.0x | 0 (0.0%) | 0 (0.0%) |
| 2.0x to 2.9x | 0 (0.0%) | 67 (14.9%) |
| 3.0x to 3.9x | 0 (0.0%) | 203 (45.0%) |
| 4.0x or more | 17 (100.0%) | 16 (3.5%) |
| Total | 17 (100.0%) | 451 (100.0%) |
Real Estate Taxes by Mortgage Status in Vaughn
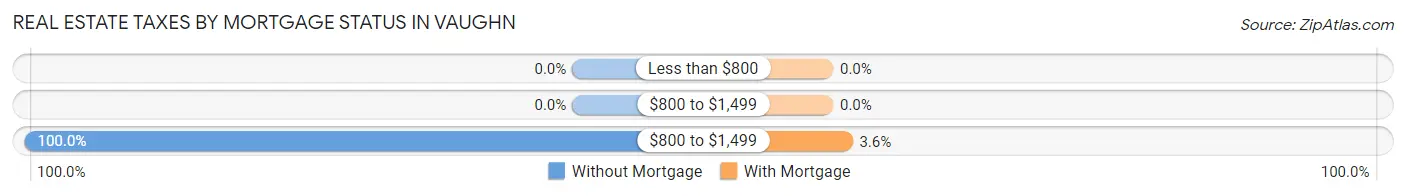
| Property Taxes | Without Mortgage | With Mortgage |
| Less than $800 | 0 (0.0%) | 0 (0.0%) |
| $800 to $1,499 | 0 (0.0%) | 0 (0.0%) |
| $800 to $1,499 | 17 (100.0%) | 16 (3.5%) |
| Total | 17 (100.0%) | 451 (100.0%) |
Health & Disability in Vaughn
Health Insurance Coverage by Age in Vaughn
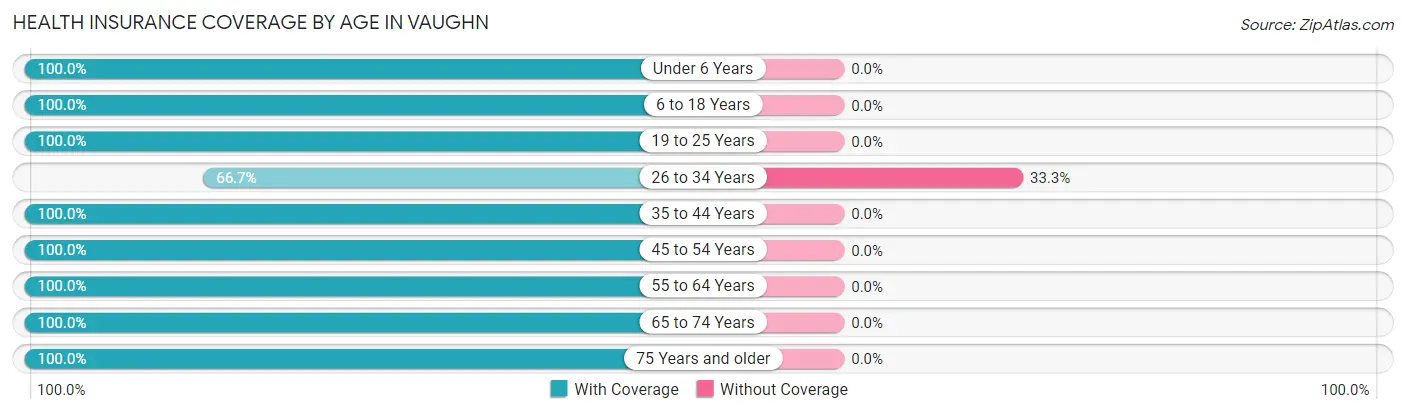
| Age Bracket | With Coverage | Without Coverage |
| Under 6 Years | 35 (100.0%) | 0 (0.0%) |
| 6 to 18 Years | 275 (100.0%) | 0 (0.0%) |
| 19 to 25 Years | 142 (100.0%) | 0 (0.0%) |
| 26 to 34 Years | 36 (66.7%) | 18 (33.3%) |
| 35 to 44 Years | 92 (100.0%) | 0 (0.0%) |
| 45 to 54 Years | 364 (100.0%) | 0 (0.0%) |
| 55 to 64 Years | 150 (100.0%) | 0 (0.0%) |
| 65 to 74 Years | 82 (100.0%) | 0 (0.0%) |
| 75 Years and older | 91 (100.0%) | 0 (0.0%) |
| Total | 1,267 (98.6%) | 18 (1.4%) |
Health Insurance Coverage by Citizenship Status in Vaughn
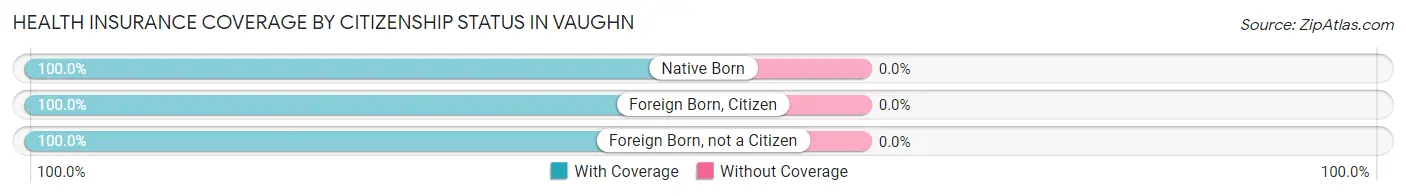
| Citizenship Status | With Coverage | Without Coverage |
| Native Born | 35 (100.0%) | 0 (0.0%) |
| Foreign Born, Citizen | 275 (100.0%) | 0 (0.0%) |
| Foreign Born, not a Citizen | 142 (100.0%) | 0 (0.0%) |
Health Insurance Coverage by Household Income in Vaughn
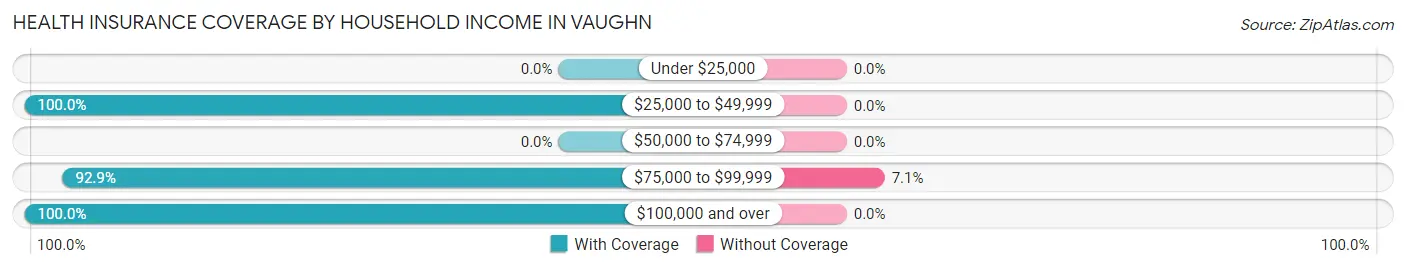
| Household Income | With Coverage | Without Coverage |
| Under $25,000 | 0 (0.0%) | 0 (0.0%) |
| $25,000 to $49,999 | 180 (100.0%) | 0 (0.0%) |
| $50,000 to $74,999 | 0 (0.0%) | 0 (0.0%) |
| $75,000 to $99,999 | 235 (92.9%) | 18 (7.1%) |
| $100,000 and over | 846 (100.0%) | 0 (0.0%) |
Public vs Private Health Insurance Coverage by Age in Vaughn
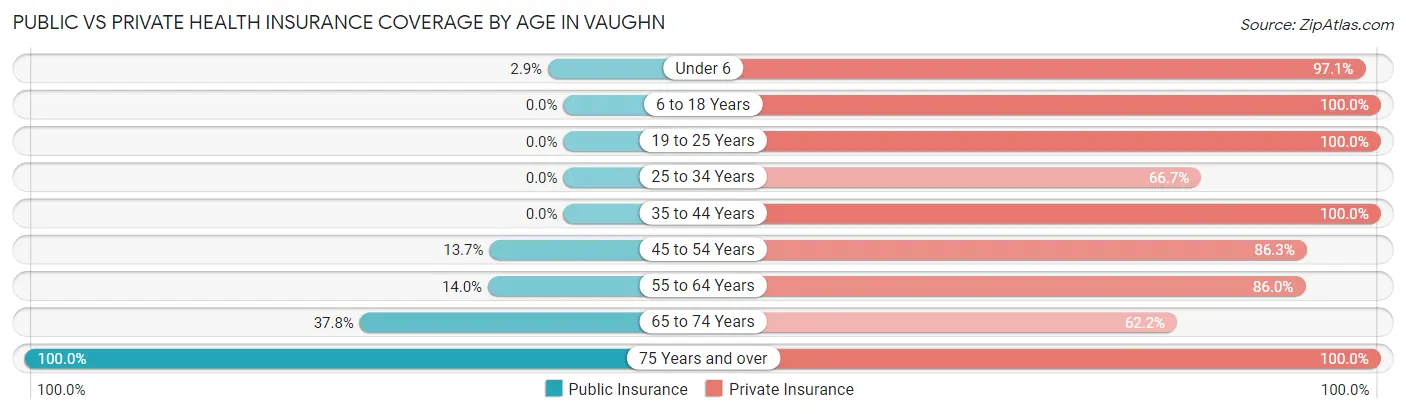
| Age Bracket | Public Insurance | Private Insurance |
| Under 6 | 1 (2.9%) | 34 (97.1%) |
| 6 to 18 Years | 0 (0.0%) | 275 (100.0%) |
| 19 to 25 Years | 0 (0.0%) | 142 (100.0%) |
| 25 to 34 Years | 0 (0.0%) | 36 (66.7%) |
| 35 to 44 Years | 0 (0.0%) | 92 (100.0%) |
| 45 to 54 Years | 50 (13.7%) | 314 (86.3%) |
| 55 to 64 Years | 21 (14.0%) | 129 (86.0%) |
| 65 to 74 Years | 31 (37.8%) | 51 (62.2%) |
| 75 Years and over | 91 (100.0%) | 91 (100.0%) |
| Total | 194 (15.1%) | 1,164 (90.6%) |
Disability Status by Sex by Age in Vaughn
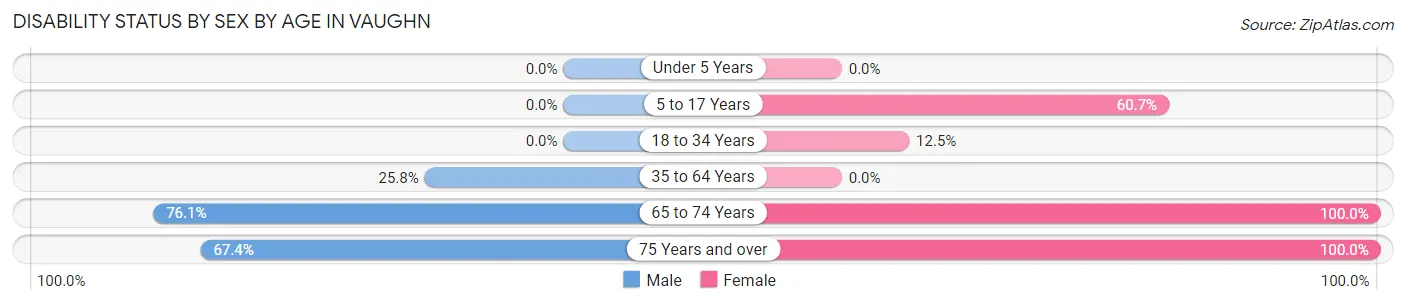
| Age Bracket | Male | Female |
| Under 5 Years | 0 (0.0%) | 0 (0.0%) |
| 5 to 17 Years | 0 (0.0%) | 17 (60.7%) |
| 18 to 34 Years | 0 (0.0%) | 18 (12.5%) |
| 35 to 64 Years | 76 (25.8%) | 0 (0.0%) |
| 65 to 74 Years | 51 (76.1%) | 15 (100.0%) |
| 75 Years and over | 33 (67.3%) | 42 (100.0%) |
Disability Class by Sex by Age in Vaughn
Disability Class: Hearing Difficulty
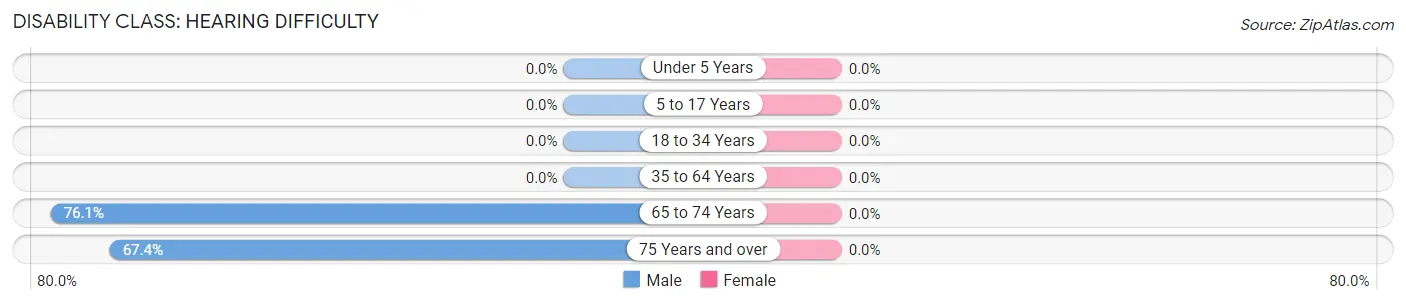
| Age Bracket | Male | Female |
| Under 5 Years | 0 (0.0%) | 0 (0.0%) |
| 5 to 17 Years | 0 (0.0%) | 0 (0.0%) |
| 18 to 34 Years | 0 (0.0%) | 0 (0.0%) |
| 35 to 64 Years | 0 (0.0%) | 0 (0.0%) |
| 65 to 74 Years | 51 (76.1%) | 0 (0.0%) |
| 75 Years and over | 33 (67.3%) | 0 (0.0%) |
Disability Class: Vision Difficulty
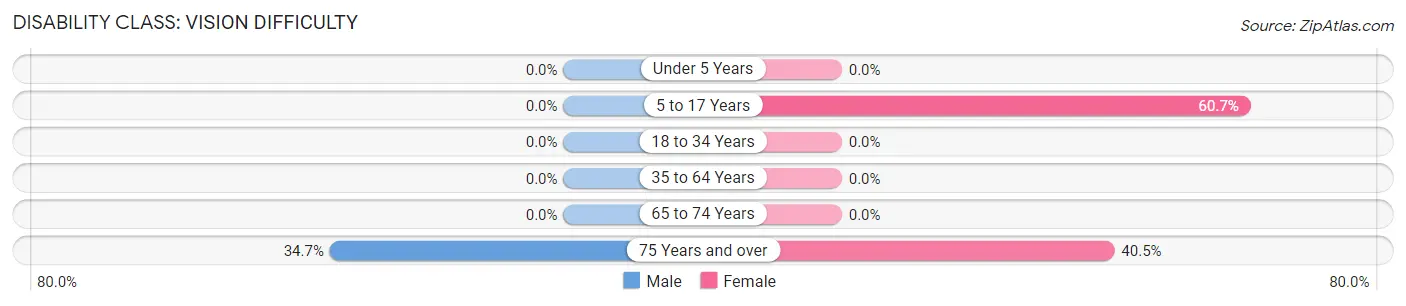
| Age Bracket | Male | Female |
| Under 5 Years | 0 (0.0%) | 0 (0.0%) |
| 5 to 17 Years | 0 (0.0%) | 17 (60.7%) |
| 18 to 34 Years | 0 (0.0%) | 0 (0.0%) |
| 35 to 64 Years | 0 (0.0%) | 0 (0.0%) |
| 65 to 74 Years | 0 (0.0%) | 0 (0.0%) |
| 75 Years and over | 17 (34.7%) | 17 (40.5%) |
Disability Class: Cognitive Difficulty
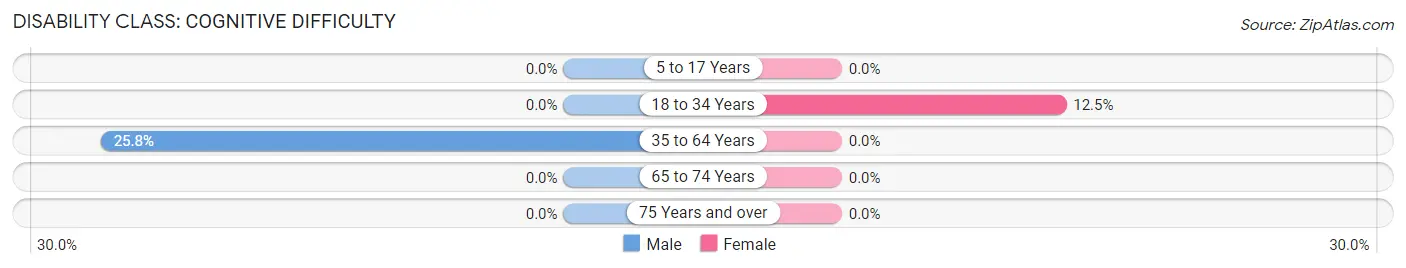
| Age Bracket | Male | Female |
| 5 to 17 Years | 0 (0.0%) | 0 (0.0%) |
| 18 to 34 Years | 0 (0.0%) | 18 (12.5%) |
| 35 to 64 Years | 76 (25.8%) | 0 (0.0%) |
| 65 to 74 Years | 0 (0.0%) | 0 (0.0%) |
| 75 Years and over | 0 (0.0%) | 0 (0.0%) |
Disability Class: Ambulatory Difficulty
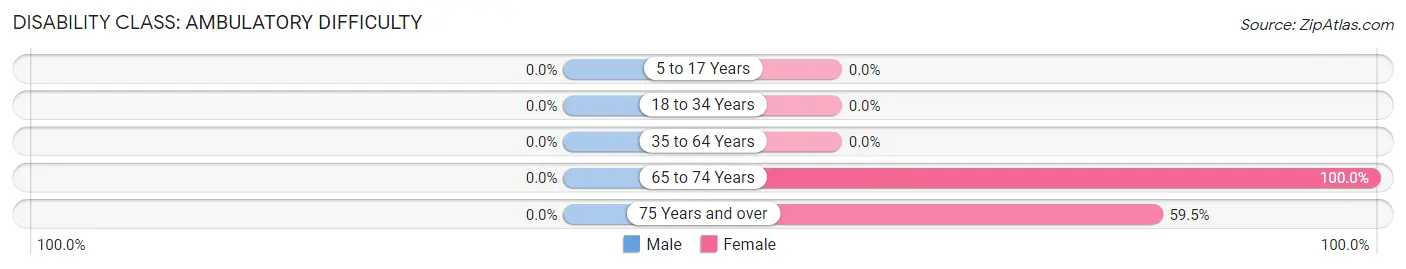
| Age Bracket | Male | Female |
| 5 to 17 Years | 0 (0.0%) | 0 (0.0%) |
| 18 to 34 Years | 0 (0.0%) | 0 (0.0%) |
| 35 to 64 Years | 0 (0.0%) | 0 (0.0%) |
| 65 to 74 Years | 0 (0.0%) | 15 (100.0%) |
| 75 Years and over | 0 (0.0%) | 25 (59.5%) |
Disability Class: Self-Care Difficulty
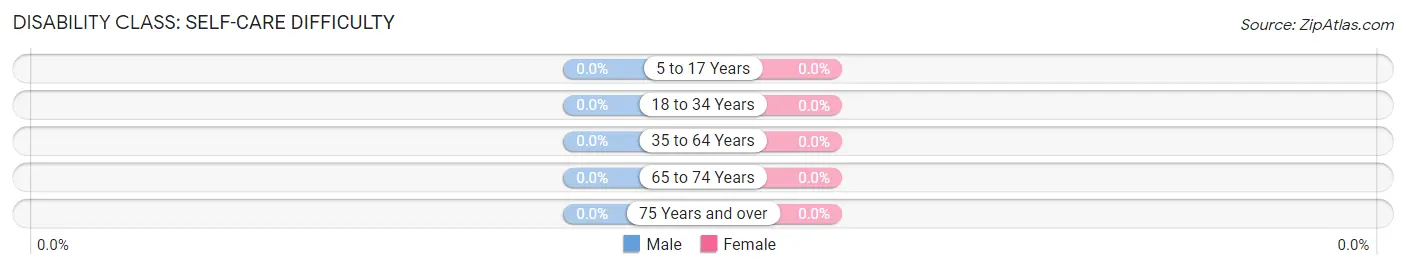
| Age Bracket | Male | Female |
| 5 to 17 Years | 0 (0.0%) | 0 (0.0%) |
| 18 to 34 Years | 0 (0.0%) | 0 (0.0%) |
| 35 to 64 Years | 0 (0.0%) | 0 (0.0%) |
| 65 to 74 Years | 0 (0.0%) | 0 (0.0%) |
| 75 Years and over | 0 (0.0%) | 0 (0.0%) |
Technology Access in Vaughn
Computing Device Access in Vaughn
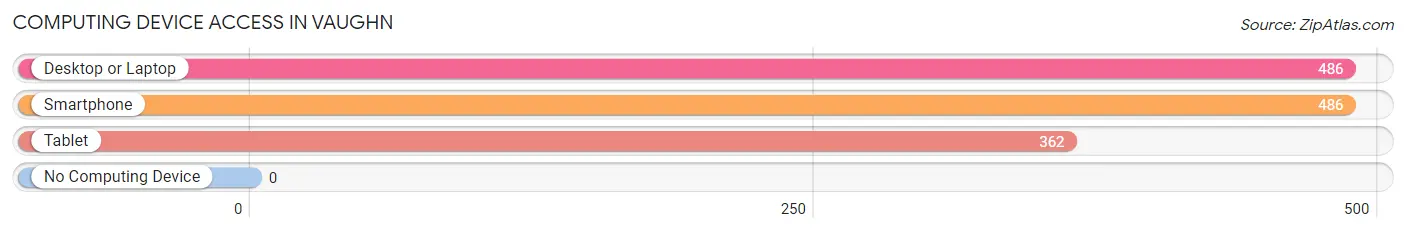
| Device Type | # Households | % Households |
| Desktop or Laptop | 486 | 100.0% |
| Smartphone | 486 | 100.0% |
| Tablet | 362 | 74.5% |
| No Computing Device | 0 | 0.0% |
| Total | 486 | 100.0% |
Internet Access in Vaughn
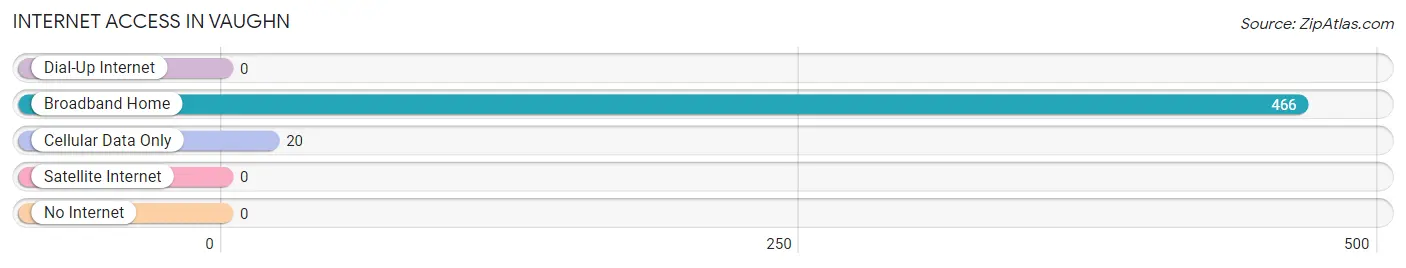
| Internet Type | # Households | % Households |
| Dial-Up Internet | 0 | 0.0% |
| Broadband Home | 466 | 95.9% |
| Cellular Data Only | 20 | 4.1% |
| Satellite Internet | 0 | 0.0% |
| No Internet | 0 | 0.0% |
| Total | 486 | 100.0% |
Vaughn Summary
Vaughn is a small unincorporated community located in Pierce County, Washington, United States. It is located on the Key Peninsula, approximately 25 miles southwest of Tacoma. The population of Vaughn was estimated to be 1,845 in 2019.
History
Vaughn was first settled in the late 1800s by homesteaders who were attracted to the area by its abundant natural resources. The first post office was established in 1891 and the town was officially incorporated in 1909. The town was named after William Vaughn, a local homesteader who had a large farm in the area.
The town grew slowly over the years, but it was not until the 1950s that it began to experience significant growth. This was due to the construction of the Vaughn Naval Air Station, which was built to provide a base for the U.S. Navy’s Pacific Fleet. The base was in operation until the early 1990s, when it was closed due to budget cuts.
Geography
Vaughn is located on the Key Peninsula, which is a narrow strip of land that separates Puget Sound from the Strait of Juan de Fuca. The town is situated on the western side of the peninsula, and is bordered by the waters of Henderson Bay to the north and Case Inlet to the south. The town is surrounded by lush forests and is home to several small lakes, including Vaughn Lake and Long Lake.
The climate in Vaughn is mild and temperate, with warm summers and cool winters. The average annual temperature is around 50°F, and the average annual precipitation is around 40 inches.
Economy
Vaughn’s economy is largely based on tourism and recreation. The town is home to several popular attractions, including the Vaughn Naval Air Station Museum, the Vaughn Historical Society Museum, and the Vaughn Wildlife Refuge. The town is also home to several marinas, which provide access to the waters of Puget Sound and the Strait of Juan de Fuca.
The town is also home to several small businesses, including restaurants, retail stores, and a few small manufacturing companies. The town is also home to a number of small farms, which produce a variety of fruits and vegetables.
Demographics
As of 2019, the population of Vaughn was estimated to be 1,845. The racial makeup of the town was 94.3% White, 1.2% African American, 0.7% Native American, 0.7% Asian, 0.2% Pacific Islander, and 2.1% from other races. The median household income was $50,945, and the median age was 44.
Vaughn is a small, close-knit community with a strong sense of community and pride. The town is home to several churches, a library, and a community center. The town also hosts several annual events, including the Vaughn Summer Festival and the Vaughn Harvest Festival.
Common Questions
What is Per Capita Income in Vaughn?
Per Capita income in Vaughn is $43,439.
What is the Median Family Income in Vaughn?
Median Family Income in Vaughn is $158,869.
What is the Median Household income in Vaughn?
Median Household Income in Vaughn is $103,286.
What is Inequality or Gini Index in Vaughn?
Inequality or Gini Index in Vaughn is 0.31.
What is the Total Population of Vaughn?
Total Population of Vaughn is 1,313.
What is the Total Male Population of Vaughn?
Total Male Population of Vaughn is 728.
What is the Total Female Population of Vaughn?
Total Female Population of Vaughn is 585.
What is the Ratio of Males per 100 Females in Vaughn?
There are 124.44 Males per 100 Females in Vaughn.
What is the Ratio of Females per 100 Males in Vaughn?
There are 80.36 Females per 100 Males in Vaughn.
What is the Median Population Age in Vaughn?
Median Population Age in Vaughn is 46.9 Years.
What is the Average Family Size in Vaughn
Average Family Size in Vaughn is 3.2 People.
What is the Average Household Size in Vaughn
Average Household Size in Vaughn is 2.6 People.
How Large is the Labor Force in Vaughn?
There are 859 People in the Labor Forcein in Vaughn.
What is the Percentage of People in the Labor Force in Vaughn?
75.3% of People are in the Labor Force in Vaughn.
What is the Unemployment Rate in Vaughn?
Unemployment Rate in Vaughn is 6.1%.