Canyon Creek, WA Map & Demographics
Canyon Creek Map
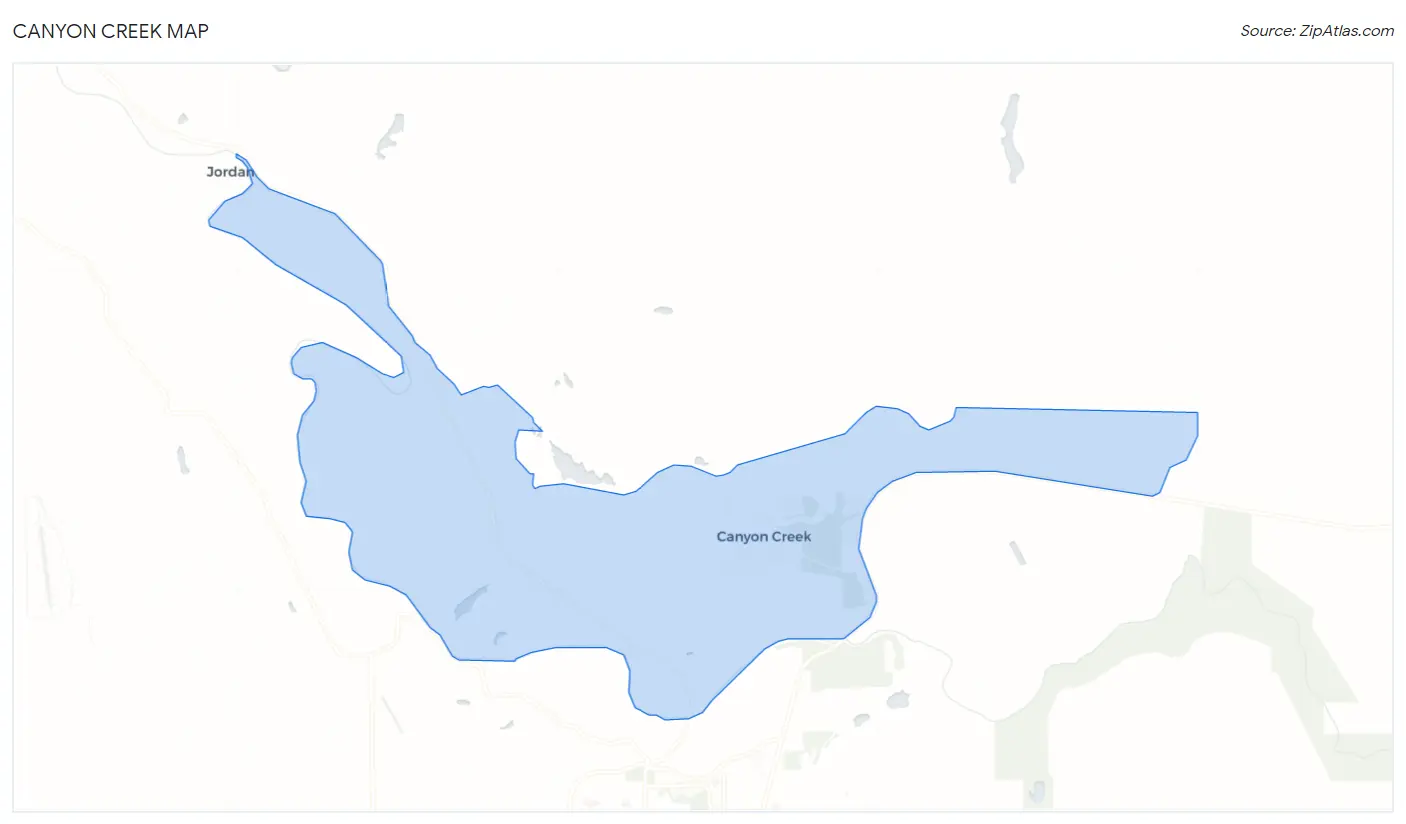
Canyon Creek Overview
$33,418
PER CAPITA INCOME
$63,662
AVG FAMILY INCOME
$72,938
AVG HOUSEHOLD INCOME
13.1%
WAGE / INCOME GAP [ % ]
86.9¢/ $1
WAGE / INCOME GAP [ $ ]
0.40
INEQUALITY / GINI INDEX
3,548
TOTAL POPULATION
1,875
MALE POPULATION
1,673
FEMALE POPULATION
112.07
MALES / 100 FEMALES
89.23
FEMALES / 100 MALES
38.3
MEDIAN AGE
2.7
AVG FAMILY SIZE
2.5
AVG HOUSEHOLD SIZE
1,805
LABOR FORCE [ PEOPLE ]
64.0%
PERCENT IN LABOR FORCE
6.0%
UNEMPLOYMENT RATE
Income in Canyon Creek
Income Overview in Canyon Creek
Per Capita Income in Canyon Creek is $33,418, while median incomes of families and households are $63,662 and $72,938 respectively.
| Characteristic | Number | Measure |
| Per Capita Income | 3,548 | $33,418 |
| Median Family Income | 1,018 | $63,662 |
| Mean Family Income | 1,018 | $86,616 |
| Median Household Income | 1,406 | $72,938 |
| Mean Household Income | 1,406 | $83,924 |
| Income Deficit | 1,018 | $0 |
| Wage / Income Gap (%) | 3,548 | 13.06% |
| Wage / Income Gap ($) | 3,548 | 86.94¢ per $1 |
| Gini / Inequality Index | 3,548 | 0.40 |
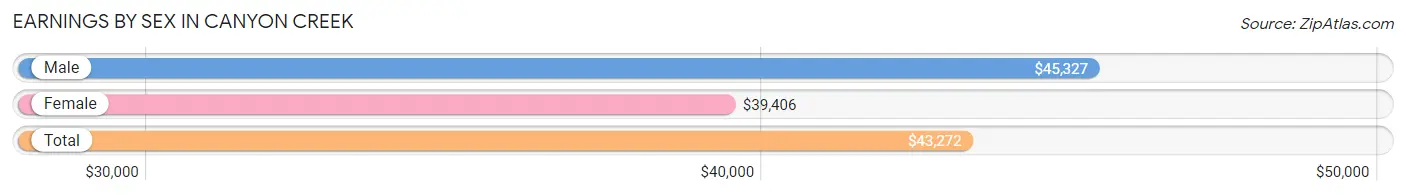
Earnings by Sex in Canyon Creek
Average Earnings in Canyon Creek are $43,272, $45,327 for men and $39,406 for women, a difference of 13.1%.
| Sex | Number | Average Earnings |
| Male | 1,153 (63.5%) | $45,327 |
| Female | 663 (36.5%) | $39,406 |
| Total | 1,816 (100.0%) | $43,272 |
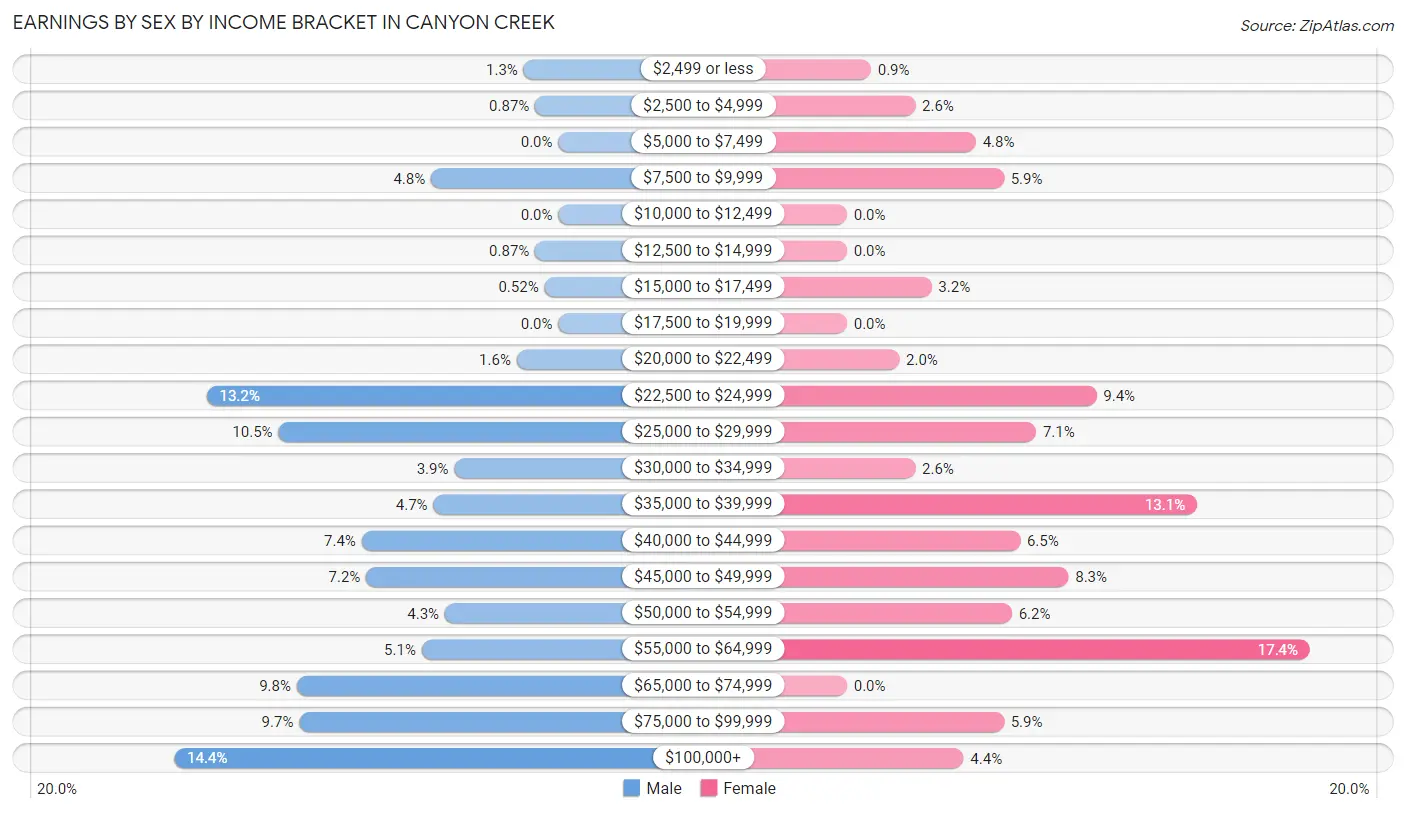
Earnings by Sex by Income Bracket in Canyon Creek
The most common earnings brackets in Canyon Creek are $100,000+ for men (166 | 14.4%) and $55,000 to $64,999 for women (115 | 17.3%).
| Income | Male | Female |
| $2,499 or less | 15 (1.3%) | 6 (0.9%) |
| $2,500 to $4,999 | 10 (0.9%) | 17 (2.6%) |
| $5,000 to $7,499 | 0 (0.0%) | 32 (4.8%) |
| $7,500 to $9,999 | 55 (4.8%) | 39 (5.9%) |
| $10,000 to $12,499 | 0 (0.0%) | 0 (0.0%) |
| $12,500 to $14,999 | 10 (0.9%) | 0 (0.0%) |
| $15,000 to $17,499 | 6 (0.5%) | 21 (3.2%) |
| $17,500 to $19,999 | 0 (0.0%) | 0 (0.0%) |
| $20,000 to $22,499 | 18 (1.6%) | 13 (2.0%) |
| $22,500 to $24,999 | 152 (13.2%) | 62 (9.3%) |
| $25,000 to $29,999 | 121 (10.5%) | 47 (7.1%) |
| $30,000 to $34,999 | 45 (3.9%) | 17 (2.6%) |
| $35,000 to $39,999 | 54 (4.7%) | 87 (13.1%) |
| $40,000 to $44,999 | 85 (7.4%) | 43 (6.5%) |
| $45,000 to $49,999 | 83 (7.2%) | 55 (8.3%) |
| $50,000 to $54,999 | 49 (4.3%) | 41 (6.2%) |
| $55,000 to $64,999 | 59 (5.1%) | 115 (17.3%) |
| $65,000 to $74,999 | 113 (9.8%) | 0 (0.0%) |
| $75,000 to $99,999 | 112 (9.7%) | 39 (5.9%) |
| $100,000+ | 166 (14.4%) | 29 (4.4%) |
| Total | 1,153 (100.0%) | 663 (100.0%) |
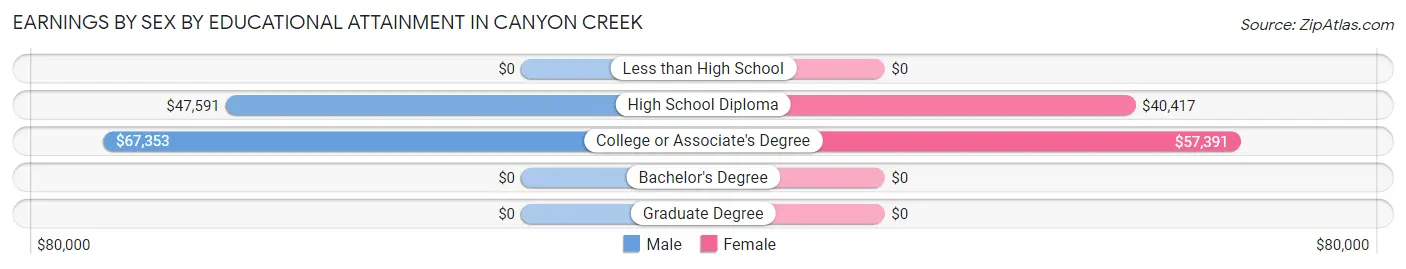
Earnings by Sex by Educational Attainment in Canyon Creek
Average earnings in Canyon Creek are $50,434 for men and $45,515 for women, a difference of 9.8%. Men with an educational attainment of college or associate's degree enjoy the highest average annual earnings of $67,353, while those with high school diploma education earn the least with $47,591. Women with an educational attainment of college or associate's degree earn the most with the average annual earnings of $57,391, while those with high school diploma education have the smallest earnings of $40,417.
| Educational Attainment | Male Income | Female Income |
| Less than High School | - | - |
| High School Diploma | $47,591 | $40,417 |
| College or Associate's Degree | $67,353 | $57,391 |
| Bachelor's Degree | - | - |
| Graduate Degree | - | - |
| Total | $50,434 | $45,515 |
Family Income in Canyon Creek
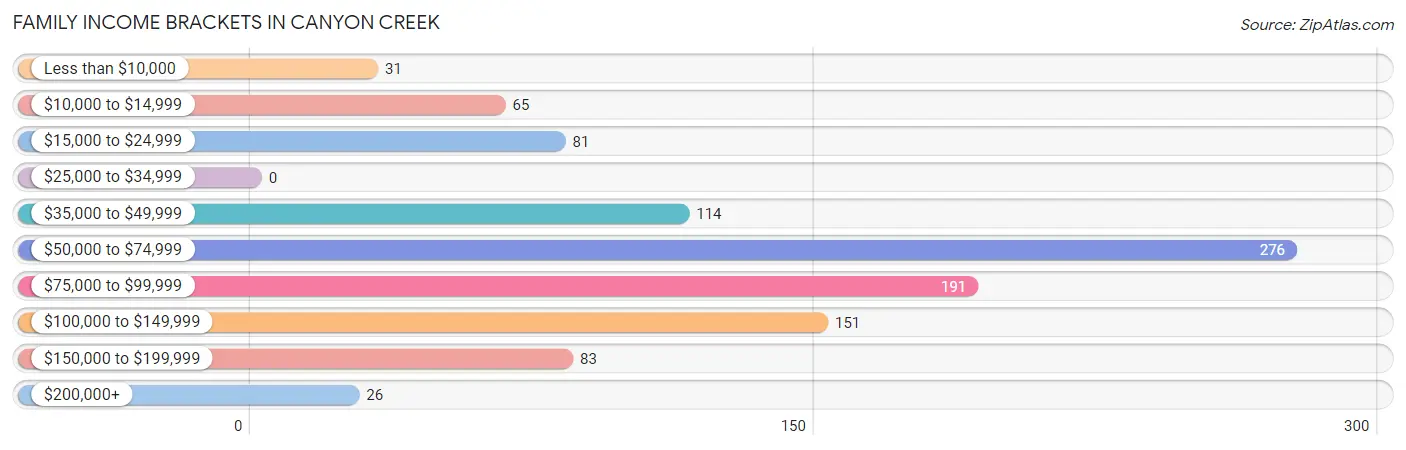
Family Income Brackets in Canyon Creek
According to the Canyon Creek family income data, there are 276 families falling into the $50,000 to $74,999 income range, which is the most common income bracket and makes up 27.1% of all families.
| Income Bracket | # Families | % Families |
| Less than $10,000 | 31 | 3.0% |
| $10,000 to $14,999 | 65 | 6.4% |
| $15,000 to $24,999 | 81 | 8.0% |
| $25,000 to $34,999 | 0 | 0.0% |
| $35,000 to $49,999 | 114 | 11.2% |
| $50,000 to $74,999 | 276 | 27.1% |
| $75,000 to $99,999 | 191 | 18.8% |
| $100,000 to $149,999 | 151 | 14.8% |
| $150,000 to $199,999 | 83 | 8.2% |
| $200,000+ | 26 | 2.6% |
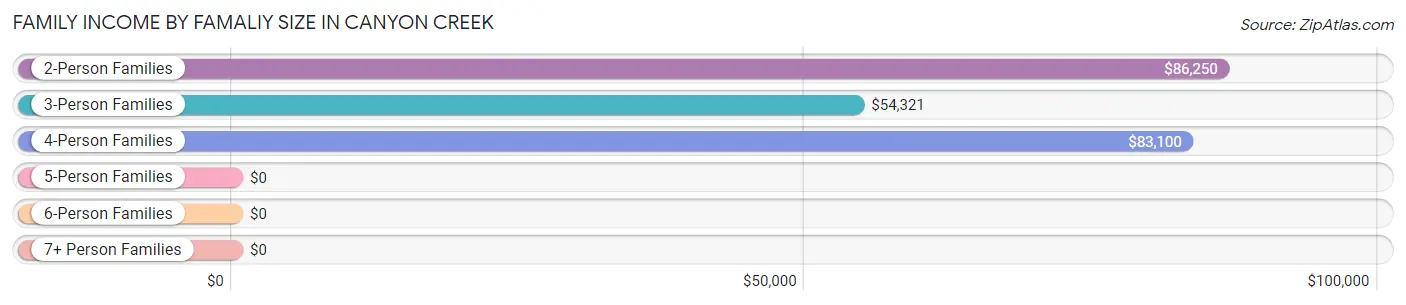
Family Income by Famaliy Size in Canyon Creek
2-person families (518 | 50.9%) account for the highest median family income in Canyon Creek with $86,250 per family, while 2-person families (518 | 50.9%) have the highest median income of $43,125 per family member.
| Income Bracket | # Families | Median Income |
| 2-Person Families | 518 (50.9%) | $86,250 |
| 3-Person Families | 281 (27.6%) | $54,321 |
| 4-Person Families | 154 (15.1%) | $83,100 |
| 5-Person Families | 59 (5.8%) | $0 |
| 6-Person Families | 0 (0.0%) | $0 |
| 7+ Person Families | 6 (0.6%) | $0 |
| Total | 1,018 (100.0%) | $63,662 |
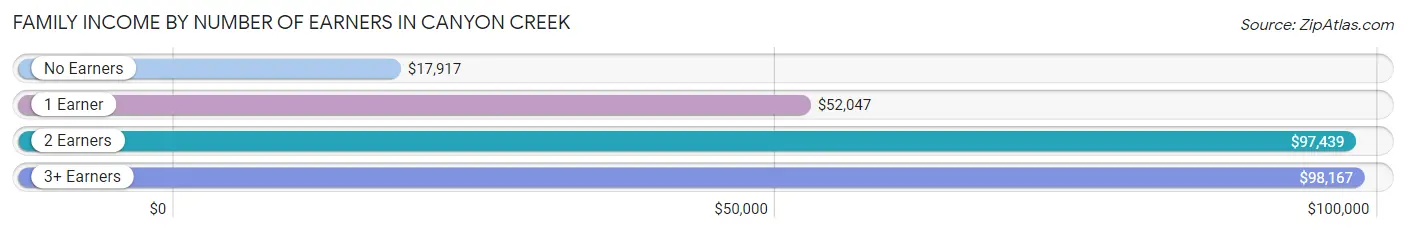
Family Income by Number of Earners in Canyon Creek
The median family income in Canyon Creek is $63,662, with families comprising 3+ earners (44) having the highest median family income of $98,167, while families with no earners (187) have the lowest median family income of $17,917, accounting for 4.3% and 18.4% of families, respectively.
| Number of Earners | # Families | Median Income |
| No Earners | 187 (18.4%) | $17,917 |
| 1 Earner | 293 (28.8%) | $52,047 |
| 2 Earners | 494 (48.5%) | $97,439 |
| 3+ Earners | 44 (4.3%) | $98,167 |
| Total | 1,018 (100.0%) | $63,662 |
Household Income in Canyon Creek
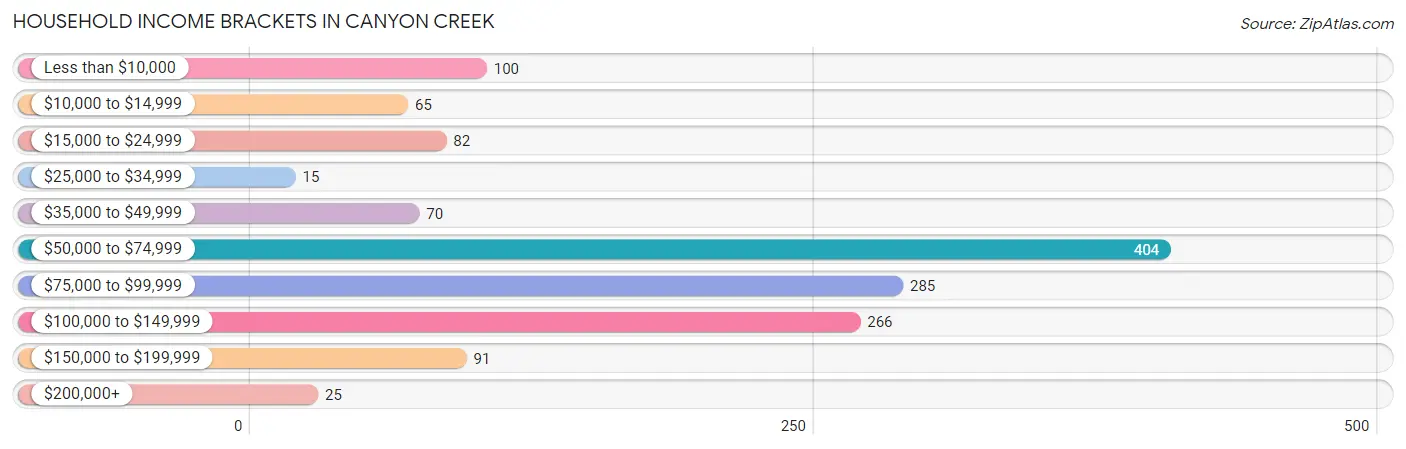
Household Income Brackets in Canyon Creek
With 404 households falling in the category, the $50,000 to $74,999 income range is the most frequent in Canyon Creek, accounting for 28.7% of all households. In contrast, only 15 households (1.1%) fall into the $25,000 to $34,999 income bracket, making it the least populous group.
| Income Bracket | # Households | % Households |
| Less than $10,000 | 100 | 7.1% |
| $10,000 to $14,999 | 65 | 4.6% |
| $15,000 to $24,999 | 82 | 5.8% |
| $25,000 to $34,999 | 15 | 1.1% |
| $35,000 to $49,999 | 70 | 5.0% |
| $50,000 to $74,999 | 404 | 28.7% |
| $75,000 to $99,999 | 285 | 20.3% |
| $100,000 to $149,999 | 266 | 18.9% |
| $150,000 to $199,999 | 91 | 6.5% |
| $200,000+ | 25 | 1.8% |
Household Income by Householder Age in Canyon Creek
The median household income in Canyon Creek is $72,938, with the highest median household income of $78,427 found in the 45 to 64 years age bracket for the primary householder. A total of 759 households (54.0%) fall into this category. Meanwhile, the 15 to 24 years age bracket for the primary householder has the lowest median household income of $0, with 10 households (0.7%) in this group.
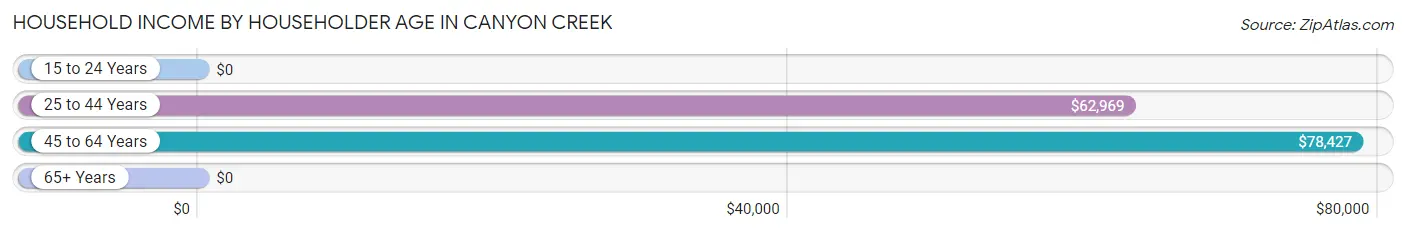
| Income Bracket | # Households | Median Income |
| 15 to 24 Years | 10 (0.7%) | $0 |
| 25 to 44 Years | 496 (35.3%) | $62,969 |
| 45 to 64 Years | 759 (54.0%) | $78,427 |
| 65+ Years | 141 (10.0%) | $0 |
| Total | 1,406 (100.0%) | $72,938 |
Poverty in Canyon Creek
Income Below Poverty by Sex and Age in Canyon Creek
With 9.9% poverty level for males and 29.5% for females among the residents of Canyon Creek, 12 to 14 year old males and 15 year old females are the most vulnerable to poverty, with 15 males (100.0%) and 63 females (100.0%) in their respective age groups living below the poverty level.
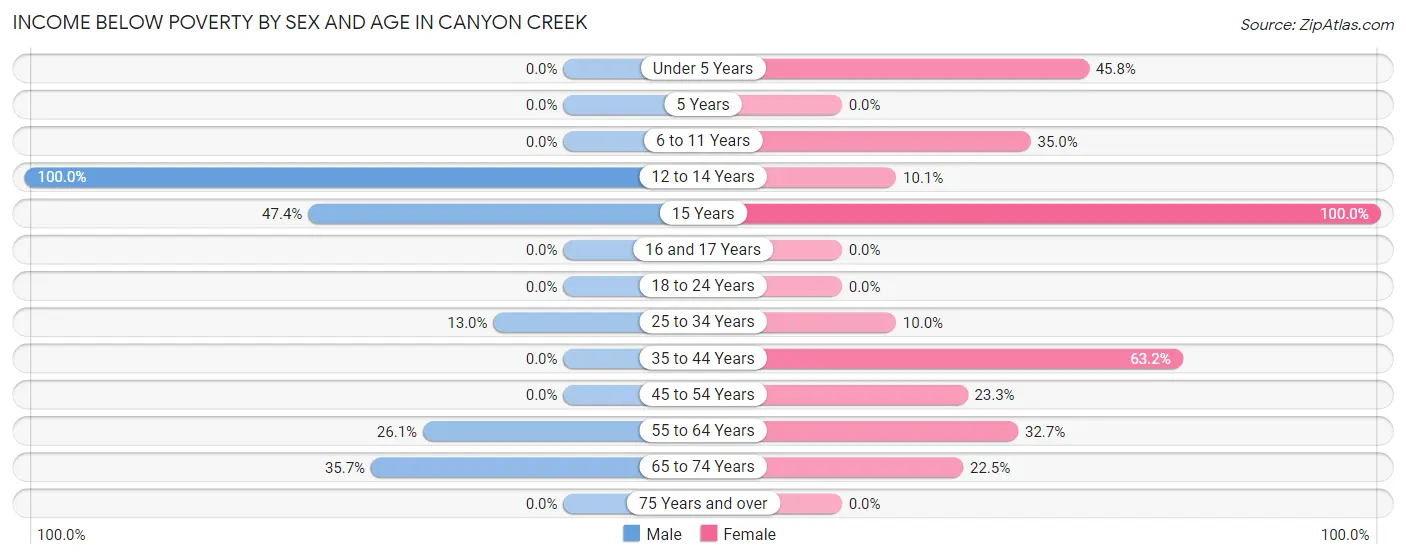
| Age Bracket | Male | Female |
| Under 5 Years | 0 (0.0%) | 44 (45.8%) |
| 5 Years | 0 (0.0%) | 0 (0.0%) |
| 6 to 11 Years | 0 (0.0%) | 48 (35.0%) |
| 12 to 14 Years | 15 (100.0%) | 13 (10.1%) |
| 15 Years | 9 (47.4%) | 63 (100.0%) |
| 16 and 17 Years | 0 (0.0%) | 0 (0.0%) |
| 18 to 24 Years | 0 (0.0%) | 0 (0.0%) |
| 25 to 34 Years | 50 (13.0%) | 26 (10.0%) |
| 35 to 44 Years | 0 (0.0%) | 141 (63.2%) |
| 45 to 54 Years | 0 (0.0%) | 52 (23.3%) |
| 55 to 64 Years | 91 (26.1%) | 88 (32.7%) |
| 65 to 74 Years | 20 (35.7%) | 18 (22.5%) |
| 75 Years and over | 0 (0.0%) | 0 (0.0%) |
| Total | 185 (9.9%) | 493 (29.5%) |
Income Above Poverty by Sex and Age in Canyon Creek
According to the poverty statistics in Canyon Creek, males aged under 5 years and females aged 18 to 24 years are the age groups that are most secure financially, with 100.0% of males and 100.0% of females in these age groups living above the poverty line.
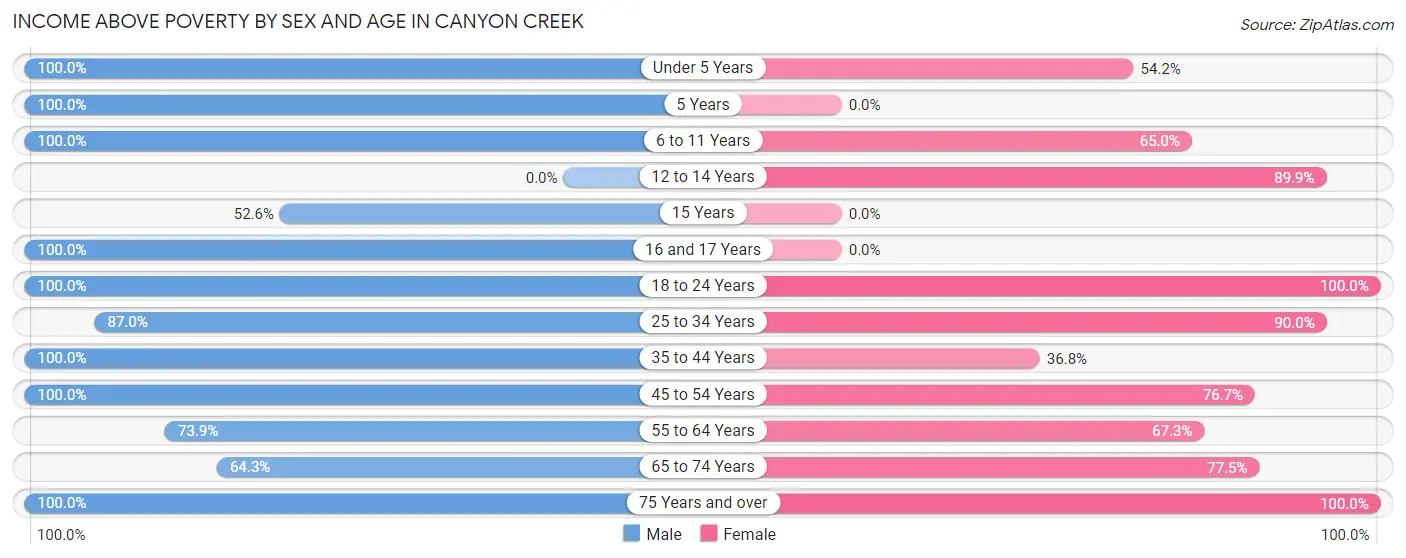
| Age Bracket | Male | Female |
| Under 5 Years | 148 (100.0%) | 52 (54.2%) |
| 5 Years | 24 (100.0%) | 0 (0.0%) |
| 6 to 11 Years | 97 (100.0%) | 89 (65.0%) |
| 12 to 14 Years | 0 (0.0%) | 116 (89.9%) |
| 15 Years | 10 (52.6%) | 0 (0.0%) |
| 16 and 17 Years | 15 (100.0%) | 0 (0.0%) |
| 18 to 24 Years | 177 (100.0%) | 139 (100.0%) |
| 25 to 34 Years | 335 (87.0%) | 233 (90.0%) |
| 35 to 44 Years | 134 (100.0%) | 82 (36.8%) |
| 45 to 54 Years | 426 (100.0%) | 171 (76.7%) |
| 55 to 64 Years | 258 (73.9%) | 181 (67.3%) |
| 65 to 74 Years | 36 (64.3%) | 62 (77.5%) |
| 75 Years and over | 30 (100.0%) | 55 (100.0%) |
| Total | 1,690 (90.1%) | 1,180 (70.5%) |
Income Below Poverty Among Married-Couple Families in Canyon Creek
The poverty statistics for married-couple families in Canyon Creek show that 3.0% or 18 of the total 593 families live below the poverty line. Families with no children have the highest poverty rate of 5.1%, comprising of 18 families. On the other hand, families with 1 or 2 children have the lowest poverty rate of 0.0%, which includes 0 families.
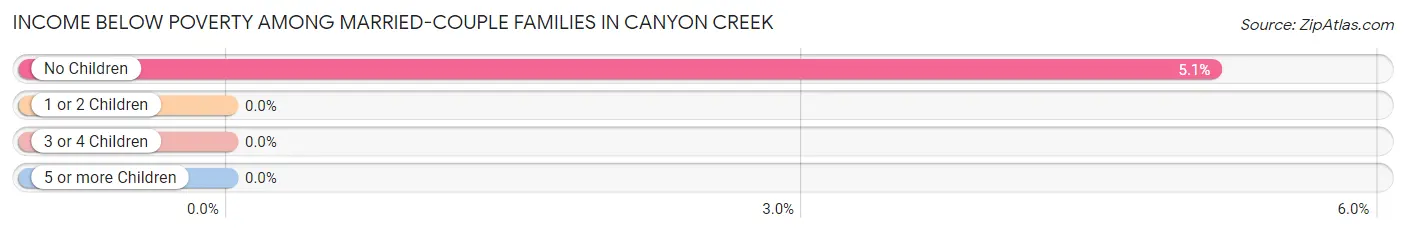
| Children | Above Poverty | Below Poverty |
| No Children | 332 (94.9%) | 18 (5.1%) |
| 1 or 2 Children | 196 (100.0%) | 0 (0.0%) |
| 3 or 4 Children | 41 (100.0%) | 0 (0.0%) |
| 5 or more Children | 6 (100.0%) | 0 (0.0%) |
| Total | 575 (97.0%) | 18 (3.0%) |
Income Below Poverty Among Single-Parent Households in Canyon Creek
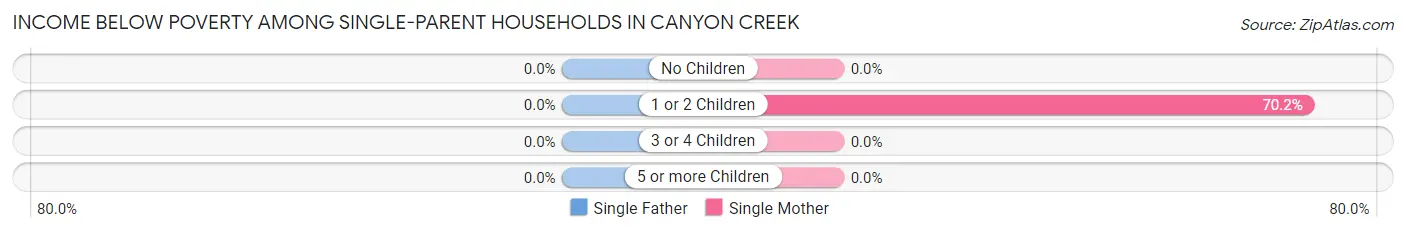
| Children | Single Father | Single Mother |
| No Children | 0 (0.0%) | 0 (0.0%) |
| 1 or 2 Children | 0 (0.0%) | 141 (70.2%) |
| 3 or 4 Children | 0 (0.0%) | 0 (0.0%) |
| 5 or more Children | 0 (0.0%) | 0 (0.0%) |
| Total | 0 (0.0%) | 141 (57.6%) |
Income Below Poverty Among Married-Couple vs Single-Parent Households in Canyon Creek
The poverty data for Canyon Creek shows that 18 of the married-couple family households (3.0%) and 141 of the single-parent households (33.2%) are living below the poverty level. Within the married-couple family households, those with no children have the highest poverty rate, with 18 households (5.1%) falling below the poverty line. Among the single-parent households, those with 1 or 2 children have the highest poverty rate, with 141 household (60.0%) living below poverty.
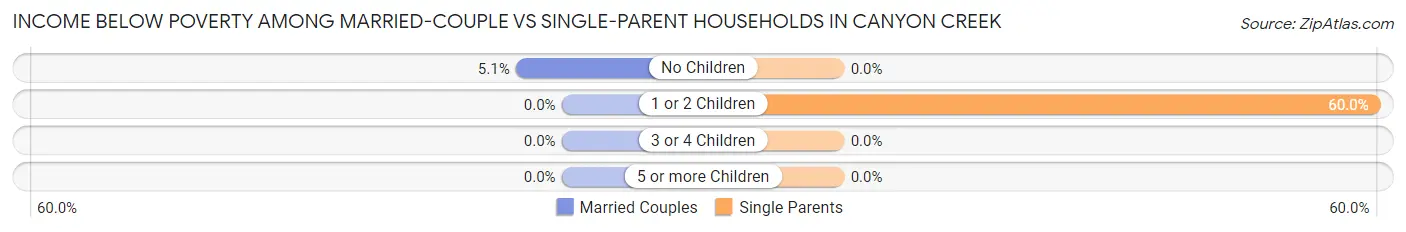
| Children | Married-Couple Families | Single-Parent Households |
| No Children | 18 (5.1%) | 0 (0.0%) |
| 1 or 2 Children | 0 (0.0%) | 141 (60.0%) |
| 3 or 4 Children | 0 (0.0%) | 0 (0.0%) |
| 5 or more Children | 0 (0.0%) | 0 (0.0%) |
| Total | 18 (3.0%) | 141 (33.2%) |
Race in Canyon Creek
The most populous races in Canyon Creek are White / Caucasian (3,475 | 97.9%), Hispanic or Latino (73 | 2.1%), and Black / African American (34 | 1.0%).
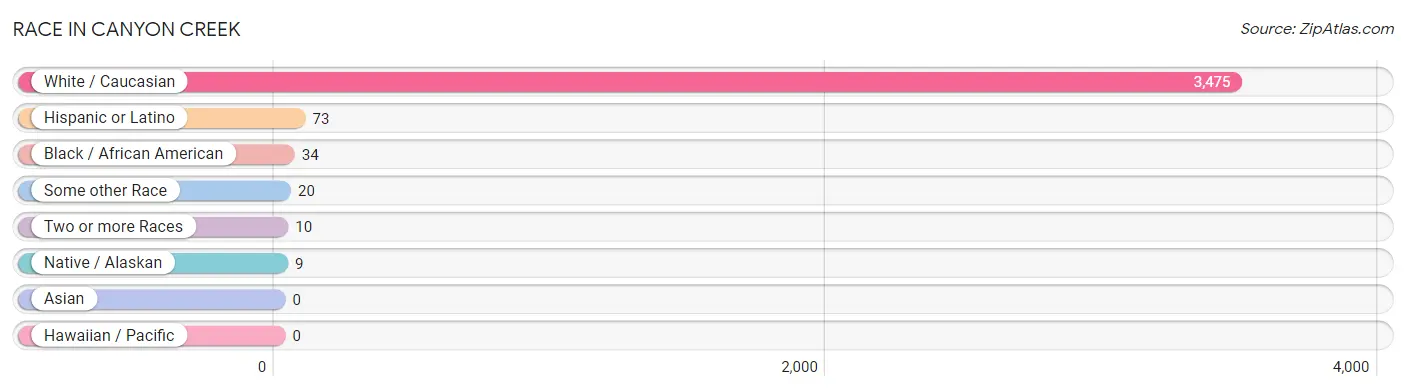
| Race | # Population | % Population |
| Asian | 0 | 0.0% |
| Black / African American | 34 | 1.0% |
| Hawaiian / Pacific | 0 | 0.0% |
| Hispanic or Latino | 73 | 2.1% |
| Native / Alaskan | 9 | 0.3% |
| White / Caucasian | 3,475 | 97.9% |
| Two or more Races | 10 | 0.3% |
| Some other Race | 20 | 0.6% |
| Total | 3,548 | 100.0% |
Ancestry in Canyon Creek
The most populous ancestries reported in Canyon Creek are German (783 | 22.1%), Irish (410 | 11.6%), English (282 | 8.0%), Norwegian (215 | 6.1%), and Welsh (145 | 4.1%), together accounting for 51.7% of all Canyon Creek residents.
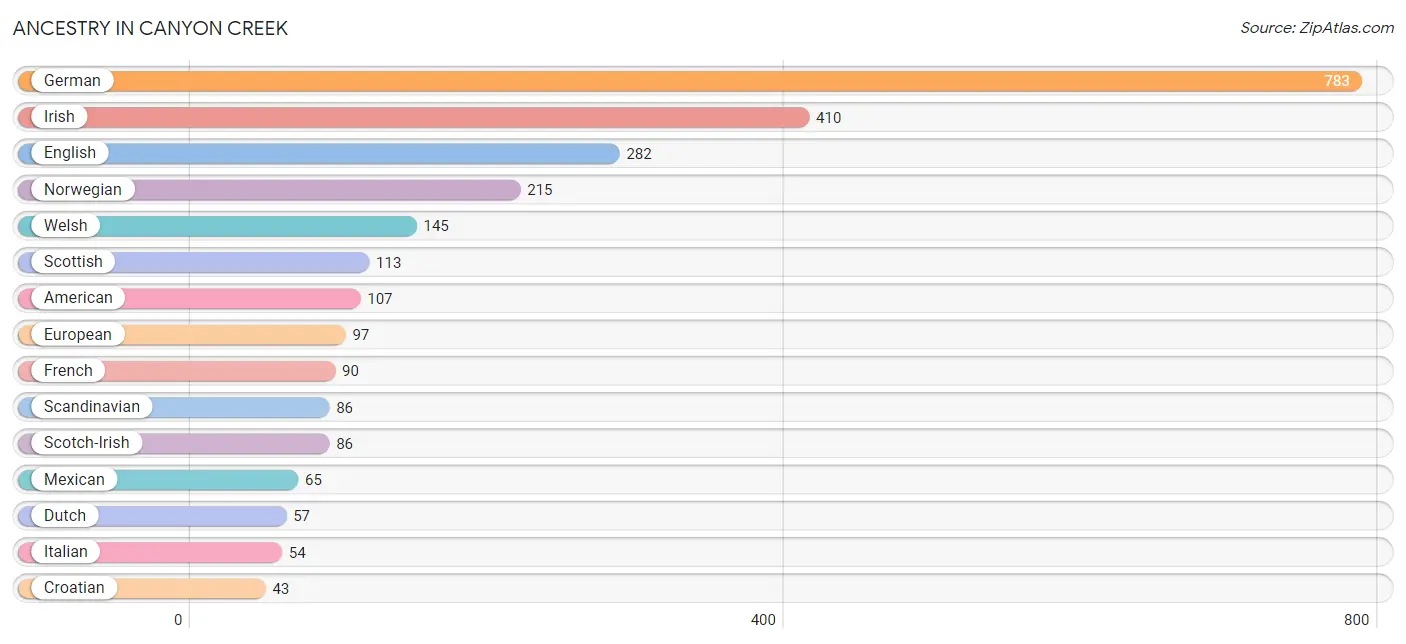
| Ancestry | # Population | % Population |
| African | 15 | 0.4% |
| American | 107 | 3.0% |
| British | 13 | 0.4% |
| Croatian | 43 | 1.2% |
| Czech | 26 | 0.7% |
| Czechoslovakian | 10 | 0.3% |
| Danish | 11 | 0.3% |
| Dutch | 57 | 1.6% |
| English | 282 | 8.0% |
| European | 97 | 2.7% |
| Finnish | 43 | 1.2% |
| French | 90 | 2.5% |
| French Canadian | 18 | 0.5% |
| German | 783 | 22.1% |
| Irish | 410 | 11.6% |
| Italian | 54 | 1.5% |
| Lithuanian | 9 | 0.3% |
| Mexican | 65 | 1.8% |
| Norwegian | 215 | 6.1% |
| Polish | 24 | 0.7% |
| Puget Sound Salish | 9 | 0.3% |
| Russian | 9 | 0.3% |
| Scandinavian | 86 | 2.4% |
| Scotch-Irish | 86 | 2.4% |
| Scottish | 113 | 3.2% |
| Spanish | 8 | 0.2% |
| Subsaharan African | 15 | 0.4% |
| Swedish | 40 | 1.1% |
| Welsh | 145 | 4.1% | View All 29 Rows |
Immigrants in Canyon Creek
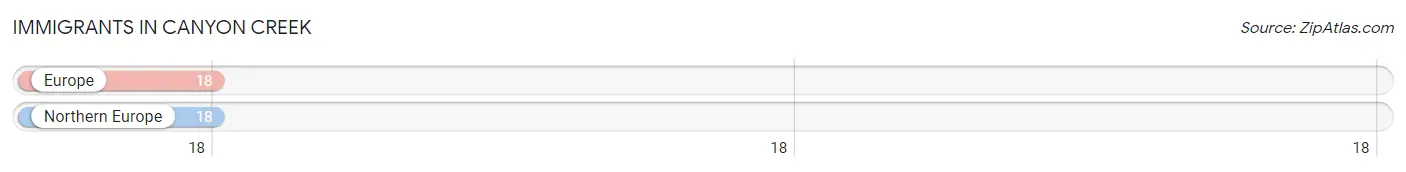
The most numerous immigrant groups reported in Canyon Creek came from Europe (18 | 0.5%), and Northern Europe (18 | 0.5%), together accounting for 1.0% of all Canyon Creek residents.
| Immigration Origin | # Population | % Population |
| Europe | 18 | 0.5% |
| Northern Europe | 18 | 0.5% | View All 2 Rows |
Sex and Age in Canyon Creek
Sex and Age in Canyon Creek
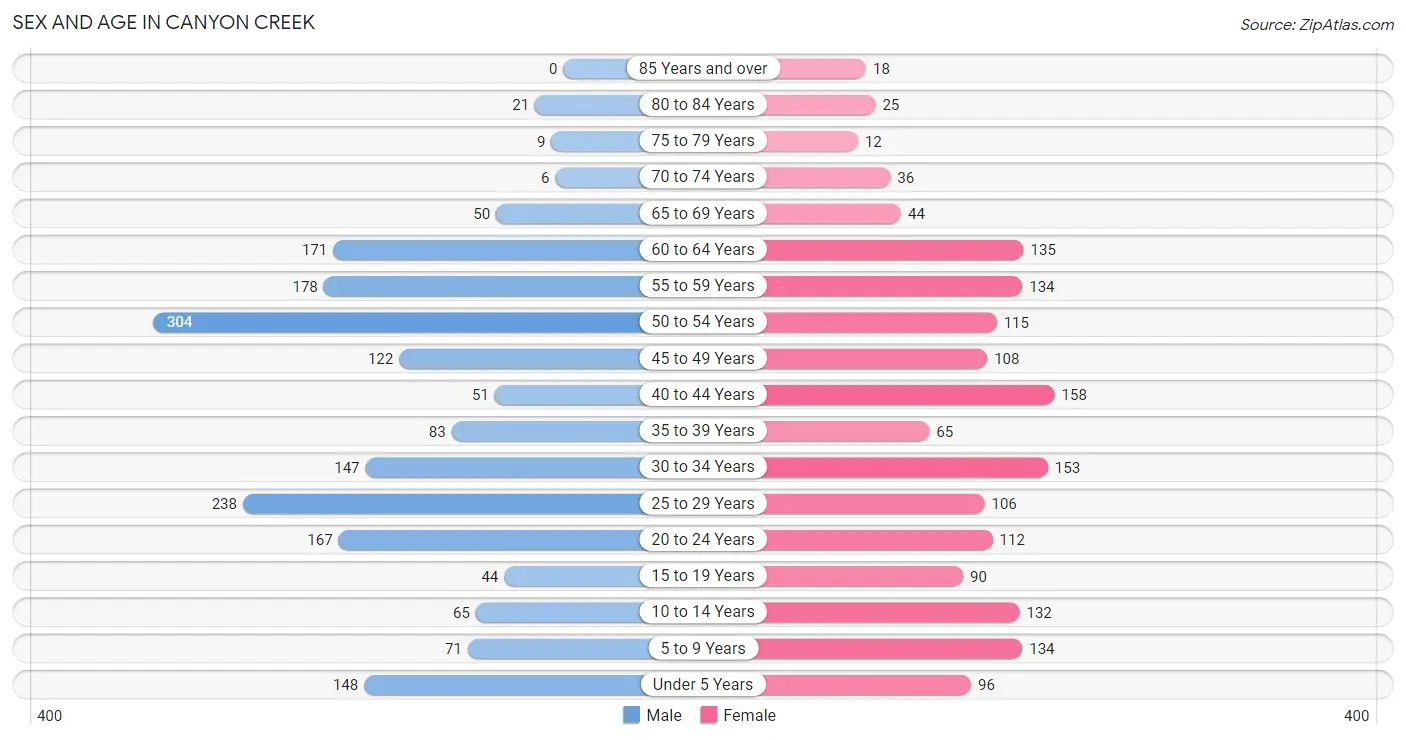
The most populous age groups in Canyon Creek are 50 to 54 Years (304 | 16.2%) for men and 40 to 44 Years (158 | 9.4%) for women.
| Age Bracket | Male | Female |
| Under 5 Years | 148 (7.9%) | 96 (5.7%) |
| 5 to 9 Years | 71 (3.8%) | 134 (8.0%) |
| 10 to 14 Years | 65 (3.5%) | 132 (7.9%) |
| 15 to 19 Years | 44 (2.4%) | 90 (5.4%) |
| 20 to 24 Years | 167 (8.9%) | 112 (6.7%) |
| 25 to 29 Years | 238 (12.7%) | 106 (6.3%) |
| 30 to 34 Years | 147 (7.8%) | 153 (9.1%) |
| 35 to 39 Years | 83 (4.4%) | 65 (3.9%) |
| 40 to 44 Years | 51 (2.7%) | 158 (9.4%) |
| 45 to 49 Years | 122 (6.5%) | 108 (6.5%) |
| 50 to 54 Years | 304 (16.2%) | 115 (6.9%) |
| 55 to 59 Years | 178 (9.5%) | 134 (8.0%) |
| 60 to 64 Years | 171 (9.1%) | 135 (8.1%) |
| 65 to 69 Years | 50 (2.7%) | 44 (2.6%) |
| 70 to 74 Years | 6 (0.3%) | 36 (2.1%) |
| 75 to 79 Years | 9 (0.5%) | 12 (0.7%) |
| 80 to 84 Years | 21 (1.1%) | 25 (1.5%) |
| 85 Years and over | 0 (0.0%) | 18 (1.1%) |
| Total | 1,875 (100.0%) | 1,673 (100.0%) |
Families and Households in Canyon Creek
Median Family Size in Canyon Creek
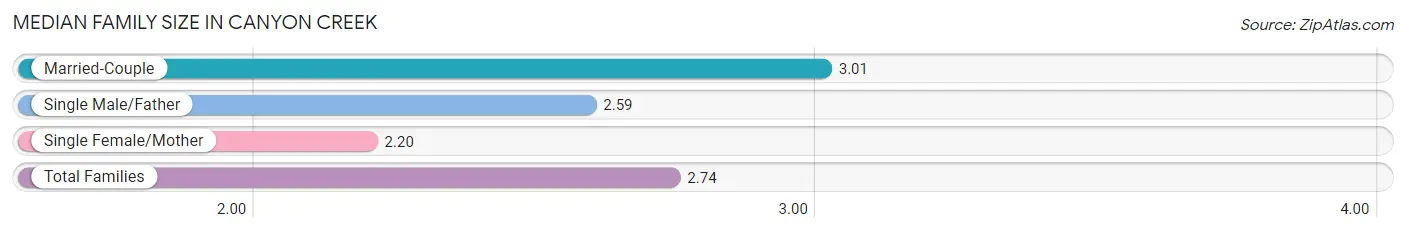
The median family size in Canyon Creek is 2.74 persons per family, with married-couple families (593 | 58.3%) accounting for the largest median family size of 3.01 persons per family. On the other hand, single female/mother families (245 | 24.1%) represent the smallest median family size with 2.20 persons per family.
| Family Type | # Families | Family Size |
| Married-Couple | 593 (58.3%) | 3.01 |
| Single Male/Father | 180 (17.7%) | 2.59 |
| Single Female/Mother | 245 (24.1%) | 2.20 |
| Total Families | 1,018 (100.0%) | 2.74 |
Median Household Size in Canyon Creek
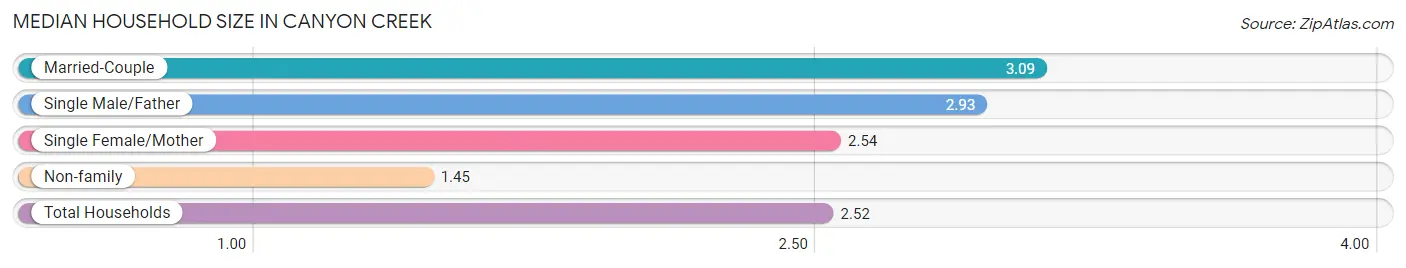
The median household size in Canyon Creek is 2.52 persons per household, with married-couple households (593 | 42.2%) accounting for the largest median household size of 3.09 persons per household. non-family households (388 | 27.6%) represent the smallest median household size with 1.45 persons per household.
| Household Type | # Households | Household Size |
| Married-Couple | 593 (42.2%) | 3.09 |
| Single Male/Father | 180 (12.8%) | 2.93 |
| Single Female/Mother | 245 (17.4%) | 2.54 |
| Non-family | 388 (27.6%) | 1.45 |
| Total Households | 1,406 (100.0%) | 2.52 |
Household Size by Marriage Status in Canyon Creek
Out of a total of 1,406 households in Canyon Creek, 1,018 (72.4%) are family households, while 388 (27.6%) are nonfamily households. The most numerous type of family households are 2-person households, comprising 404, and the most common type of nonfamily households are 1-person households, comprising 194.
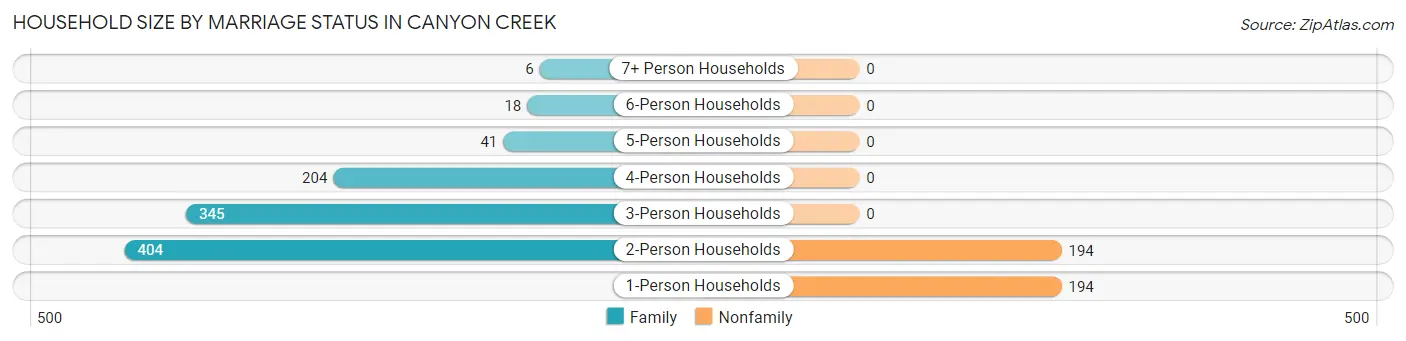
| Household Size | Family Households | Nonfamily Households |
| 1-Person Households | - | 194 (13.8%) |
| 2-Person Households | 404 (28.7%) | 194 (13.8%) |
| 3-Person Households | 345 (24.5%) | 0 (0.0%) |
| 4-Person Households | 204 (14.5%) | 0 (0.0%) |
| 5-Person Households | 41 (2.9%) | 0 (0.0%) |
| 6-Person Households | 18 (1.3%) | 0 (0.0%) |
| 7+ Person Households | 6 (0.4%) | 0 (0.0%) |
| Total | 1,018 (72.4%) | 388 (27.6%) |
Female Fertility in Canyon Creek
Fertility by Age in Canyon Creek
Average fertility rate in Canyon Creek is 88.0 births per 1,000 women. Women in the age bracket of 20 to 34 years have the highest fertility rate with 199.0 births per 1,000 women. Women in the age bracket of 20 to 34 years acount for 100.0% of all women with births.
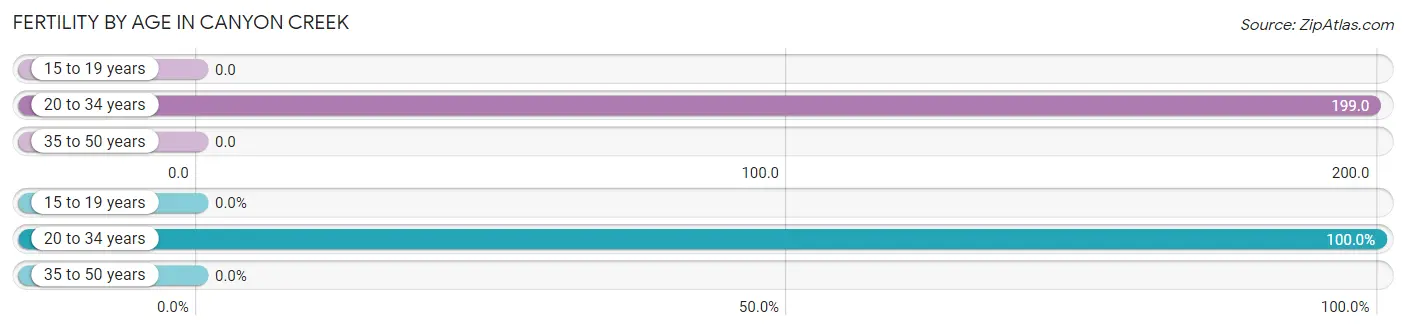
| Age Bracket | Women with Births | Births / 1,000 Women |
| 15 to 19 years | 0 (0.0%) | 0.0 |
| 20 to 34 years | 74 (100.0%) | 199.0 |
| 35 to 50 years | 0 (0.0%) | 0.0 |
| Total | 74 (100.0%) | 88.0 |
Fertility by Age by Marriage Status in Canyon Creek
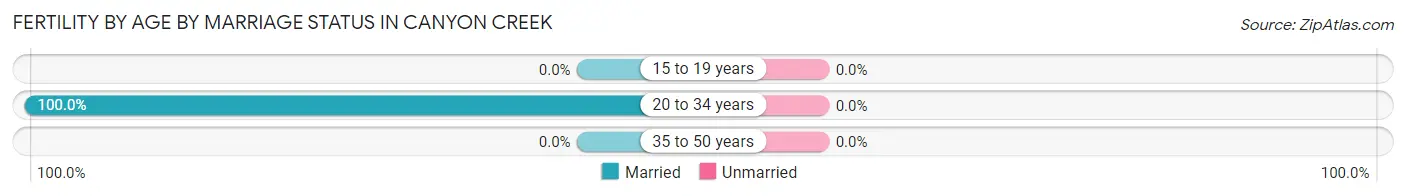
| Age Bracket | Married | Unmarried |
| 15 to 19 years | 0 (0.0%) | 0 (0.0%) |
| 20 to 34 years | 74 (100.0%) | 0 (0.0%) |
| 35 to 50 years | 0 (0.0%) | 0 (0.0%) |
| Total | 74 (100.0%) | 0 (0.0%) |
Fertility by Education in Canyon Creek
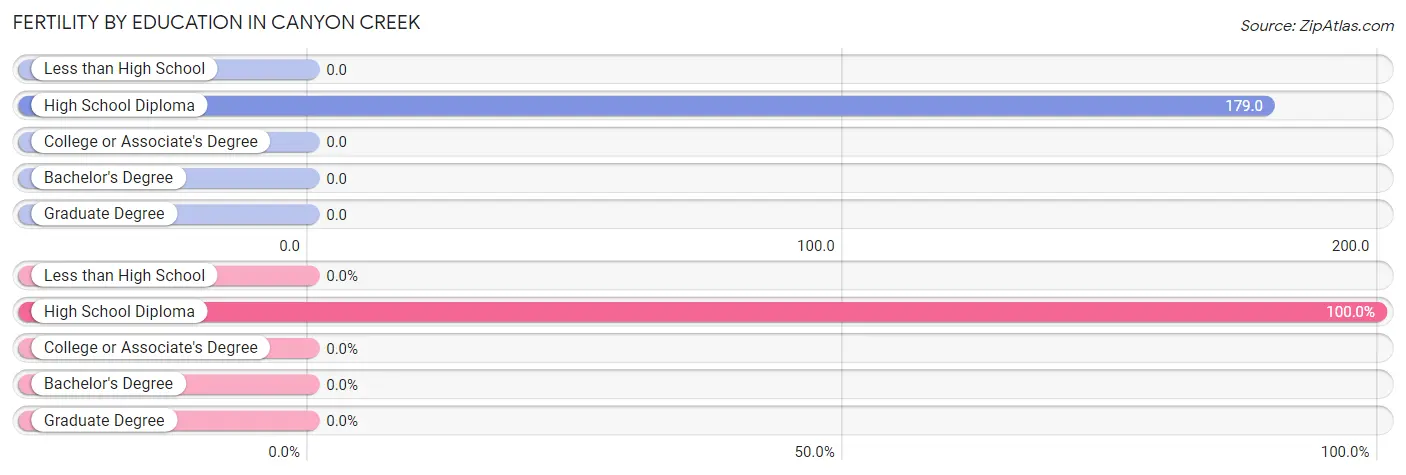
| Educational Attainment | Women with Births | Births / 1,000 Women |
| Less than High School | 0 (0.0%) | 0.0 |
| High School Diploma | 74 (100.0%) | 179.0 |
| College or Associate's Degree | 0 (0.0%) | 0.0 |
| Bachelor's Degree | 0 (0.0%) | 0.0 |
| Graduate Degree | 0 (0.0%) | 0.0 |
| Total | 74 (100.0%) | 88.0 |
Fertility by Education by Marriage Status in Canyon Creek
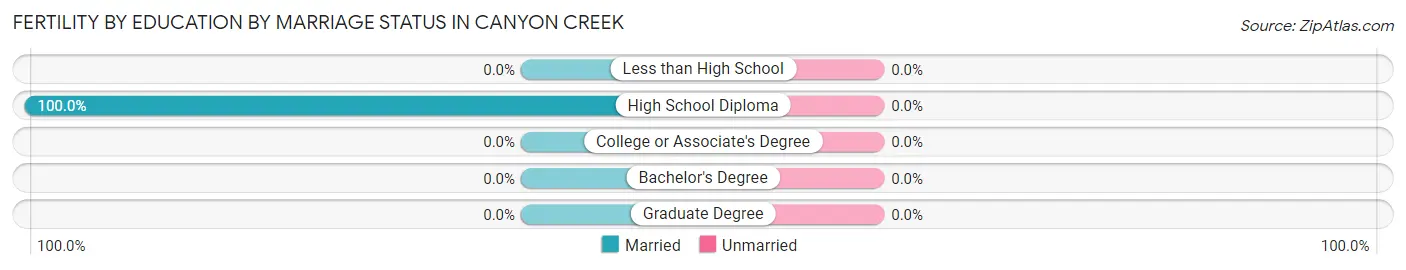
| Educational Attainment | Married | Unmarried |
| Less than High School | 0 (0.0%) | 0 (0.0%) |
| High School Diploma | 74 (100.0%) | 0 (0.0%) |
| College or Associate's Degree | 0 (0.0%) | 0 (0.0%) |
| Bachelor's Degree | 0 (0.0%) | 0 (0.0%) |
| Graduate Degree | 0 (0.0%) | 0 (0.0%) |
| Total | 74 (100.0%) | 0 (0.0%) |
Employment Characteristics in Canyon Creek
Employment by Class of Employer in Canyon Creek
Among the 1,698 employed individuals in Canyon Creek, private company employees (1,246 | 73.4%), not-for-profit organizations (126 | 7.4%), and local government employees (110 | 6.5%) make up the most common classes of employment.
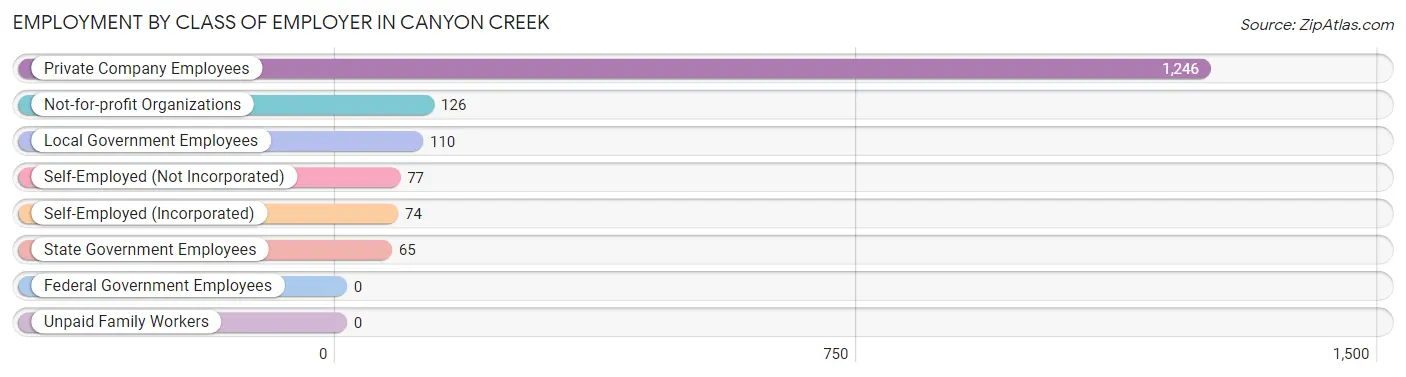
| Employer Class | # Employees | % Employees |
| Private Company Employees | 1,246 | 73.4% |
| Self-Employed (Incorporated) | 74 | 4.4% |
| Self-Employed (Not Incorporated) | 77 | 4.5% |
| Not-for-profit Organizations | 126 | 7.4% |
| Local Government Employees | 110 | 6.5% |
| State Government Employees | 65 | 3.8% |
| Federal Government Employees | 0 | 0.0% |
| Unpaid Family Workers | 0 | 0.0% |
| Total | 1,698 | 100.0% |
Employment Status by Age in Canyon Creek
According to the labor force statistics for Canyon Creek, out of the total population over 16 years of age (2,820), 64.0% or 1,805 individuals are in the labor force, with 6.0% or 108 of them unemployed. The age group with the highest labor force participation rate is 20 to 24 years, with 100.0% or 279 individuals in the labor force. Within the labor force, the 30 to 34 years age range has the highest percentage of unemployed individuals, with 21.6% or 42 of them being unemployed.
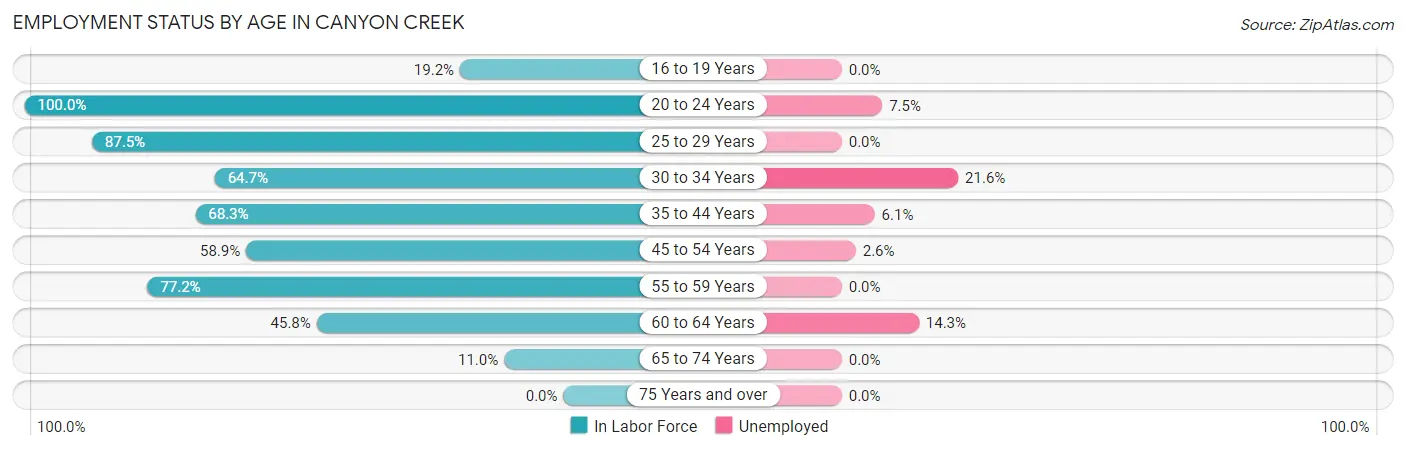
| Age Bracket | In Labor Force | Unemployed |
| 16 to 19 Years | 10 (19.2%) | 0 (0.0%) |
| 20 to 24 Years | 279 (100.0%) | 21 (7.5%) |
| 25 to 29 Years | 301 (87.5%) | 0 (0.0%) |
| 30 to 34 Years | 194 (64.7%) | 42 (21.6%) |
| 35 to 44 Years | 244 (68.3%) | 15 (6.1%) |
| 45 to 54 Years | 382 (58.9%) | 10 (2.6%) |
| 55 to 59 Years | 241 (77.2%) | 0 (0.0%) |
| 60 to 64 Years | 140 (45.8%) | 20 (14.3%) |
| 65 to 74 Years | 15 (11.0%) | 0 (0.0%) |
| 75 Years and over | 0 (0.0%) | 0 (0.0%) |
| Total | 1,805 (64.0%) | 108 (6.0%) |
Employment Status by Educational Attainment in Canyon Creek
According to labor force statistics for Canyon Creek, 66.2% of individuals (1,501) out of the total population between 25 and 64 years of age (2,268) are in the labor force, with 5.8% or 87 of them being unemployed. The group with the highest labor force participation rate are those with the educational attainment of college / associate degree, with 84.3% or 466 individuals in the labor force. Within the labor force, individuals with bachelor's degree or higher education have the highest percentage of unemployment, with 8.4% or 20 of them being unemployed.
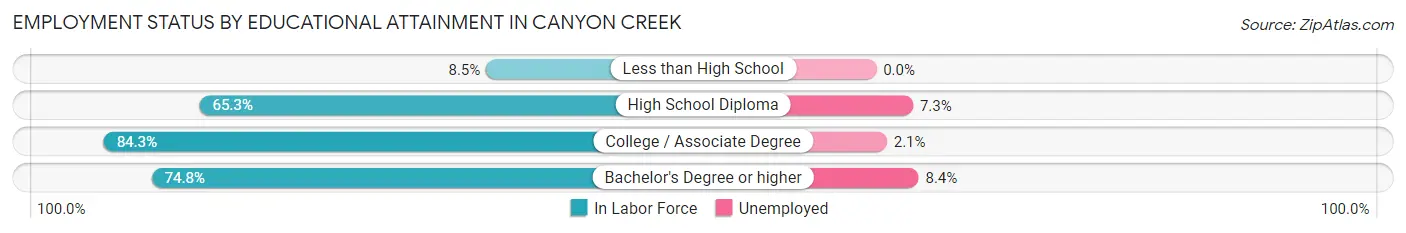
| Educational Attainment | In Labor Force | Unemployed |
| Less than High School | 17 (8.5%) | 0 (0.0%) |
| High School Diploma | 782 (65.3%) | 87 (7.3%) |
| College / Associate Degree | 466 (84.3%) | 12 (2.1%) |
| Bachelor's Degree or higher | 237 (74.8%) | 27 (8.4%) |
| Total | 1,501 (66.2%) | 132 (5.8%) |
Employment Occupations by Sex in Canyon Creek
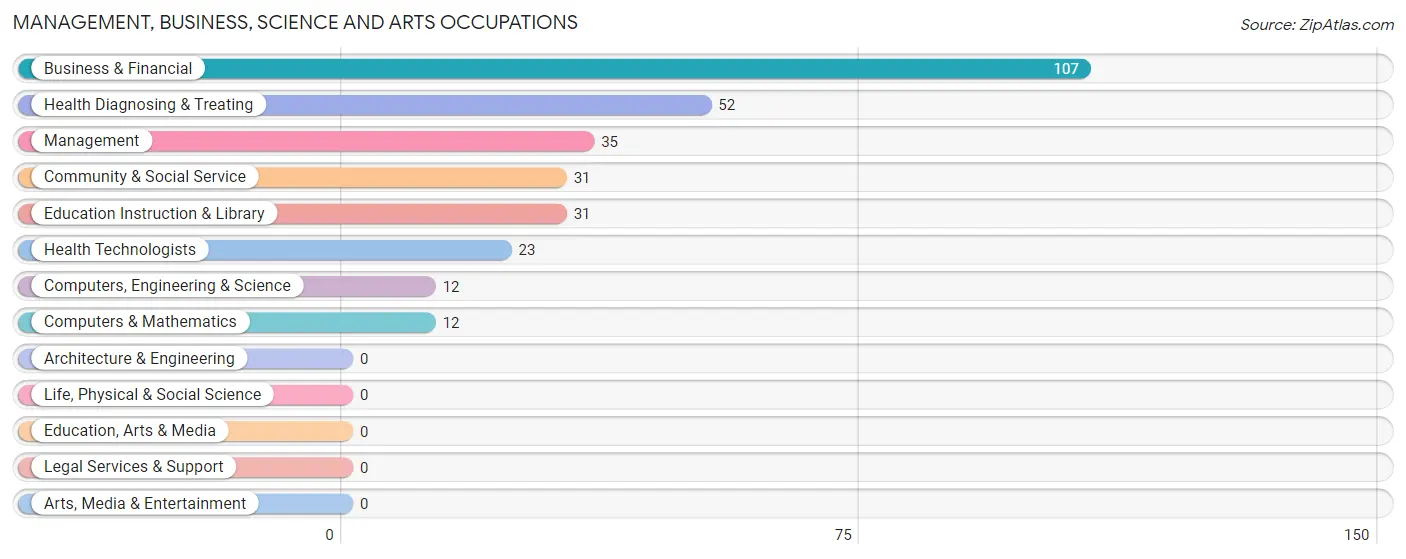
Management, Business, Science and Arts Occupations
The most common Management, Business, Science and Arts occupations in Canyon Creek are Business & Financial (107 | 6.3%), Health Diagnosing & Treating (52 | 3.1%), Management (35 | 2.1%), Community & Social Service (31 | 1.8%), and Education Instruction & Library (31 | 1.8%).
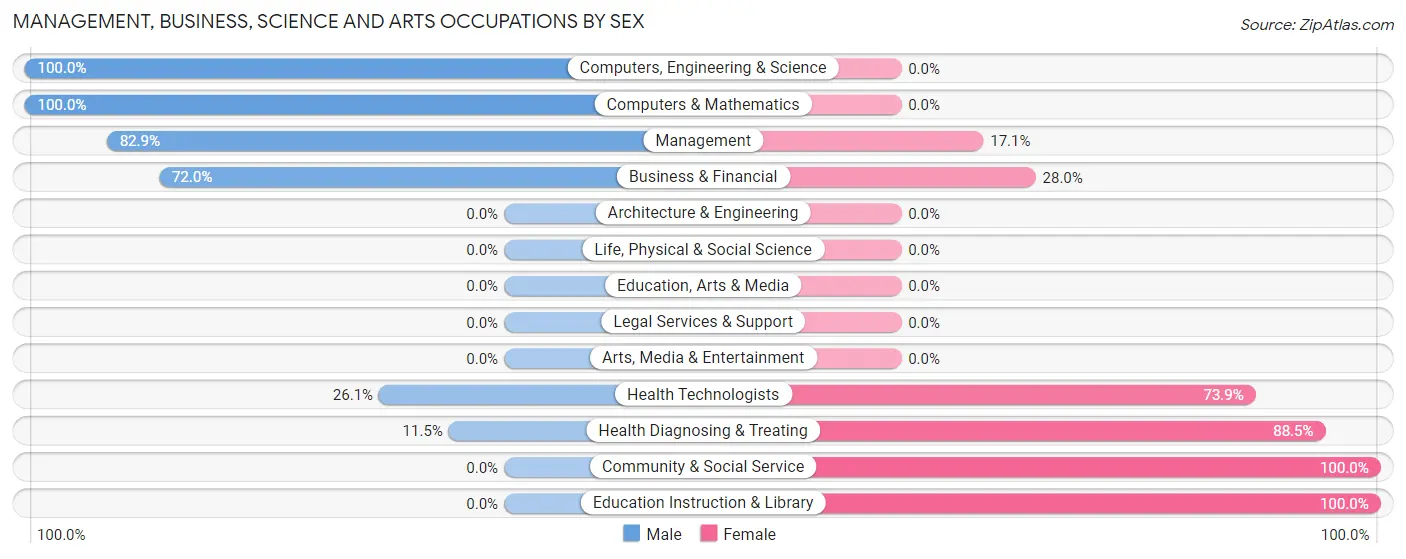
Management, Business, Science and Arts Occupations by Sex
Within the Management, Business, Science and Arts occupations in Canyon Creek, the most male-oriented occupations are Computers, Engineering & Science (100.0%), Computers & Mathematics (100.0%), and Management (82.9%), while the most female-oriented occupations are Community & Social Service (100.0%), Education Instruction & Library (100.0%), and Health Diagnosing & Treating (88.5%).
| Occupation | Male | Female |
| Management | 29 (82.9%) | 6 (17.1%) |
| Business & Financial | 77 (72.0%) | 30 (28.0%) |
| Computers, Engineering & Science | 12 (100.0%) | 0 (0.0%) |
| Computers & Mathematics | 12 (100.0%) | 0 (0.0%) |
| Architecture & Engineering | 0 (0.0%) | 0 (0.0%) |
| Life, Physical & Social Science | 0 (0.0%) | 0 (0.0%) |
| Community & Social Service | 0 (0.0%) | 31 (100.0%) |
| Education, Arts & Media | 0 (0.0%) | 0 (0.0%) |
| Legal Services & Support | 0 (0.0%) | 0 (0.0%) |
| Education Instruction & Library | 0 (0.0%) | 31 (100.0%) |
| Arts, Media & Entertainment | 0 (0.0%) | 0 (0.0%) |
| Health Diagnosing & Treating | 6 (11.5%) | 46 (88.5%) |
| Health Technologists | 6 (26.1%) | 17 (73.9%) |
| Total (Category) | 124 (52.3%) | 113 (47.7%) |
| Total (Overall) | 1,122 (66.1%) | 576 (33.9%) |
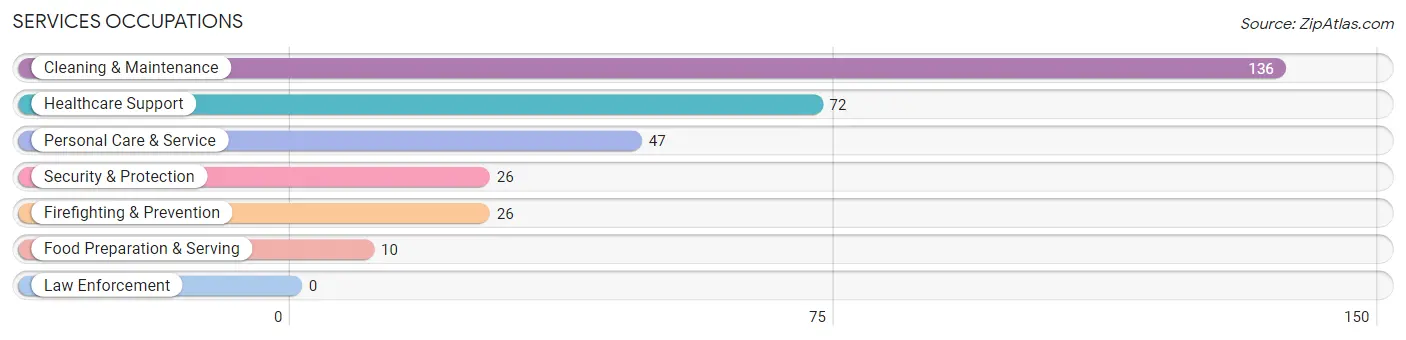
Services Occupations
The most common Services occupations in Canyon Creek are Cleaning & Maintenance (136 | 8.0%), Healthcare Support (72 | 4.2%), Personal Care & Service (47 | 2.8%), Security & Protection (26 | 1.5%), and Firefighting & Prevention (26 | 1.5%).
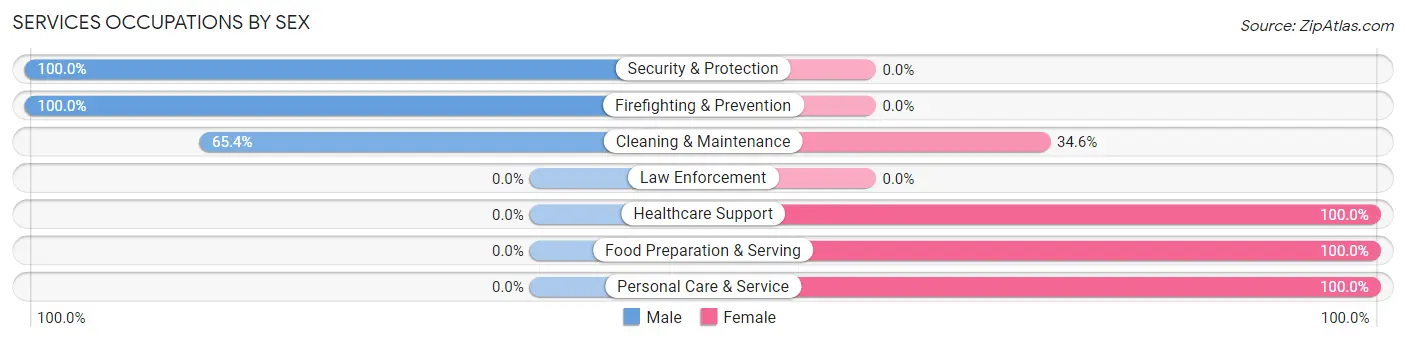
Services Occupations by Sex
Within the Services occupations in Canyon Creek, the most male-oriented occupations are Security & Protection (100.0%), Firefighting & Prevention (100.0%), and Cleaning & Maintenance (65.4%), while the most female-oriented occupations are Healthcare Support (100.0%), Food Preparation & Serving (100.0%), and Personal Care & Service (100.0%).
| Occupation | Male | Female |
| Healthcare Support | 0 (0.0%) | 72 (100.0%) |
| Security & Protection | 26 (100.0%) | 0 (0.0%) |
| Firefighting & Prevention | 26 (100.0%) | 0 (0.0%) |
| Law Enforcement | 0 (0.0%) | 0 (0.0%) |
| Food Preparation & Serving | 0 (0.0%) | 10 (100.0%) |
| Cleaning & Maintenance | 89 (65.4%) | 47 (34.6%) |
| Personal Care & Service | 0 (0.0%) | 47 (100.0%) |
| Total (Category) | 115 (39.5%) | 176 (60.5%) |
| Total (Overall) | 1,122 (66.1%) | 576 (33.9%) |
Sales and Office Occupations
The most common Sales and Office occupations in Canyon Creek are Sales & Related (178 | 10.5%), and Office & Administration (143 | 8.4%).
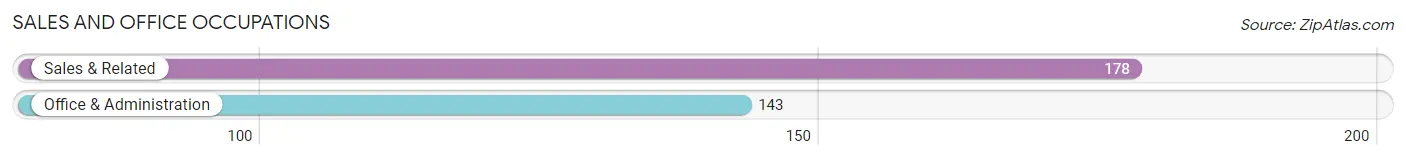
Sales and Office Occupations by Sex
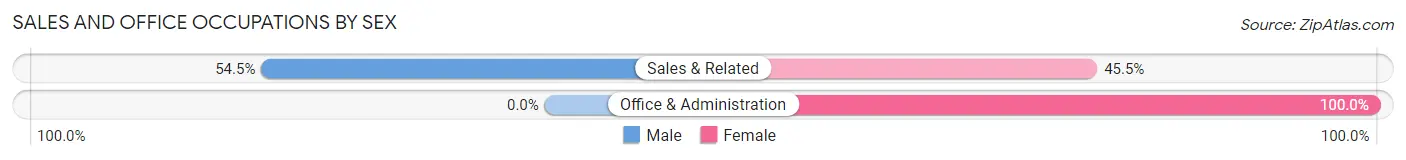
| Occupation | Male | Female |
| Sales & Related | 97 (54.5%) | 81 (45.5%) |
| Office & Administration | 0 (0.0%) | 143 (100.0%) |
| Total (Category) | 97 (30.2%) | 224 (69.8%) |
| Total (Overall) | 1,122 (66.1%) | 576 (33.9%) |
Natural Resources, Construction and Maintenance Occupations
The most common Natural Resources, Construction and Maintenance occupations in Canyon Creek are Construction & Extraction (216 | 12.7%), and Installation, Maintenance & Repair (163 | 9.6%).
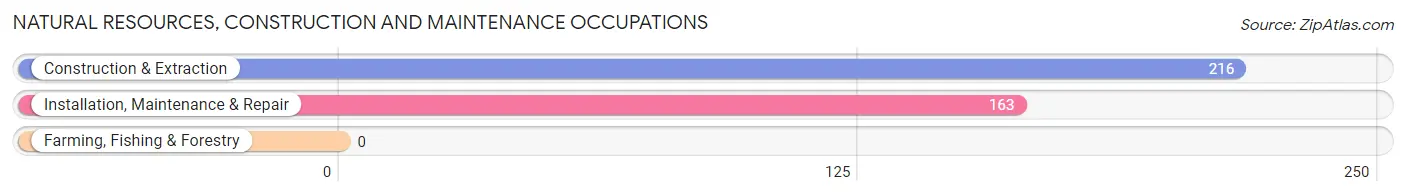
Natural Resources, Construction and Maintenance Occupations by Sex
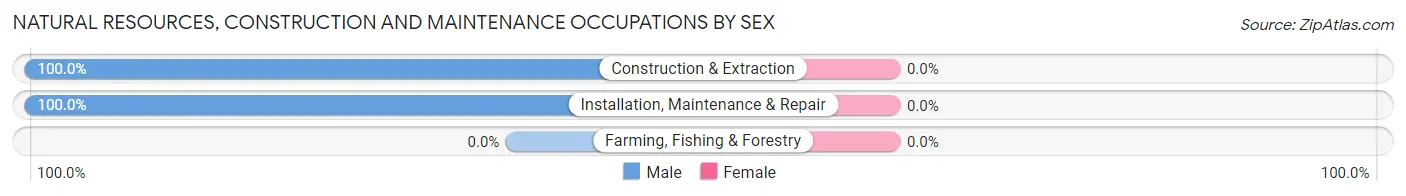
| Occupation | Male | Female |
| Farming, Fishing & Forestry | 0 (0.0%) | 0 (0.0%) |
| Construction & Extraction | 216 (100.0%) | 0 (0.0%) |
| Installation, Maintenance & Repair | 163 (100.0%) | 0 (0.0%) |
| Total (Category) | 379 (100.0%) | 0 (0.0%) |
| Total (Overall) | 1,122 (66.1%) | 576 (33.9%) |
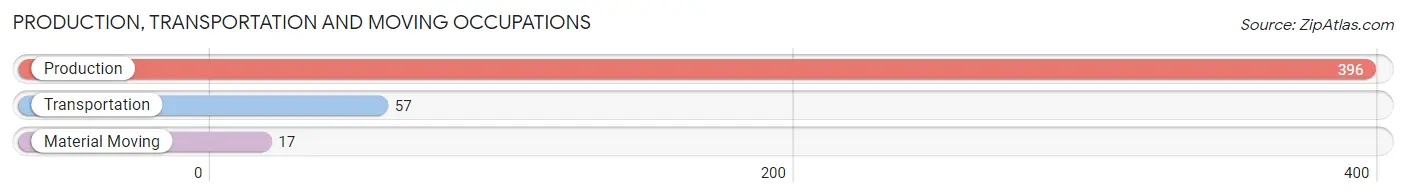
Production, Transportation and Moving Occupations
The most common Production, Transportation and Moving occupations in Canyon Creek are Production (396 | 23.3%), Transportation (57 | 3.4%), and Material Moving (17 | 1.0%).
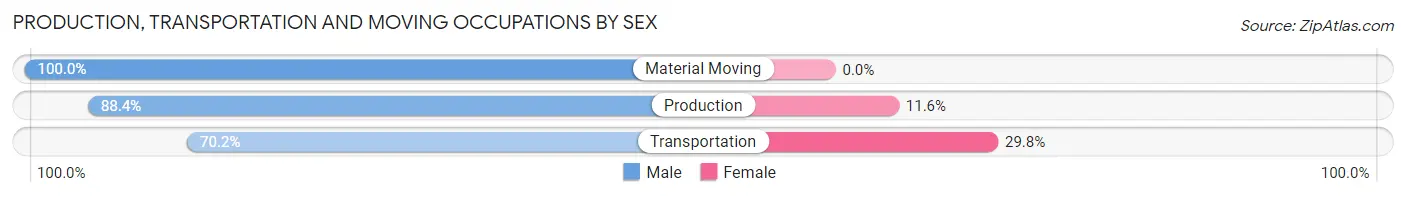
Production, Transportation and Moving Occupations by Sex
| Occupation | Male | Female |
| Production | 350 (88.4%) | 46 (11.6%) |
| Transportation | 40 (70.2%) | 17 (29.8%) |
| Material Moving | 17 (100.0%) | 0 (0.0%) |
| Total (Category) | 407 (86.6%) | 63 (13.4%) |
| Total (Overall) | 1,122 (66.1%) | 576 (33.9%) |
Employment Industries by Sex in Canyon Creek
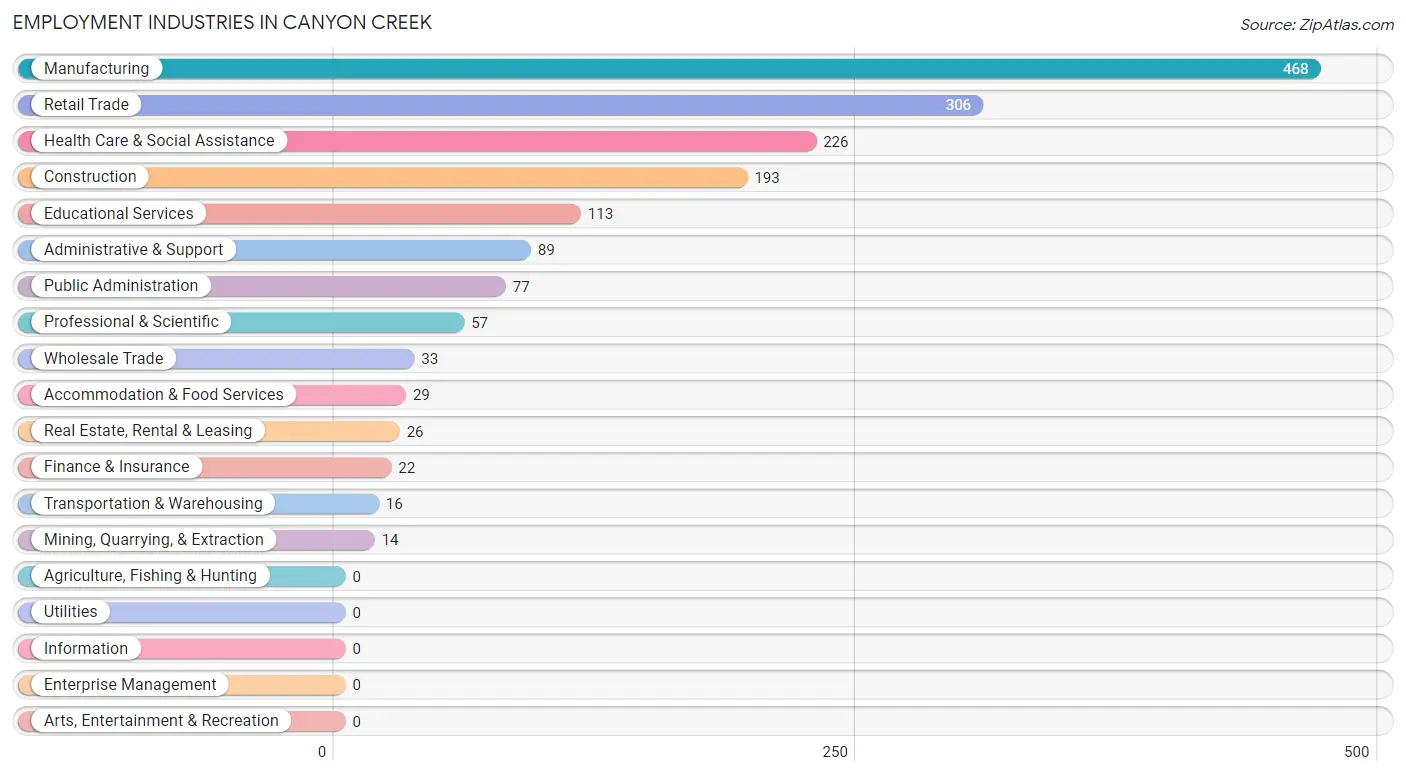
Employment Industries in Canyon Creek
The major employment industries in Canyon Creek include Manufacturing (468 | 27.6%), Retail Trade (306 | 18.0%), Health Care & Social Assistance (226 | 13.3%), Construction (193 | 11.4%), and Educational Services (113 | 6.7%).
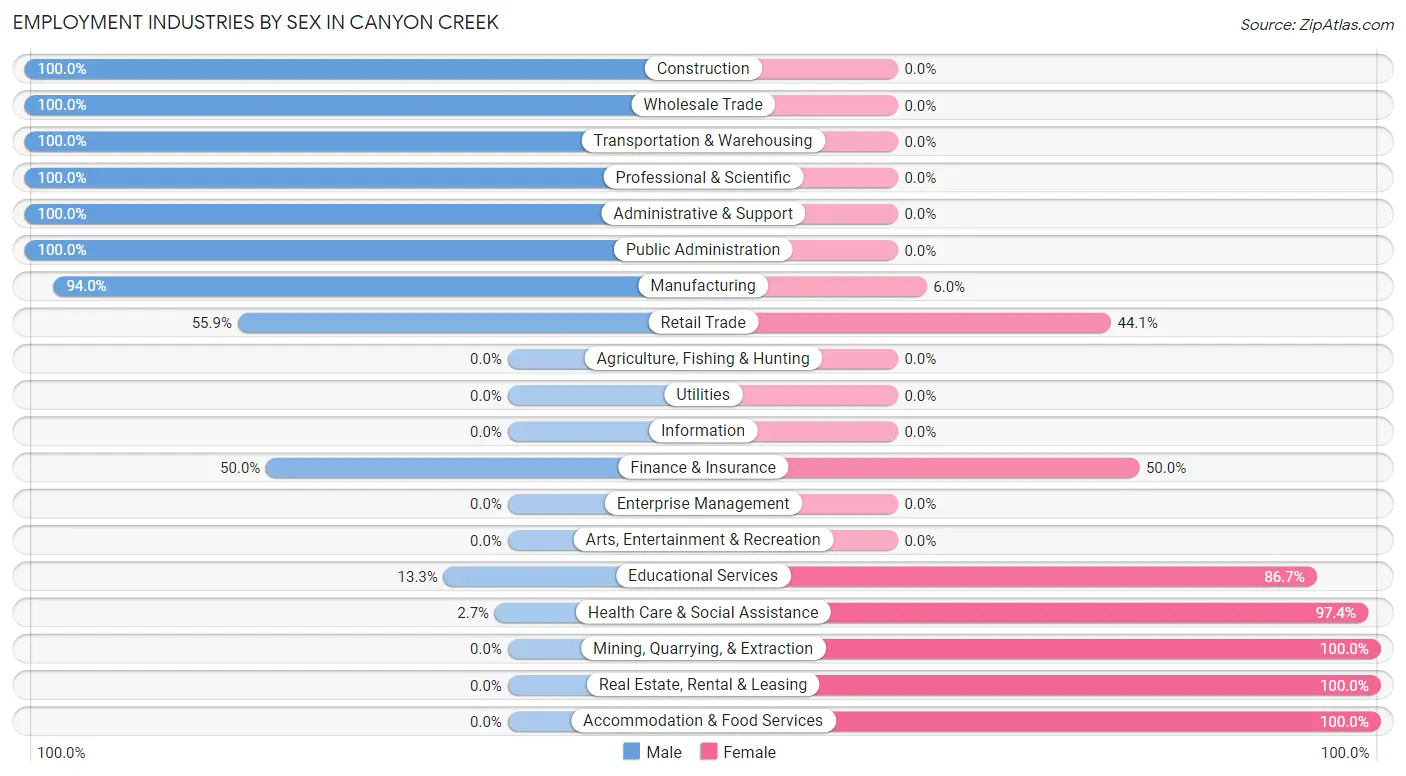
Employment Industries by Sex in Canyon Creek
The Canyon Creek industries that see more men than women are Construction (100.0%), Wholesale Trade (100.0%), and Transportation & Warehousing (100.0%), whereas the industries that tend to have a higher number of women are Mining, Quarrying, & Extraction (100.0%), Real Estate, Rental & Leasing (100.0%), and Accommodation & Food Services (100.0%).
| Industry | Male | Female |
| Agriculture, Fishing & Hunting | 0 (0.0%) | 0 (0.0%) |
| Mining, Quarrying, & Extraction | 0 (0.0%) | 14 (100.0%) |
| Construction | 193 (100.0%) | 0 (0.0%) |
| Manufacturing | 440 (94.0%) | 28 (6.0%) |
| Wholesale Trade | 33 (100.0%) | 0 (0.0%) |
| Retail Trade | 171 (55.9%) | 135 (44.1%) |
| Transportation & Warehousing | 16 (100.0%) | 0 (0.0%) |
| Utilities | 0 (0.0%) | 0 (0.0%) |
| Information | 0 (0.0%) | 0 (0.0%) |
| Finance & Insurance | 11 (50.0%) | 11 (50.0%) |
| Real Estate, Rental & Leasing | 0 (0.0%) | 26 (100.0%) |
| Professional & Scientific | 57 (100.0%) | 0 (0.0%) |
| Enterprise Management | 0 (0.0%) | 0 (0.0%) |
| Administrative & Support | 89 (100.0%) | 0 (0.0%) |
| Educational Services | 15 (13.3%) | 98 (86.7%) |
| Health Care & Social Assistance | 6 (2.6%) | 220 (97.4%) |
| Arts, Entertainment & Recreation | 0 (0.0%) | 0 (0.0%) |
| Accommodation & Food Services | 0 (0.0%) | 29 (100.0%) |
| Public Administration | 77 (100.0%) | 0 (0.0%) |
| Total | 1,122 (66.1%) | 576 (33.9%) |
Education in Canyon Creek
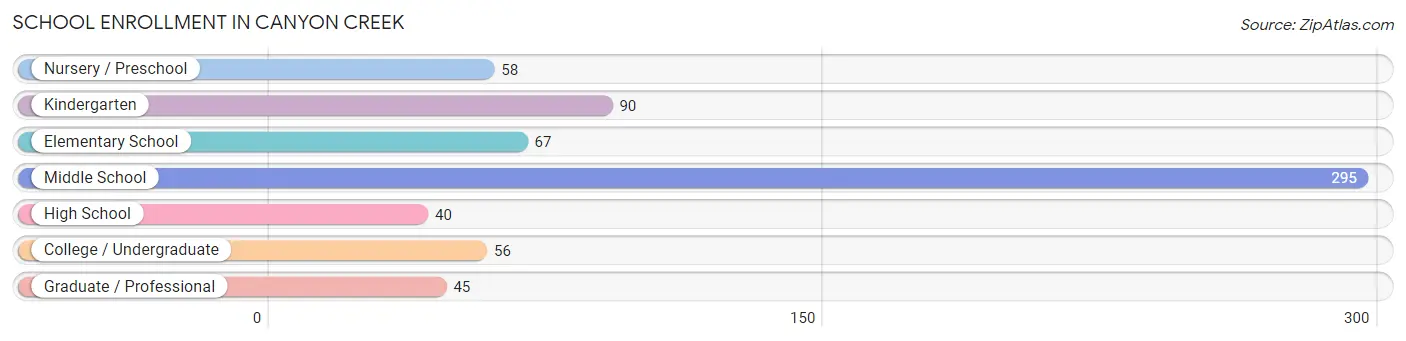
School Enrollment in Canyon Creek
The most common levels of schooling among the 651 students in Canyon Creek are middle school (295 | 45.3%), kindergarten (90 | 13.8%), and elementary school (67 | 10.3%).
| School Level | # Students | % Students |
| Nursery / Preschool | 58 | 8.9% |
| Kindergarten | 90 | 13.8% |
| Elementary School | 67 | 10.3% |
| Middle School | 295 | 45.3% |
| High School | 40 | 6.1% |
| College / Undergraduate | 56 | 8.6% |
| Graduate / Professional | 45 | 6.9% |
| Total | 651 | 100.0% |
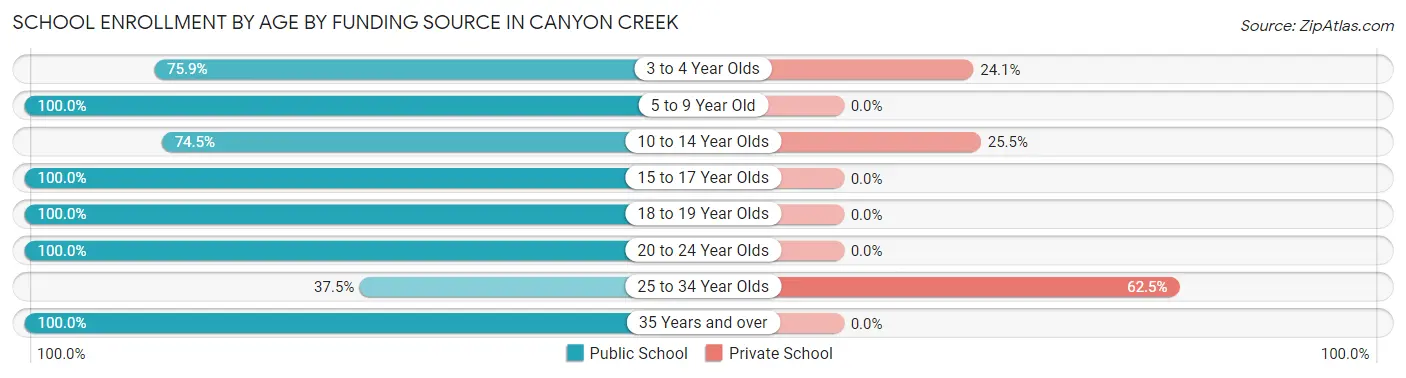
School Enrollment by Age by Funding Source in Canyon Creek
Out of a total of 651 students who are enrolled in schools in Canyon Creek, 86 (13.2%) attend a private institution, while the remaining 565 (86.8%) are enrolled in public schools. The age group of 25 to 34 year olds has the highest likelihood of being enrolled in private schools, with 25 (62.5% in the age bracket) enrolled. Conversely, the age group of 5 to 9 year old has the lowest likelihood of being enrolled in a private school, with 205 (100.0% in the age bracket) attending a public institution.
| Age Bracket | Public School | Private School |
| 3 to 4 Year Olds | 44 (75.9%) | 14 (24.1%) |
| 5 to 9 Year Old | 205 (100.0%) | 0 (0.0%) |
| 10 to 14 Year Olds | 137 (74.5%) | 47 (25.5%) |
| 15 to 17 Year Olds | 97 (100.0%) | 0 (0.0%) |
| 18 to 19 Year Olds | 16 (100.0%) | 0 (0.0%) |
| 20 to 24 Year Olds | 18 (100.0%) | 0 (0.0%) |
| 25 to 34 Year Olds | 15 (37.5%) | 25 (62.5%) |
| 35 Years and over | 33 (100.0%) | 0 (0.0%) |
| Total | 565 (86.8%) | 86 (13.2%) |
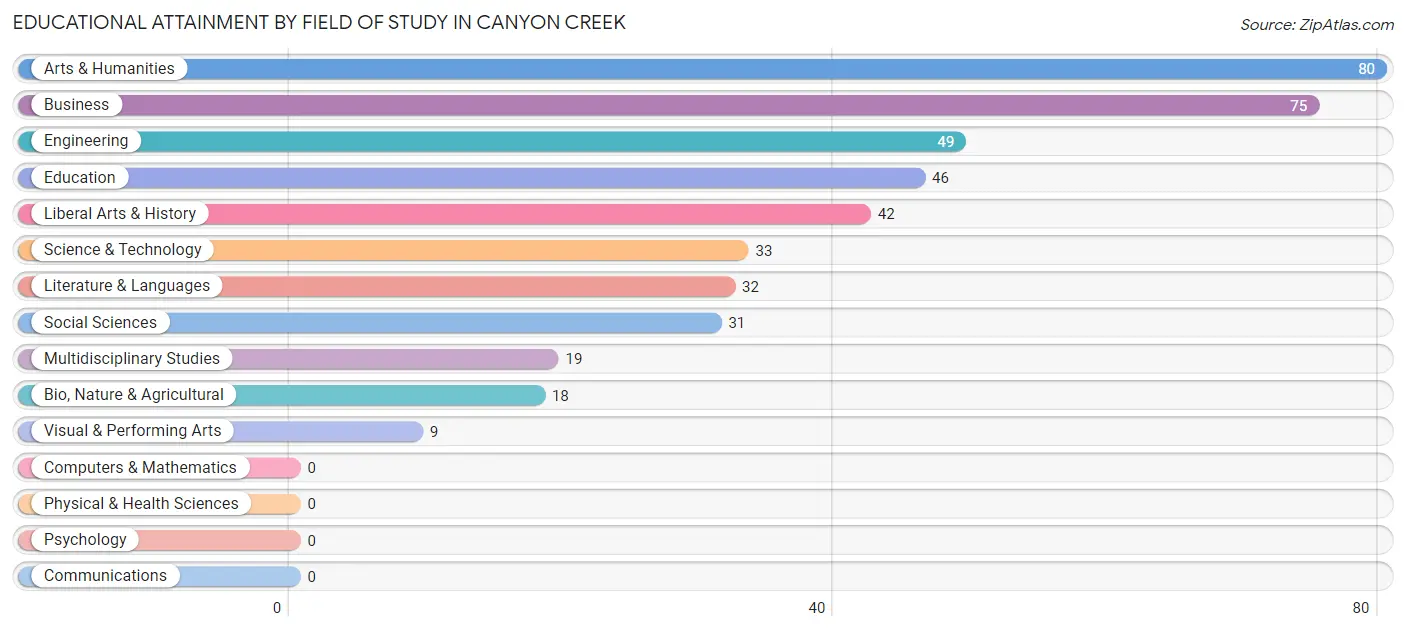
Educational Attainment by Field of Study in Canyon Creek
Arts & humanities (80 | 18.4%), business (75 | 17.3%), engineering (49 | 11.3%), education (46 | 10.6%), and liberal arts & history (42 | 9.7%) are the most common fields of study among 434 individuals in Canyon Creek who have obtained a bachelor's degree or higher.
| Field of Study | # Graduates | % Graduates |
| Computers & Mathematics | 0 | 0.0% |
| Bio, Nature & Agricultural | 18 | 4.2% |
| Physical & Health Sciences | 0 | 0.0% |
| Psychology | 0 | 0.0% |
| Social Sciences | 31 | 7.1% |
| Engineering | 49 | 11.3% |
| Multidisciplinary Studies | 19 | 4.4% |
| Science & Technology | 33 | 7.6% |
| Business | 75 | 17.3% |
| Education | 46 | 10.6% |
| Literature & Languages | 32 | 7.4% |
| Liberal Arts & History | 42 | 9.7% |
| Visual & Performing Arts | 9 | 2.1% |
| Communications | 0 | 0.0% |
| Arts & Humanities | 80 | 18.4% |
| Total | 434 | 100.0% |
Transportation & Commute in Canyon Creek
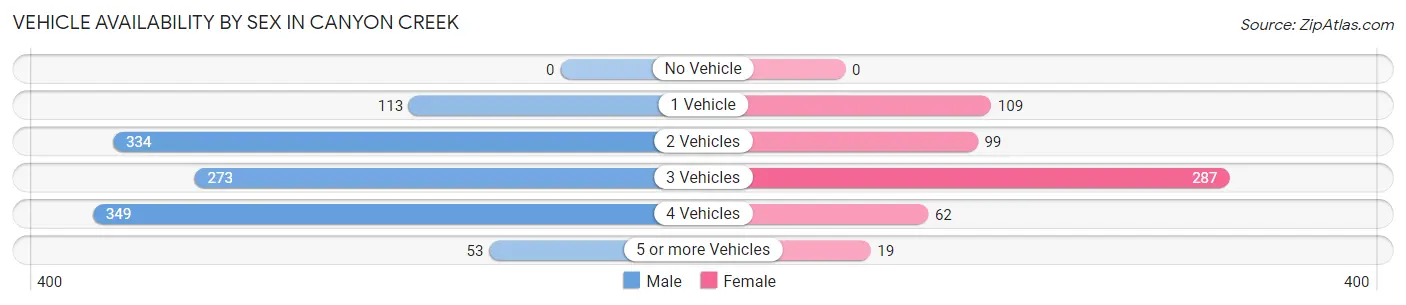
Vehicle Availability by Sex in Canyon Creek
The most prevalent vehicle ownership categories in Canyon Creek are males with 4 vehicles (349, accounting for 31.1%) and females with 4 vehicles (62, making up 60.6%).
| Vehicles Available | Male | Female |
| No Vehicle | 0 (0.0%) | 0 (0.0%) |
| 1 Vehicle | 113 (10.1%) | 109 (18.9%) |
| 2 Vehicles | 334 (29.8%) | 99 (17.2%) |
| 3 Vehicles | 273 (24.3%) | 287 (49.8%) |
| 4 Vehicles | 349 (31.1%) | 62 (10.8%) |
| 5 or more Vehicles | 53 (4.7%) | 19 (3.3%) |
| Total | 1,122 (100.0%) | 576 (100.0%) |
Commute Time in Canyon Creek
The most frequently occuring commute durations in Canyon Creek are 30 to 34 minutes (454 commuters, 28.5%), 45 to 59 minutes (246 commuters, 15.5%), and 60 to 89 minutes (236 commuters, 14.8%).
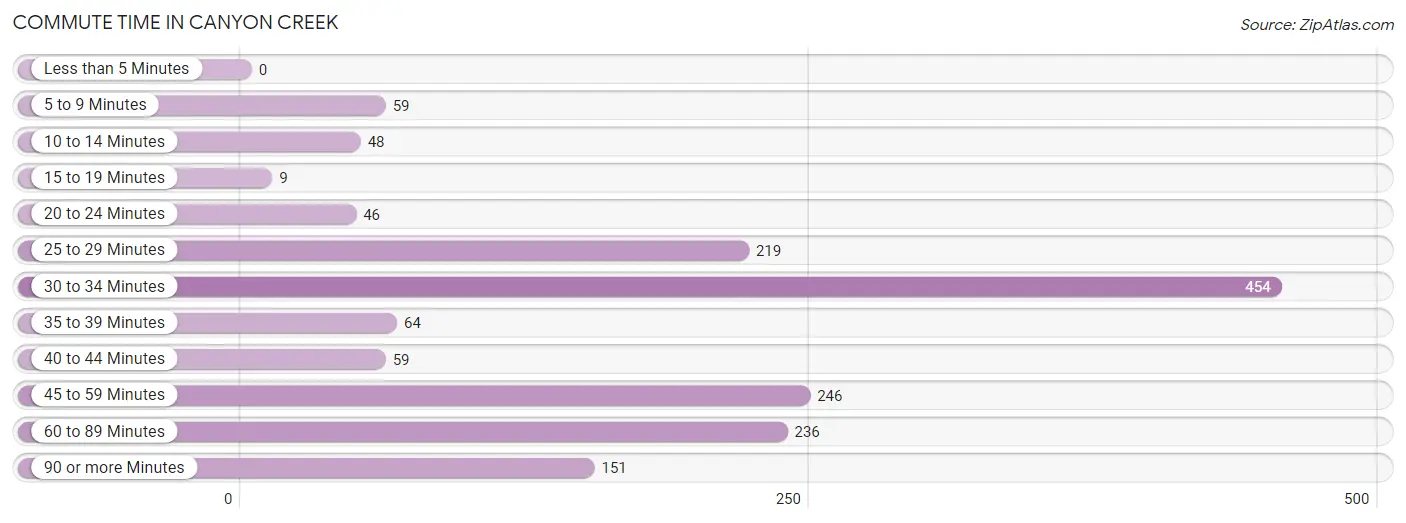
| Commute Time | # Commuters | % Commuters |
| Less than 5 Minutes | 0 | 0.0% |
| 5 to 9 Minutes | 59 | 3.7% |
| 10 to 14 Minutes | 48 | 3.0% |
| 15 to 19 Minutes | 9 | 0.6% |
| 20 to 24 Minutes | 46 | 2.9% |
| 25 to 29 Minutes | 219 | 13.8% |
| 30 to 34 Minutes | 454 | 28.5% |
| 35 to 39 Minutes | 64 | 4.0% |
| 40 to 44 Minutes | 59 | 3.7% |
| 45 to 59 Minutes | 246 | 15.5% |
| 60 to 89 Minutes | 236 | 14.8% |
| 90 or more Minutes | 151 | 9.5% |
Commute Time by Sex in Canyon Creek
The most common commute times in Canyon Creek are 30 to 34 minutes (370 commuters, 34.4%) for males and 60 to 89 minutes (104 commuters, 20.2%) for females.
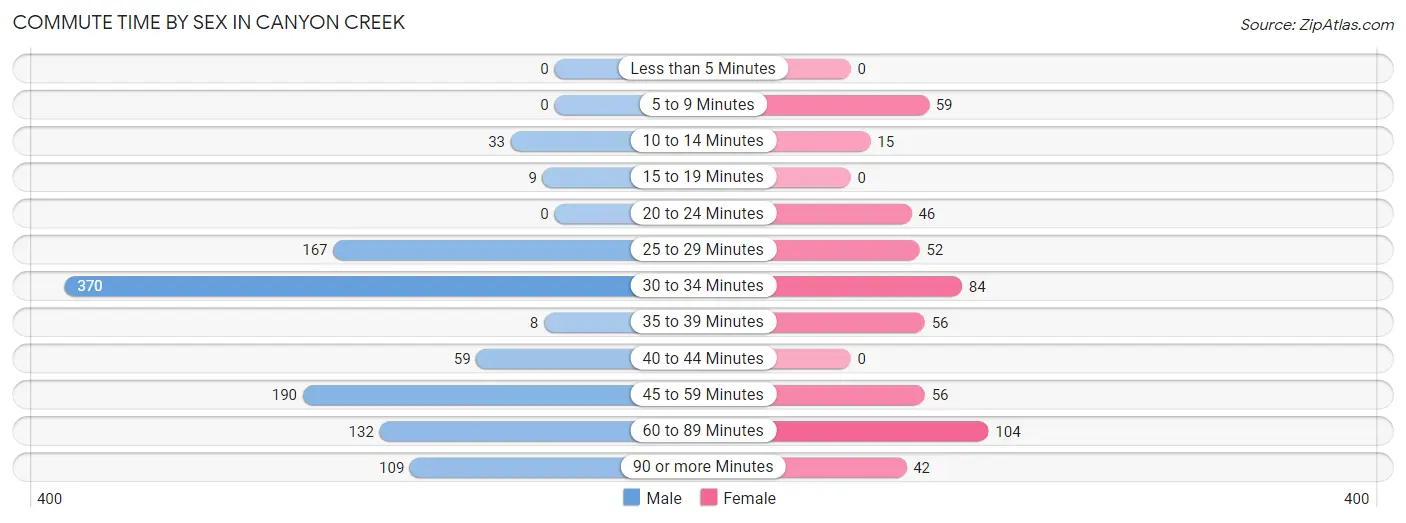
| Commute Time | Male | Female |
| Less than 5 Minutes | 0 (0.0%) | 0 (0.0%) |
| 5 to 9 Minutes | 0 (0.0%) | 59 (11.5%) |
| 10 to 14 Minutes | 33 (3.1%) | 15 (2.9%) |
| 15 to 19 Minutes | 9 (0.8%) | 0 (0.0%) |
| 20 to 24 Minutes | 0 (0.0%) | 46 (8.9%) |
| 25 to 29 Minutes | 167 (15.5%) | 52 (10.1%) |
| 30 to 34 Minutes | 370 (34.4%) | 84 (16.3%) |
| 35 to 39 Minutes | 8 (0.7%) | 56 (10.9%) |
| 40 to 44 Minutes | 59 (5.5%) | 0 (0.0%) |
| 45 to 59 Minutes | 190 (17.6%) | 56 (10.9%) |
| 60 to 89 Minutes | 132 (12.3%) | 104 (20.2%) |
| 90 or more Minutes | 109 (10.1%) | 42 (8.2%) |
Time of Departure to Work by Sex in Canyon Creek
The most frequent times of departure to work in Canyon Creek are 12:00 AM to 4:59 AM (327, 30.4%) for males and 6:30 AM to 6:59 AM (116, 22.6%) for females.
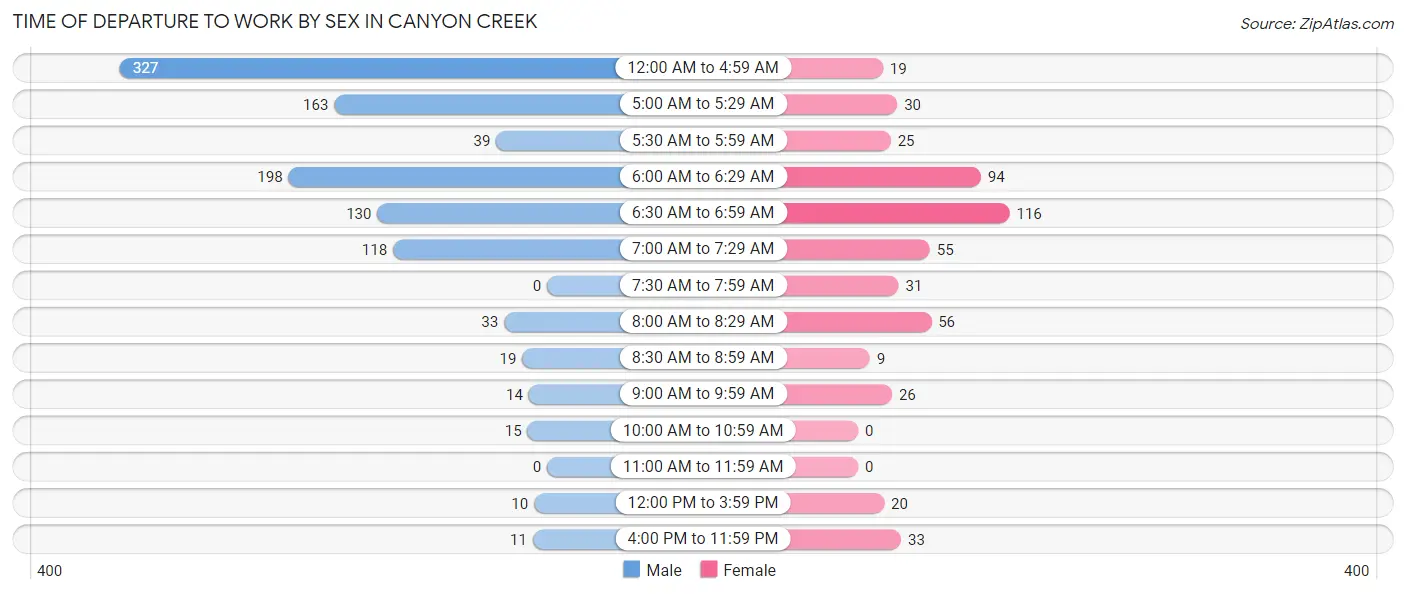
| Time of Departure | Male | Female |
| 12:00 AM to 4:59 AM | 327 (30.4%) | 19 (3.7%) |
| 5:00 AM to 5:29 AM | 163 (15.1%) | 30 (5.8%) |
| 5:30 AM to 5:59 AM | 39 (3.6%) | 25 (4.9%) |
| 6:00 AM to 6:29 AM | 198 (18.4%) | 94 (18.3%) |
| 6:30 AM to 6:59 AM | 130 (12.1%) | 116 (22.6%) |
| 7:00 AM to 7:29 AM | 118 (11.0%) | 55 (10.7%) |
| 7:30 AM to 7:59 AM | 0 (0.0%) | 31 (6.0%) |
| 8:00 AM to 8:29 AM | 33 (3.1%) | 56 (10.9%) |
| 8:30 AM to 8:59 AM | 19 (1.8%) | 9 (1.8%) |
| 9:00 AM to 9:59 AM | 14 (1.3%) | 26 (5.1%) |
| 10:00 AM to 10:59 AM | 15 (1.4%) | 0 (0.0%) |
| 11:00 AM to 11:59 AM | 0 (0.0%) | 0 (0.0%) |
| 12:00 PM to 3:59 PM | 10 (0.9%) | 20 (3.9%) |
| 4:00 PM to 11:59 PM | 11 (1.0%) | 33 (6.4%) |
| Total | 1,077 (100.0%) | 514 (100.0%) |
Housing Occupancy in Canyon Creek
Occupancy by Ownership in Canyon Creek
Of the total 1,406 dwellings in Canyon Creek, owner-occupied units account for 1,170 (83.2%), while renter-occupied units make up 236 (16.8%).
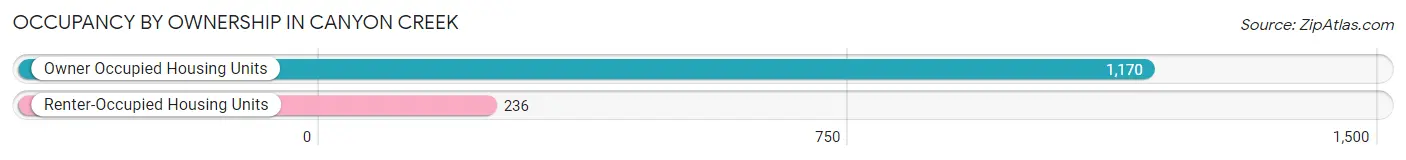
| Occupancy | # Housing Units | % Housing Units |
| Owner Occupied Housing Units | 1,170 | 83.2% |
| Renter-Occupied Housing Units | 236 | 16.8% |
| Total Occupied Housing Units | 1,406 | 100.0% |
Occupancy by Household Size in Canyon Creek
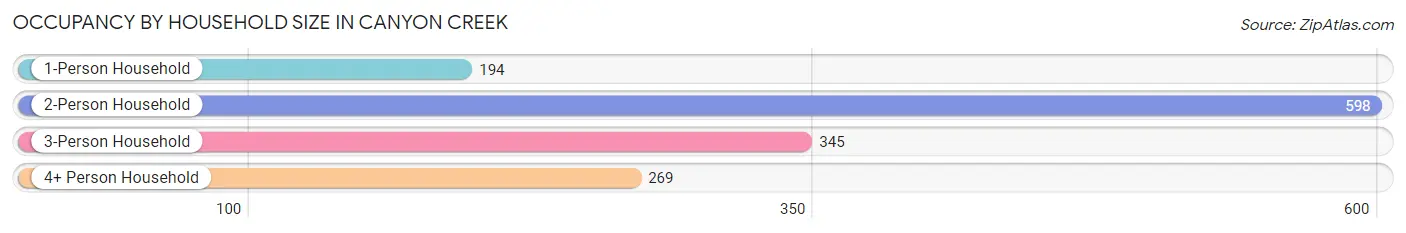
| Household Size | # Housing Units | % Housing Units |
| 1-Person Household | 194 | 13.8% |
| 2-Person Household | 598 | 42.5% |
| 3-Person Household | 345 | 24.5% |
| 4+ Person Household | 269 | 19.1% |
| Total Housing Units | 1,406 | 100.0% |
Occupancy by Ownership by Household Size in Canyon Creek
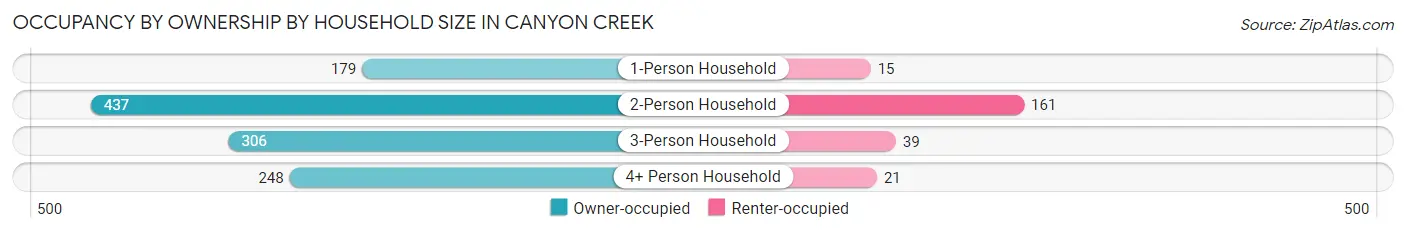
| Household Size | Owner-occupied | Renter-occupied |
| 1-Person Household | 179 (92.3%) | 15 (7.7%) |
| 2-Person Household | 437 (73.1%) | 161 (26.9%) |
| 3-Person Household | 306 (88.7%) | 39 (11.3%) |
| 4+ Person Household | 248 (92.2%) | 21 (7.8%) |
| Total Housing Units | 1,170 (83.2%) | 236 (16.8%) |
Occupancy by Educational Attainment in Canyon Creek
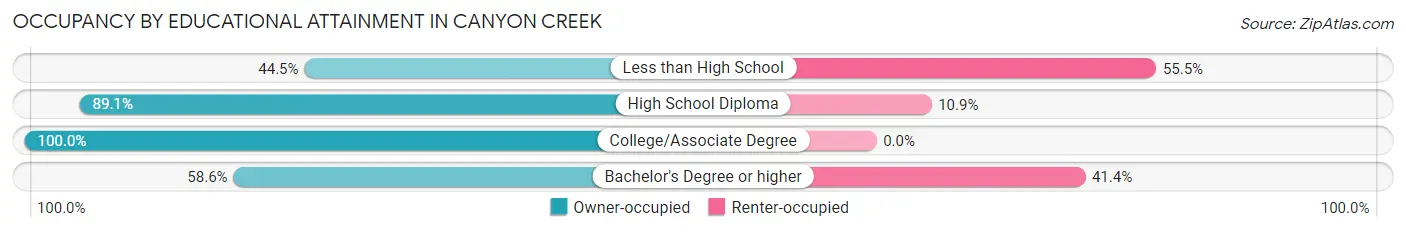
| Household Size | Owner-occupied | Renter-occupied |
| Less than High School | 57 (44.5%) | 71 (55.5%) |
| High School Diploma | 620 (89.1%) | 76 (10.9%) |
| College/Associate Degree | 367 (100.0%) | 0 (0.0%) |
| Bachelor's Degree or higher | 126 (58.6%) | 89 (41.4%) |
Occupancy by Age of Householder in Canyon Creek
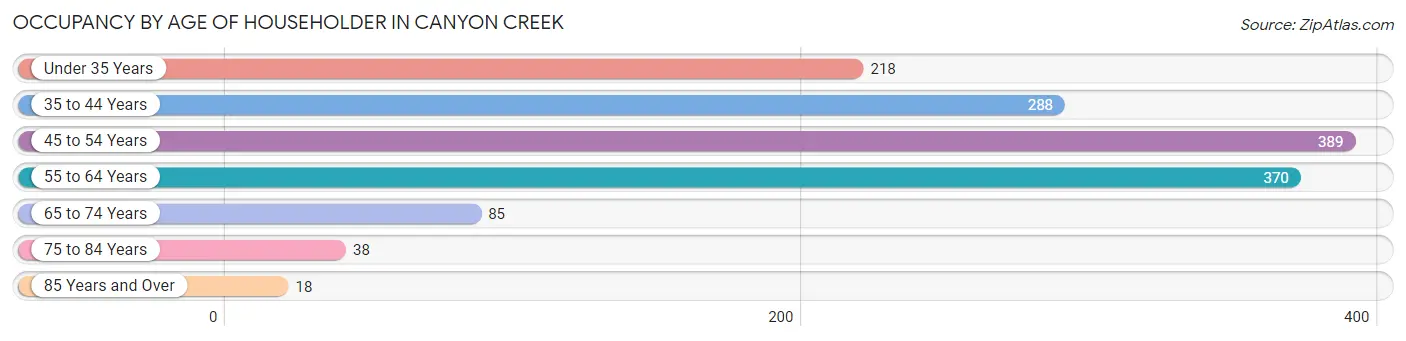
| Age Bracket | # Households | % Households |
| Under 35 Years | 218 | 15.5% |
| 35 to 44 Years | 288 | 20.5% |
| 45 to 54 Years | 389 | 27.7% |
| 55 to 64 Years | 370 | 26.3% |
| 65 to 74 Years | 85 | 6.0% |
| 75 to 84 Years | 38 | 2.7% |
| 85 Years and Over | 18 | 1.3% |
| Total | 1,406 | 100.0% |
Housing Finances in Canyon Creek
Median Income by Occupancy in Canyon Creek
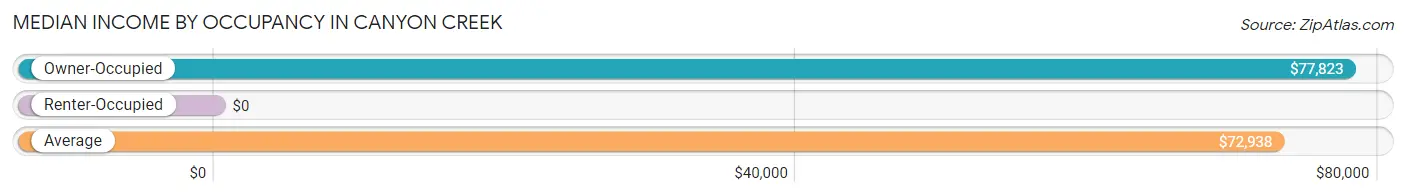
| Occupancy Type | # Households | Median Income |
| Owner-Occupied | 1,170 (83.2%) | $77,823 |
| Renter-Occupied | 236 (16.8%) | $0 |
| Average | 1,406 (100.0%) | $72,938 |
Occupancy by Householder Income Bracket in Canyon Creek
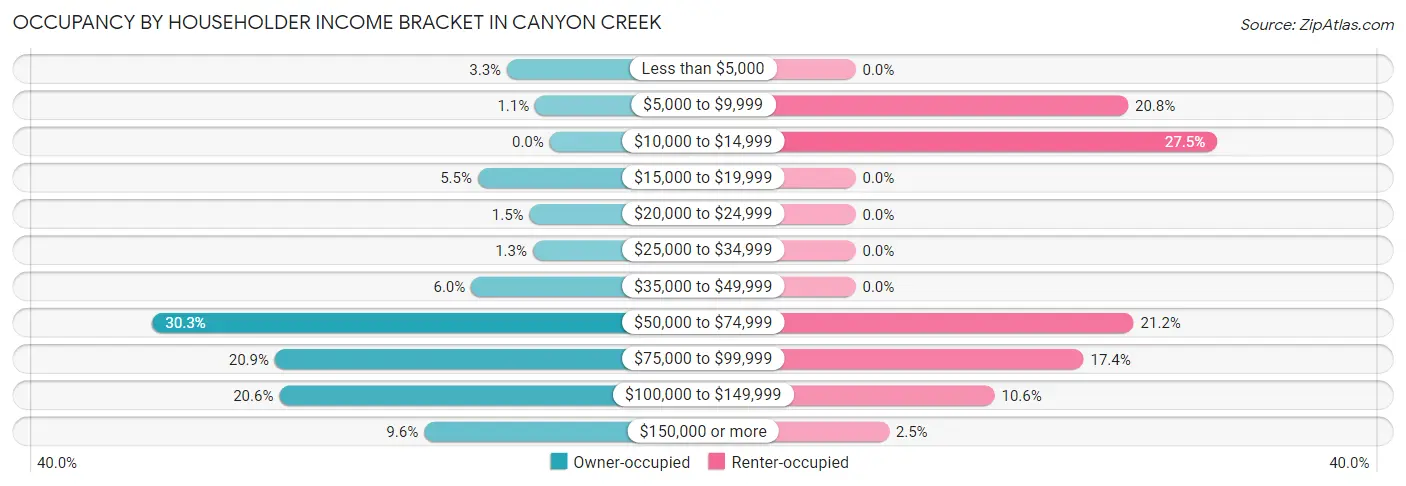
| Income Bracket | Owner-occupied | Renter-occupied |
| Less than $5,000 | 38 (3.3%) | 0 (0.0%) |
| $5,000 to $9,999 | 13 (1.1%) | 49 (20.8%) |
| $10,000 to $14,999 | 0 (0.0%) | 65 (27.5%) |
| $15,000 to $19,999 | 64 (5.5%) | 0 (0.0%) |
| $20,000 to $24,999 | 18 (1.5%) | 0 (0.0%) |
| $25,000 to $34,999 | 15 (1.3%) | 0 (0.0%) |
| $35,000 to $49,999 | 70 (6.0%) | 0 (0.0%) |
| $50,000 to $74,999 | 354 (30.3%) | 50 (21.2%) |
| $75,000 to $99,999 | 245 (20.9%) | 41 (17.4%) |
| $100,000 to $149,999 | 241 (20.6%) | 25 (10.6%) |
| $150,000 or more | 112 (9.6%) | 6 (2.5%) |
| Total | 1,170 (100.0%) | 236 (100.0%) |
Monthly Housing Cost Tiers in Canyon Creek
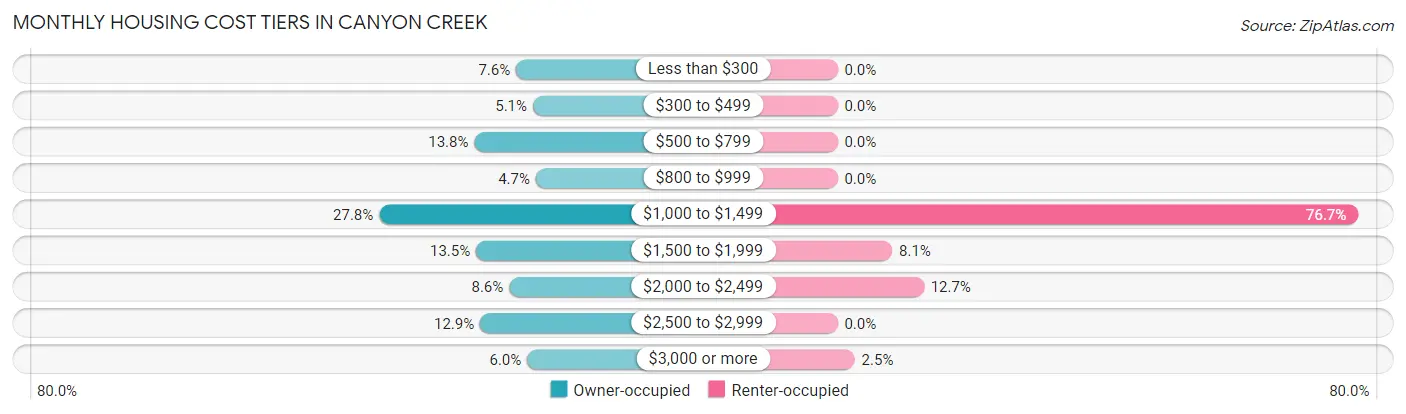
| Monthly Cost | Owner-occupied | Renter-occupied |
| Less than $300 | 89 (7.6%) | 0 (0.0%) |
| $300 to $499 | 60 (5.1%) | 0 (0.0%) |
| $500 to $799 | 161 (13.8%) | 0 (0.0%) |
| $800 to $999 | 55 (4.7%) | 0 (0.0%) |
| $1,000 to $1,499 | 325 (27.8%) | 181 (76.7%) |
| $1,500 to $1,999 | 158 (13.5%) | 19 (8.1%) |
| $2,000 to $2,499 | 101 (8.6%) | 30 (12.7%) |
| $2,500 to $2,999 | 151 (12.9%) | 0 (0.0%) |
| $3,000 or more | 70 (6.0%) | 6 (2.5%) |
| Total | 1,170 (100.0%) | 236 (100.0%) |
Physical Housing Characteristics in Canyon Creek
Housing Structures in Canyon Creek
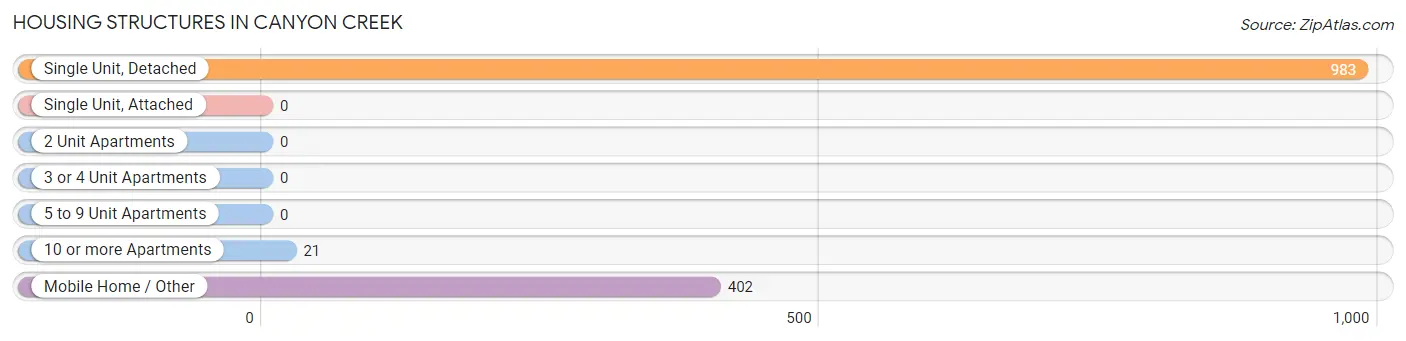
| Structure Type | # Housing Units | % Housing Units |
| Single Unit, Detached | 983 | 69.9% |
| Single Unit, Attached | 0 | 0.0% |
| 2 Unit Apartments | 0 | 0.0% |
| 3 or 4 Unit Apartments | 0 | 0.0% |
| 5 to 9 Unit Apartments | 0 | 0.0% |
| 10 or more Apartments | 21 | 1.5% |
| Mobile Home / Other | 402 | 28.6% |
| Total | 1,406 | 100.0% |
Housing Structures by Occupancy in Canyon Creek
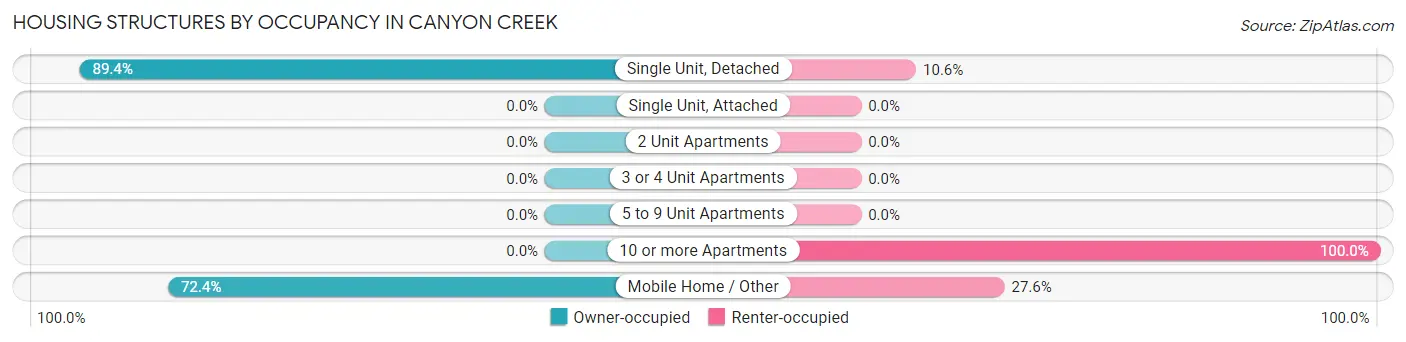
| Structure Type | Owner-occupied | Renter-occupied |
| Single Unit, Detached | 879 (89.4%) | 104 (10.6%) |
| Single Unit, Attached | 0 (0.0%) | 0 (0.0%) |
| 2 Unit Apartments | 0 (0.0%) | 0 (0.0%) |
| 3 or 4 Unit Apartments | 0 (0.0%) | 0 (0.0%) |
| 5 to 9 Unit Apartments | 0 (0.0%) | 0 (0.0%) |
| 10 or more Apartments | 0 (0.0%) | 21 (100.0%) |
| Mobile Home / Other | 291 (72.4%) | 111 (27.6%) |
| Total | 1,170 (83.2%) | 236 (16.8%) |
Housing Structures by Number of Rooms in Canyon Creek
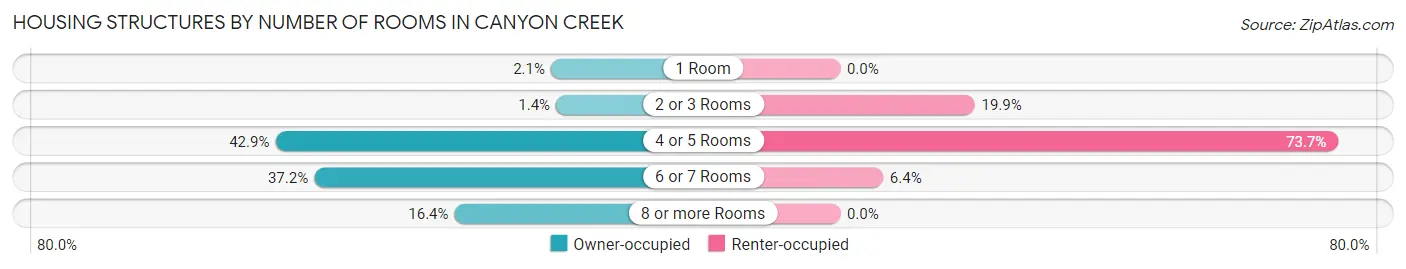
| Number of Rooms | Owner-occupied | Renter-occupied |
| 1 Room | 25 (2.1%) | 0 (0.0%) |
| 2 or 3 Rooms | 16 (1.4%) | 47 (19.9%) |
| 4 or 5 Rooms | 502 (42.9%) | 174 (73.7%) |
| 6 or 7 Rooms | 435 (37.2%) | 15 (6.4%) |
| 8 or more Rooms | 192 (16.4%) | 0 (0.0%) |
| Total | 1,170 (100.0%) | 236 (100.0%) |
Housing Structure by Heating Type in Canyon Creek
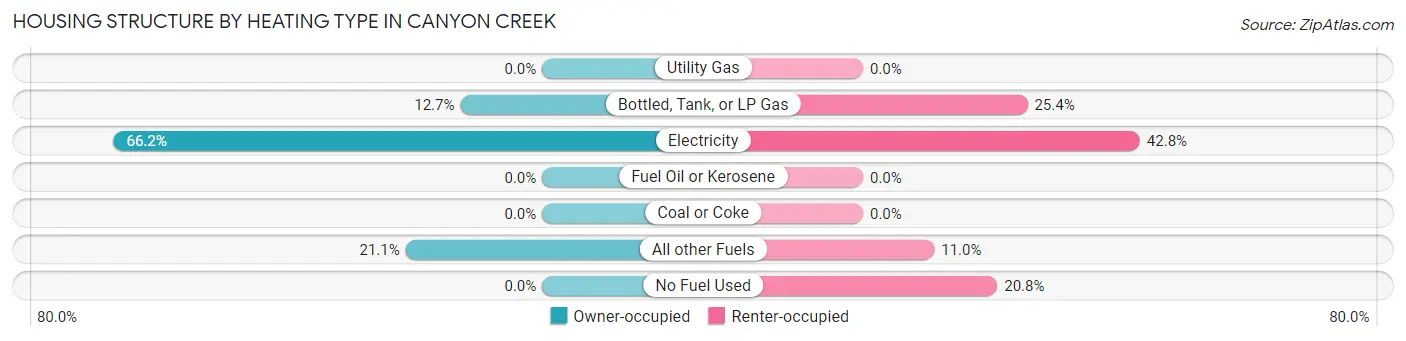
| Heating Type | Owner-occupied | Renter-occupied |
| Utility Gas | 0 (0.0%) | 0 (0.0%) |
| Bottled, Tank, or LP Gas | 148 (12.7%) | 60 (25.4%) |
| Electricity | 775 (66.2%) | 101 (42.8%) |
| Fuel Oil or Kerosene | 0 (0.0%) | 0 (0.0%) |
| Coal or Coke | 0 (0.0%) | 0 (0.0%) |
| All other Fuels | 247 (21.1%) | 26 (11.0%) |
| No Fuel Used | 0 (0.0%) | 49 (20.8%) |
| Total | 1,170 (100.0%) | 236 (100.0%) |
Household Vehicle Usage in Canyon Creek
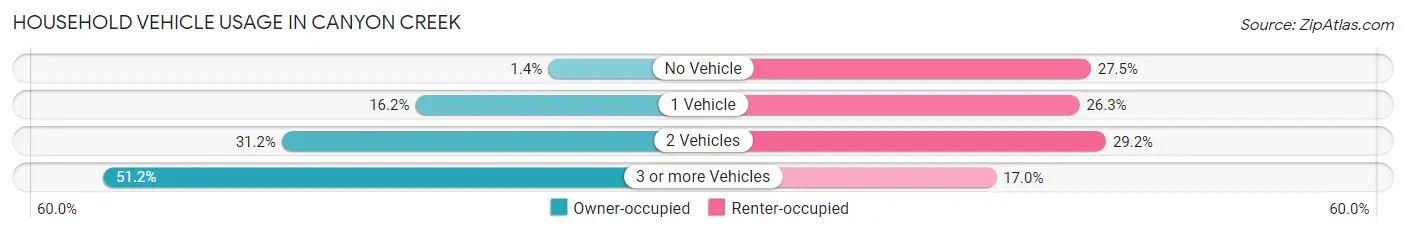
| Vehicles per Household | Owner-occupied | Renter-occupied |
| No Vehicle | 16 (1.4%) | 65 (27.5%) |
| 1 Vehicle | 190 (16.2%) | 62 (26.3%) |
| 2 Vehicles | 365 (31.2%) | 69 (29.2%) |
| 3 or more Vehicles | 599 (51.2%) | 40 (17.0%) |
| Total | 1,170 (100.0%) | 236 (100.0%) |
Real Estate & Mortgages in Canyon Creek
Real Estate and Mortgage Overview in Canyon Creek
| Characteristic | Without Mortgage | With Mortgage |
| Housing Units | 313 | 857 |
| Median Property Value | $309,800 | $367,600 |
| Median Household Income | $79,073 | $98 |
| Monthly Housing Costs | $655 | $70 |
| Real Estate Taxes | $3,585 | $11 |
Property Value by Mortgage Status in Canyon Creek
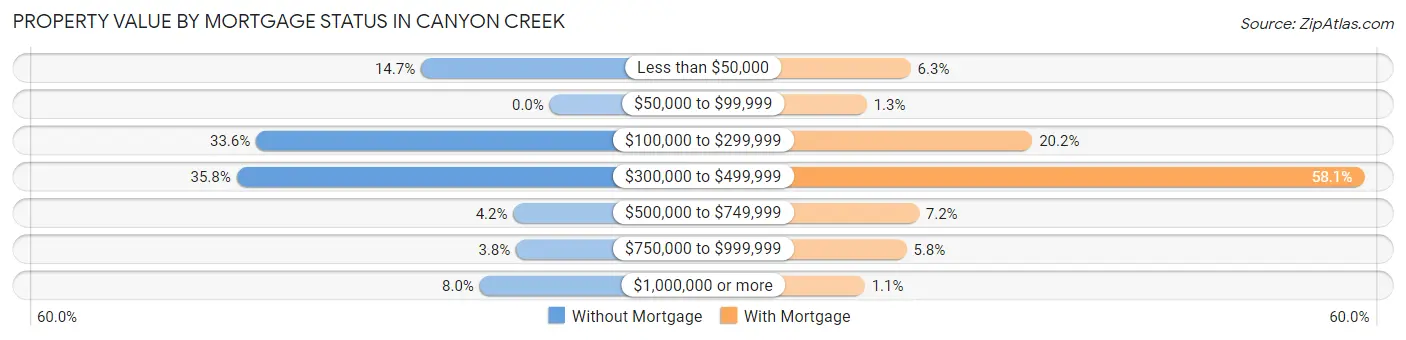
| Property Value | Without Mortgage | With Mortgage |
| Less than $50,000 | 46 (14.7%) | 54 (6.3%) |
| $50,000 to $99,999 | 0 (0.0%) | 11 (1.3%) |
| $100,000 to $299,999 | 105 (33.6%) | 173 (20.2%) |
| $300,000 to $499,999 | 112 (35.8%) | 498 (58.1%) |
| $500,000 to $749,999 | 13 (4.2%) | 62 (7.2%) |
| $750,000 to $999,999 | 12 (3.8%) | 50 (5.8%) |
| $1,000,000 or more | 25 (8.0%) | 9 (1.1%) |
| Total | 313 (100.0%) | 857 (100.0%) |
Household Income by Mortgage Status in Canyon Creek
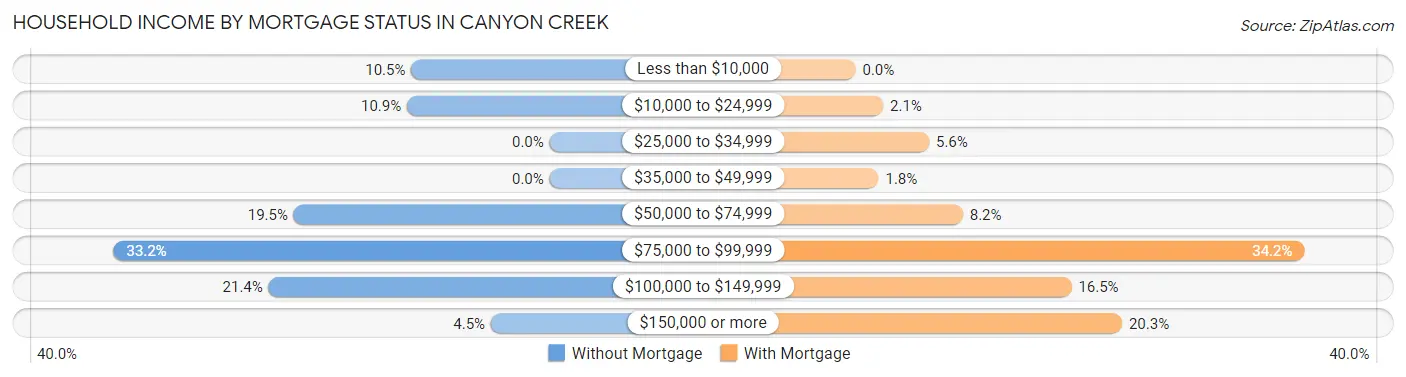
| Household Income | Without Mortgage | With Mortgage |
| Less than $10,000 | 33 (10.5%) | 0 (0.0%) |
| $10,000 to $24,999 | 34 (10.9%) | 18 (2.1%) |
| $25,000 to $34,999 | 0 (0.0%) | 48 (5.6%) |
| $35,000 to $49,999 | 0 (0.0%) | 15 (1.8%) |
| $50,000 to $74,999 | 61 (19.5%) | 70 (8.2%) |
| $75,000 to $99,999 | 104 (33.2%) | 293 (34.2%) |
| $100,000 to $149,999 | 67 (21.4%) | 141 (16.5%) |
| $150,000 or more | 14 (4.5%) | 174 (20.3%) |
| Total | 313 (100.0%) | 857 (100.0%) |
Property Value to Household Income Ratio in Canyon Creek
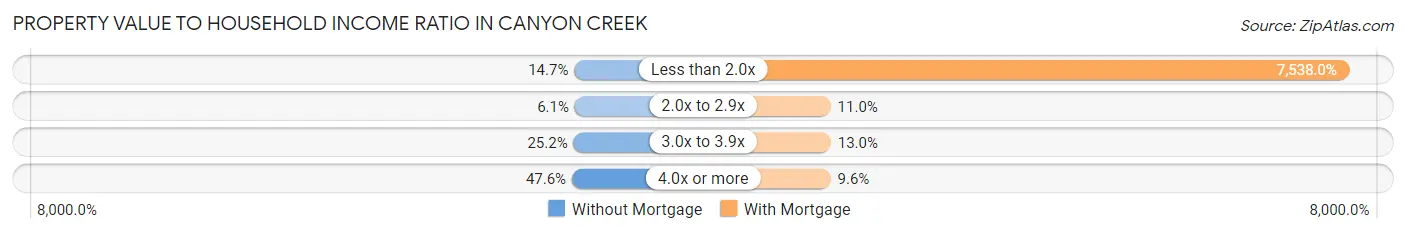
| Value-to-Income Ratio | Without Mortgage | With Mortgage |
| Less than 2.0x | 46 (14.7%) | 64,601 (7,538.0%) |
| 2.0x to 2.9x | 19 (6.1%) | 94 (11.0%) |
| 3.0x to 3.9x | 79 (25.2%) | 111 (13.0%) |
| 4.0x or more | 149 (47.6%) | 82 (9.6%) |
| Total | 313 (100.0%) | 857 (100.0%) |
Real Estate Taxes by Mortgage Status in Canyon Creek
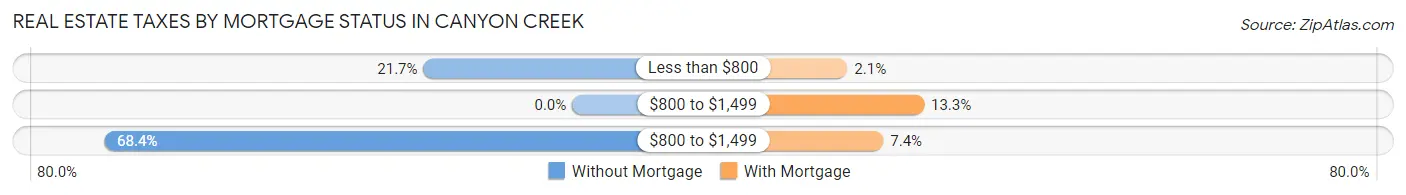
| Property Taxes | Without Mortgage | With Mortgage |
| Less than $800 | 68 (21.7%) | 18 (2.1%) |
| $800 to $1,499 | 0 (0.0%) | 114 (13.3%) |
| $800 to $1,499 | 214 (68.4%) | 63 (7.3%) |
| Total | 313 (100.0%) | 857 (100.0%) |
Health & Disability in Canyon Creek
Health Insurance Coverage by Age in Canyon Creek
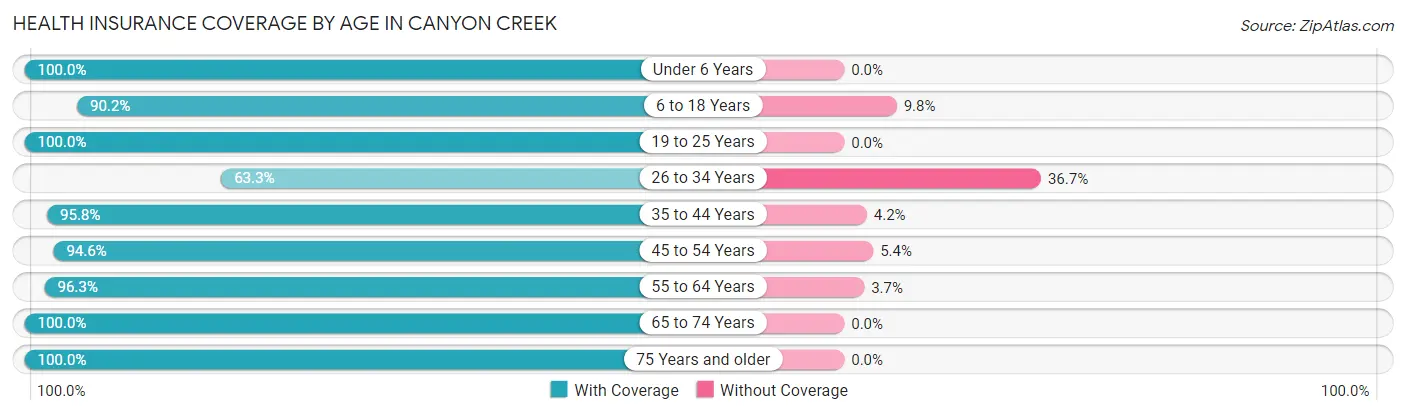
| Age Bracket | With Coverage | Without Coverage |
| Under 6 Years | 268 (100.0%) | 0 (0.0%) |
| 6 to 18 Years | 443 (90.2%) | 48 (9.8%) |
| 19 to 25 Years | 317 (100.0%) | 0 (0.0%) |
| 26 to 34 Years | 397 (63.3%) | 230 (36.7%) |
| 35 to 44 Years | 342 (95.8%) | 15 (4.2%) |
| 45 to 54 Years | 614 (94.6%) | 35 (5.4%) |
| 55 to 64 Years | 595 (96.3%) | 23 (3.7%) |
| 65 to 74 Years | 136 (100.0%) | 0 (0.0%) |
| 75 Years and older | 85 (100.0%) | 0 (0.0%) |
| Total | 3,197 (90.1%) | 351 (9.9%) |
Health Insurance Coverage by Citizenship Status in Canyon Creek
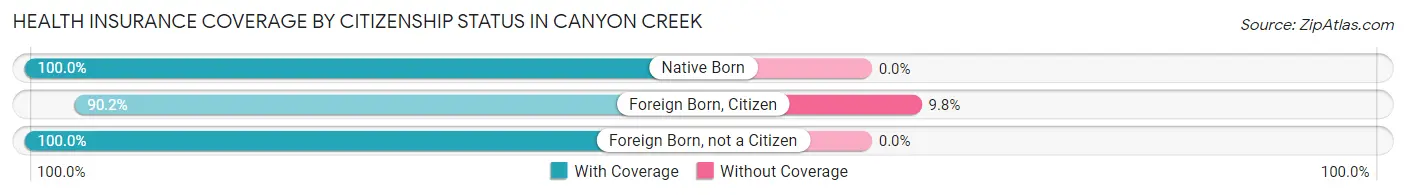
| Citizenship Status | With Coverage | Without Coverage |
| Native Born | 268 (100.0%) | 0 (0.0%) |
| Foreign Born, Citizen | 443 (90.2%) | 48 (9.8%) |
| Foreign Born, not a Citizen | 317 (100.0%) | 0 (0.0%) |
Health Insurance Coverage by Household Income in Canyon Creek
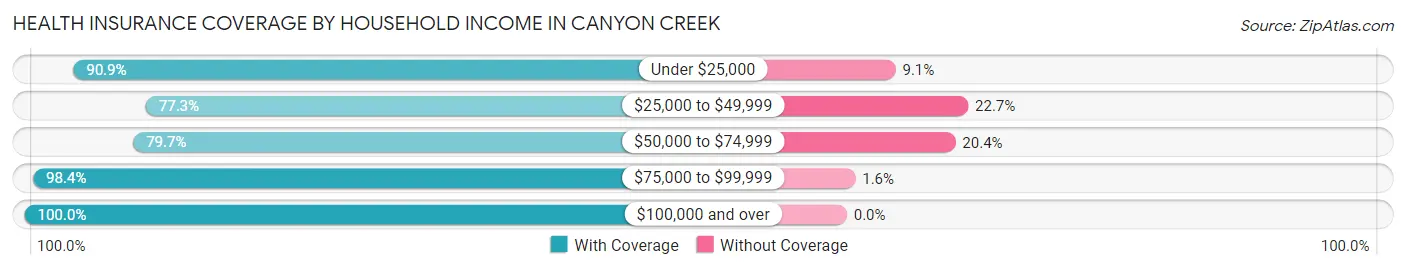
| Household Income | With Coverage | Without Coverage |
| Under $25,000 | 478 (90.9%) | 48 (9.1%) |
| $25,000 to $49,999 | 170 (77.3%) | 50 (22.7%) |
| $50,000 to $74,999 | 955 (79.6%) | 244 (20.3%) |
| $75,000 to $99,999 | 556 (98.4%) | 9 (1.6%) |
| $100,000 and over | 1,038 (100.0%) | 0 (0.0%) |
Public vs Private Health Insurance Coverage by Age in Canyon Creek
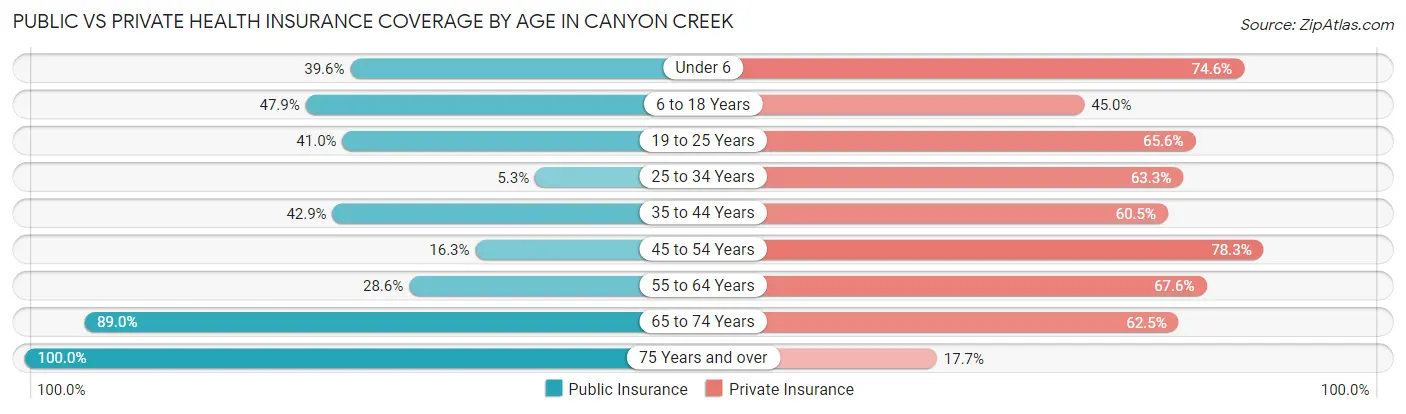
| Age Bracket | Public Insurance | Private Insurance |
| Under 6 | 106 (39.6%) | 200 (74.6%) |
| 6 to 18 Years | 235 (47.9%) | 221 (45.0%) |
| 19 to 25 Years | 130 (41.0%) | 208 (65.6%) |
| 25 to 34 Years | 33 (5.3%) | 397 (63.3%) |
| 35 to 44 Years | 153 (42.9%) | 216 (60.5%) |
| 45 to 54 Years | 106 (16.3%) | 508 (78.3%) |
| 55 to 64 Years | 177 (28.6%) | 418 (67.6%) |
| 65 to 74 Years | 121 (89.0%) | 85 (62.5%) |
| 75 Years and over | 85 (100.0%) | 15 (17.6%) |
| Total | 1,146 (32.3%) | 2,268 (63.9%) |
Disability Status by Sex by Age in Canyon Creek
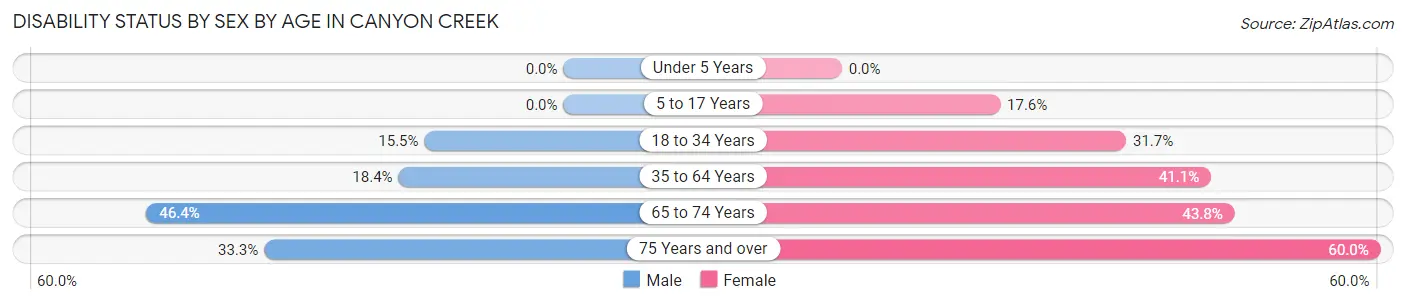
| Age Bracket | Male | Female |
| Under 5 Years | 0 (0.0%) | 0 (0.0%) |
| 5 to 17 Years | 0 (0.0%) | 58 (17.6%) |
| 18 to 34 Years | 87 (15.5%) | 126 (31.7%) |
| 35 to 64 Years | 167 (18.4%) | 294 (41.1%) |
| 65 to 74 Years | 26 (46.4%) | 35 (43.8%) |
| 75 Years and over | 10 (33.3%) | 33 (60.0%) |
Disability Class by Sex by Age in Canyon Creek
Disability Class: Hearing Difficulty
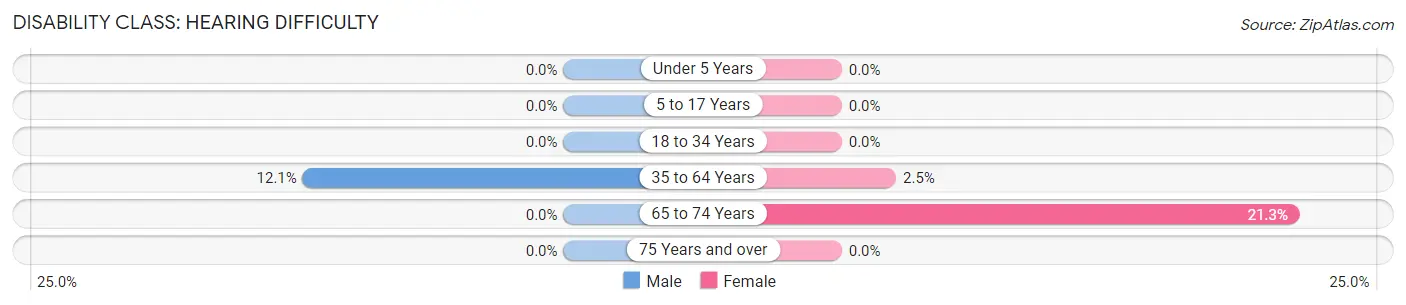
| Age Bracket | Male | Female |
| Under 5 Years | 0 (0.0%) | 0 (0.0%) |
| 5 to 17 Years | 0 (0.0%) | 0 (0.0%) |
| 18 to 34 Years | 0 (0.0%) | 0 (0.0%) |
| 35 to 64 Years | 110 (12.1%) | 18 (2.5%) |
| 65 to 74 Years | 0 (0.0%) | 17 (21.2%) |
| 75 Years and over | 0 (0.0%) | 0 (0.0%) |
Disability Class: Vision Difficulty
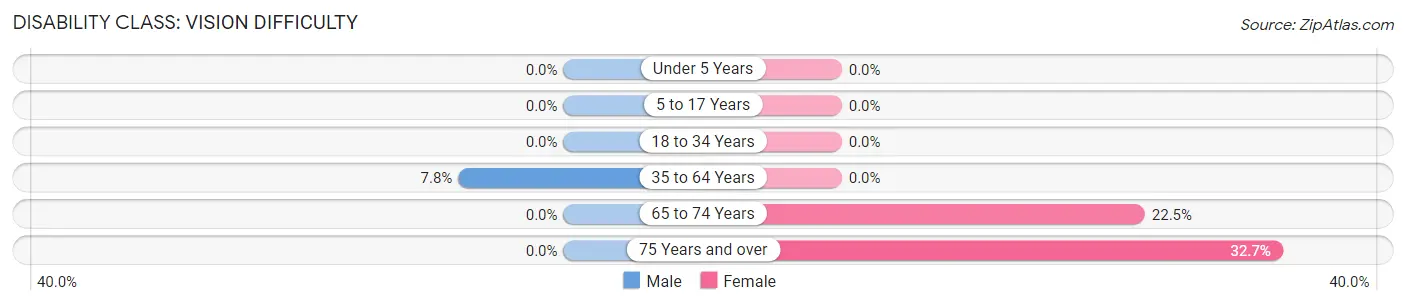
| Age Bracket | Male | Female |
| Under 5 Years | 0 (0.0%) | 0 (0.0%) |
| 5 to 17 Years | 0 (0.0%) | 0 (0.0%) |
| 18 to 34 Years | 0 (0.0%) | 0 (0.0%) |
| 35 to 64 Years | 71 (7.8%) | 0 (0.0%) |
| 65 to 74 Years | 0 (0.0%) | 18 (22.5%) |
| 75 Years and over | 0 (0.0%) | 18 (32.7%) |
Disability Class: Cognitive Difficulty
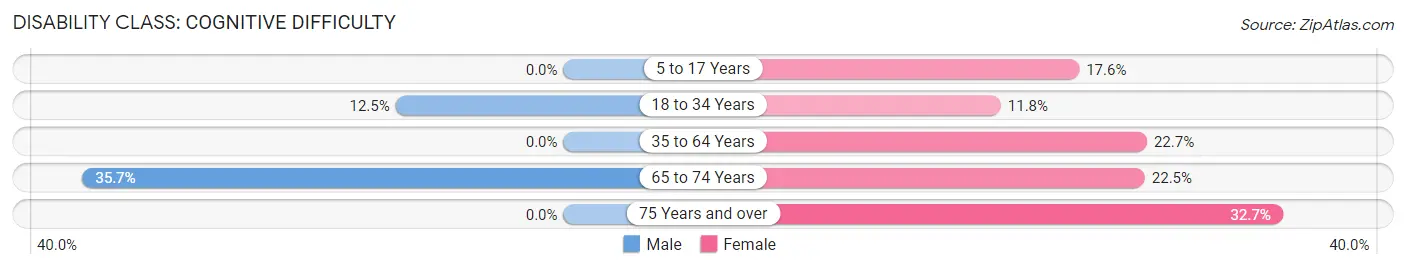
| Age Bracket | Male | Female |
| 5 to 17 Years | 0 (0.0%) | 58 (17.6%) |
| 18 to 34 Years | 70 (12.5%) | 47 (11.8%) |
| 35 to 64 Years | 0 (0.0%) | 162 (22.7%) |
| 65 to 74 Years | 20 (35.7%) | 18 (22.5%) |
| 75 Years and over | 0 (0.0%) | 18 (32.7%) |
Disability Class: Ambulatory Difficulty
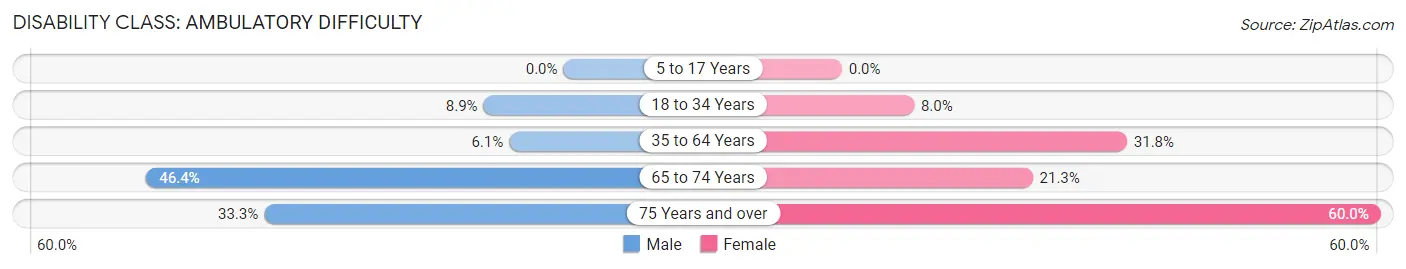
| Age Bracket | Male | Female |
| 5 to 17 Years | 0 (0.0%) | 0 (0.0%) |
| 18 to 34 Years | 50 (8.9%) | 32 (8.0%) |
| 35 to 64 Years | 55 (6.0%) | 227 (31.8%) |
| 65 to 74 Years | 26 (46.4%) | 17 (21.2%) |
| 75 Years and over | 10 (33.3%) | 33 (60.0%) |
Disability Class: Self-Care Difficulty
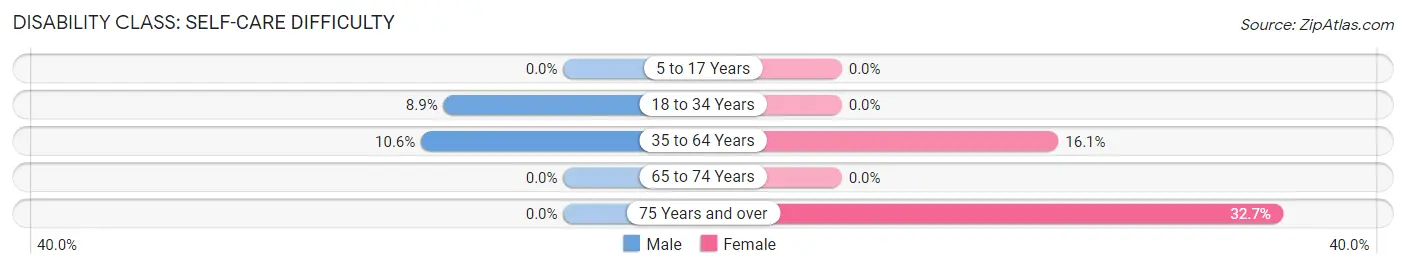
| Age Bracket | Male | Female |
| 5 to 17 Years | 0 (0.0%) | 0 (0.0%) |
| 18 to 34 Years | 50 (8.9%) | 0 (0.0%) |
| 35 to 64 Years | 96 (10.6%) | 115 (16.1%) |
| 65 to 74 Years | 0 (0.0%) | 0 (0.0%) |
| 75 Years and over | 0 (0.0%) | 18 (32.7%) |
Technology Access in Canyon Creek
Computing Device Access in Canyon Creek
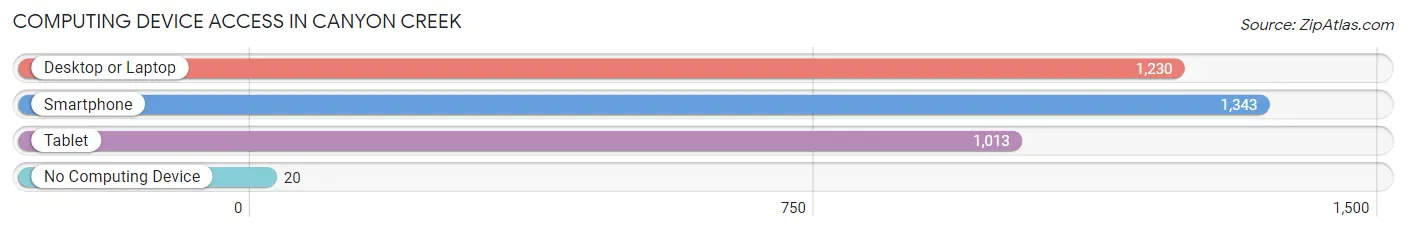
| Device Type | # Households | % Households |
| Desktop or Laptop | 1,230 | 87.5% |
| Smartphone | 1,343 | 95.5% |
| Tablet | 1,013 | 72.1% |
| No Computing Device | 20 | 1.4% |
| Total | 1,406 | 100.0% |
Internet Access in Canyon Creek
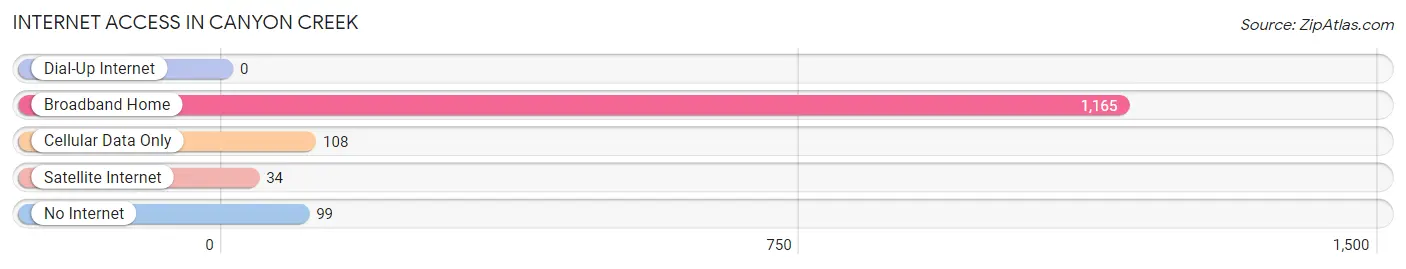
| Internet Type | # Households | % Households |
| Dial-Up Internet | 0 | 0.0% |
| Broadband Home | 1,165 | 82.9% |
| Cellular Data Only | 108 | 7.7% |
| Satellite Internet | 34 | 2.4% |
| No Internet | 99 | 7.0% |
| Total | 1,406 | 100.0% |
Canyon Creek Summary
Canyon Creek is a small unincorporated community located in King County, Washington, United States. It is situated in the foothills of the Cascade Mountains, approximately 25 miles east of Seattle. The community is located along the North Fork of the Snoqualmie River, and is surrounded by lush forests and rolling hills.
History
The area now known as Canyon Creek was first inhabited by the Snoqualmie people, who lived in the area for thousands of years before the arrival of European settlers. The first recorded European settlers in the area were miners, who arrived in the late 1800s in search of gold. The area was also home to a number of logging camps, which harvested the abundant timber in the area.
In the early 1900s, the area began to be developed for agriculture. The first settlers in the area were mostly of Scandinavian descent, and they established farms and orchards in the area. The community was officially established in the 1920s, and the first post office was opened in 1923.
Geography
Canyon Creek is located in the foothills of the Cascade Mountains, approximately 25 miles east of Seattle. The community is situated along the North Fork of the Snoqualmie River, and is surrounded by lush forests and rolling hills. The area is known for its scenic beauty, and is a popular destination for outdoor recreation.
The climate in Canyon Creek is mild and temperate, with warm summers and cool winters. The average annual temperature is around 50 degrees Fahrenheit, and the average annual precipitation is around 40 inches.
Economy
The economy of Canyon Creek is largely based on agriculture and tourism. The area is home to a number of farms and orchards, which produce a variety of fruits and vegetables. The area is also a popular destination for outdoor recreation, and is home to a number of hiking trails, camping sites, and fishing spots.
Demographics
As of the 2010 census, the population of Canyon Creek was 1,845. The racial makeup of the community was 94.3% White, 0.7% African American, 0.7% Native American, 0.7% Asian, 0.2% Pacific Islander, and 2.6% from other races. The median household income was $50,000, and the median family income was $54,000. The per capita income was $22,000.
Conclusion
Canyon Creek is a small unincorporated community located in King County, Washington, United States. It is situated in the foothills of the Cascade Mountains, approximately 25 miles east of Seattle. The community is located along the North Fork of the Snoqualmie River, and is surrounded by lush forests and rolling hills. The economy of Canyon Creek is largely based on agriculture and tourism, and the area is home to a number of farms and orchards, as well as a variety of outdoor recreation opportunities. The population of Canyon Creek was 1,845 as of the 2010 census, and the median household income was $50,000.
Common Questions
What is Per Capita Income in Canyon Creek?
Per Capita income in Canyon Creek is $33,418.
What is the Median Family Income in Canyon Creek?
Median Family Income in Canyon Creek is $63,662.
What is the Median Household income in Canyon Creek?
Median Household Income in Canyon Creek is $72,938.
What is Income or Wage Gap in Canyon Creek?
Income or Wage Gap in Canyon Creek is 13.1%.
Women in Canyon Creek earn 86.9 cents for every dollar earned by a man.
What is Inequality or Gini Index in Canyon Creek?
Inequality or Gini Index in Canyon Creek is 0.40.
What is the Total Population of Canyon Creek?
Total Population of Canyon Creek is 3,548.
What is the Total Male Population of Canyon Creek?
Total Male Population of Canyon Creek is 1,875.
What is the Total Female Population of Canyon Creek?
Total Female Population of Canyon Creek is 1,673.
What is the Ratio of Males per 100 Females in Canyon Creek?
There are 112.07 Males per 100 Females in Canyon Creek.
What is the Ratio of Females per 100 Males in Canyon Creek?
There are 89.23 Females per 100 Males in Canyon Creek.
What is the Median Population Age in Canyon Creek?
Median Population Age in Canyon Creek is 38.3 Years.
What is the Average Family Size in Canyon Creek
Average Family Size in Canyon Creek is 2.7 People.
What is the Average Household Size in Canyon Creek
Average Household Size in Canyon Creek is 2.5 People.
How Large is the Labor Force in Canyon Creek?
There are 1,805 People in the Labor Forcein in Canyon Creek.
What is the Percentage of People in the Labor Force in Canyon Creek?
64.0% of People are in the Labor Force in Canyon Creek.
What is the Unemployment Rate in Canyon Creek?
Unemployment Rate in Canyon Creek is 6.0%.