Sedro Woolley, WA Map & Demographics
Sedro Woolley Map
Sedro Woolley Overview
$30,136
PER CAPITA INCOME
$73,980
AVG FAMILY INCOME
$72,281
AVG HOUSEHOLD INCOME
33.9%
WAGE / INCOME GAP [ % ]
66.1¢/ $1
WAGE / INCOME GAP [ $ ]
0.35
INEQUALITY / GINI INDEX
12,470
TOTAL POPULATION
6,454
MALE POPULATION
6,016
FEMALE POPULATION
107.28
MALES / 100 FEMALES
93.21
FEMALES / 100 MALES
34.9
MEDIAN AGE
2.9
AVG FAMILY SIZE
2.6
AVG HOUSEHOLD SIZE
6,026
LABOR FORCE [ PEOPLE ]
61.1%
PERCENT IN LABOR FORCE
4.6%
UNEMPLOYMENT RATE
Sedro Woolley Zip Codes
Sedro Woolley Area Codes
Income in Sedro Woolley
Income Overview in Sedro Woolley
Per Capita Income in Sedro Woolley is $30,136, while median incomes of families and households are $73,980 and $72,281 respectively.
| Characteristic | Number | Measure |
| Per Capita Income | 12,470 | $30,136 |
| Median Family Income | 3,273 | $73,980 |
| Mean Family Income | 3,273 | $83,772 |
| Median Household Income | 4,562 | $72,281 |
| Mean Household Income | 4,562 | $82,094 |
| Income Deficit | 3,273 | $0 |
| Wage / Income Gap (%) | 12,470 | 33.90% |
| Wage / Income Gap ($) | 12,470 | 66.10¢ per $1 |
| Gini / Inequality Index | 12,470 | 0.35 |
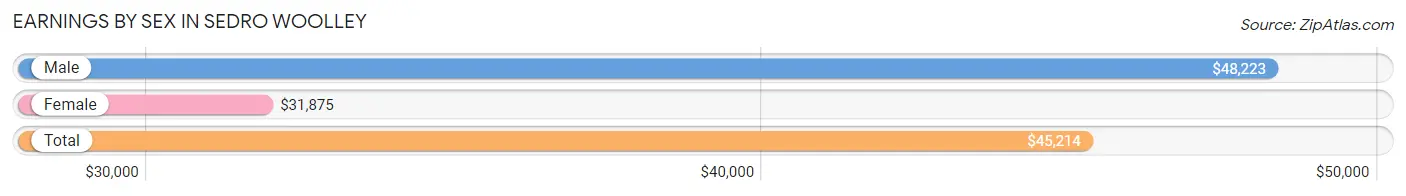
Earnings by Sex in Sedro Woolley
Average Earnings in Sedro Woolley are $45,214, $48,223 for men and $31,875 for women, a difference of 33.9%.
| Sex | Number | Average Earnings |
| Male | 3,842 (59.7%) | $48,223 |
| Female | 2,589 (40.3%) | $31,875 |
| Total | 6,431 (100.0%) | $45,214 |
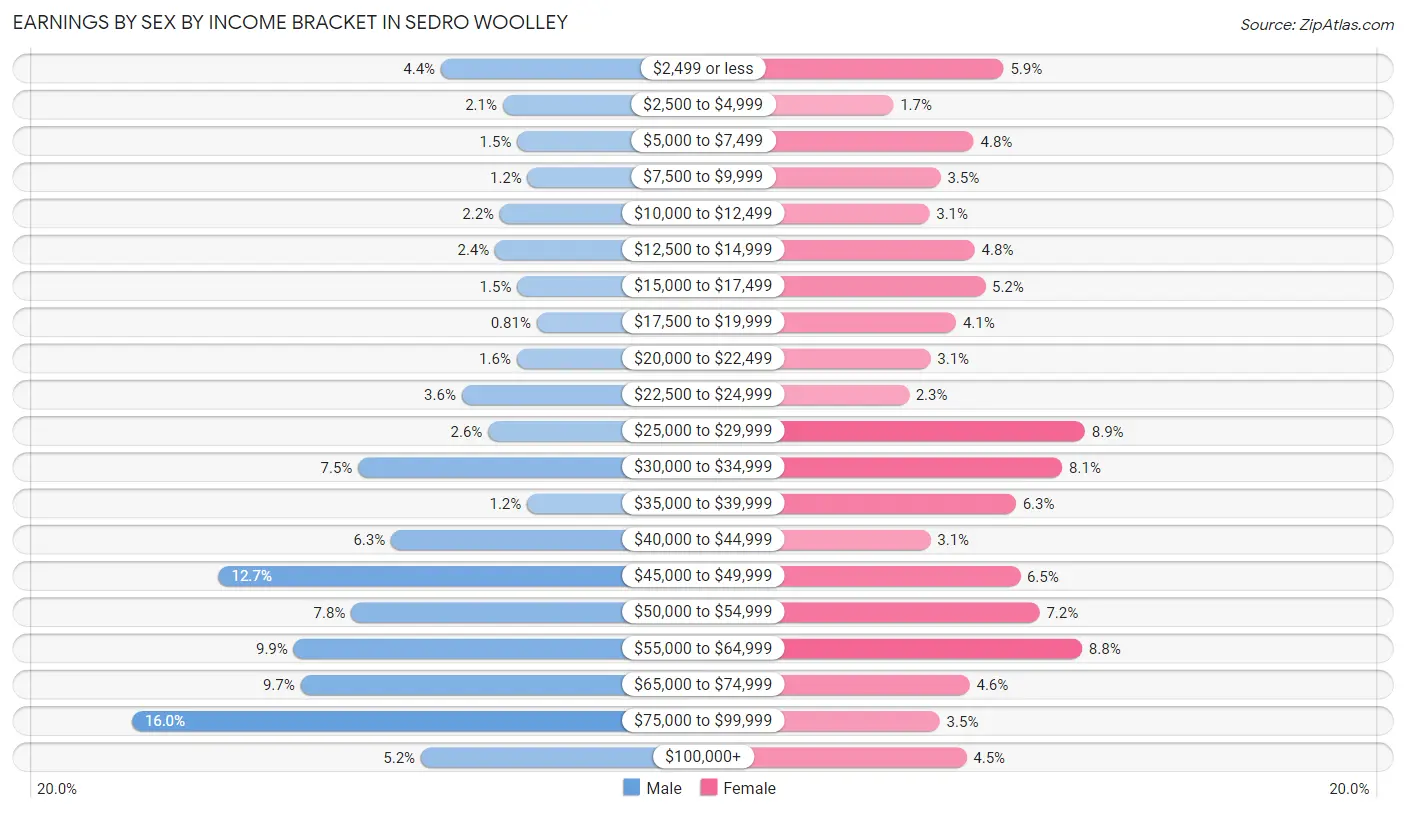
Earnings by Sex by Income Bracket in Sedro Woolley
The most common earnings brackets in Sedro Woolley are $75,000 to $99,999 for men (614 | 16.0%) and $25,000 to $29,999 for women (231 | 8.9%).
| Income | Male | Female |
| $2,499 or less | 169 (4.4%) | 152 (5.9%) |
| $2,500 to $4,999 | 80 (2.1%) | 45 (1.7%) |
| $5,000 to $7,499 | 59 (1.5%) | 123 (4.8%) |
| $7,500 to $9,999 | 44 (1.1%) | 91 (3.5%) |
| $10,000 to $12,499 | 84 (2.2%) | 80 (3.1%) |
| $12,500 to $14,999 | 91 (2.4%) | 124 (4.8%) |
| $15,000 to $17,499 | 59 (1.5%) | 134 (5.2%) |
| $17,500 to $19,999 | 31 (0.8%) | 106 (4.1%) |
| $20,000 to $22,499 | 60 (1.6%) | 81 (3.1%) |
| $22,500 to $24,999 | 139 (3.6%) | 60 (2.3%) |
| $25,000 to $29,999 | 101 (2.6%) | 231 (8.9%) |
| $30,000 to $34,999 | 288 (7.5%) | 209 (8.1%) |
| $35,000 to $39,999 | 45 (1.2%) | 164 (6.3%) |
| $40,000 to $44,999 | 241 (6.3%) | 81 (3.1%) |
| $45,000 to $49,999 | 489 (12.7%) | 168 (6.5%) |
| $50,000 to $54,999 | 298 (7.8%) | 187 (7.2%) |
| $55,000 to $64,999 | 381 (9.9%) | 228 (8.8%) |
| $65,000 to $74,999 | 371 (9.7%) | 119 (4.6%) |
| $75,000 to $99,999 | 614 (16.0%) | 90 (3.5%) |
| $100,000+ | 198 (5.1%) | 116 (4.5%) |
| Total | 3,842 (100.0%) | 2,589 (100.0%) |
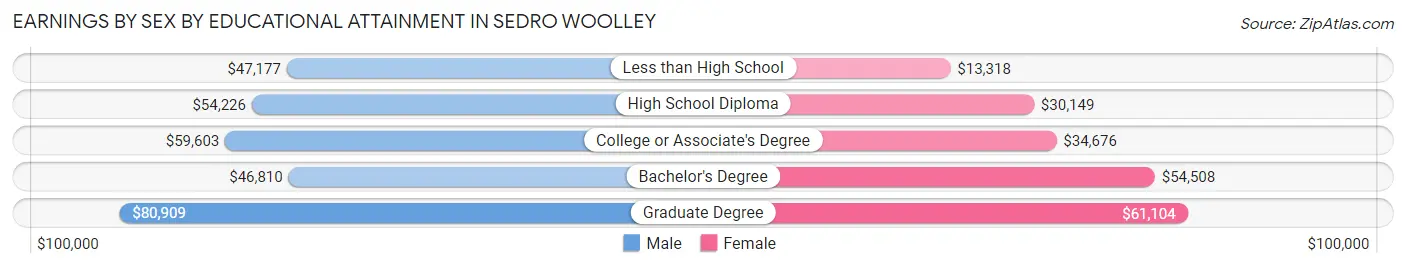
Earnings by Sex by Educational Attainment in Sedro Woolley
Average earnings in Sedro Woolley are $54,292 for men and $34,359 for women, a difference of 36.7%. Men with an educational attainment of graduate degree enjoy the highest average annual earnings of $80,909, while those with bachelor's degree education earn the least with $46,810. Women with an educational attainment of graduate degree earn the most with the average annual earnings of $61,104, while those with less than high school education have the smallest earnings of $13,318.
| Educational Attainment | Male Income | Female Income |
| Less than High School | $47,177 | $13,318 |
| High School Diploma | $54,226 | $30,149 |
| College or Associate's Degree | $59,603 | $34,676 |
| Bachelor's Degree | $46,810 | $54,508 |
| Graduate Degree | $80,909 | $61,104 |
| Total | $54,292 | $34,359 |
Family Income in Sedro Woolley
Family Income Brackets in Sedro Woolley
According to the Sedro Woolley family income data, there are 772 families falling into the $50,000 to $74,999 income range, which is the most common income bracket and makes up 23.6% of all families. Conversely, the $10,000 to $14,999 income bracket is the least frequent group with only 20 families (0.6%) belonging to this category.
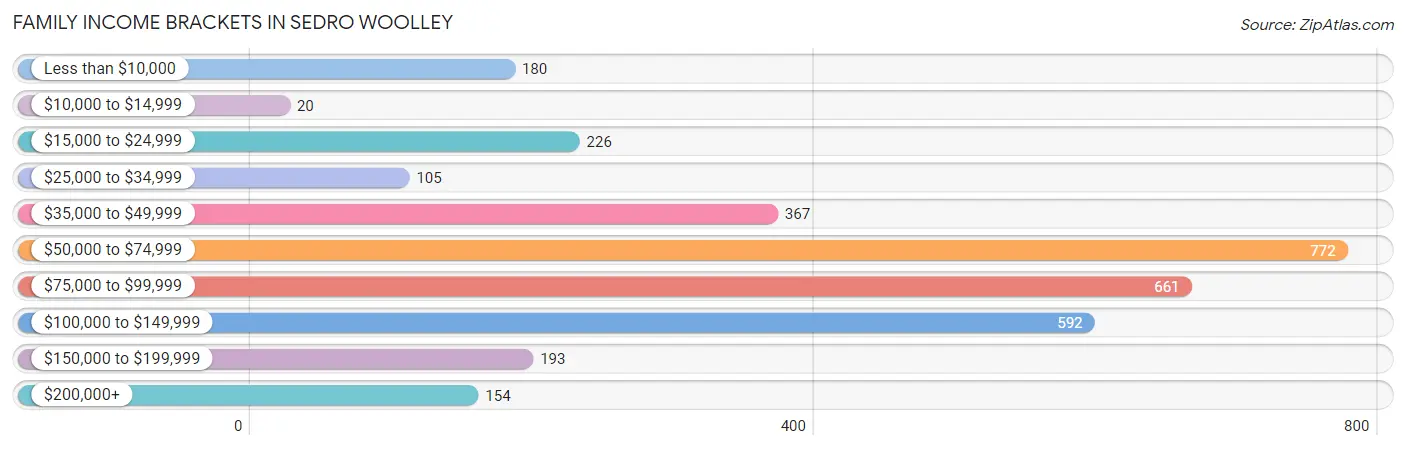
| Income Bracket | # Families | % Families |
| Less than $10,000 | 180 | 5.5% |
| $10,000 to $14,999 | 20 | 0.6% |
| $15,000 to $24,999 | 226 | 6.9% |
| $25,000 to $34,999 | 105 | 3.2% |
| $35,000 to $49,999 | 367 | 11.2% |
| $50,000 to $74,999 | 772 | 23.6% |
| $75,000 to $99,999 | 661 | 20.2% |
| $100,000 to $149,999 | 592 | 18.1% |
| $150,000 to $199,999 | 193 | 5.9% |
| $200,000+ | 154 | 4.7% |
Family Income by Famaliy Size in Sedro Woolley
5-person families (265 | 8.1%) account for the highest median family income in Sedro Woolley with $90,195 per family, while 2-person families (1,405 | 42.9%) have the highest median income of $31,139 per family member.
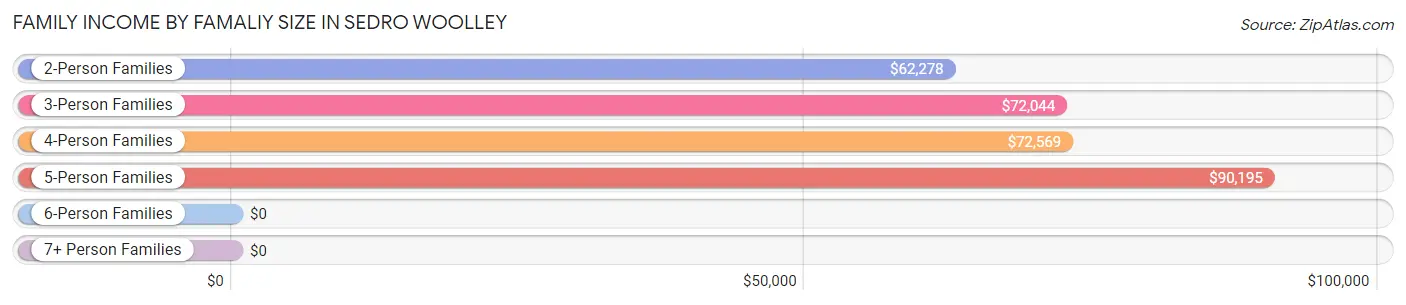
| Income Bracket | # Families | Median Income |
| 2-Person Families | 1,405 (42.9%) | $62,278 |
| 3-Person Families | 793 (24.2%) | $72,044 |
| 4-Person Families | 672 (20.5%) | $72,569 |
| 5-Person Families | 265 (8.1%) | $90,195 |
| 6-Person Families | 82 (2.5%) | $0 |
| 7+ Person Families | 56 (1.7%) | $0 |
| Total | 3,273 (100.0%) | $73,980 |
Family Income by Number of Earners in Sedro Woolley
The median family income in Sedro Woolley is $73,980, with families comprising 3+ earners (456) having the highest median family income of $136,989, while families with no earners (562) have the lowest median family income of $38,910, accounting for 13.9% and 17.2% of families, respectively.
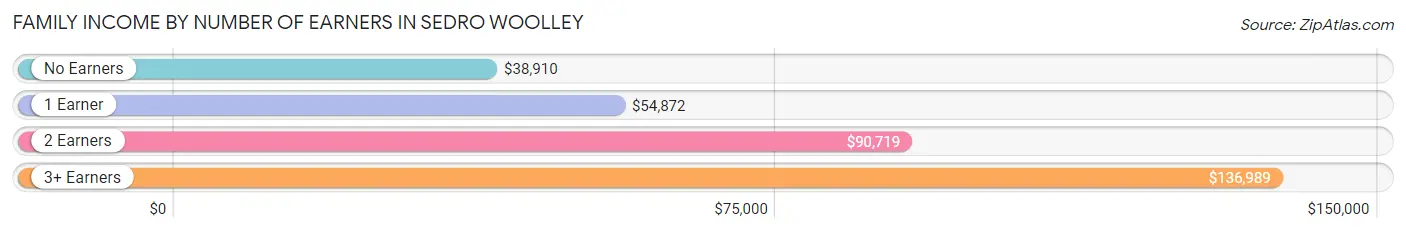
| Number of Earners | # Families | Median Income |
| No Earners | 562 (17.2%) | $38,910 |
| 1 Earner | 1,211 (37.0%) | $54,872 |
| 2 Earners | 1,044 (31.9%) | $90,719 |
| 3+ Earners | 456 (13.9%) | $136,989 |
| Total | 3,273 (100.0%) | $73,980 |
Household Income in Sedro Woolley
Household Income Brackets in Sedro Woolley
With 1,186 households falling in the category, the $50,000 to $74,999 income range is the most frequent in Sedro Woolley, accounting for 26.0% of all households. In contrast, only 91 households (2.0%) fall into the $10,000 to $14,999 income bracket, making it the least populous group.
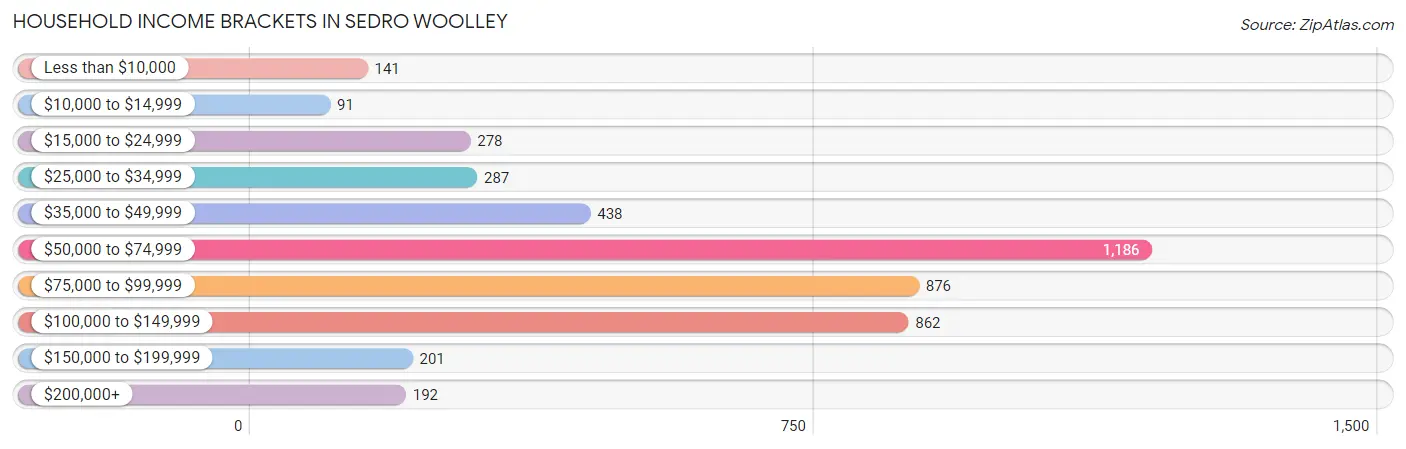
| Income Bracket | # Households | % Households |
| Less than $10,000 | 141 | 3.1% |
| $10,000 to $14,999 | 91 | 2.0% |
| $15,000 to $24,999 | 278 | 6.1% |
| $25,000 to $34,999 | 287 | 6.3% |
| $35,000 to $49,999 | 438 | 9.6% |
| $50,000 to $74,999 | 1,186 | 26.0% |
| $75,000 to $99,999 | 876 | 19.2% |
| $100,000 to $149,999 | 862 | 18.9% |
| $150,000 to $199,999 | 201 | 4.4% |
| $200,000+ | 192 | 4.2% |
Household Income by Householder Age in Sedro Woolley
The median household income in Sedro Woolley is $72,281, with the highest median household income of $91,250 found in the 45 to 64 years age bracket for the primary householder. A total of 1,352 households (29.6%) fall into this category. Meanwhile, the 65+ years age bracket for the primary householder has the lowest median household income of $53,564, with 1,091 households (23.9%) in this group.
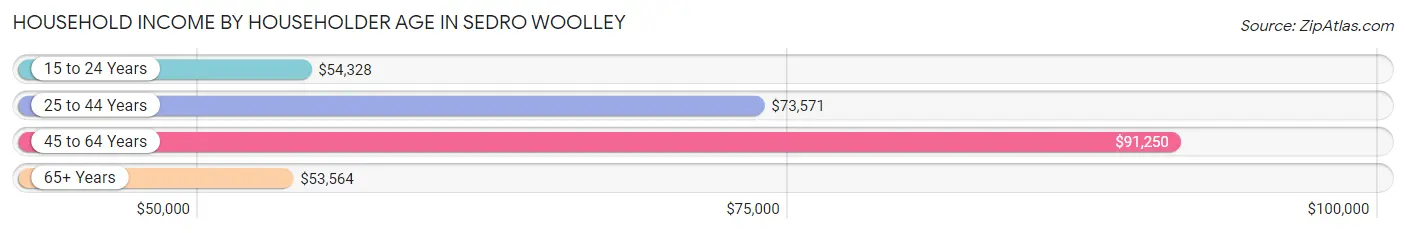
| Income Bracket | # Households | Median Income |
| 15 to 24 Years | 219 (4.8%) | $54,328 |
| 25 to 44 Years | 1,900 (41.6%) | $73,571 |
| 45 to 64 Years | 1,352 (29.6%) | $91,250 |
| 65+ Years | 1,091 (23.9%) | $53,564 |
| Total | 4,562 (100.0%) | $72,281 |
Poverty in Sedro Woolley
Income Below Poverty by Sex and Age in Sedro Woolley
With 9.8% poverty level for males and 20.9% for females among the residents of Sedro Woolley, 15 year old males and 12 to 14 year old females are the most vulnerable to poverty, with 29 males (67.4%) and 52 females (48.1%) in their respective age groups living below the poverty level.
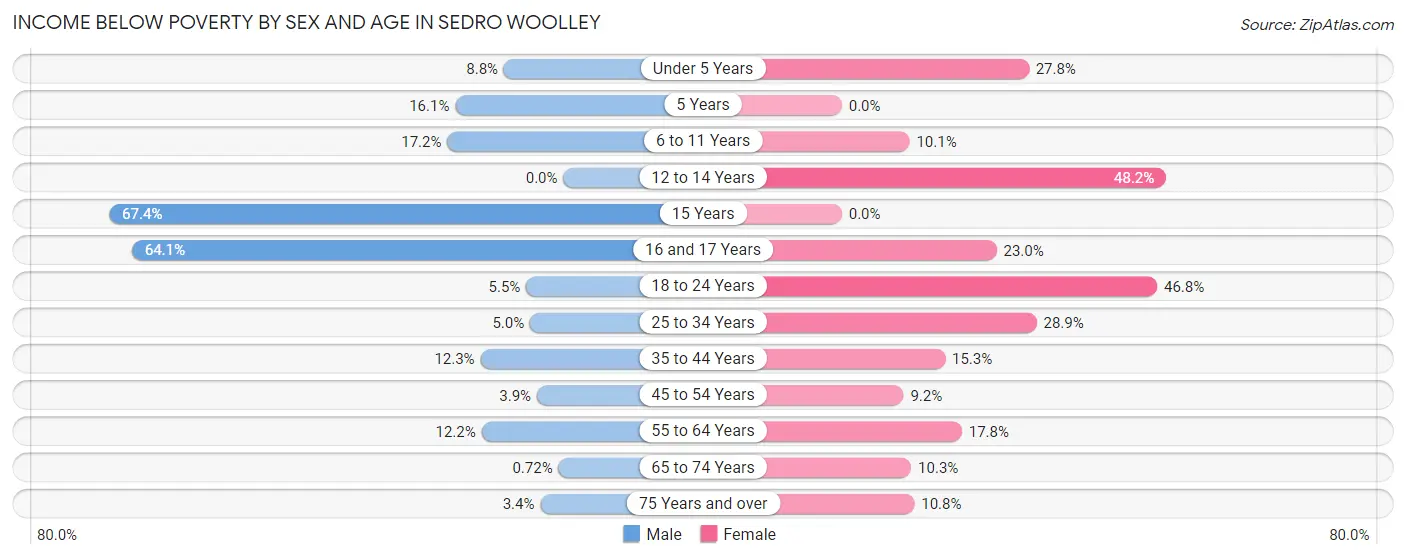
| Age Bracket | Male | Female |
| Under 5 Years | 41 (8.8%) | 164 (27.8%) |
| 5 Years | 26 (16.1%) | 0 (0.0%) |
| 6 to 11 Years | 86 (17.2%) | 58 (10.1%) |
| 12 to 14 Years | 0 (0.0%) | 52 (48.1%) |
| 15 Years | 29 (67.4%) | 0 (0.0%) |
| 16 and 17 Years | 66 (64.1%) | 37 (23.0%) |
| 18 to 24 Years | 44 (5.5%) | 293 (46.8%) |
| 25 to 34 Years | 50 (5.0%) | 247 (28.9%) |
| 35 to 44 Years | 150 (12.3%) | 141 (15.3%) |
| 45 to 54 Years | 17 (3.9%) | 63 (9.2%) |
| 55 to 64 Years | 96 (12.1%) | 93 (17.8%) |
| 65 to 74 Years | 3 (0.7%) | 62 (10.3%) |
| 75 Years and over | 10 (3.4%) | 27 (10.8%) |
| Total | 618 (9.8%) | 1,237 (20.9%) |
Income Above Poverty by Sex and Age in Sedro Woolley
According to the poverty statistics in Sedro Woolley, males aged 12 to 14 years and females aged 5 years are the age groups that are most secure financially, with 100.0% of males and 100.0% of females in these age groups living above the poverty line.
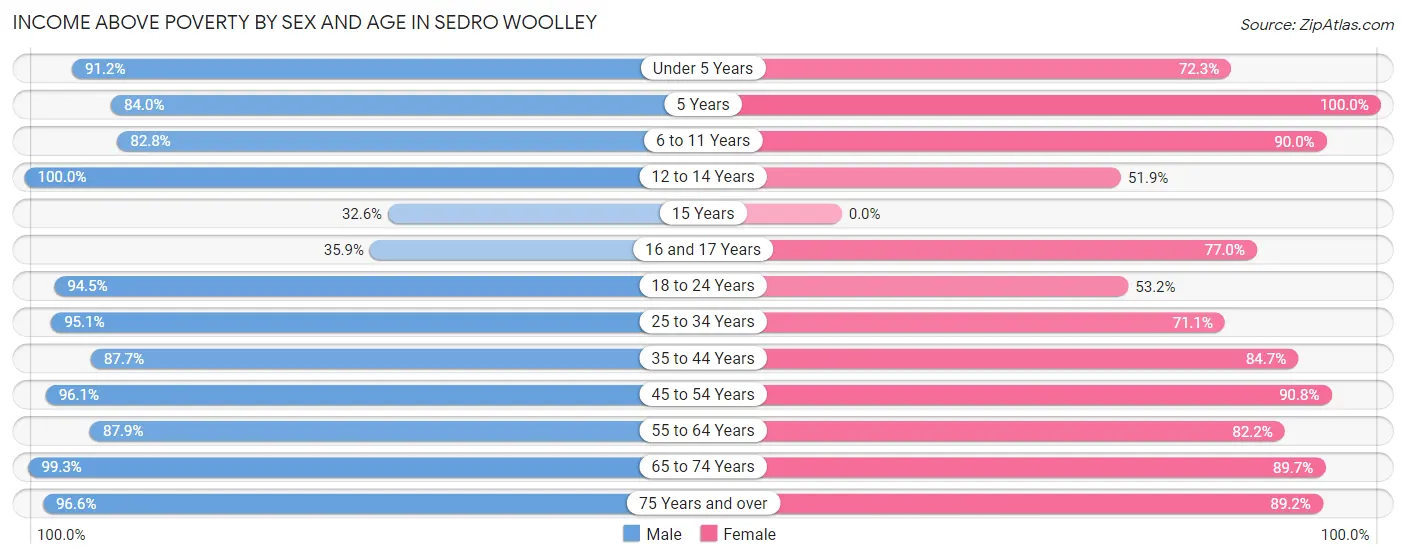
| Age Bracket | Male | Female |
| Under 5 Years | 424 (91.2%) | 427 (72.3%) |
| 5 Years | 136 (84.0%) | 10 (100.0%) |
| 6 to 11 Years | 413 (82.8%) | 519 (89.9%) |
| 12 to 14 Years | 112 (100.0%) | 56 (51.8%) |
| 15 Years | 14 (32.6%) | 0 (0.0%) |
| 16 and 17 Years | 37 (35.9%) | 124 (77.0%) |
| 18 to 24 Years | 753 (94.5%) | 333 (53.2%) |
| 25 to 34 Years | 960 (95.1%) | 607 (71.1%) |
| 35 to 44 Years | 1,069 (87.7%) | 779 (84.7%) |
| 45 to 54 Years | 417 (96.1%) | 625 (90.8%) |
| 55 to 64 Years | 694 (87.8%) | 429 (82.2%) |
| 65 to 74 Years | 412 (99.3%) | 540 (89.7%) |
| 75 Years and over | 282 (96.6%) | 224 (89.2%) |
| Total | 5,723 (90.2%) | 4,673 (79.1%) |
Income Below Poverty Among Married-Couple Families in Sedro Woolley
The poverty statistics for married-couple families in Sedro Woolley show that 4.8% or 105 of the total 2,189 families live below the poverty line. Families with 1 or 2 children have the highest poverty rate of 9.1%, comprising of 75 families. On the other hand, families with 3 or 4 children have the lowest poverty rate of 0.0%, which includes 0 families.
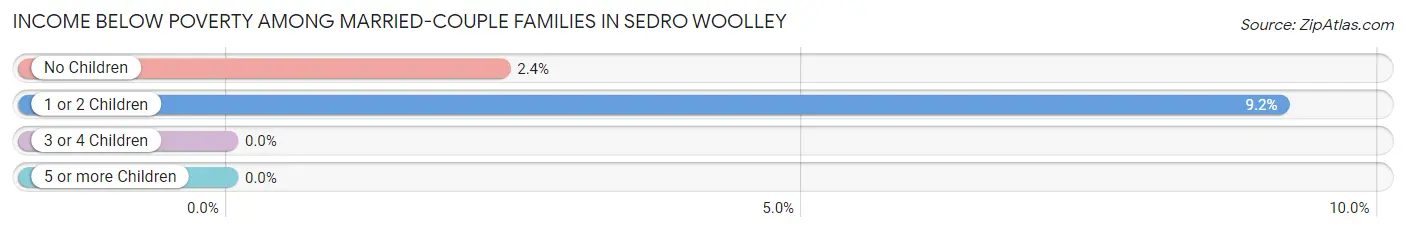
| Children | Above Poverty | Below Poverty |
| No Children | 1,236 (97.6%) | 30 (2.4%) |
| 1 or 2 Children | 745 (90.8%) | 75 (9.1%) |
| 3 or 4 Children | 103 (100.0%) | 0 (0.0%) |
| 5 or more Children | 0 (0.0%) | 0 (0.0%) |
| Total | 2,084 (95.2%) | 105 (4.8%) |
Income Below Poverty Among Single-Parent Households in Sedro Woolley
According to the poverty data in Sedro Woolley, 2.3% or 11 single-father households and 33.3% or 201 single-mother households are living below the poverty line. Among single-father households, those with 3 or 4 children have the highest poverty rate, with 11 households (9.4%) experiencing poverty. Likewise, among single-mother households, those with 3 or 4 children have the highest poverty rate, with 72 households (100.0%) falling below the poverty line.
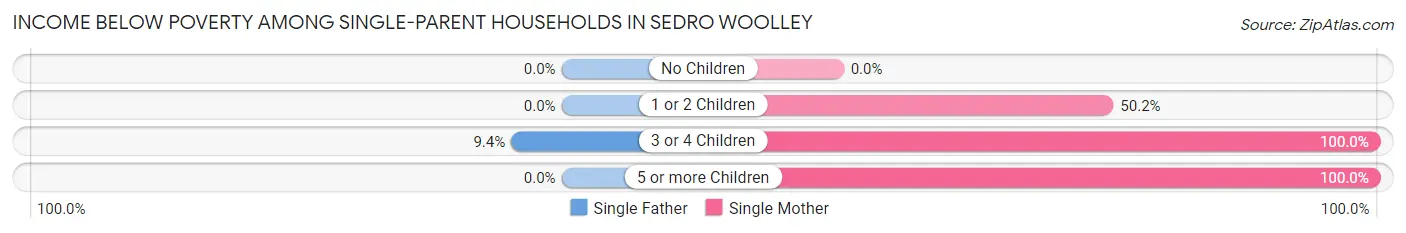
| Children | Single Father | Single Mother |
| No Children | 0 (0.0%) | 0 (0.0%) |
| 1 or 2 Children | 0 (0.0%) | 106 (50.2%) |
| 3 or 4 Children | 11 (9.4%) | 72 (100.0%) |
| 5 or more Children | 0 (0.0%) | 23 (100.0%) |
| Total | 11 (2.3%) | 201 (33.3%) |
Income Below Poverty Among Married-Couple vs Single-Parent Households in Sedro Woolley
The poverty data for Sedro Woolley shows that 105 of the married-couple family households (4.8%) and 212 of the single-parent households (19.6%) are living below the poverty level. Within the married-couple family households, those with 1 or 2 children have the highest poverty rate, with 75 households (9.1%) falling below the poverty line. Among the single-parent households, those with 5 or more children have the highest poverty rate, with 23 household (100.0%) living below poverty.
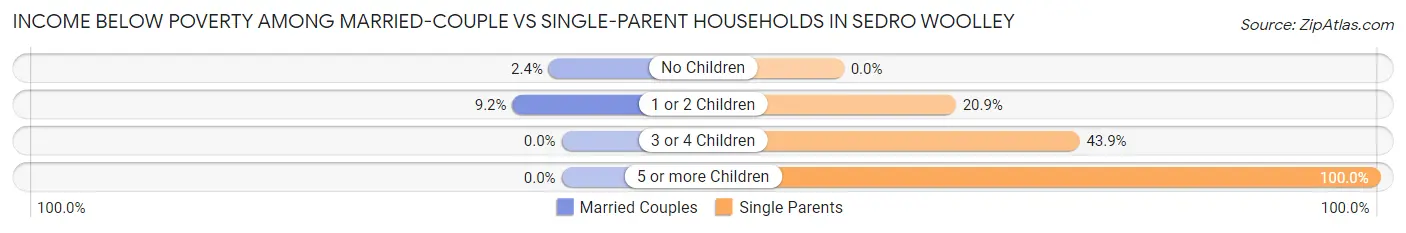
| Children | Married-Couple Families | Single-Parent Households |
| No Children | 30 (2.4%) | 0 (0.0%) |
| 1 or 2 Children | 75 (9.1%) | 106 (20.9%) |
| 3 or 4 Children | 0 (0.0%) | 83 (43.9%) |
| 5 or more Children | 0 (0.0%) | 23 (100.0%) |
| Total | 105 (4.8%) | 212 (19.6%) |
Race in Sedro Woolley
The most populous races in Sedro Woolley are White / Caucasian (9,792 | 78.5%), Hispanic or Latino (3,234 | 25.9%), and Some other Race (1,344 | 10.8%).
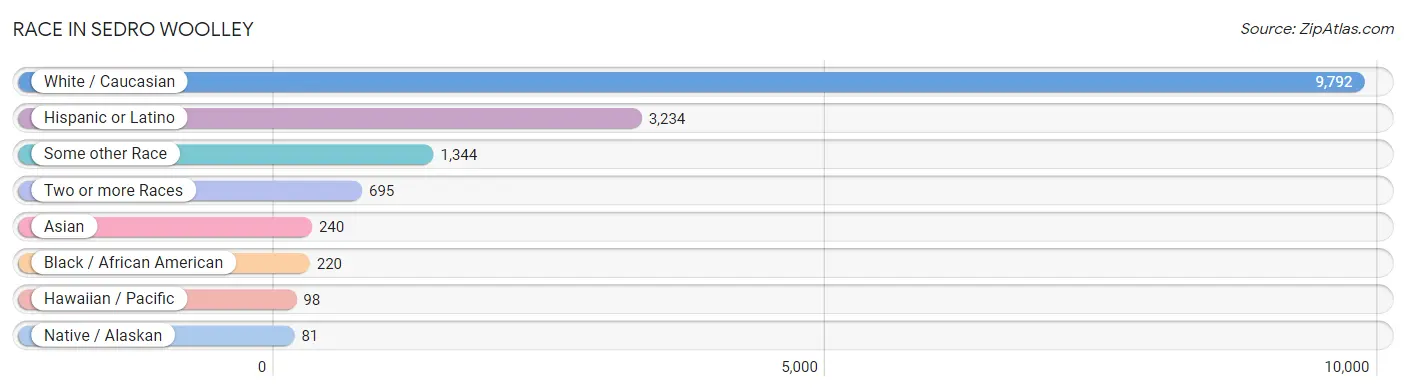
| Race | # Population | % Population |
| Asian | 240 | 1.9% |
| Black / African American | 220 | 1.8% |
| Hawaiian / Pacific | 98 | 0.8% |
| Hispanic or Latino | 3,234 | 25.9% |
| Native / Alaskan | 81 | 0.6% |
| White / Caucasian | 9,792 | 78.5% |
| Two or more Races | 695 | 5.6% |
| Some other Race | 1,344 | 10.8% |
| Total | 12,470 | 100.0% |
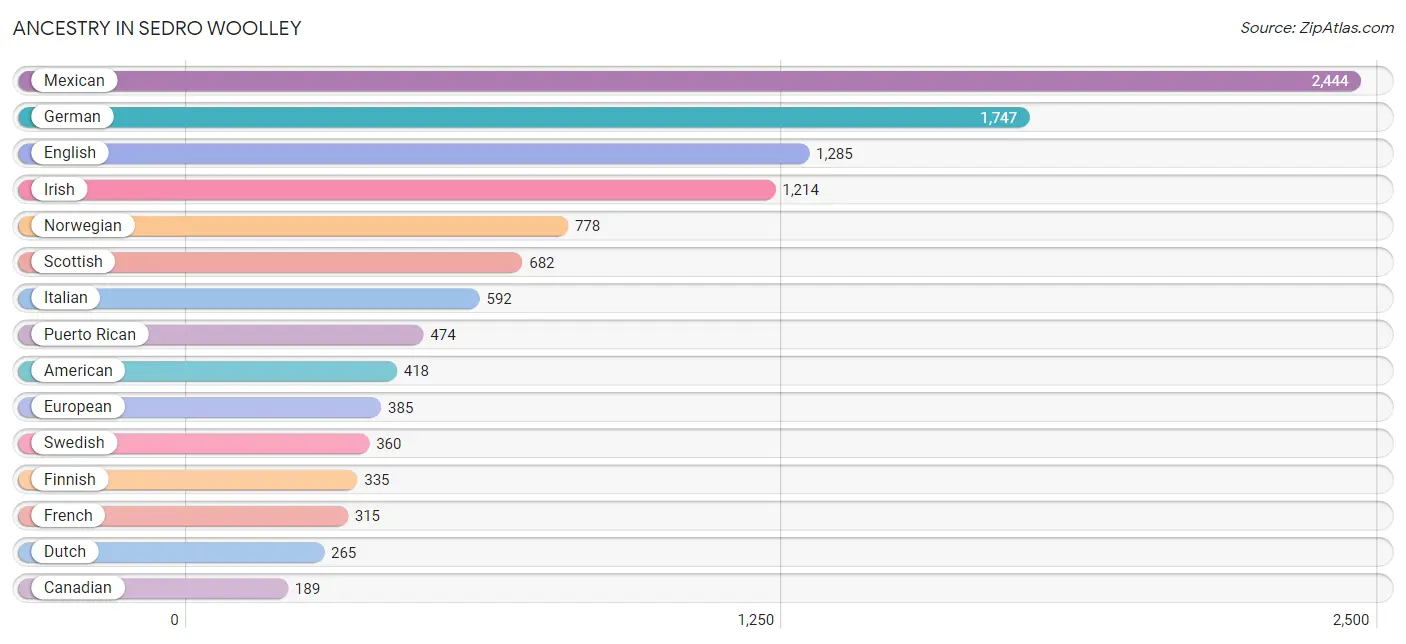
Ancestry in Sedro Woolley
The most populous ancestries reported in Sedro Woolley are Mexican (2,444 | 19.6%), German (1,747 | 14.0%), English (1,285 | 10.3%), Irish (1,214 | 9.7%), and Norwegian (778 | 6.2%), together accounting for 59.9% of all Sedro Woolley residents.
| Ancestry | # Population | % Population |
| African | 5 | 0.0% |
| American | 418 | 3.4% |
| Arab | 17 | 0.1% |
| Austrian | 37 | 0.3% |
| Basque | 12 | 0.1% |
| Bhutanese | 14 | 0.1% |
| Blackfeet | 37 | 0.3% |
| British | 55 | 0.4% |
| Cajun | 14 | 0.1% |
| Canadian | 189 | 1.5% |
| Central American | 133 | 1.1% |
| Cherokee | 8 | 0.1% |
| Creek | 80 | 0.6% |
| Croatian | 7 | 0.1% |
| Czech | 19 | 0.2% |
| Czechoslovakian | 27 | 0.2% |
| Danish | 63 | 0.5% |
| Dutch | 265 | 2.1% |
| Eastern European | 31 | 0.3% |
| Ecuadorian | 40 | 0.3% |
| English | 1,285 | 10.3% |
| European | 385 | 3.1% |
| Finnish | 335 | 2.7% |
| French | 315 | 2.5% |
| French Canadian | 62 | 0.5% |
| German | 1,747 | 14.0% |
| Greek | 15 | 0.1% |
| Guatemalan | 133 | 1.1% |
| Indian (Asian) | 139 | 1.1% |
| Iranian | 23 | 0.2% |
| Irish | 1,214 | 9.7% |
| Italian | 592 | 4.8% |
| Jamaican | 8 | 0.1% |
| Kenyan | 1 | 0.0% |
| Korean | 140 | 1.1% |
| Menominee | 113 | 0.9% |
| Mexican | 2,444 | 19.6% |
| Mexican American Indian | 17 | 0.1% |
| Native Hawaiian | 8 | 0.1% |
| Nigerian | 17 | 0.1% |
| Northern European | 35 | 0.3% |
| Norwegian | 778 | 6.2% |
| Peruvian | 21 | 0.2% |
| Polish | 60 | 0.5% |
| Portuguese | 43 | 0.3% |
| Puerto Rican | 474 | 3.8% |
| Puget Sound Salish | 92 | 0.7% |
| Russian | 22 | 0.2% |
| Scandinavian | 163 | 1.3% |
| Scotch-Irish | 152 | 1.2% |
| Scottish | 682 | 5.5% |
| Slovene | 8 | 0.1% |
| South American | 61 | 0.5% |
| Spaniard | 14 | 0.1% |
| Spanish | 5 | 0.0% |
| Sri Lankan | 4 | 0.0% |
| Subsaharan African | 23 | 0.2% |
| Swedish | 360 | 2.9% |
| Swiss | 31 | 0.3% |
| Tongan | 17 | 0.1% |
| Welsh | 23 | 0.2% | View All 61 Rows |
Immigrants in Sedro Woolley
The most numerous immigrant groups reported in Sedro Woolley came from Latin America (636 | 5.1%), Central America (607 | 4.9%), Mexico (514 | 4.1%), Canada (94 | 0.7%), and Guatemala (93 | 0.7%), together accounting for 15.6% of all Sedro Woolley residents.
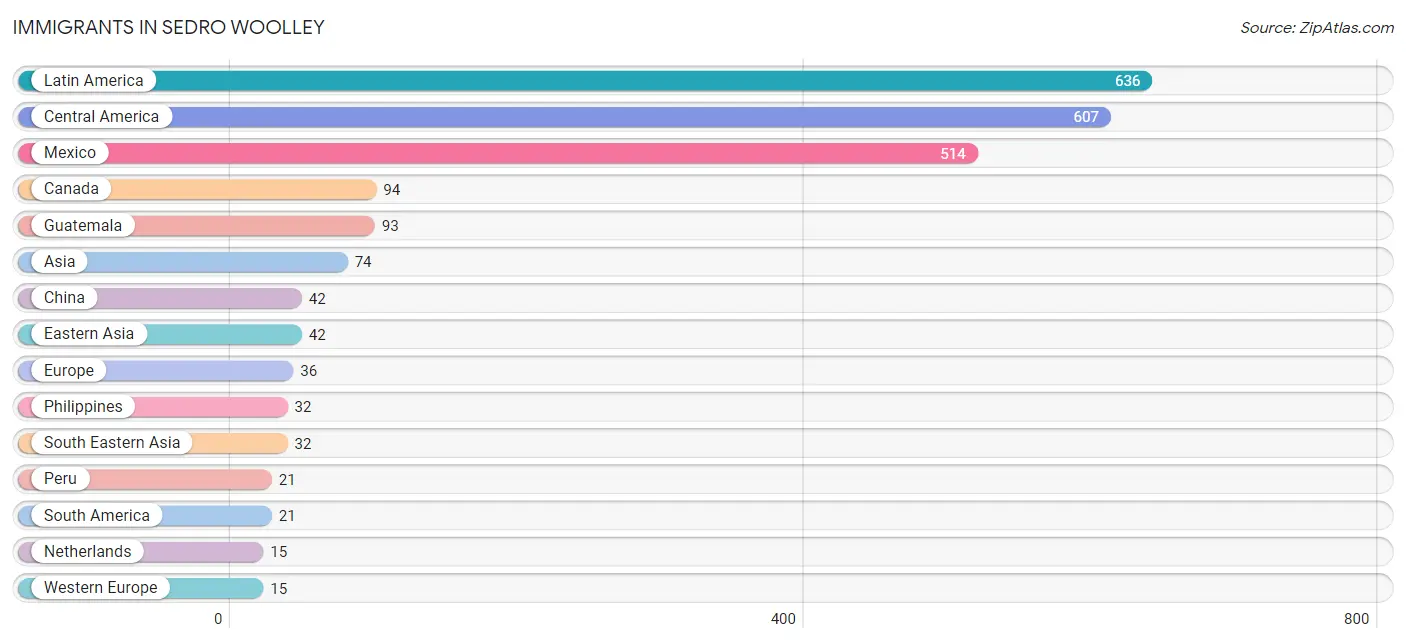
| Immigration Origin | # Population | % Population |
| Africa | 1 | 0.0% |
| Asia | 74 | 0.6% |
| Canada | 94 | 0.7% |
| Caribbean | 8 | 0.1% |
| Central America | 607 | 4.9% |
| China | 42 | 0.3% |
| Eastern Africa | 1 | 0.0% |
| Eastern Asia | 42 | 0.3% |
| Eastern Europe | 12 | 0.1% |
| Europe | 36 | 0.3% |
| Guatemala | 93 | 0.7% |
| Jamaica | 8 | 0.1% |
| Kenya | 1 | 0.0% |
| Latin America | 636 | 5.1% |
| Mexico | 514 | 4.1% |
| Netherlands | 15 | 0.1% |
| Northern Europe | 9 | 0.1% |
| Peru | 21 | 0.2% |
| Philippines | 32 | 0.3% |
| Russia | 12 | 0.1% |
| South America | 21 | 0.2% |
| South Eastern Asia | 32 | 0.3% |
| Western Europe | 15 | 0.1% | View All 23 Rows |
Sex and Age in Sedro Woolley
Sex and Age in Sedro Woolley
The most populous age groups in Sedro Woolley are 35 to 39 Years (898 | 13.9%) for men and Under 5 Years (594 | 9.9%) for women.
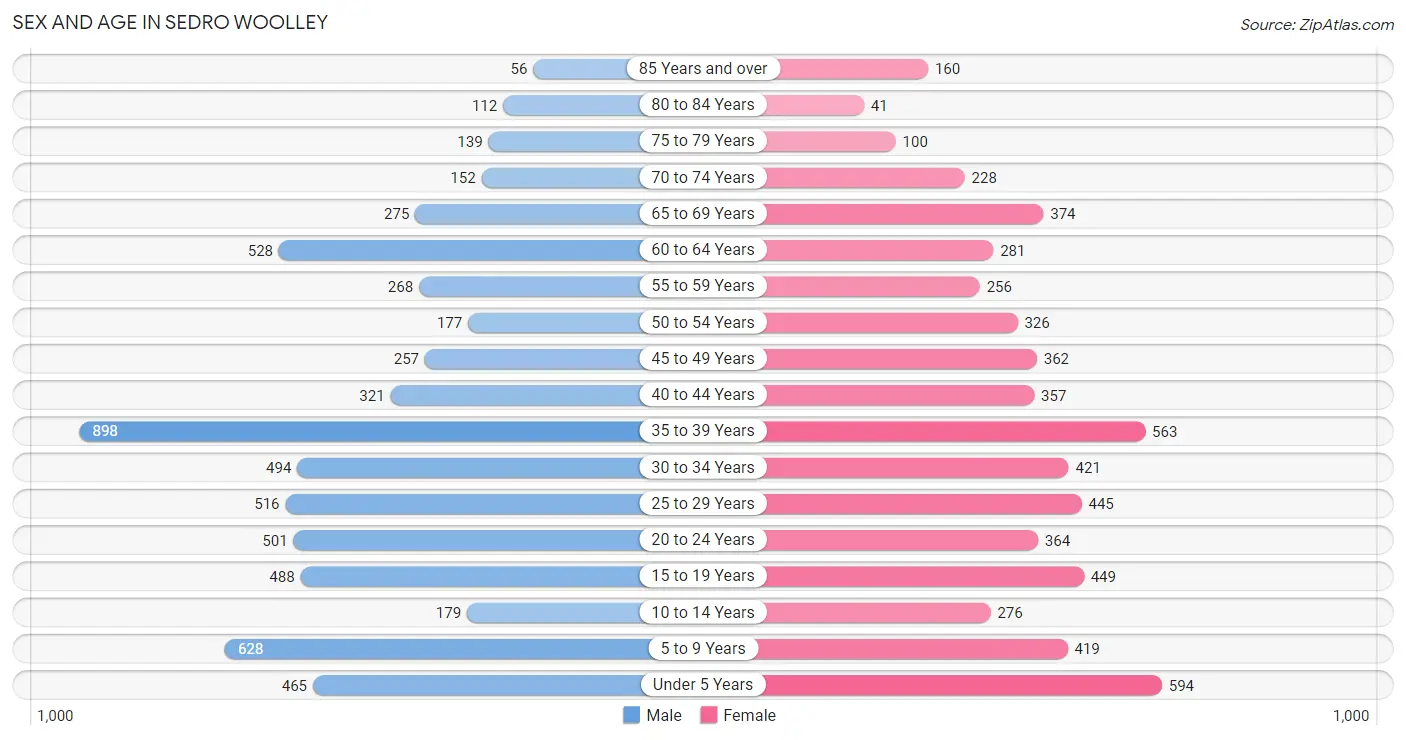
| Age Bracket | Male | Female |
| Under 5 Years | 465 (7.2%) | 594 (9.9%) |
| 5 to 9 Years | 628 (9.7%) | 419 (7.0%) |
| 10 to 14 Years | 179 (2.8%) | 276 (4.6%) |
| 15 to 19 Years | 488 (7.6%) | 449 (7.5%) |
| 20 to 24 Years | 501 (7.8%) | 364 (6.0%) |
| 25 to 29 Years | 516 (8.0%) | 445 (7.4%) |
| 30 to 34 Years | 494 (7.6%) | 421 (7.0%) |
| 35 to 39 Years | 898 (13.9%) | 563 (9.4%) |
| 40 to 44 Years | 321 (5.0%) | 357 (5.9%) |
| 45 to 49 Years | 257 (4.0%) | 362 (6.0%) |
| 50 to 54 Years | 177 (2.7%) | 326 (5.4%) |
| 55 to 59 Years | 268 (4.2%) | 256 (4.3%) |
| 60 to 64 Years | 528 (8.2%) | 281 (4.7%) |
| 65 to 69 Years | 275 (4.3%) | 374 (6.2%) |
| 70 to 74 Years | 152 (2.4%) | 228 (3.8%) |
| 75 to 79 Years | 139 (2.1%) | 100 (1.7%) |
| 80 to 84 Years | 112 (1.7%) | 41 (0.7%) |
| 85 Years and over | 56 (0.9%) | 160 (2.7%) |
| Total | 6,454 (100.0%) | 6,016 (100.0%) |
Families and Households in Sedro Woolley
Median Family Size in Sedro Woolley
The median family size in Sedro Woolley is 2.94 persons per family, with single female/mother families (604 | 18.4%) accounting for the largest median family size of 3.01 persons per family. On the other hand, single male/father families (480 | 14.7%) represent the smallest median family size with 2.87 persons per family.
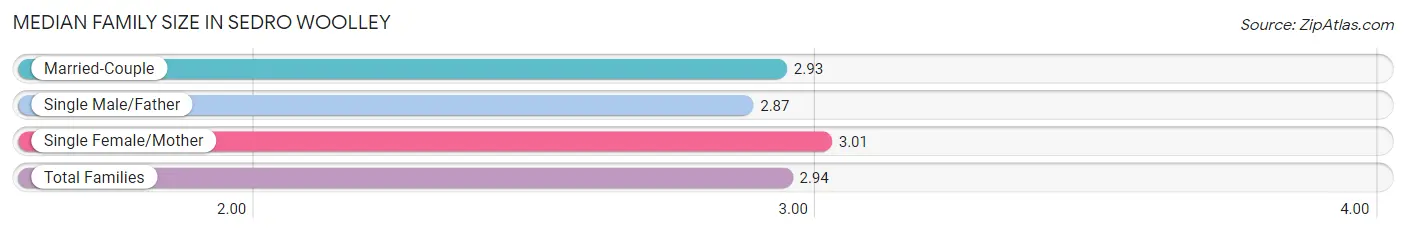
| Family Type | # Families | Family Size |
| Married-Couple | 2,189 (66.9%) | 2.93 |
| Single Male/Father | 480 (14.7%) | 2.87 |
| Single Female/Mother | 604 (18.4%) | 3.01 |
| Total Families | 3,273 (100.0%) | 2.94 |
Median Household Size in Sedro Woolley
The median household size in Sedro Woolley is 2.58 persons per household, with single male/father households (480 | 10.5%) accounting for the largest median household size of 3.65 persons per household. non-family households (1,289 | 28.3%) represent the smallest median household size with 1.20 persons per household.
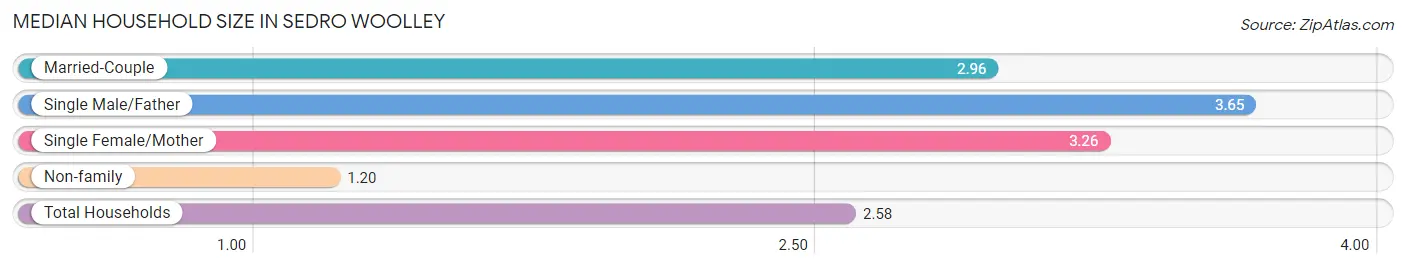
| Household Type | # Households | Household Size |
| Married-Couple | 2,189 (48.0%) | 2.96 |
| Single Male/Father | 480 (10.5%) | 3.65 |
| Single Female/Mother | 604 (13.2%) | 3.26 |
| Non-family | 1,289 (28.3%) | 1.20 |
| Total Households | 4,562 (100.0%) | 2.58 |
Household Size by Marriage Status in Sedro Woolley
Out of a total of 4,562 households in Sedro Woolley, 3,273 (71.7%) are family households, while 1,289 (28.3%) are nonfamily households. The most numerous type of family households are 2-person households, comprising 1,182, and the most common type of nonfamily households are 1-person households, comprising 1,068.
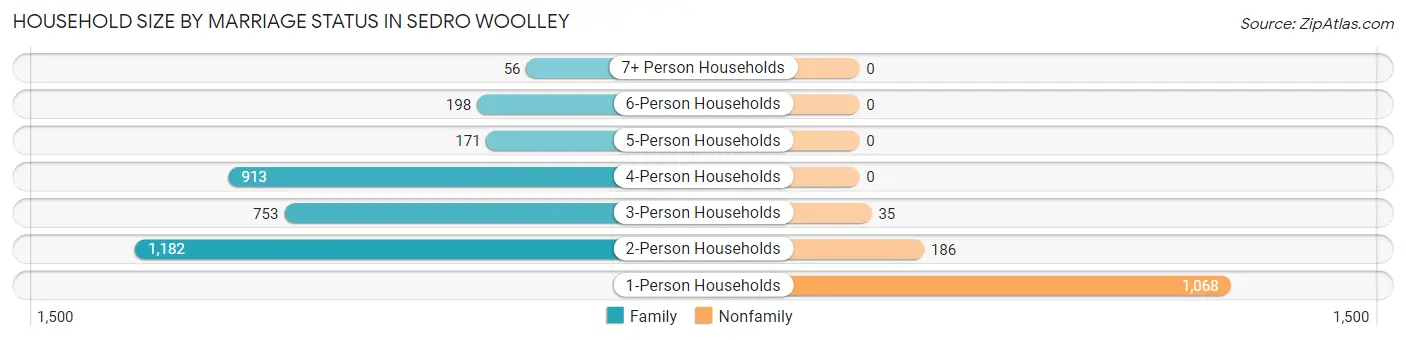
| Household Size | Family Households | Nonfamily Households |
| 1-Person Households | - | 1,068 (23.4%) |
| 2-Person Households | 1,182 (25.9%) | 186 (4.1%) |
| 3-Person Households | 753 (16.5%) | 35 (0.8%) |
| 4-Person Households | 913 (20.0%) | 0 (0.0%) |
| 5-Person Households | 171 (3.7%) | 0 (0.0%) |
| 6-Person Households | 198 (4.3%) | 0 (0.0%) |
| 7+ Person Households | 56 (1.2%) | 0 (0.0%) |
| Total | 3,273 (71.7%) | 1,289 (28.3%) |
Female Fertility in Sedro Woolley
Fertility by Age in Sedro Woolley
Average fertility rate in Sedro Woolley is 108.0 births per 1,000 women. Women in the age bracket of 20 to 34 years have the highest fertility rate with 196.0 births per 1,000 women. Women in the age bracket of 20 to 34 years acount for 74.2% of all women with births.
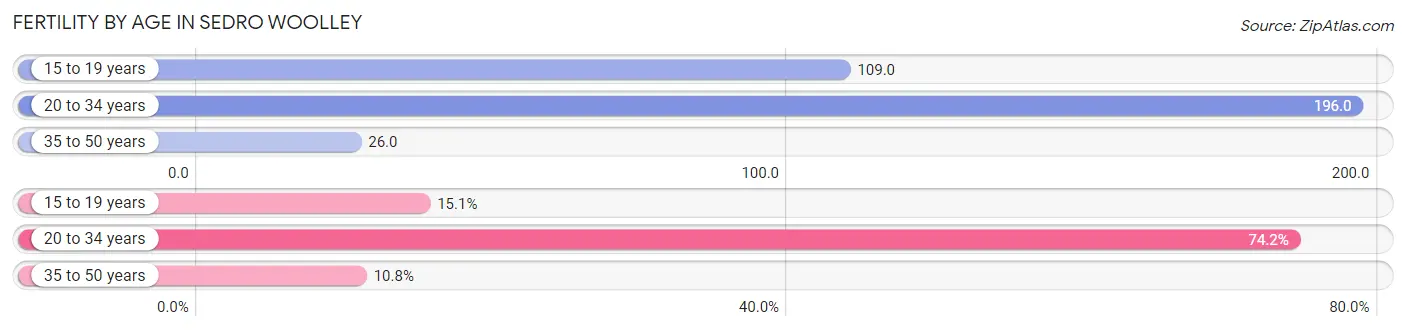
| Age Bracket | Women with Births | Births / 1,000 Women |
| 15 to 19 years | 49 (15.1%) | 109.0 |
| 20 to 34 years | 241 (74.2%) | 196.0 |
| 35 to 50 years | 35 (10.8%) | 26.0 |
| Total | 325 (100.0%) | 108.0 |
Fertility by Age by Marriage Status in Sedro Woolley
50.8% of women with births (325) in Sedro Woolley are married. The highest percentage of unmarried women with births falls into 15 to 19 years age bracket with 100.0% of them unmarried at the time of birth, while the lowest percentage of unmarried women with births belong to 35 to 50 years age bracket with 0.0% of them unmarried.
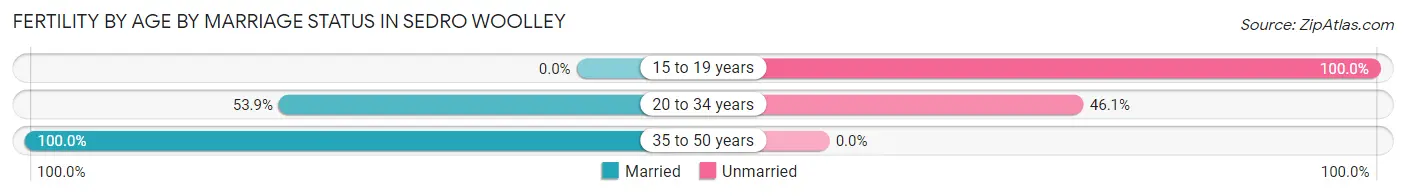
| Age Bracket | Married | Unmarried |
| 15 to 19 years | 0 (0.0%) | 49 (100.0%) |
| 20 to 34 years | 130 (53.9%) | 111 (46.1%) |
| 35 to 50 years | 35 (100.0%) | 0 (0.0%) |
| Total | 165 (50.8%) | 160 (49.2%) |
Fertility by Education in Sedro Woolley
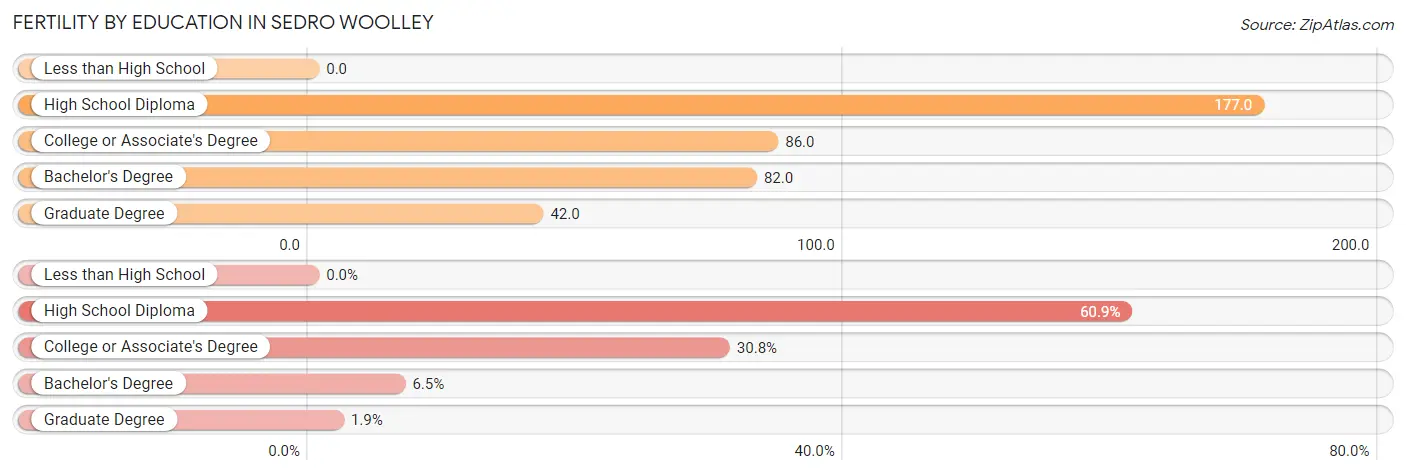
| Educational Attainment | Women with Births | Births / 1,000 Women |
| Less than High School | 0 (0.0%) | 0.0 |
| High School Diploma | 198 (60.9%) | 177.0 |
| College or Associate's Degree | 100 (30.8%) | 86.0 |
| Bachelor's Degree | 21 (6.5%) | 82.0 |
| Graduate Degree | 6 (1.8%) | 42.0 |
| Total | 325 (100.0%) | 108.0 |
Fertility by Education by Marriage Status in Sedro Woolley
49.2% of women with births in Sedro Woolley are unmarried. Women with the educational attainment of bachelor's degree are most likely to be married with 100.0% of them married at childbirth, while women with the educational attainment of high school diploma are least likely to be married with 78.3% of them unmarried at childbirth.
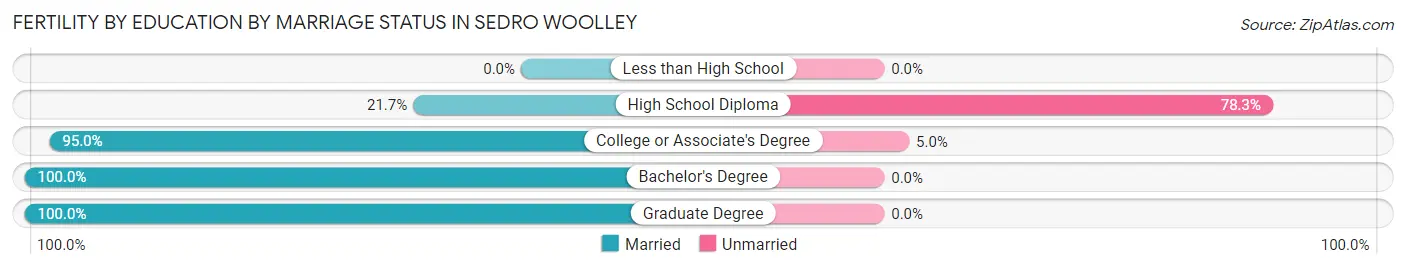
| Educational Attainment | Married | Unmarried |
| Less than High School | 0 (0.0%) | 0 (0.0%) |
| High School Diploma | 43 (21.7%) | 155 (78.3%) |
| College or Associate's Degree | 95 (95.0%) | 5 (5.0%) |
| Bachelor's Degree | 21 (100.0%) | 0 (0.0%) |
| Graduate Degree | 6 (100.0%) | 0 (0.0%) |
| Total | 165 (50.8%) | 160 (49.2%) |
Employment Characteristics in Sedro Woolley
Employment by Class of Employer in Sedro Woolley
Among the 5,525 employed individuals in Sedro Woolley, private company employees (4,038 | 73.1%), local government employees (378 | 6.8%), and not-for-profit organizations (337 | 6.1%) make up the most common classes of employment.
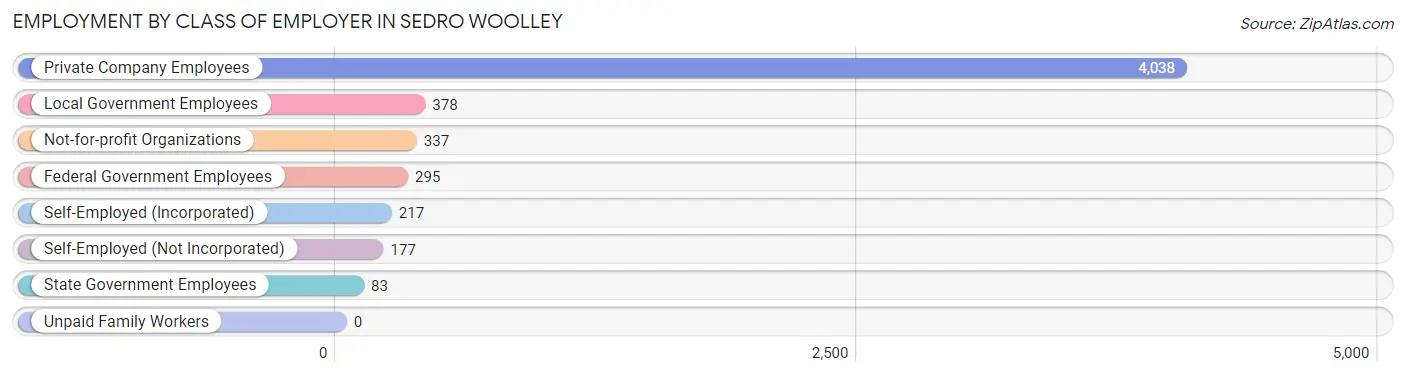
| Employer Class | # Employees | % Employees |
| Private Company Employees | 4,038 | 73.1% |
| Self-Employed (Incorporated) | 217 | 3.9% |
| Self-Employed (Not Incorporated) | 177 | 3.2% |
| Not-for-profit Organizations | 337 | 6.1% |
| Local Government Employees | 378 | 6.8% |
| State Government Employees | 83 | 1.5% |
| Federal Government Employees | 295 | 5.3% |
| Unpaid Family Workers | 0 | 0.0% |
| Total | 5,525 | 100.0% |
Employment Status by Age in Sedro Woolley
According to the labor force statistics for Sedro Woolley, out of the total population over 16 years of age (9,863), 61.1% or 6,026 individuals are in the labor force, with 4.6% or 277 of them unemployed. The age group with the highest labor force participation rate is 45 to 54 years, with 89.8% or 1,008 individuals in the labor force. Within the labor force, the 60 to 64 years age range has the highest percentage of unemployed individuals, with 15.4% or 41 of them being unemployed.
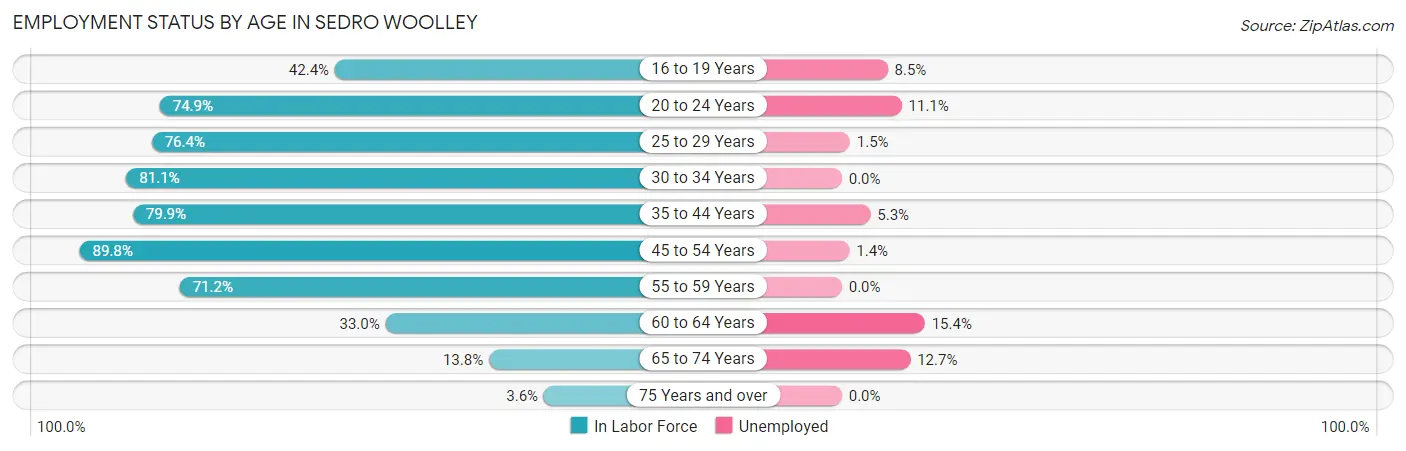
| Age Bracket | In Labor Force | Unemployed |
| 16 to 19 Years | 378 (42.4%) | 32 (8.5%) |
| 20 to 24 Years | 648 (74.9%) | 72 (11.1%) |
| 25 to 29 Years | 734 (76.4%) | 11 (1.5%) |
| 30 to 34 Years | 742 (81.1%) | 0 (0.0%) |
| 35 to 44 Years | 1,709 (79.9%) | 91 (5.3%) |
| 45 to 54 Years | 1,008 (89.8%) | 14 (1.4%) |
| 55 to 59 Years | 373 (71.2%) | 0 (0.0%) |
| 60 to 64 Years | 267 (33.0%) | 41 (15.4%) |
| 65 to 74 Years | 142 (13.8%) | 18 (12.7%) |
| 75 Years and over | 22 (3.6%) | 0 (0.0%) |
| Total | 6,026 (61.1%) | 277 (4.6%) |
Employment Status by Educational Attainment in Sedro Woolley
According to labor force statistics for Sedro Woolley, 74.7% of individuals (4,833) out of the total population between 25 and 64 years of age (6,470) are in the labor force, with 3.2% or 155 of them being unemployed. The group with the highest labor force participation rate are those with the educational attainment of bachelor's degree or higher, with 92.3% or 906 individuals in the labor force. Within the labor force, individuals with college / associate degree education have the highest percentage of unemployment, with 7.1% or 117 of them being unemployed.
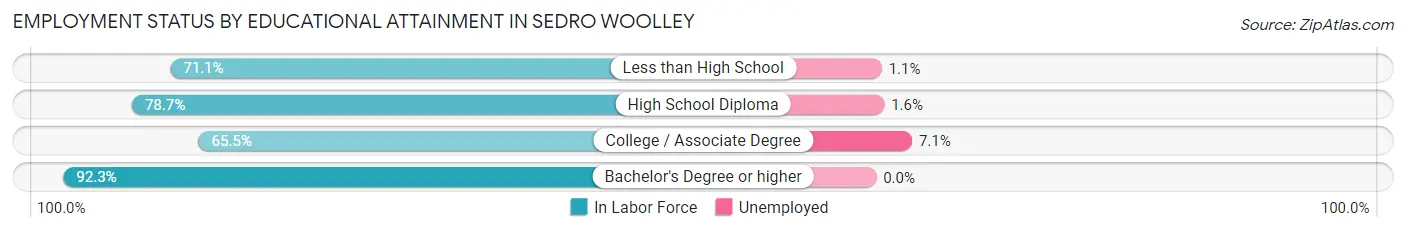
| Educational Attainment | In Labor Force | Unemployed |
| Less than High School | 547 (71.1%) | 8 (1.1%) |
| High School Diploma | 1,733 (78.7%) | 35 (1.6%) |
| College / Associate Degree | 1,649 (65.5%) | 179 (7.1%) |
| Bachelor's Degree or higher | 906 (92.3%) | 0 (0.0%) |
| Total | 4,833 (74.7%) | 207 (3.2%) |
Employment Occupations by Sex in Sedro Woolley
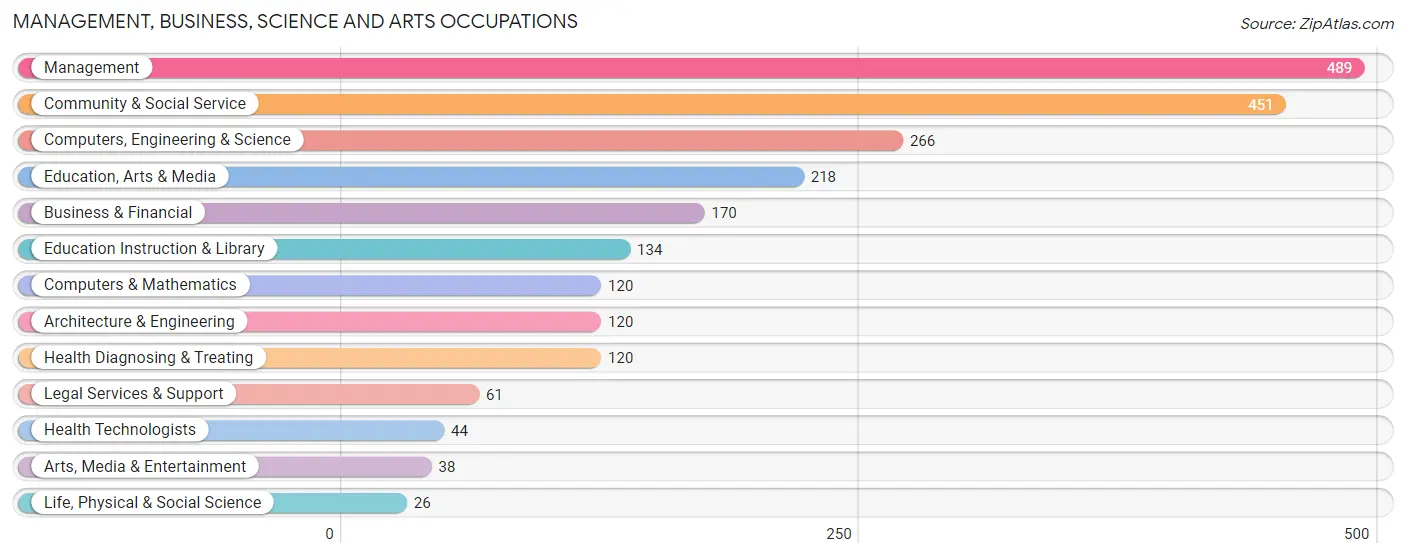
Management, Business, Science and Arts Occupations
The most common Management, Business, Science and Arts occupations in Sedro Woolley are Management (489 | 8.8%), Community & Social Service (451 | 8.1%), Computers, Engineering & Science (266 | 4.8%), Education, Arts & Media (218 | 3.9%), and Business & Financial (170 | 3.0%).
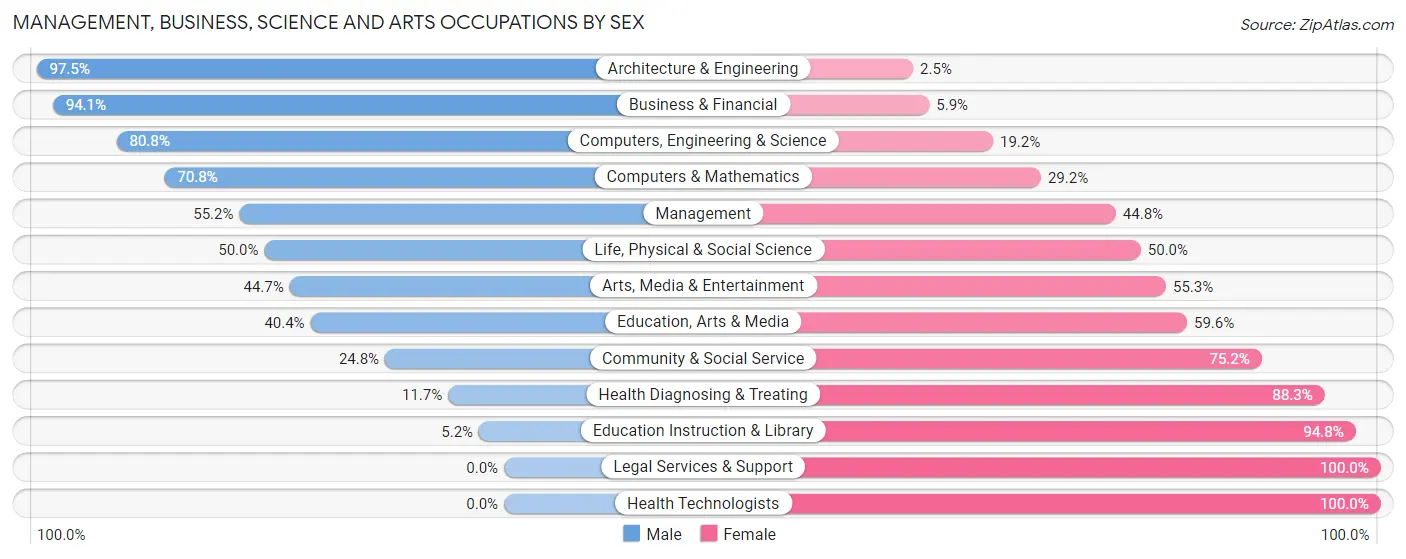
Management, Business, Science and Arts Occupations by Sex
Within the Management, Business, Science and Arts occupations in Sedro Woolley, the most male-oriented occupations are Architecture & Engineering (97.5%), Business & Financial (94.1%), and Computers, Engineering & Science (80.8%), while the most female-oriented occupations are Legal Services & Support (100.0%), Health Technologists (100.0%), and Education Instruction & Library (94.8%).
| Occupation | Male | Female |
| Management | 270 (55.2%) | 219 (44.8%) |
| Business & Financial | 160 (94.1%) | 10 (5.9%) |
| Computers, Engineering & Science | 215 (80.8%) | 51 (19.2%) |
| Computers & Mathematics | 85 (70.8%) | 35 (29.2%) |
| Architecture & Engineering | 117 (97.5%) | 3 (2.5%) |
| Life, Physical & Social Science | 13 (50.0%) | 13 (50.0%) |
| Community & Social Service | 112 (24.8%) | 339 (75.2%) |
| Education, Arts & Media | 88 (40.4%) | 130 (59.6%) |
| Legal Services & Support | 0 (0.0%) | 61 (100.0%) |
| Education Instruction & Library | 7 (5.2%) | 127 (94.8%) |
| Arts, Media & Entertainment | 17 (44.7%) | 21 (55.3%) |
| Health Diagnosing & Treating | 14 (11.7%) | 106 (88.3%) |
| Health Technologists | 0 (0.0%) | 44 (100.0%) |
| Total (Category) | 771 (51.5%) | 725 (48.5%) |
| Total (Overall) | 3,417 (61.4%) | 2,152 (38.6%) |
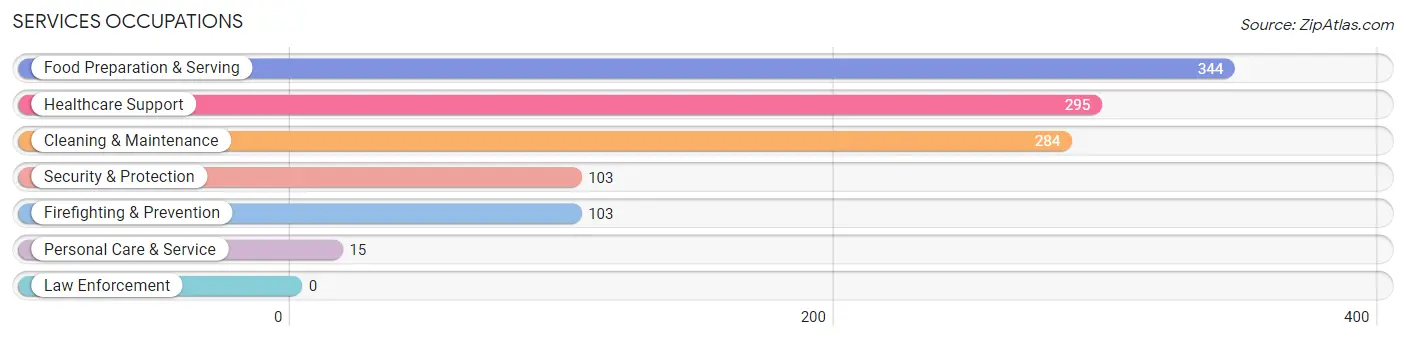
Services Occupations
The most common Services occupations in Sedro Woolley are Food Preparation & Serving (344 | 6.2%), Healthcare Support (295 | 5.3%), Cleaning & Maintenance (284 | 5.1%), Security & Protection (103 | 1.8%), and Firefighting & Prevention (103 | 1.8%).
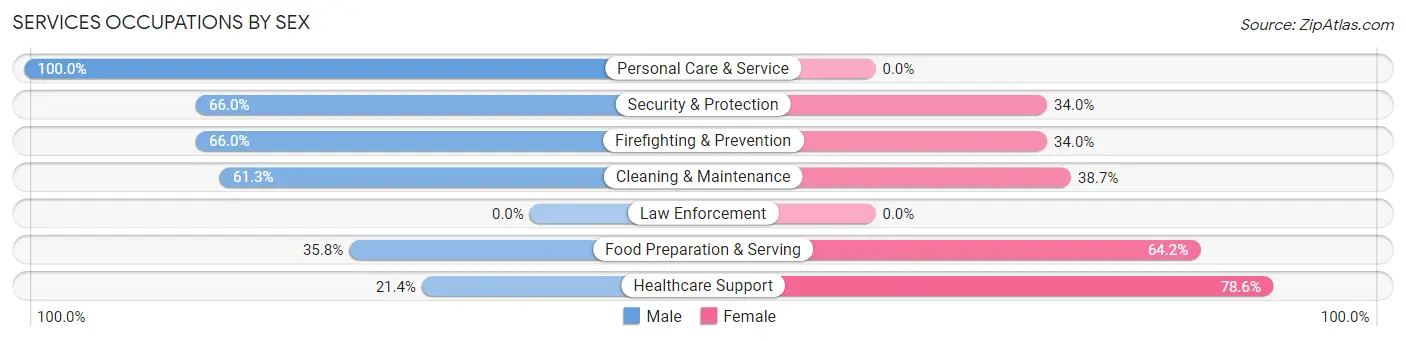
Services Occupations by Sex
Within the Services occupations in Sedro Woolley, the most male-oriented occupations are Personal Care & Service (100.0%), Security & Protection (66.0%), and Firefighting & Prevention (66.0%), while the most female-oriented occupations are Healthcare Support (78.6%), Food Preparation & Serving (64.2%), and Cleaning & Maintenance (38.7%).
| Occupation | Male | Female |
| Healthcare Support | 63 (21.4%) | 232 (78.6%) |
| Security & Protection | 68 (66.0%) | 35 (34.0%) |
| Firefighting & Prevention | 68 (66.0%) | 35 (34.0%) |
| Law Enforcement | 0 (0.0%) | 0 (0.0%) |
| Food Preparation & Serving | 123 (35.8%) | 221 (64.2%) |
| Cleaning & Maintenance | 174 (61.3%) | 110 (38.7%) |
| Personal Care & Service | 15 (100.0%) | 0 (0.0%) |
| Total (Category) | 443 (42.6%) | 598 (57.4%) |
| Total (Overall) | 3,417 (61.4%) | 2,152 (38.6%) |
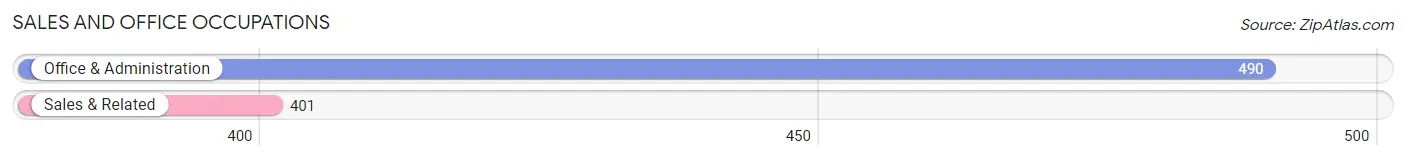
Sales and Office Occupations
The most common Sales and Office occupations in Sedro Woolley are Office & Administration (490 | 8.8%), and Sales & Related (401 | 7.2%).
Sales and Office Occupations by Sex
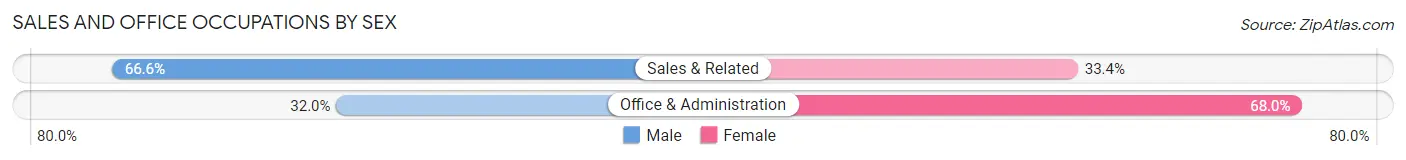
| Occupation | Male | Female |
| Sales & Related | 267 (66.6%) | 134 (33.4%) |
| Office & Administration | 157 (32.0%) | 333 (68.0%) |
| Total (Category) | 424 (47.6%) | 467 (52.4%) |
| Total (Overall) | 3,417 (61.4%) | 2,152 (38.6%) |
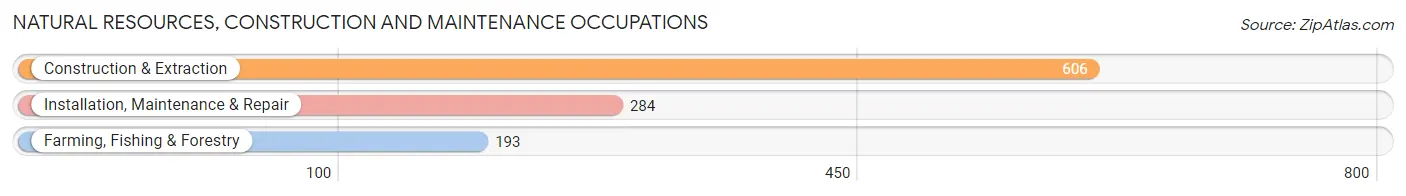
Natural Resources, Construction and Maintenance Occupations
The most common Natural Resources, Construction and Maintenance occupations in Sedro Woolley are Construction & Extraction (606 | 10.9%), Installation, Maintenance & Repair (284 | 5.1%), and Farming, Fishing & Forestry (193 | 3.5%).
Natural Resources, Construction and Maintenance Occupations by Sex
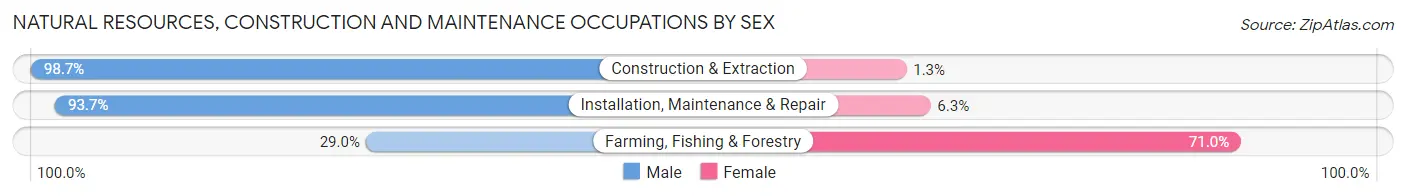
| Occupation | Male | Female |
| Farming, Fishing & Forestry | 56 (29.0%) | 137 (71.0%) |
| Construction & Extraction | 598 (98.7%) | 8 (1.3%) |
| Installation, Maintenance & Repair | 266 (93.7%) | 18 (6.3%) |
| Total (Category) | 920 (85.0%) | 163 (15.0%) |
| Total (Overall) | 3,417 (61.4%) | 2,152 (38.6%) |
Production, Transportation and Moving Occupations
The most common Production, Transportation and Moving occupations in Sedro Woolley are Production (446 | 8.0%), Transportation (342 | 6.1%), and Material Moving (270 | 4.9%).
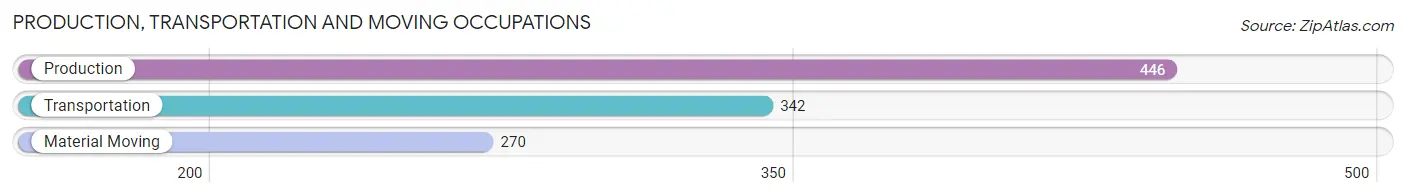
Production, Transportation and Moving Occupations by Sex
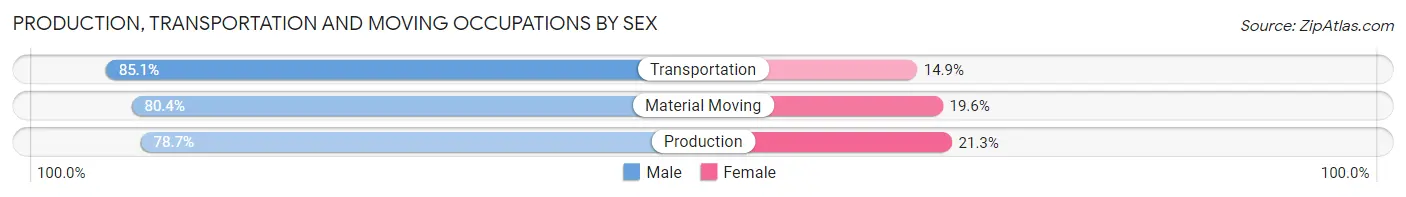
| Occupation | Male | Female |
| Production | 351 (78.7%) | 95 (21.3%) |
| Transportation | 291 (85.1%) | 51 (14.9%) |
| Material Moving | 217 (80.4%) | 53 (19.6%) |
| Total (Category) | 859 (81.2%) | 199 (18.8%) |
| Total (Overall) | 3,417 (61.4%) | 2,152 (38.6%) |
Employment Industries by Sex in Sedro Woolley
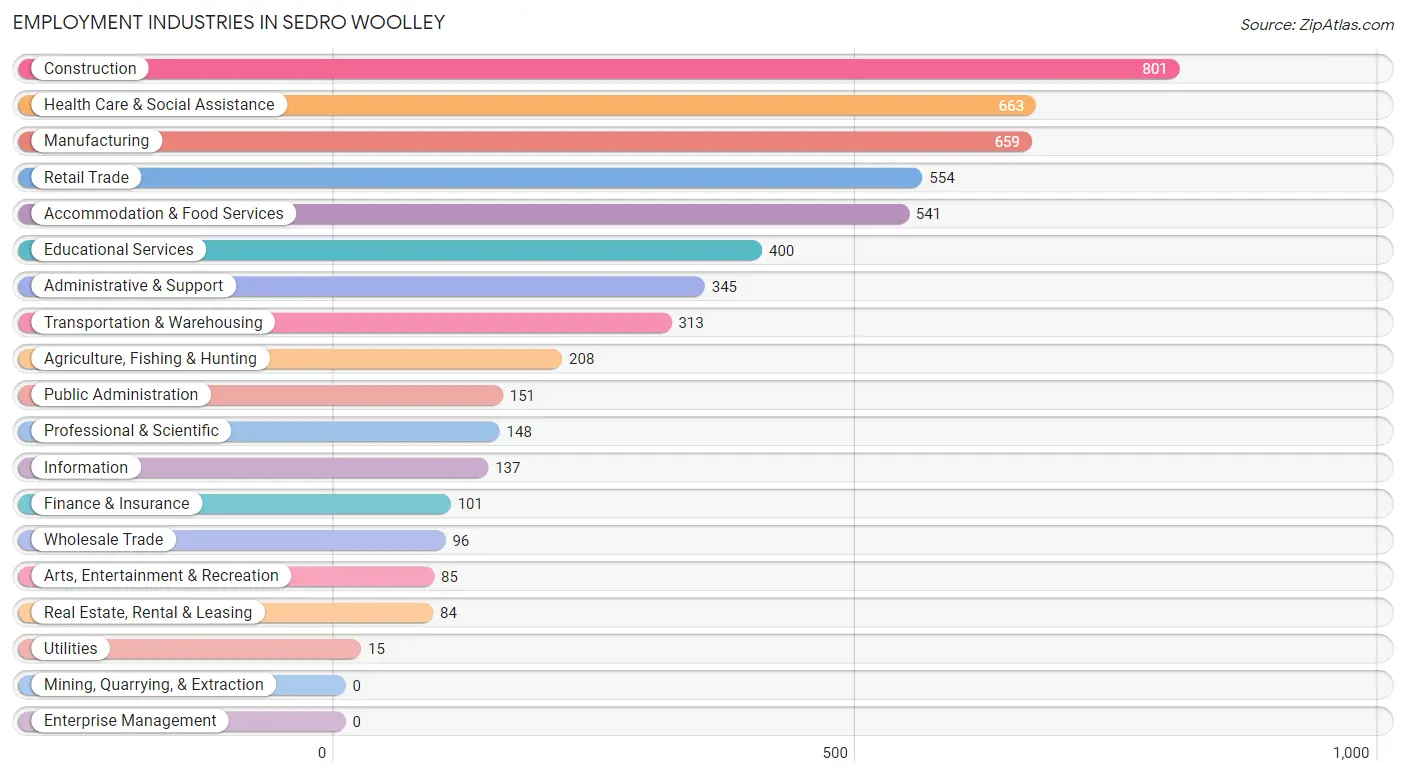
Employment Industries in Sedro Woolley
The major employment industries in Sedro Woolley include Construction (801 | 14.4%), Health Care & Social Assistance (663 | 11.9%), Manufacturing (659 | 11.8%), Retail Trade (554 | 10.0%), and Accommodation & Food Services (541 | 9.7%).
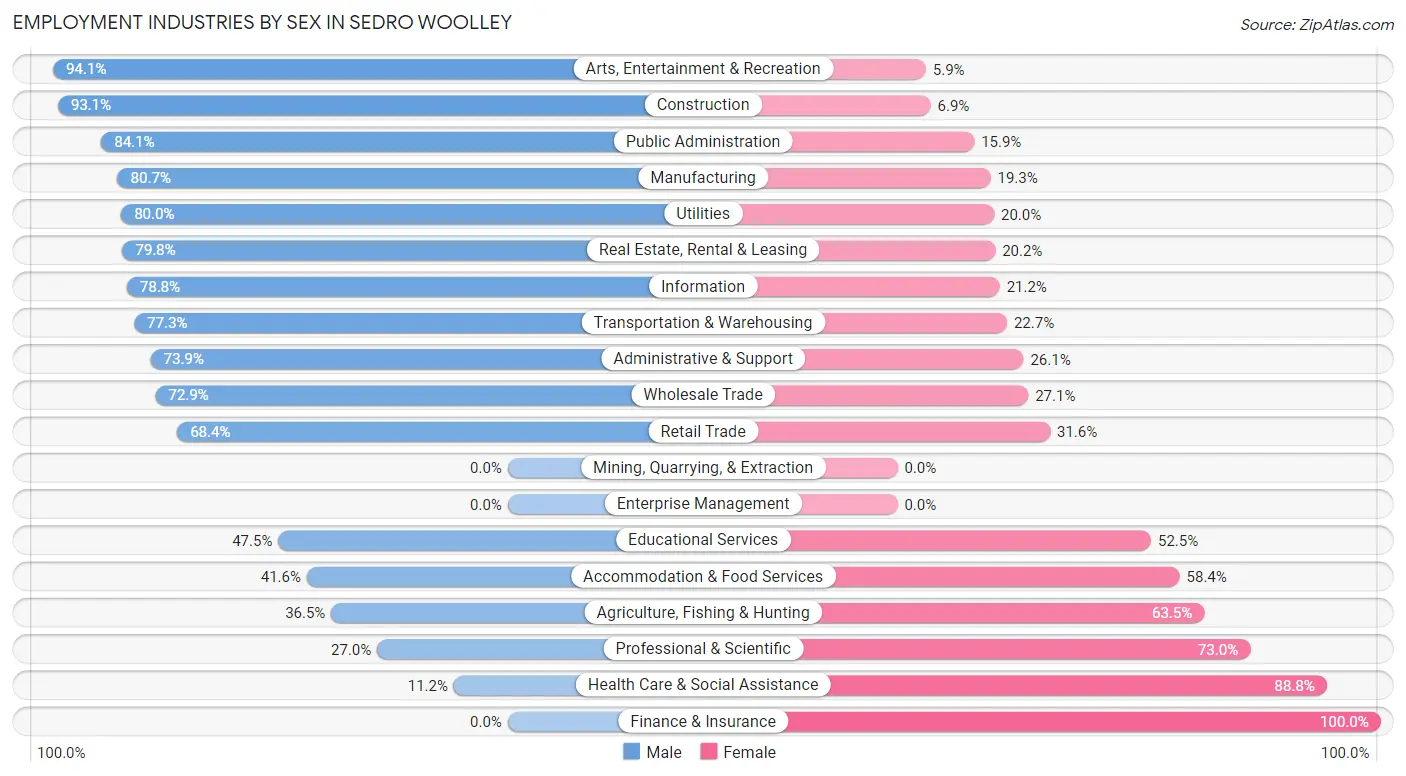
Employment Industries by Sex in Sedro Woolley
The Sedro Woolley industries that see more men than women are Arts, Entertainment & Recreation (94.1%), Construction (93.1%), and Public Administration (84.1%), whereas the industries that tend to have a higher number of women are Finance & Insurance (100.0%), Health Care & Social Assistance (88.8%), and Professional & Scientific (73.0%).
| Industry | Male | Female |
| Agriculture, Fishing & Hunting | 76 (36.5%) | 132 (63.5%) |
| Mining, Quarrying, & Extraction | 0 (0.0%) | 0 (0.0%) |
| Construction | 746 (93.1%) | 55 (6.9%) |
| Manufacturing | 532 (80.7%) | 127 (19.3%) |
| Wholesale Trade | 70 (72.9%) | 26 (27.1%) |
| Retail Trade | 379 (68.4%) | 175 (31.6%) |
| Transportation & Warehousing | 242 (77.3%) | 71 (22.7%) |
| Utilities | 12 (80.0%) | 3 (20.0%) |
| Information | 108 (78.8%) | 29 (21.2%) |
| Finance & Insurance | 0 (0.0%) | 101 (100.0%) |
| Real Estate, Rental & Leasing | 67 (79.8%) | 17 (20.2%) |
| Professional & Scientific | 40 (27.0%) | 108 (73.0%) |
| Enterprise Management | 0 (0.0%) | 0 (0.0%) |
| Administrative & Support | 255 (73.9%) | 90 (26.1%) |
| Educational Services | 190 (47.5%) | 210 (52.5%) |
| Health Care & Social Assistance | 74 (11.2%) | 589 (88.8%) |
| Arts, Entertainment & Recreation | 80 (94.1%) | 5 (5.9%) |
| Accommodation & Food Services | 225 (41.6%) | 316 (58.4%) |
| Public Administration | 127 (84.1%) | 24 (15.9%) |
| Total | 3,417 (61.4%) | 2,152 (38.6%) |
Education in Sedro Woolley
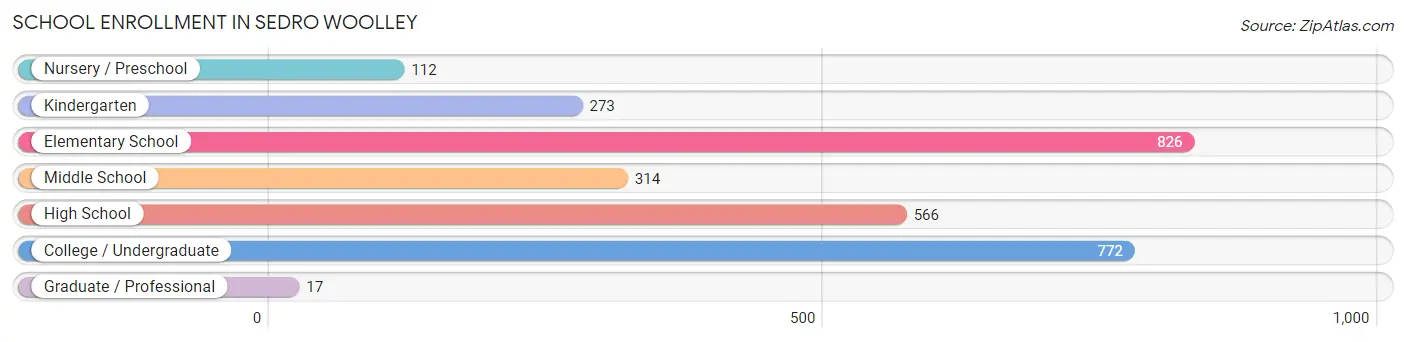
School Enrollment in Sedro Woolley
The most common levels of schooling among the 2,880 students in Sedro Woolley are elementary school (826 | 28.7%), college / undergraduate (772 | 26.8%), and high school (566 | 19.7%).
| School Level | # Students | % Students |
| Nursery / Preschool | 112 | 3.9% |
| Kindergarten | 273 | 9.5% |
| Elementary School | 826 | 28.7% |
| Middle School | 314 | 10.9% |
| High School | 566 | 19.7% |
| College / Undergraduate | 772 | 26.8% |
| Graduate / Professional | 17 | 0.6% |
| Total | 2,880 | 100.0% |
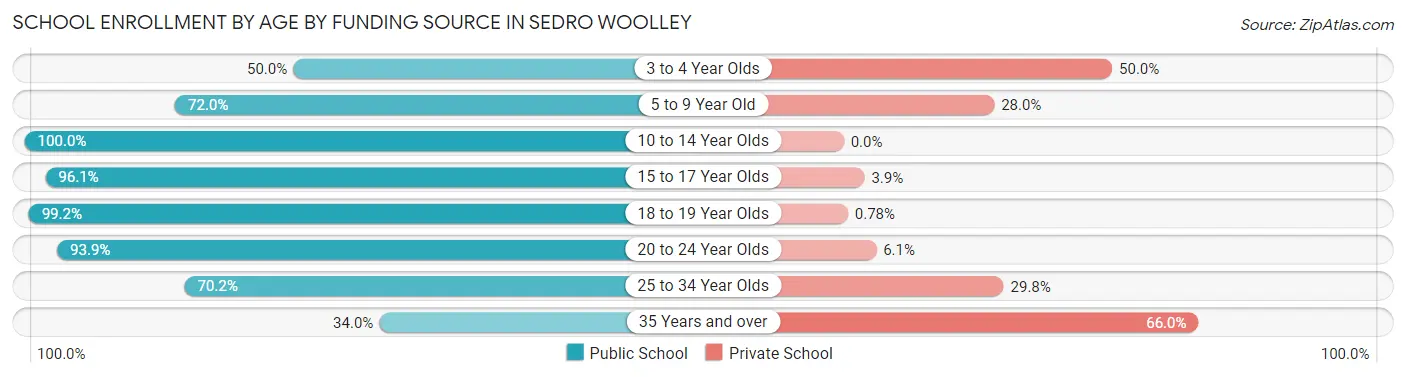
School Enrollment by Age by Funding Source in Sedro Woolley
Out of a total of 2,880 students who are enrolled in schools in Sedro Woolley, 582 (20.2%) attend a private institution, while the remaining 2,298 (79.8%) are enrolled in public schools. The age group of 35 years and over has the highest likelihood of being enrolled in private schools, with 177 (66.0% in the age bracket) enrolled. Conversely, the age group of 10 to 14 year olds has the lowest likelihood of being enrolled in a private school, with 455 (100.0% in the age bracket) attending a public institution.
| Age Bracket | Public School | Private School |
| 3 to 4 Year Olds | 83 (50.0%) | 83 (50.0%) |
| 5 to 9 Year Old | 680 (72.0%) | 265 (28.0%) |
| 10 to 14 Year Olds | 455 (100.0%) | 0 (0.0%) |
| 15 to 17 Year Olds | 322 (96.1%) | 13 (3.9%) |
| 18 to 19 Year Olds | 383 (99.2%) | 3 (0.8%) |
| 20 to 24 Year Olds | 217 (93.9%) | 14 (6.1%) |
| 25 to 34 Year Olds | 66 (70.2%) | 28 (29.8%) |
| 35 Years and over | 91 (34.0%) | 177 (66.0%) |
| Total | 2,298 (79.8%) | 582 (20.2%) |
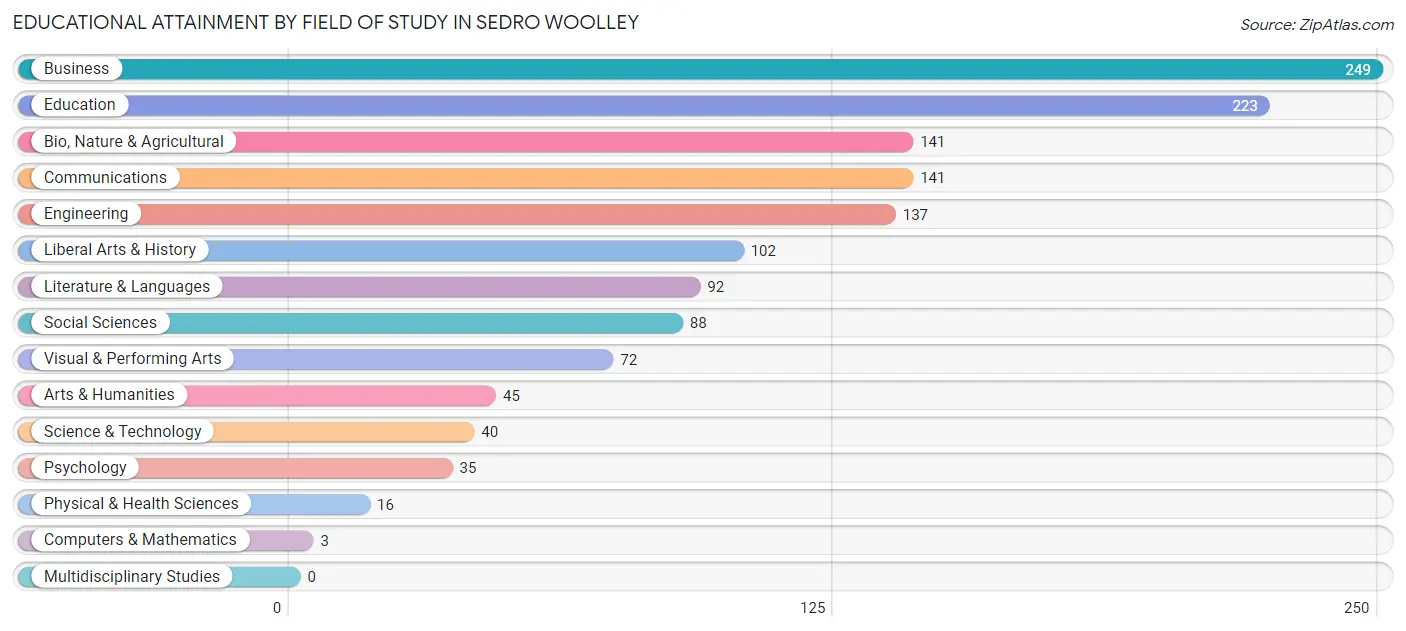
Educational Attainment by Field of Study in Sedro Woolley
Business (249 | 18.0%), education (223 | 16.1%), bio, nature & agricultural (141 | 10.2%), communications (141 | 10.2%), and engineering (137 | 9.9%) are the most common fields of study among 1,384 individuals in Sedro Woolley who have obtained a bachelor's degree or higher.
| Field of Study | # Graduates | % Graduates |
| Computers & Mathematics | 3 | 0.2% |
| Bio, Nature & Agricultural | 141 | 10.2% |
| Physical & Health Sciences | 16 | 1.2% |
| Psychology | 35 | 2.5% |
| Social Sciences | 88 | 6.4% |
| Engineering | 137 | 9.9% |
| Multidisciplinary Studies | 0 | 0.0% |
| Science & Technology | 40 | 2.9% |
| Business | 249 | 18.0% |
| Education | 223 | 16.1% |
| Literature & Languages | 92 | 6.7% |
| Liberal Arts & History | 102 | 7.4% |
| Visual & Performing Arts | 72 | 5.2% |
| Communications | 141 | 10.2% |
| Arts & Humanities | 45 | 3.3% |
| Total | 1,384 | 100.0% |
Transportation & Commute in Sedro Woolley
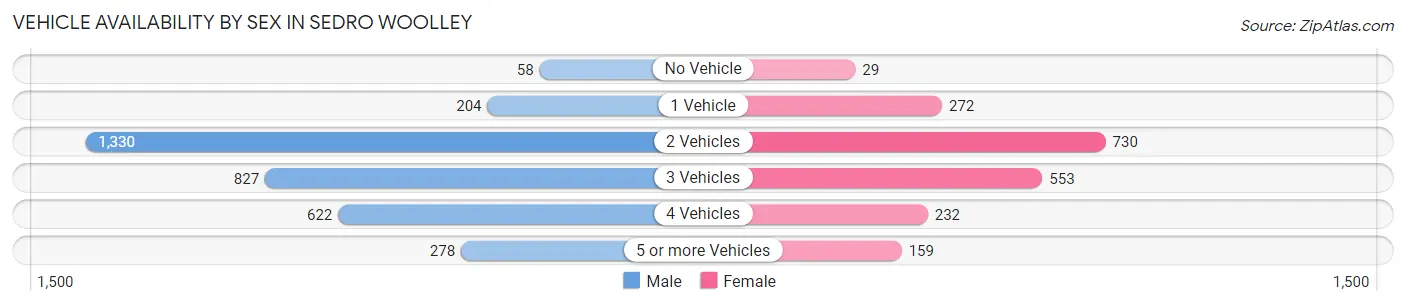
Vehicle Availability by Sex in Sedro Woolley
The most prevalent vehicle ownership categories in Sedro Woolley are males with 2 vehicles (1,330, accounting for 40.1%) and females with 2 vehicles (730, making up 67.3%).
| Vehicles Available | Male | Female |
| No Vehicle | 58 (1.8%) | 29 (1.5%) |
| 1 Vehicle | 204 (6.1%) | 272 (13.8%) |
| 2 Vehicles | 1,330 (40.1%) | 730 (37.0%) |
| 3 Vehicles | 827 (24.9%) | 553 (28.0%) |
| 4 Vehicles | 622 (18.7%) | 232 (11.7%) |
| 5 or more Vehicles | 278 (8.4%) | 159 (8.1%) |
| Total | 3,319 (100.0%) | 1,975 (100.0%) |
Commute Time in Sedro Woolley
The most frequently occuring commute durations in Sedro Woolley are 20 to 24 minutes (766 commuters, 15.4%), 15 to 19 minutes (669 commuters, 13.4%), and 30 to 34 minutes (595 commuters, 11.9%).
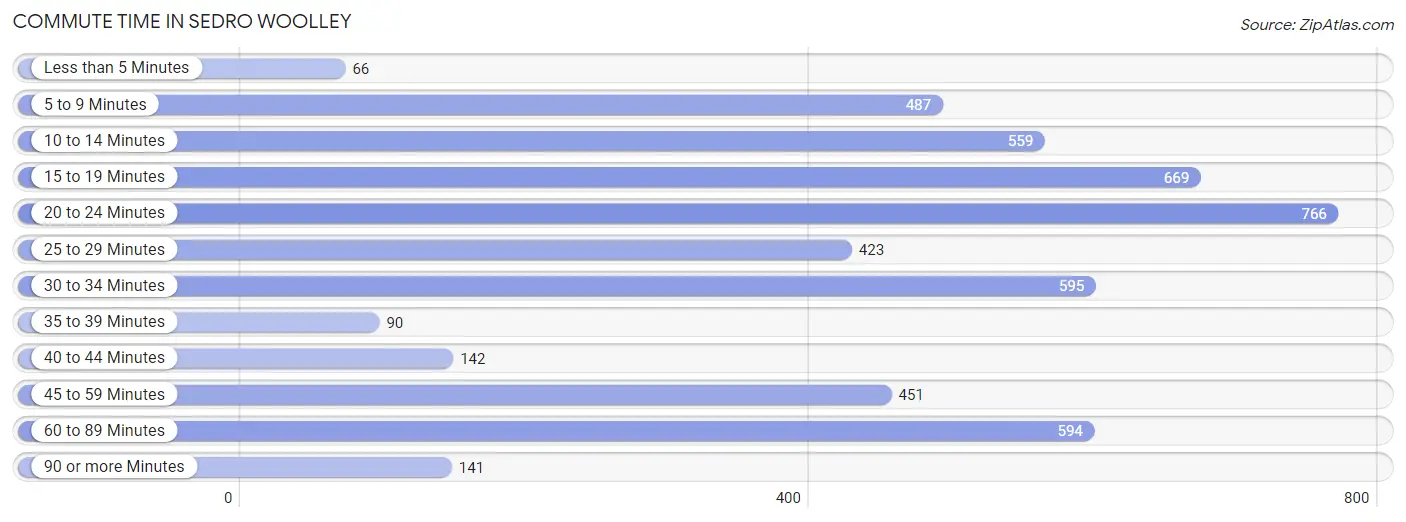
| Commute Time | # Commuters | % Commuters |
| Less than 5 Minutes | 66 | 1.3% |
| 5 to 9 Minutes | 487 | 9.8% |
| 10 to 14 Minutes | 559 | 11.2% |
| 15 to 19 Minutes | 669 | 13.4% |
| 20 to 24 Minutes | 766 | 15.4% |
| 25 to 29 Minutes | 423 | 8.5% |
| 30 to 34 Minutes | 595 | 11.9% |
| 35 to 39 Minutes | 90 | 1.8% |
| 40 to 44 Minutes | 142 | 2.9% |
| 45 to 59 Minutes | 451 | 9.0% |
| 60 to 89 Minutes | 594 | 11.9% |
| 90 or more Minutes | 141 | 2.8% |
Commute Time by Sex in Sedro Woolley
The most common commute times in Sedro Woolley are 60 to 89 minutes (496 commuters, 15.8%) for males and 20 to 24 minutes (337 commuters, 18.3%) for females.
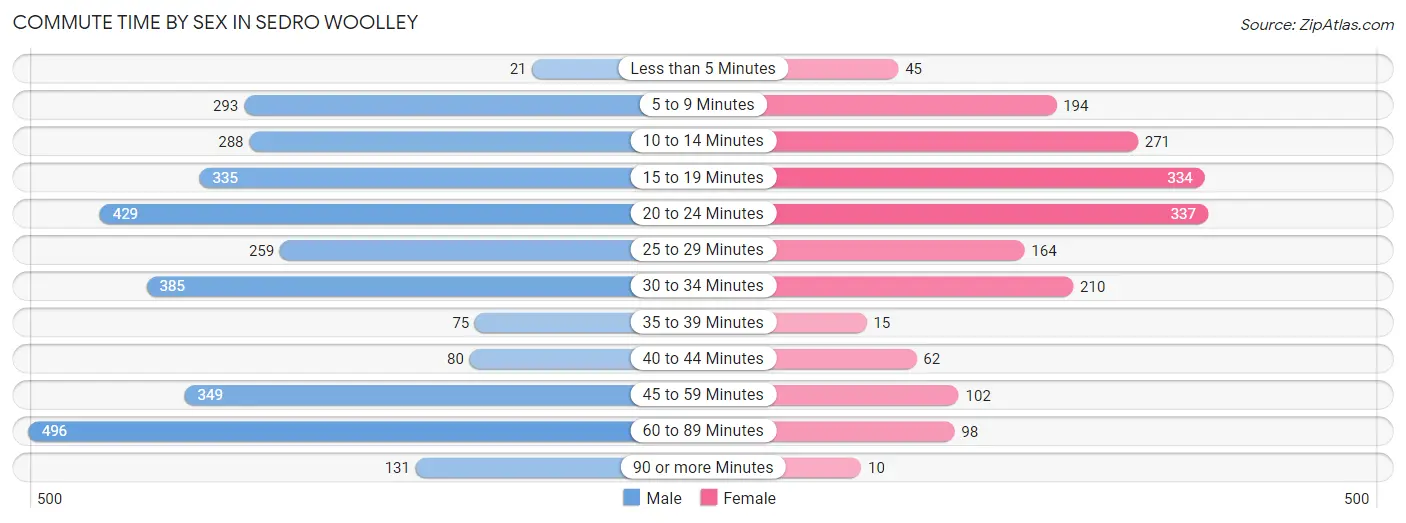
| Commute Time | Male | Female |
| Less than 5 Minutes | 21 (0.7%) | 45 (2.4%) |
| 5 to 9 Minutes | 293 (9.3%) | 194 (10.5%) |
| 10 to 14 Minutes | 288 (9.2%) | 271 (14.7%) |
| 15 to 19 Minutes | 335 (10.7%) | 334 (18.1%) |
| 20 to 24 Minutes | 429 (13.7%) | 337 (18.3%) |
| 25 to 29 Minutes | 259 (8.3%) | 164 (8.9%) |
| 30 to 34 Minutes | 385 (12.3%) | 210 (11.4%) |
| 35 to 39 Minutes | 75 (2.4%) | 15 (0.8%) |
| 40 to 44 Minutes | 80 (2.5%) | 62 (3.4%) |
| 45 to 59 Minutes | 349 (11.1%) | 102 (5.5%) |
| 60 to 89 Minutes | 496 (15.8%) | 98 (5.3%) |
| 90 or more Minutes | 131 (4.2%) | 10 (0.5%) |
Time of Departure to Work by Sex in Sedro Woolley
The most frequent times of departure to work in Sedro Woolley are 12:00 AM to 4:59 AM (605, 19.3%) for males and 6:30 AM to 6:59 AM (309, 16.8%) for females.
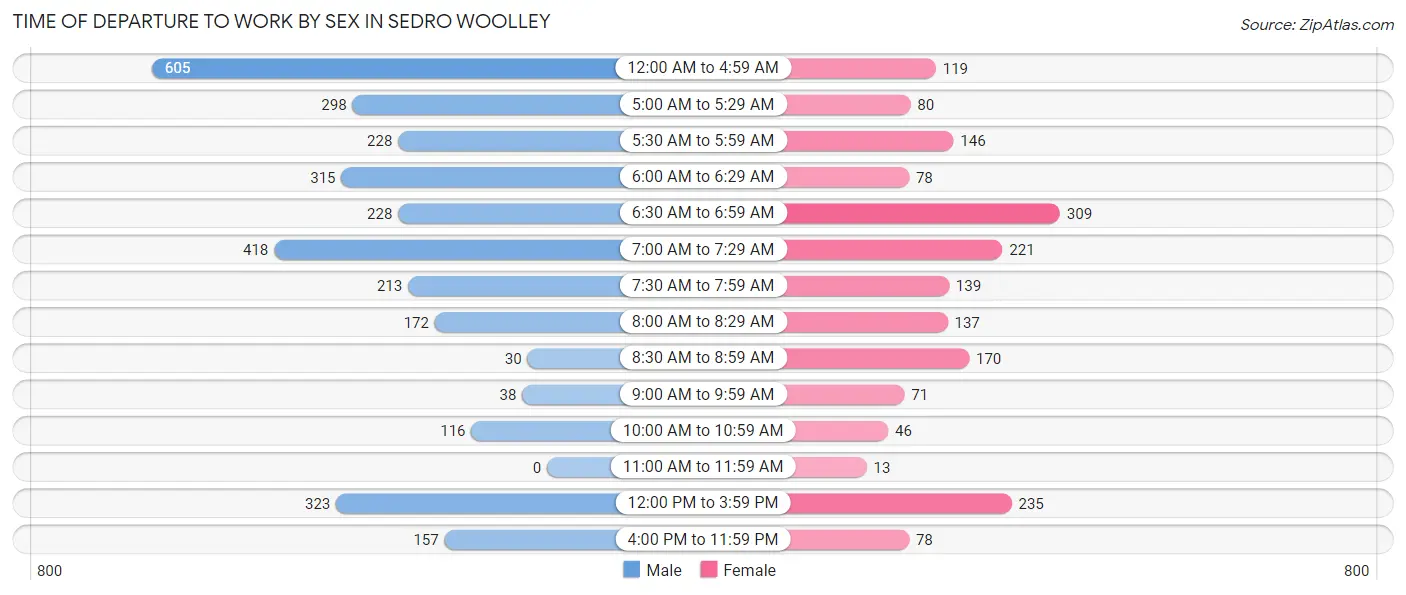
| Time of Departure | Male | Female |
| 12:00 AM to 4:59 AM | 605 (19.3%) | 119 (6.5%) |
| 5:00 AM to 5:29 AM | 298 (9.5%) | 80 (4.3%) |
| 5:30 AM to 5:59 AM | 228 (7.3%) | 146 (7.9%) |
| 6:00 AM to 6:29 AM | 315 (10.0%) | 78 (4.2%) |
| 6:30 AM to 6:59 AM | 228 (7.3%) | 309 (16.8%) |
| 7:00 AM to 7:29 AM | 418 (13.3%) | 221 (12.0%) |
| 7:30 AM to 7:59 AM | 213 (6.8%) | 139 (7.5%) |
| 8:00 AM to 8:29 AM | 172 (5.5%) | 137 (7.4%) |
| 8:30 AM to 8:59 AM | 30 (1.0%) | 170 (9.2%) |
| 9:00 AM to 9:59 AM | 38 (1.2%) | 71 (3.8%) |
| 10:00 AM to 10:59 AM | 116 (3.7%) | 46 (2.5%) |
| 11:00 AM to 11:59 AM | 0 (0.0%) | 13 (0.7%) |
| 12:00 PM to 3:59 PM | 323 (10.3%) | 235 (12.8%) |
| 4:00 PM to 11:59 PM | 157 (5.0%) | 78 (4.2%) |
| Total | 3,141 (100.0%) | 1,842 (100.0%) |
Housing Occupancy in Sedro Woolley
Occupancy by Ownership in Sedro Woolley
Of the total 4,562 dwellings in Sedro Woolley, owner-occupied units account for 2,685 (58.9%), while renter-occupied units make up 1,877 (41.1%).
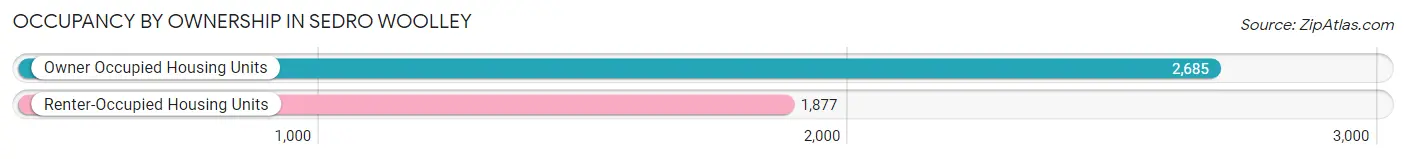
| Occupancy | # Housing Units | % Housing Units |
| Owner Occupied Housing Units | 2,685 | 58.9% |
| Renter-Occupied Housing Units | 1,877 | 41.1% |
| Total Occupied Housing Units | 4,562 | 100.0% |
Occupancy by Household Size in Sedro Woolley
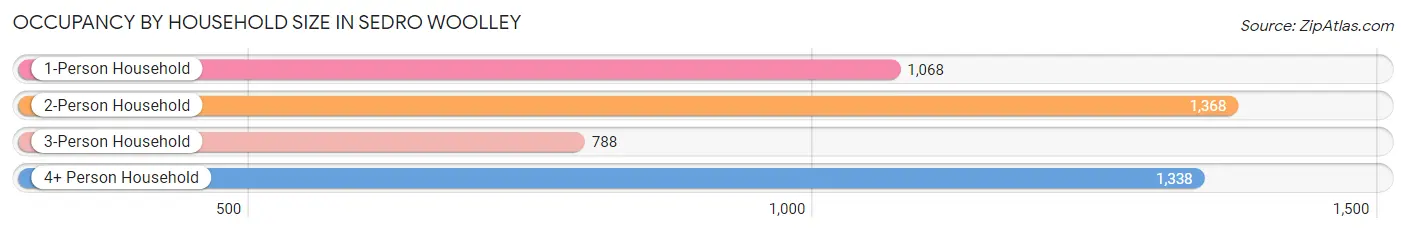
| Household Size | # Housing Units | % Housing Units |
| 1-Person Household | 1,068 | 23.4% |
| 2-Person Household | 1,368 | 30.0% |
| 3-Person Household | 788 | 17.3% |
| 4+ Person Household | 1,338 | 29.3% |
| Total Housing Units | 4,562 | 100.0% |
Occupancy by Ownership by Household Size in Sedro Woolley
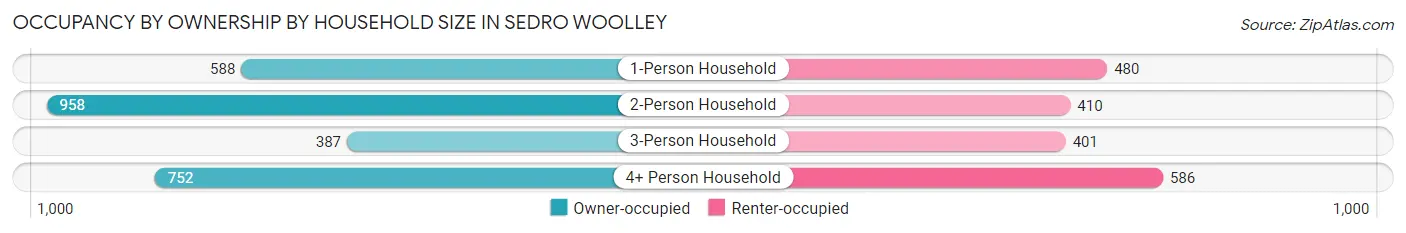
| Household Size | Owner-occupied | Renter-occupied |
| 1-Person Household | 588 (55.1%) | 480 (44.9%) |
| 2-Person Household | 958 (70.0%) | 410 (30.0%) |
| 3-Person Household | 387 (49.1%) | 401 (50.9%) |
| 4+ Person Household | 752 (56.2%) | 586 (43.8%) |
| Total Housing Units | 2,685 (58.9%) | 1,877 (41.1%) |
Occupancy by Educational Attainment in Sedro Woolley
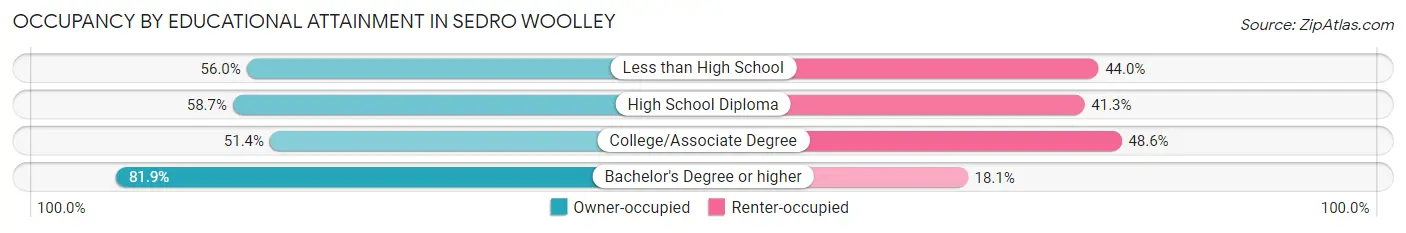
| Household Size | Owner-occupied | Renter-occupied |
| Less than High School | 276 (56.0%) | 217 (44.0%) |
| High School Diploma | 838 (58.7%) | 589 (41.3%) |
| College/Associate Degree | 997 (51.4%) | 944 (48.6%) |
| Bachelor's Degree or higher | 574 (81.9%) | 127 (18.1%) |
Occupancy by Age of Householder in Sedro Woolley
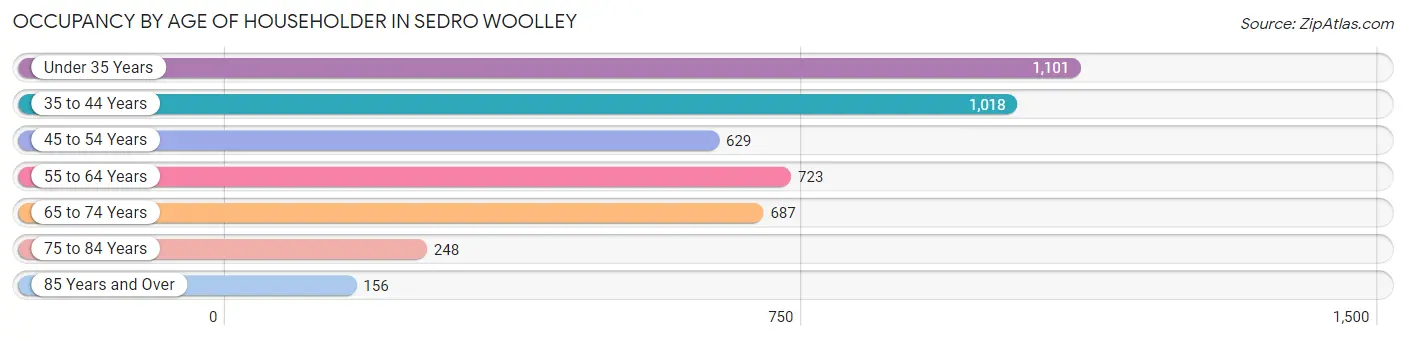
| Age Bracket | # Households | % Households |
| Under 35 Years | 1,101 | 24.1% |
| 35 to 44 Years | 1,018 | 22.3% |
| 45 to 54 Years | 629 | 13.8% |
| 55 to 64 Years | 723 | 15.9% |
| 65 to 74 Years | 687 | 15.1% |
| 75 to 84 Years | 248 | 5.4% |
| 85 Years and Over | 156 | 3.4% |
| Total | 4,562 | 100.0% |
Housing Finances in Sedro Woolley
Median Income by Occupancy in Sedro Woolley
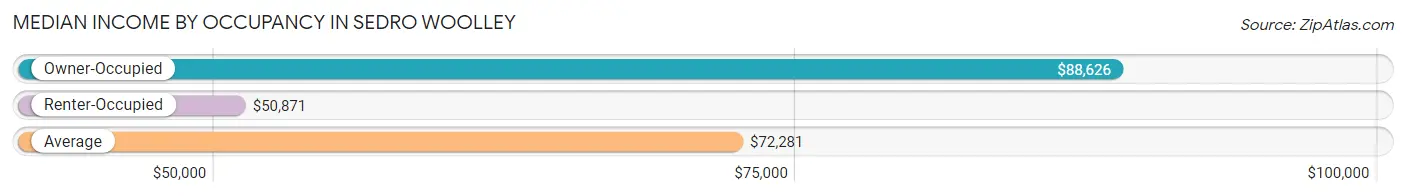
| Occupancy Type | # Households | Median Income |
| Owner-Occupied | 2,685 (58.9%) | $88,626 |
| Renter-Occupied | 1,877 (41.1%) | $50,871 |
| Average | 4,562 (100.0%) | $72,281 |
Occupancy by Householder Income Bracket in Sedro Woolley
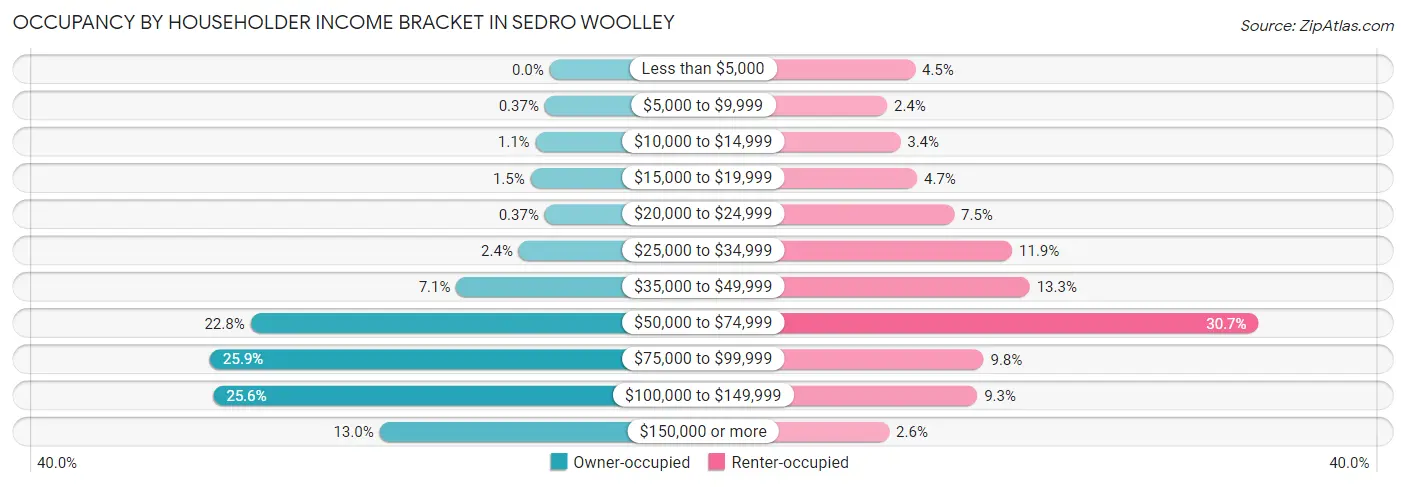
| Income Bracket | Owner-occupied | Renter-occupied |
| Less than $5,000 | 0 (0.0%) | 85 (4.5%) |
| $5,000 to $9,999 | 10 (0.4%) | 45 (2.4%) |
| $10,000 to $14,999 | 29 (1.1%) | 64 (3.4%) |
| $15,000 to $19,999 | 39 (1.5%) | 88 (4.7%) |
| $20,000 to $24,999 | 10 (0.4%) | 141 (7.5%) |
| $25,000 to $34,999 | 63 (2.4%) | 224 (11.9%) |
| $35,000 to $49,999 | 191 (7.1%) | 249 (13.3%) |
| $50,000 to $74,999 | 612 (22.8%) | 576 (30.7%) |
| $75,000 to $99,999 | 695 (25.9%) | 183 (9.8%) |
| $100,000 to $149,999 | 688 (25.6%) | 174 (9.3%) |
| $150,000 or more | 348 (13.0%) | 48 (2.6%) |
| Total | 2,685 (100.0%) | 1,877 (100.0%) |
Monthly Housing Cost Tiers in Sedro Woolley
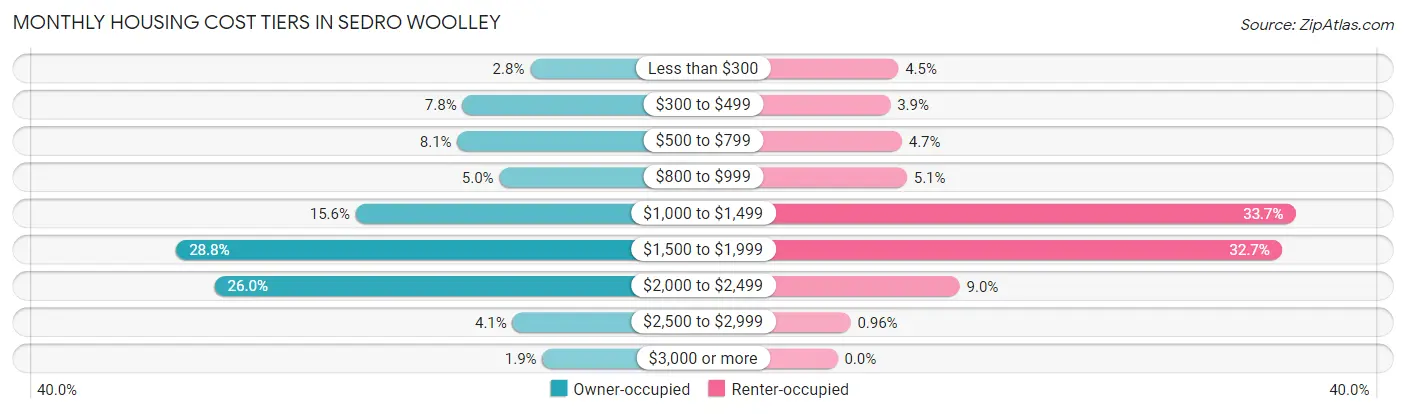
| Monthly Cost | Owner-occupied | Renter-occupied |
| Less than $300 | 74 (2.8%) | 84 (4.5%) |
| $300 to $499 | 208 (7.7%) | 73 (3.9%) |
| $500 to $799 | 218 (8.1%) | 89 (4.7%) |
| $800 to $999 | 135 (5.0%) | 96 (5.1%) |
| $1,000 to $1,499 | 419 (15.6%) | 633 (33.7%) |
| $1,500 to $1,999 | 774 (28.8%) | 614 (32.7%) |
| $2,000 to $2,499 | 698 (26.0%) | 169 (9.0%) |
| $2,500 to $2,999 | 109 (4.1%) | 18 (1.0%) |
| $3,000 or more | 50 (1.9%) | 0 (0.0%) |
| Total | 2,685 (100.0%) | 1,877 (100.0%) |
Physical Housing Characteristics in Sedro Woolley
Housing Structures in Sedro Woolley
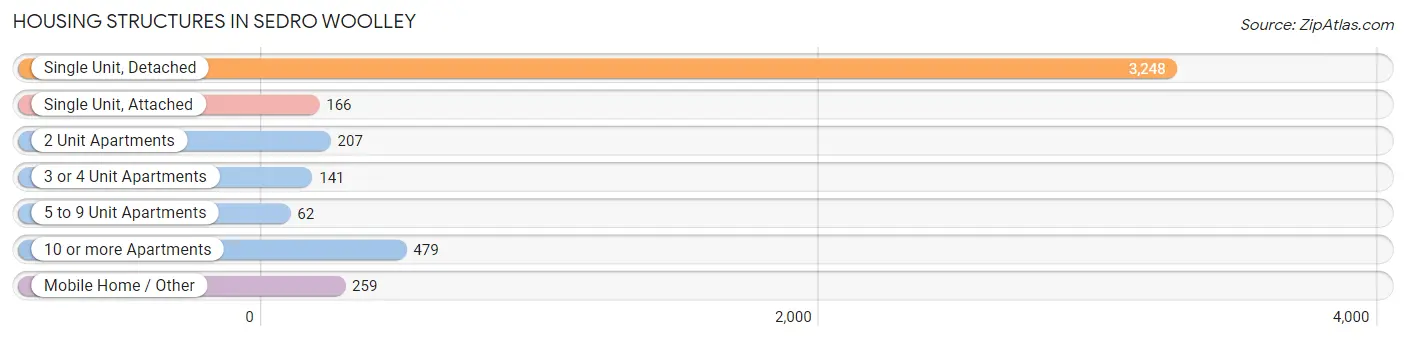
| Structure Type | # Housing Units | % Housing Units |
| Single Unit, Detached | 3,248 | 71.2% |
| Single Unit, Attached | 166 | 3.6% |
| 2 Unit Apartments | 207 | 4.5% |
| 3 or 4 Unit Apartments | 141 | 3.1% |
| 5 to 9 Unit Apartments | 62 | 1.4% |
| 10 or more Apartments | 479 | 10.5% |
| Mobile Home / Other | 259 | 5.7% |
| Total | 4,562 | 100.0% |
Housing Structures by Occupancy in Sedro Woolley
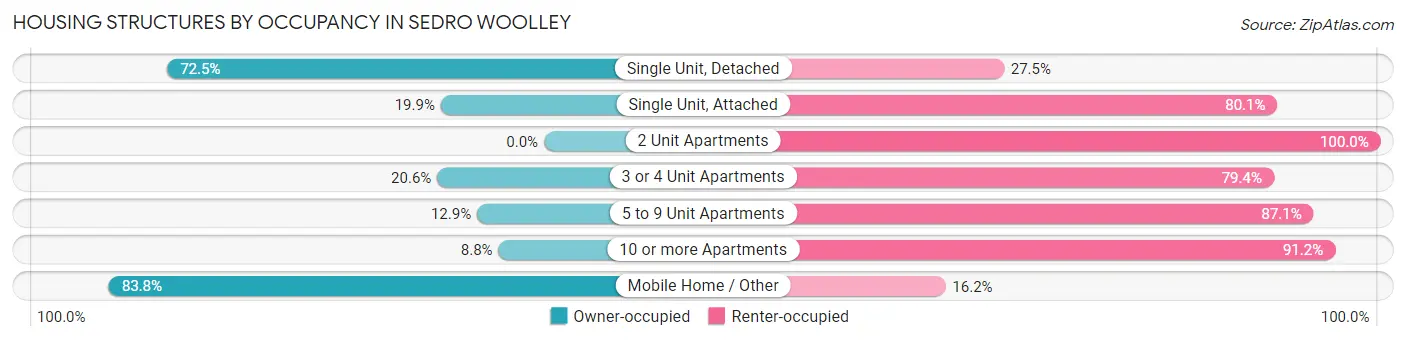
| Structure Type | Owner-occupied | Renter-occupied |
| Single Unit, Detached | 2,356 (72.5%) | 892 (27.5%) |
| Single Unit, Attached | 33 (19.9%) | 133 (80.1%) |
| 2 Unit Apartments | 0 (0.0%) | 207 (100.0%) |
| 3 or 4 Unit Apartments | 29 (20.6%) | 112 (79.4%) |
| 5 to 9 Unit Apartments | 8 (12.9%) | 54 (87.1%) |
| 10 or more Apartments | 42 (8.8%) | 437 (91.2%) |
| Mobile Home / Other | 217 (83.8%) | 42 (16.2%) |
| Total | 2,685 (58.9%) | 1,877 (41.1%) |
Housing Structures by Number of Rooms in Sedro Woolley
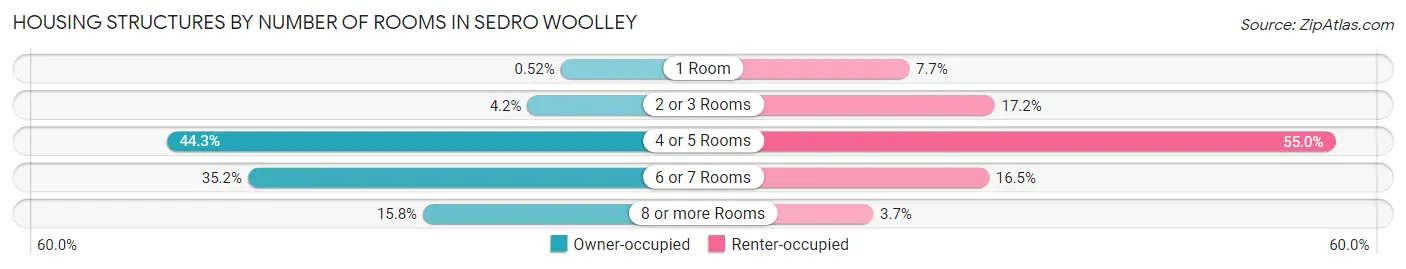
| Number of Rooms | Owner-occupied | Renter-occupied |
| 1 Room | 14 (0.5%) | 144 (7.7%) |
| 2 or 3 Rooms | 113 (4.2%) | 322 (17.2%) |
| 4 or 5 Rooms | 1,188 (44.3%) | 1,032 (55.0%) |
| 6 or 7 Rooms | 946 (35.2%) | 310 (16.5%) |
| 8 or more Rooms | 424 (15.8%) | 69 (3.7%) |
| Total | 2,685 (100.0%) | 1,877 (100.0%) |
Housing Structure by Heating Type in Sedro Woolley
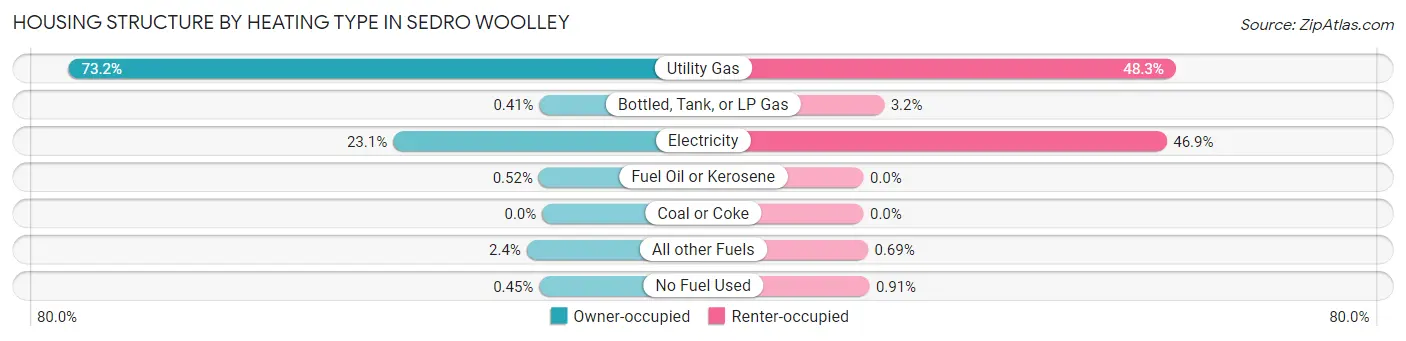
| Heating Type | Owner-occupied | Renter-occupied |
| Utility Gas | 1,965 (73.2%) | 907 (48.3%) |
| Bottled, Tank, or LP Gas | 11 (0.4%) | 60 (3.2%) |
| Electricity | 619 (23.1%) | 880 (46.9%) |
| Fuel Oil or Kerosene | 14 (0.5%) | 0 (0.0%) |
| Coal or Coke | 0 (0.0%) | 0 (0.0%) |
| All other Fuels | 64 (2.4%) | 13 (0.7%) |
| No Fuel Used | 12 (0.4%) | 17 (0.9%) |
| Total | 2,685 (100.0%) | 1,877 (100.0%) |
Household Vehicle Usage in Sedro Woolley
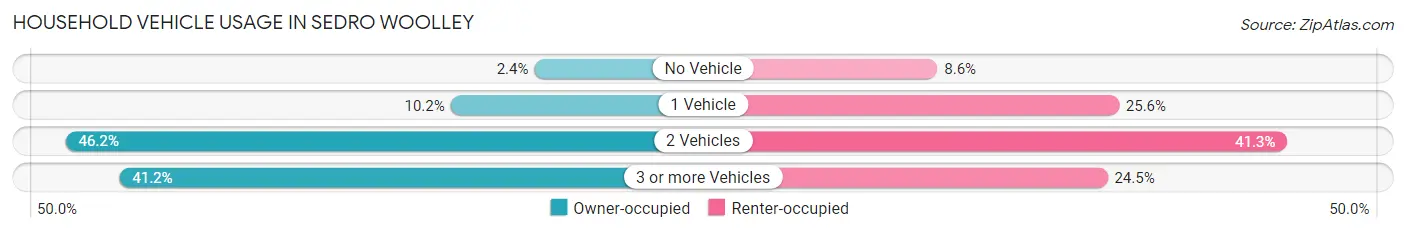
| Vehicles per Household | Owner-occupied | Renter-occupied |
| No Vehicle | 65 (2.4%) | 162 (8.6%) |
| 1 Vehicle | 275 (10.2%) | 480 (25.6%) |
| 2 Vehicles | 1,240 (46.2%) | 775 (41.3%) |
| 3 or more Vehicles | 1,105 (41.1%) | 460 (24.5%) |
| Total | 2,685 (100.0%) | 1,877 (100.0%) |
Real Estate & Mortgages in Sedro Woolley
Real Estate and Mortgage Overview in Sedro Woolley
| Characteristic | Without Mortgage | With Mortgage |
| Housing Units | 639 | 2,046 |
| Median Property Value | $299,800 | $370,300 |
| Median Household Income | $73,125 | $286 |
| Monthly Housing Costs | $663 | $50 |
| Real Estate Taxes | $2,330 | $39 |
Property Value by Mortgage Status in Sedro Woolley
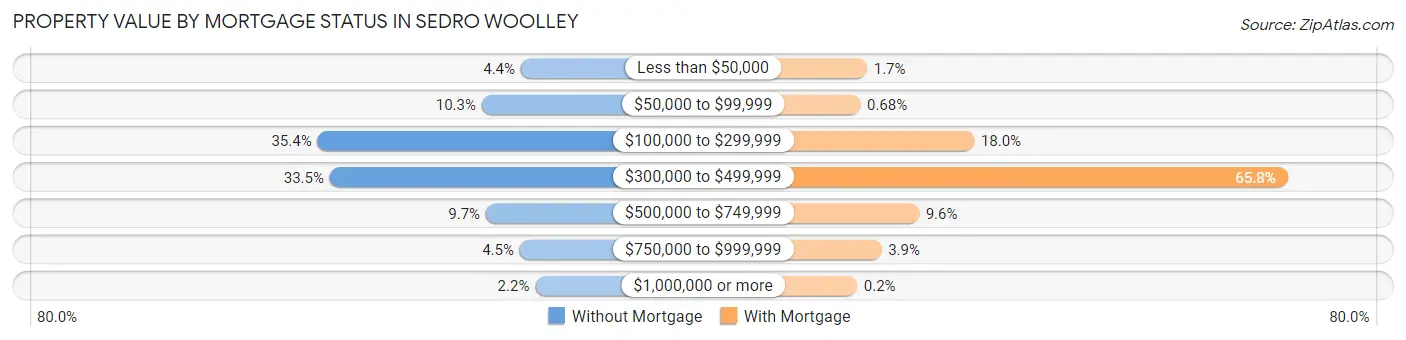
| Property Value | Without Mortgage | With Mortgage |
| Less than $50,000 | 28 (4.4%) | 35 (1.7%) |
| $50,000 to $99,999 | 66 (10.3%) | 14 (0.7%) |
| $100,000 to $299,999 | 226 (35.4%) | 369 (18.0%) |
| $300,000 to $499,999 | 214 (33.5%) | 1,347 (65.8%) |
| $500,000 to $749,999 | 62 (9.7%) | 197 (9.6%) |
| $750,000 to $999,999 | 29 (4.5%) | 80 (3.9%) |
| $1,000,000 or more | 14 (2.2%) | 4 (0.2%) |
| Total | 639 (100.0%) | 2,046 (100.0%) |
Household Income by Mortgage Status in Sedro Woolley
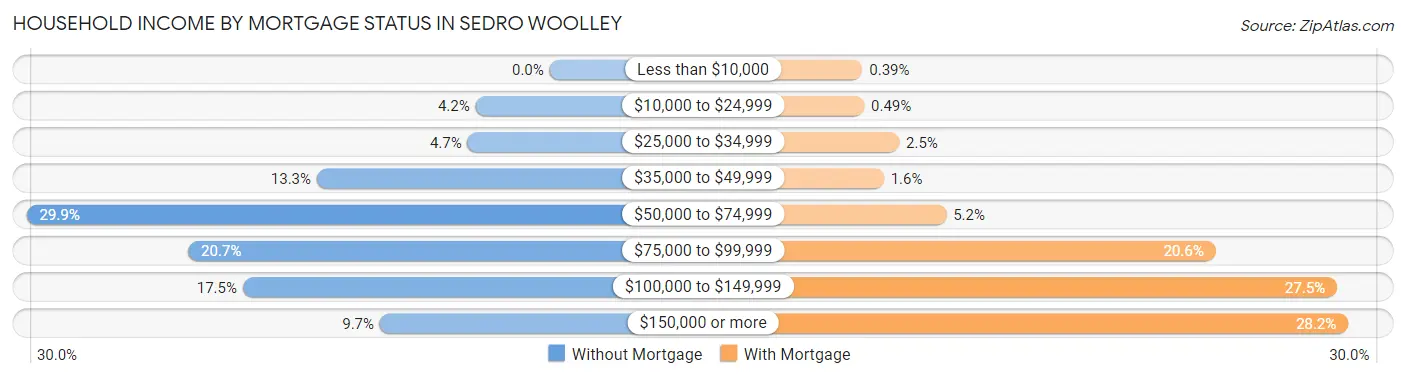
| Household Income | Without Mortgage | With Mortgage |
| Less than $10,000 | 0 (0.0%) | 8 (0.4%) |
| $10,000 to $24,999 | 27 (4.2%) | 10 (0.5%) |
| $25,000 to $34,999 | 30 (4.7%) | 51 (2.5%) |
| $35,000 to $49,999 | 85 (13.3%) | 33 (1.6%) |
| $50,000 to $74,999 | 191 (29.9%) | 106 (5.2%) |
| $75,000 to $99,999 | 132 (20.7%) | 421 (20.6%) |
| $100,000 to $149,999 | 112 (17.5%) | 563 (27.5%) |
| $150,000 or more | 62 (9.7%) | 576 (28.1%) |
| Total | 639 (100.0%) | 2,046 (100.0%) |
Property Value to Household Income Ratio in Sedro Woolley
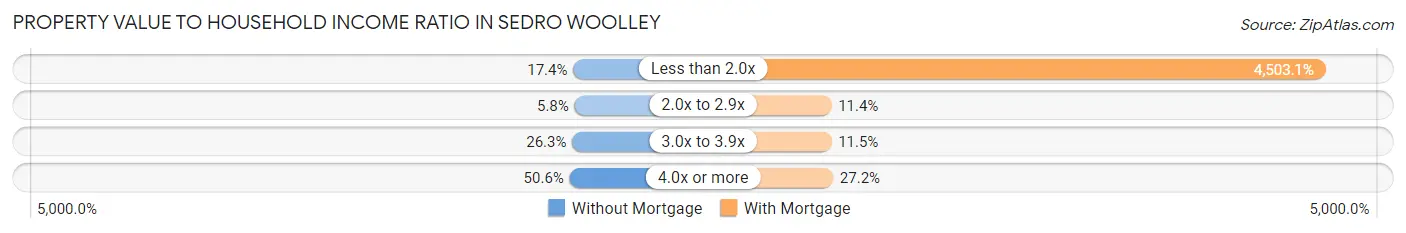
| Value-to-Income Ratio | Without Mortgage | With Mortgage |
| Less than 2.0x | 111 (17.4%) | 92,134 (4,503.1%) |
| 2.0x to 2.9x | 37 (5.8%) | 234 (11.4%) |
| 3.0x to 3.9x | 168 (26.3%) | 236 (11.5%) |
| 4.0x or more | 323 (50.5%) | 556 (27.2%) |
| Total | 639 (100.0%) | 2,046 (100.0%) |
Real Estate Taxes by Mortgage Status in Sedro Woolley
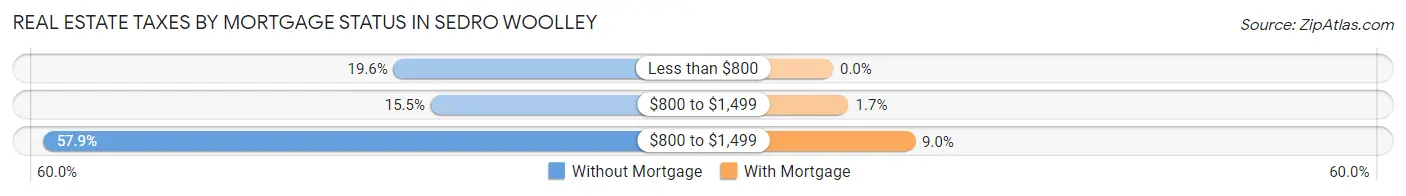
| Property Taxes | Without Mortgage | With Mortgage |
| Less than $800 | 125 (19.6%) | 0 (0.0%) |
| $800 to $1,499 | 99 (15.5%) | 35 (1.7%) |
| $800 to $1,499 | 370 (57.9%) | 184 (9.0%) |
| Total | 639 (100.0%) | 2,046 (100.0%) |
Health & Disability in Sedro Woolley
Health Insurance Coverage by Age in Sedro Woolley
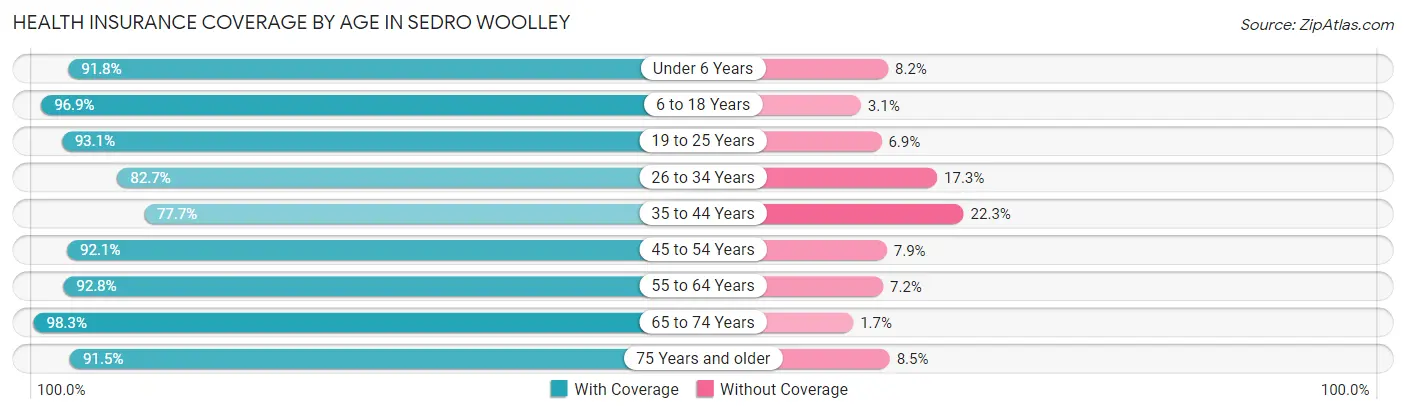
| Age Bracket | With Coverage | Without Coverage |
| Under 6 Years | 1,157 (91.8%) | 103 (8.2%) |
| 6 to 18 Years | 1,999 (96.9%) | 64 (3.1%) |
| 19 to 25 Years | 1,087 (93.1%) | 81 (6.9%) |
| 26 to 34 Years | 1,409 (82.7%) | 295 (17.3%) |
| 35 to 44 Years | 1,519 (77.7%) | 435 (22.3%) |
| 45 to 54 Years | 1,033 (92.1%) | 89 (7.9%) |
| 55 to 64 Years | 1,217 (92.8%) | 95 (7.2%) |
| 65 to 74 Years | 1,000 (98.3%) | 17 (1.7%) |
| 75 Years and older | 497 (91.5%) | 46 (8.5%) |
| Total | 10,918 (89.9%) | 1,225 (10.1%) |
Health Insurance Coverage by Citizenship Status in Sedro Woolley
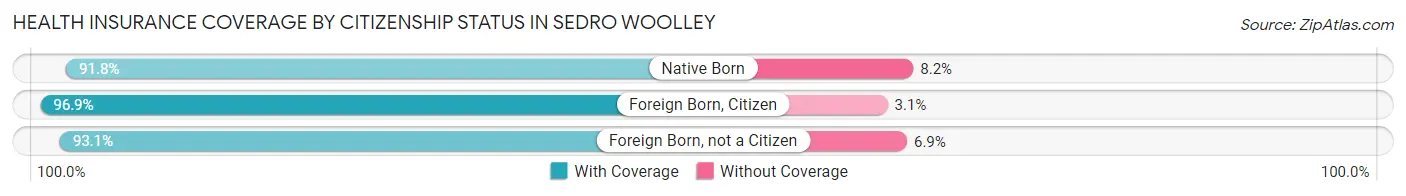
| Citizenship Status | With Coverage | Without Coverage |
| Native Born | 1,157 (91.8%) | 103 (8.2%) |
| Foreign Born, Citizen | 1,999 (96.9%) | 64 (3.1%) |
| Foreign Born, not a Citizen | 1,087 (93.1%) | 81 (6.9%) |
Health Insurance Coverage by Household Income in Sedro Woolley
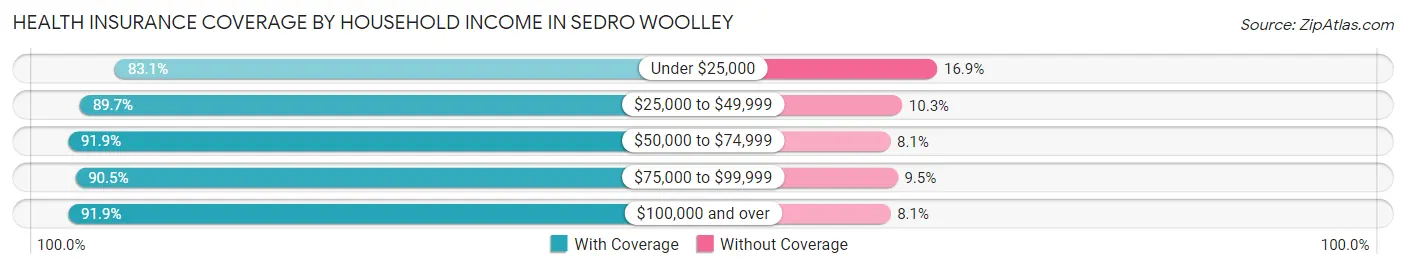
| Household Income | With Coverage | Without Coverage |
| Under $25,000 | 963 (83.1%) | 196 (16.9%) |
| $25,000 to $49,999 | 1,206 (89.7%) | 139 (10.3%) |
| $50,000 to $74,999 | 2,518 (91.9%) | 222 (8.1%) |
| $75,000 to $99,999 | 2,357 (90.5%) | 247 (9.5%) |
| $100,000 and over | 3,421 (91.9%) | 303 (8.1%) |
Public vs Private Health Insurance Coverage by Age in Sedro Woolley
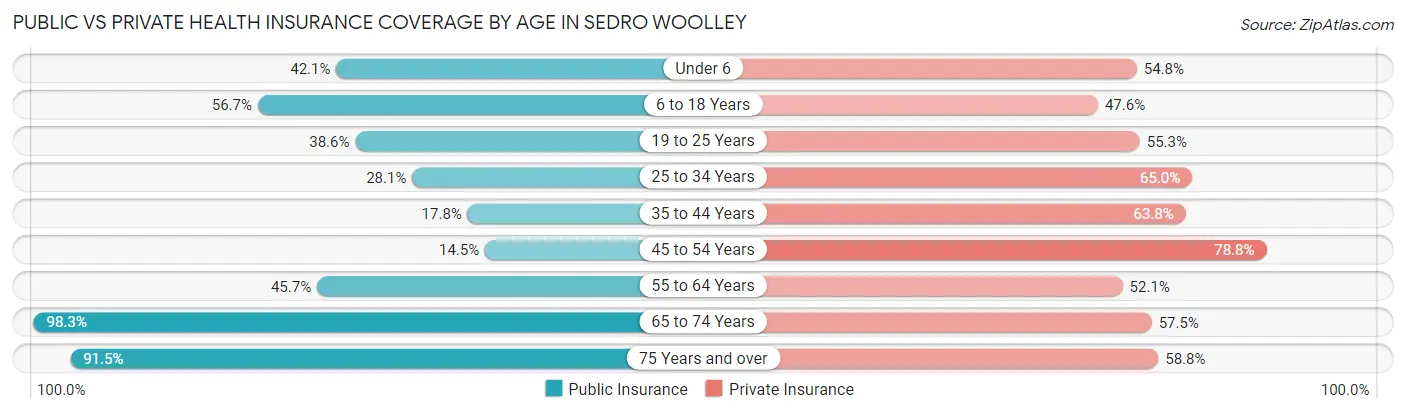
| Age Bracket | Public Insurance | Private Insurance |
| Under 6 | 531 (42.1%) | 690 (54.8%) |
| 6 to 18 Years | 1,170 (56.7%) | 981 (47.5%) |
| 19 to 25 Years | 451 (38.6%) | 646 (55.3%) |
| 25 to 34 Years | 478 (28.1%) | 1,108 (65.0%) |
| 35 to 44 Years | 347 (17.8%) | 1,247 (63.8%) |
| 45 to 54 Years | 163 (14.5%) | 884 (78.8%) |
| 55 to 64 Years | 600 (45.7%) | 684 (52.1%) |
| 65 to 74 Years | 1,000 (98.3%) | 585 (57.5%) |
| 75 Years and over | 497 (91.5%) | 319 (58.8%) |
| Total | 5,237 (43.1%) | 7,144 (58.8%) |
Disability Status by Sex by Age in Sedro Woolley
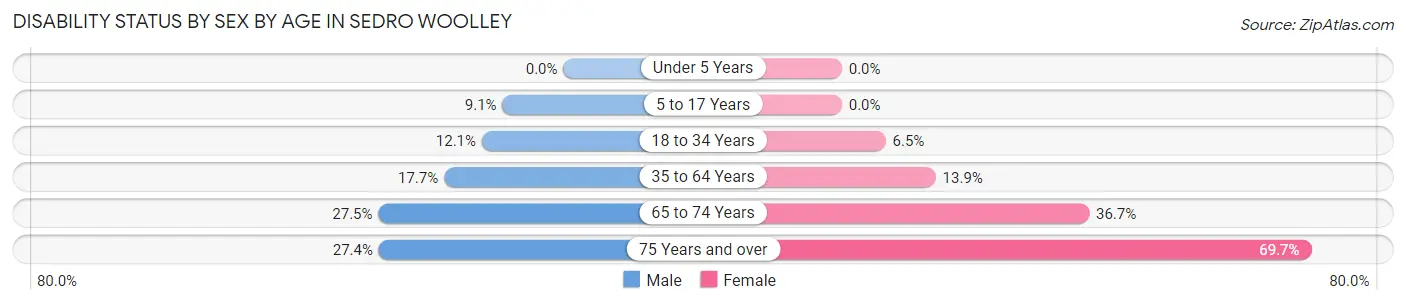
| Age Bracket | Male | Female |
| Under 5 Years | 0 (0.0%) | 0 (0.0%) |
| 5 to 17 Years | 87 (9.0%) | 0 (0.0%) |
| 18 to 34 Years | 221 (12.1%) | 97 (6.5%) |
| 35 to 64 Years | 400 (17.7%) | 297 (13.9%) |
| 65 to 74 Years | 114 (27.5%) | 221 (36.7%) |
| 75 Years and over | 80 (27.4%) | 175 (69.7%) |
Disability Class by Sex by Age in Sedro Woolley
Disability Class: Hearing Difficulty
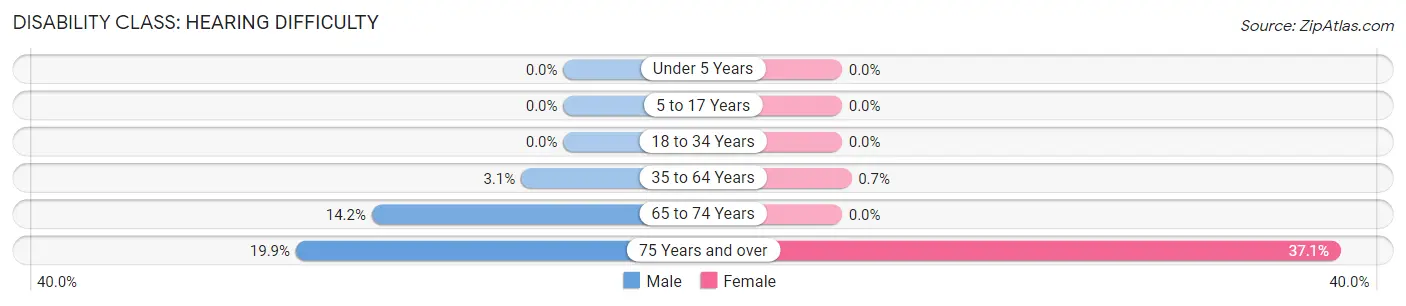
| Age Bracket | Male | Female |
| Under 5 Years | 0 (0.0%) | 0 (0.0%) |
| 5 to 17 Years | 0 (0.0%) | 0 (0.0%) |
| 18 to 34 Years | 0 (0.0%) | 0 (0.0%) |
| 35 to 64 Years | 71 (3.1%) | 15 (0.7%) |
| 65 to 74 Years | 59 (14.2%) | 0 (0.0%) |
| 75 Years and over | 58 (19.9%) | 93 (37.0%) |
Disability Class: Vision Difficulty
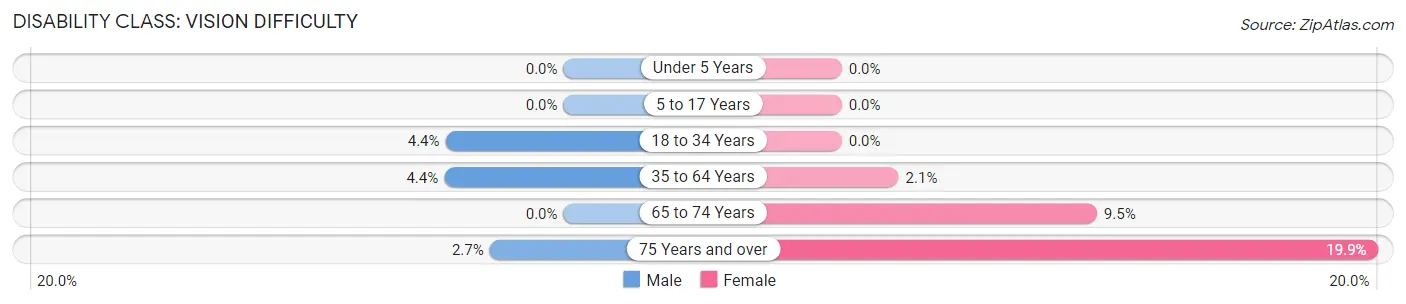
| Age Bracket | Male | Female |
| Under 5 Years | 0 (0.0%) | 0 (0.0%) |
| 5 to 17 Years | 0 (0.0%) | 0 (0.0%) |
| 18 to 34 Years | 80 (4.4%) | 0 (0.0%) |
| 35 to 64 Years | 100 (4.4%) | 45 (2.1%) |
| 65 to 74 Years | 0 (0.0%) | 57 (9.5%) |
| 75 Years and over | 8 (2.7%) | 50 (19.9%) |
Disability Class: Cognitive Difficulty
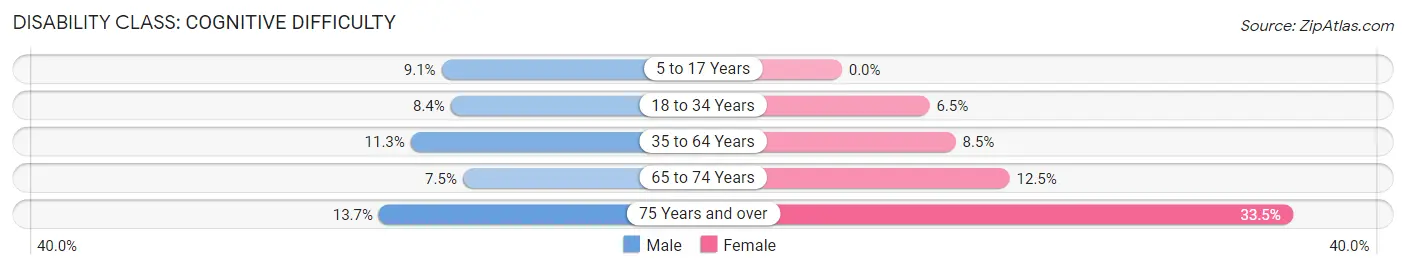
| Age Bracket | Male | Female |
| 5 to 17 Years | 87 (9.0%) | 0 (0.0%) |
| 18 to 34 Years | 153 (8.4%) | 97 (6.5%) |
| 35 to 64 Years | 256 (11.3%) | 180 (8.5%) |
| 65 to 74 Years | 31 (7.5%) | 75 (12.5%) |
| 75 Years and over | 40 (13.7%) | 84 (33.5%) |
Disability Class: Ambulatory Difficulty
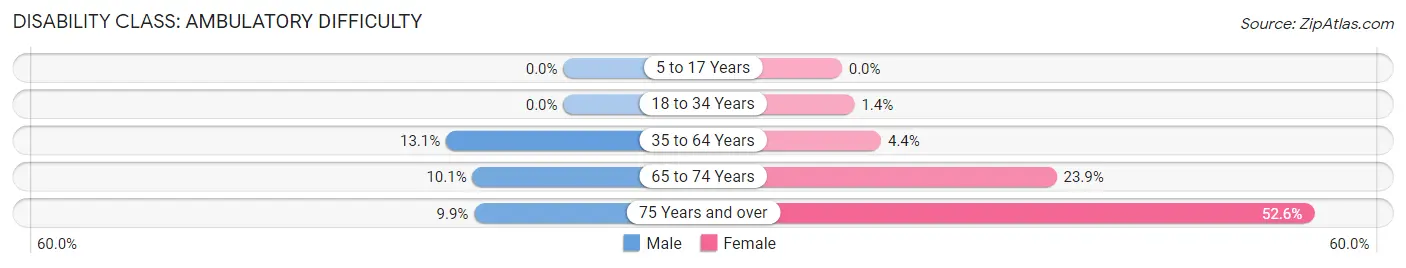
| Age Bracket | Male | Female |
| 5 to 17 Years | 0 (0.0%) | 0 (0.0%) |
| 18 to 34 Years | 0 (0.0%) | 21 (1.4%) |
| 35 to 64 Years | 295 (13.1%) | 93 (4.4%) |
| 65 to 74 Years | 42 (10.1%) | 144 (23.9%) |
| 75 Years and over | 29 (9.9%) | 132 (52.6%) |
Disability Class: Self-Care Difficulty
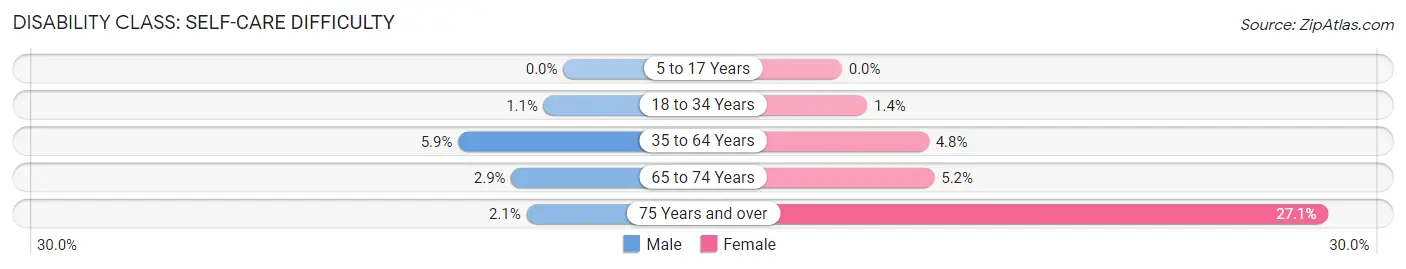
| Age Bracket | Male | Female |
| 5 to 17 Years | 0 (0.0%) | 0 (0.0%) |
| 18 to 34 Years | 20 (1.1%) | 21 (1.4%) |
| 35 to 64 Years | 132 (5.9%) | 103 (4.8%) |
| 65 to 74 Years | 12 (2.9%) | 31 (5.1%) |
| 75 Years and over | 6 (2.1%) | 68 (27.1%) |
Technology Access in Sedro Woolley
Computing Device Access in Sedro Woolley
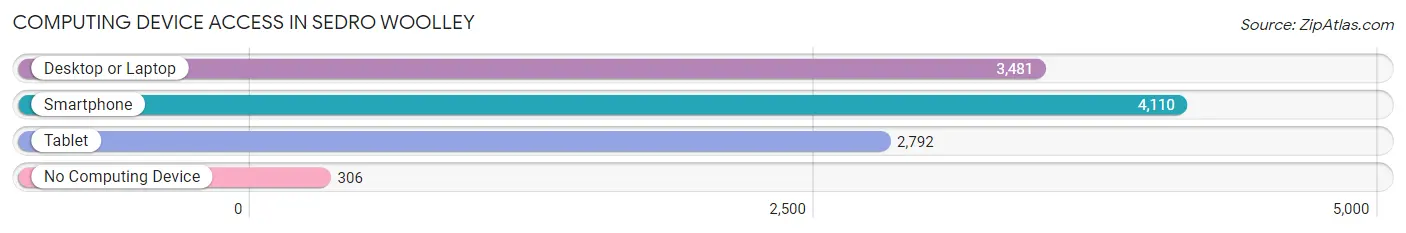
| Device Type | # Households | % Households |
| Desktop or Laptop | 3,481 | 76.3% |
| Smartphone | 4,110 | 90.1% |
| Tablet | 2,792 | 61.2% |
| No Computing Device | 306 | 6.7% |
| Total | 4,562 | 100.0% |
Internet Access in Sedro Woolley
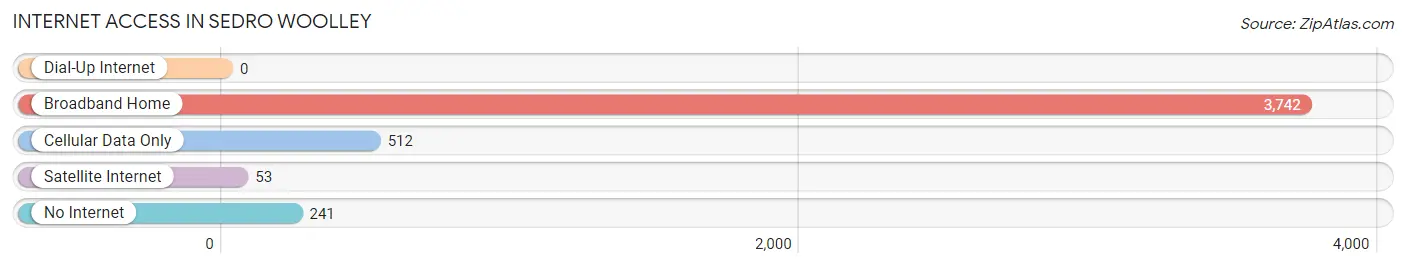
| Internet Type | # Households | % Households |
| Dial-Up Internet | 0 | 0.0% |
| Broadband Home | 3,742 | 82.0% |
| Cellular Data Only | 512 | 11.2% |
| Satellite Internet | 53 | 1.2% |
| No Internet | 241 | 5.3% |
| Total | 4,562 | 100.0% |
Sedro Woolley Summary
Sedro Woolley is a city located in Skagit County, Washington, United States. It is the county seat of Skagit County and is located about 50 miles north of Seattle. The population was 10,540 at the 2010 census.
History
Sedro Woolley was founded in 1883 by two brothers, William and Edward Woolley, who named the town after their father, Sedro Woolley. The brothers had come to the area to work in the logging industry and soon established a sawmill. The town quickly grew and by the early 1900s, it had become a major center for logging and lumber production.
In the early 1900s, the town was also home to a thriving agricultural industry. The area was known for its dairy farms, fruit orchards, and vegetable farms. The town was also home to a number of small businesses, including a blacksmith shop, a livery stable, and a general store.
In the 1920s, the town began to experience a decline in its logging and lumber industries. This was due to the depletion of the local timber supply and the increasing cost of labor. The town was also affected by the Great Depression, which caused many of the local businesses to close.
In the 1950s, the town began to experience a resurgence in its economy. This was due to the development of the nearby Boeing plant in Everett, which provided jobs for many of the town’s residents. The town also experienced a population boom, as many people moved to the area to take advantage of the new job opportunities.
Geography
Sedro Woolley is located in Skagit County, Washington, at the intersection of State Route 20 and State Route 9. The city is situated on the banks of the Skagit River, which flows through the city. The city is surrounded by the Cascade Mountains to the east and the Olympic Mountains to the west.
The city has a total area of 4.3 square miles, all of which is land. The city has a humid continental climate, with warm summers and cold winters. The average annual temperature is 50.2 degrees Fahrenheit.
Economy
Sedro Woolley’s economy is largely based on the timber and lumber industries. The city is home to several sawmills and lumber yards, as well as a number of wood-related businesses. The city is also home to a number of manufacturing companies, including a paper mill and a metal fabrication plant.
The city is also home to a number of retail stores, restaurants, and other businesses. The city is also home to a number of medical facilities, including a hospital and several clinics.
Demographics
As of the 2010 census, the population of Sedro Woolley was 10,540. The racial makeup of the city was 87.3% White, 0.7% African American, 1.2% Native American, 1.2% Asian, 0.2% Pacific Islander, 5.7% from other races, and 3.7% from two or more races. Hispanic or Latino of any race were 11.2% of the population.
The median income for a household in the city was $45,945, and the median income for a family was $51,945. The per capita income for the city was $21,945. About 11.2% of families and 14.2% of the population were below the poverty line, including 19.2% of those under age 18 and 8.2% of those age 65 or over.
Common Questions
What is Per Capita Income in Sedro Woolley?
Per Capita income in Sedro Woolley is $30,136.
What is the Median Family Income in Sedro Woolley?
Median Family Income in Sedro Woolley is $73,980.
What is the Median Household income in Sedro Woolley?
Median Household Income in Sedro Woolley is $72,281.
What is Income or Wage Gap in Sedro Woolley?
Income or Wage Gap in Sedro Woolley is 33.9%.
Women in Sedro Woolley earn 66.1 cents for every dollar earned by a man.
What is Inequality or Gini Index in Sedro Woolley?
Inequality or Gini Index in Sedro Woolley is 0.35.
What is the Total Population of Sedro Woolley?
Total Population of Sedro Woolley is 12,470.
What is the Total Male Population of Sedro Woolley?
Total Male Population of Sedro Woolley is 6,454.
What is the Total Female Population of Sedro Woolley?
Total Female Population of Sedro Woolley is 6,016.
What is the Ratio of Males per 100 Females in Sedro Woolley?
There are 107.28 Males per 100 Females in Sedro Woolley.
What is the Ratio of Females per 100 Males in Sedro Woolley?
There are 93.21 Females per 100 Males in Sedro Woolley.
What is the Median Population Age in Sedro Woolley?
Median Population Age in Sedro Woolley is 34.9 Years.
What is the Average Family Size in Sedro Woolley
Average Family Size in Sedro Woolley is 2.9 People.
What is the Average Household Size in Sedro Woolley
Average Household Size in Sedro Woolley is 2.6 People.
How Large is the Labor Force in Sedro Woolley?
There are 6,026 People in the Labor Forcein in Sedro Woolley.
What is the Percentage of People in the Labor Force in Sedro Woolley?
61.1% of People are in the Labor Force in Sedro Woolley.
What is the Unemployment Rate in Sedro Woolley?
Unemployment Rate in Sedro Woolley is 4.6%.