Goldendale, WA Map & Demographics
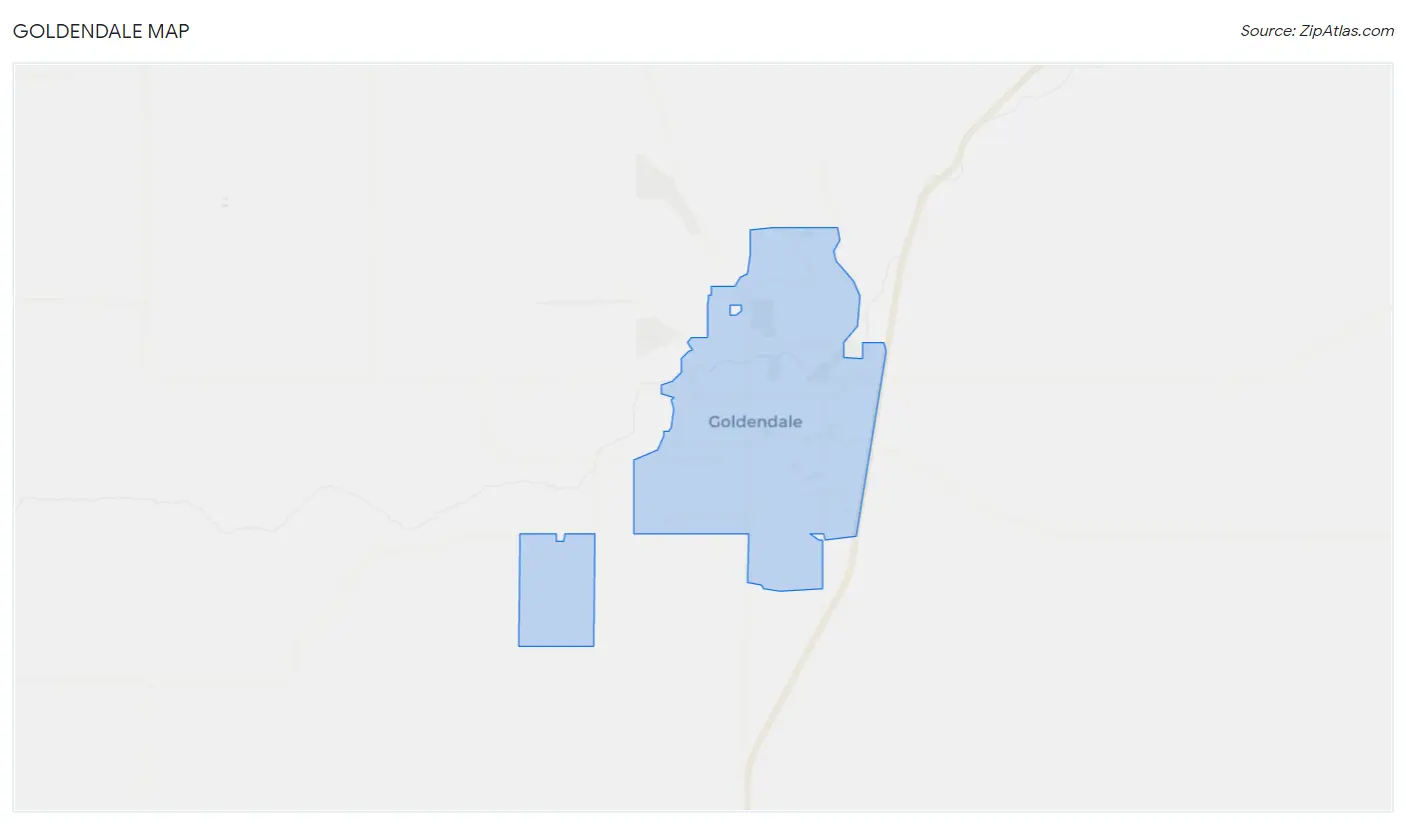
Goldendale Map
Goldendale Overview
$33,490
PER CAPITA INCOME
$55,171
AVG FAMILY INCOME
$45,467
AVG HOUSEHOLD INCOME
48.5%
WAGE / INCOME GAP [ % ]
51.5¢/ $1
WAGE / INCOME GAP [ $ ]
0.52
INEQUALITY / GINI INDEX
3,448
TOTAL POPULATION
1,686
MALE POPULATION
1,762
FEMALE POPULATION
95.69
MALES / 100 FEMALES
104.51
FEMALES / 100 MALES
36.4
MEDIAN AGE
2.9
AVG FAMILY SIZE
2.1
AVG HOUSEHOLD SIZE
1,463
LABOR FORCE [ PEOPLE ]
56.2%
PERCENT IN LABOR FORCE
18.7%
UNEMPLOYMENT RATE
Goldendale Zip Codes
Goldendale Area Codes
Income in Goldendale
Income Overview in Goldendale
Per Capita Income in Goldendale is $33,490, while median incomes of families and households are $55,171 and $45,467 respectively.
| Characteristic | Number | Measure |
| Per Capita Income | 3,448 | $33,490 |
| Median Family Income | 821 | $55,171 |
| Mean Family Income | 821 | $63,508 |
| Median Household Income | 1,596 | $45,467 |
| Mean Household Income | 1,596 | $69,984 |
| Income Deficit | 821 | $0 |
| Wage / Income Gap (%) | 3,448 | 48.52% |
| Wage / Income Gap ($) | 3,448 | 51.48¢ per $1 |
| Gini / Inequality Index | 3,448 | 0.52 |
Earnings by Sex in Goldendale
Average Earnings in Goldendale are $35,398, $55,921 for men and $28,789 for women, a difference of 48.5%.
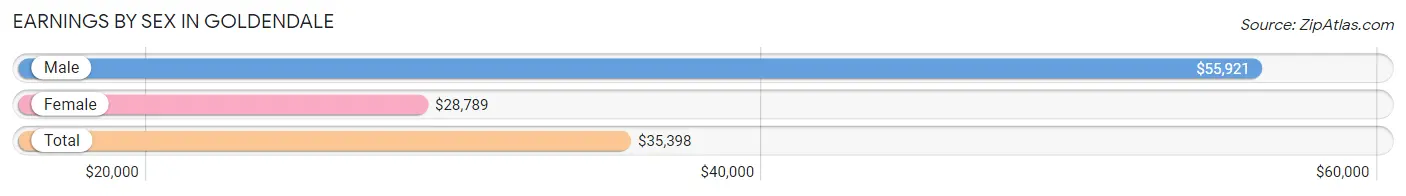
| Sex | Number | Average Earnings |
| Male | 782 (51.5%) | $55,921 |
| Female | 737 (48.5%) | $28,789 |
| Total | 1,519 (100.0%) | $35,398 |
Earnings by Sex by Income Bracket in Goldendale
The most common earnings brackets in Goldendale are $75,000 to $99,999 for men (179 | 22.9%) and $15,000 to $17,499 for women (117 | 15.9%).
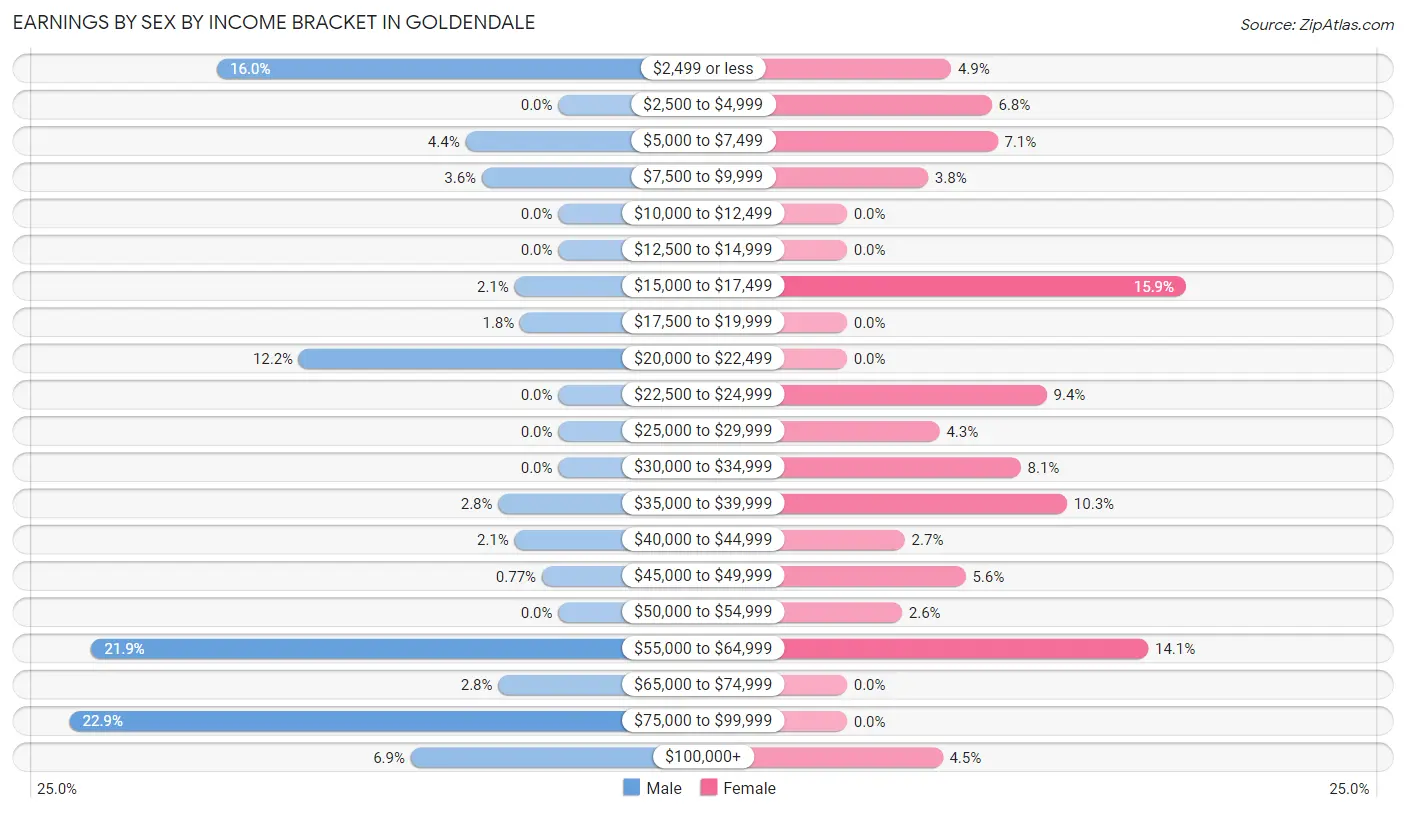
| Income | Male | Female |
| $2,499 or less | 125 (16.0%) | 36 (4.9%) |
| $2,500 to $4,999 | 0 (0.0%) | 50 (6.8%) |
| $5,000 to $7,499 | 34 (4.3%) | 52 (7.1%) |
| $7,500 to $9,999 | 28 (3.6%) | 28 (3.8%) |
| $10,000 to $12,499 | 0 (0.0%) | 0 (0.0%) |
| $12,500 to $14,999 | 0 (0.0%) | 0 (0.0%) |
| $15,000 to $17,499 | 16 (2.1%) | 117 (15.9%) |
| $17,500 to $19,999 | 14 (1.8%) | 0 (0.0%) |
| $20,000 to $22,499 | 95 (12.1%) | 0 (0.0%) |
| $22,500 to $24,999 | 0 (0.0%) | 69 (9.4%) |
| $25,000 to $29,999 | 0 (0.0%) | 32 (4.3%) |
| $30,000 to $34,999 | 0 (0.0%) | 60 (8.1%) |
| $35,000 to $39,999 | 22 (2.8%) | 76 (10.3%) |
| $40,000 to $44,999 | 16 (2.1%) | 20 (2.7%) |
| $45,000 to $49,999 | 6 (0.8%) | 41 (5.6%) |
| $50,000 to $54,999 | 0 (0.0%) | 19 (2.6%) |
| $55,000 to $64,999 | 171 (21.9%) | 104 (14.1%) |
| $65,000 to $74,999 | 22 (2.8%) | 0 (0.0%) |
| $75,000 to $99,999 | 179 (22.9%) | 0 (0.0%) |
| $100,000+ | 54 (6.9%) | 33 (4.5%) |
| Total | 782 (100.0%) | 737 (100.0%) |
Earnings by Sex by Educational Attainment in Goldendale
Average earnings in Goldendale are $55,882 for men and $24,221 for women, a difference of 56.7%. Men with an educational attainment of college or associate's degree enjoy the highest average annual earnings of $95,120, while those with graduate degree education earn the least with $81,397. Women with an educational attainment of bachelor's degree earn the most with the average annual earnings of $57,426, while those with college or associate's degree education have the smallest earnings of $16,090.
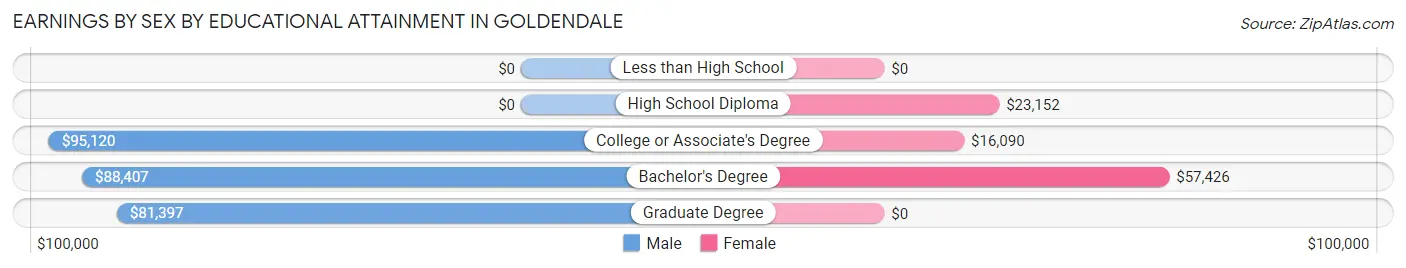
| Educational Attainment | Male Income | Female Income |
| Less than High School | - | - |
| High School Diploma | - | - |
| College or Associate's Degree | $95,120 | $16,090 |
| Bachelor's Degree | $88,407 | $57,426 |
| Graduate Degree | $81,397 | $0 |
| Total | $55,882 | $24,221 |
Family Income in Goldendale
Family Income Brackets in Goldendale
According to the Goldendale family income data, there are 209 families falling into the $15,000 to $24,999 income range, which is the most common income bracket and makes up 25.5% of all families. Conversely, the $35,000 to $49,999 income bracket is the least frequent group with only 11 families (1.3%) belonging to this category.
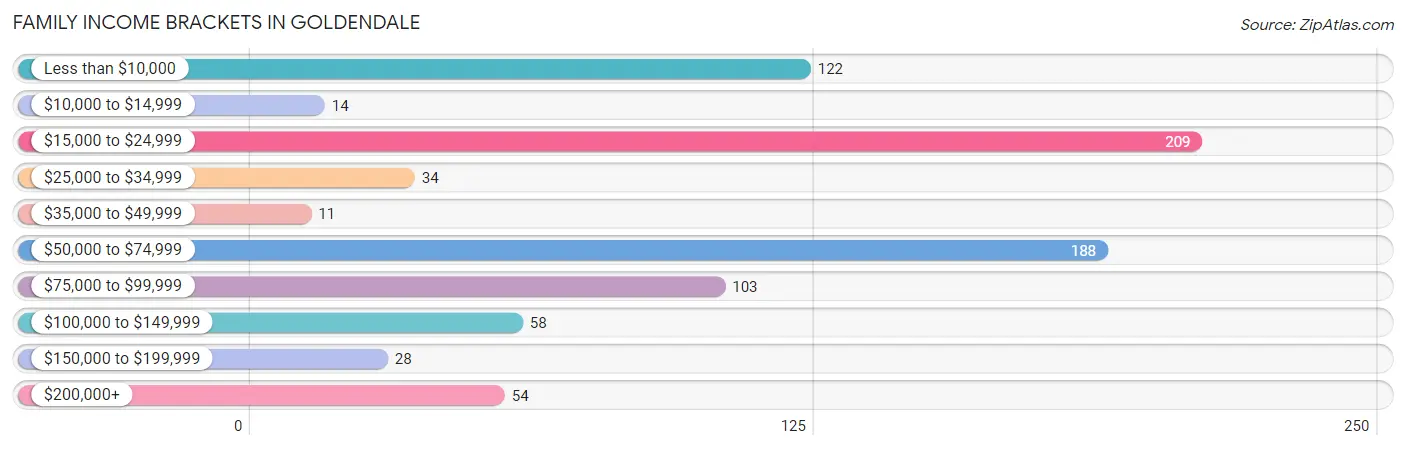
| Income Bracket | # Families | % Families |
| Less than $10,000 | 122 | 14.9% |
| $10,000 to $14,999 | 14 | 1.7% |
| $15,000 to $24,999 | 209 | 25.5% |
| $25,000 to $34,999 | 34 | 4.1% |
| $35,000 to $49,999 | 11 | 1.3% |
| $50,000 to $74,999 | 188 | 22.9% |
| $75,000 to $99,999 | 103 | 12.5% |
| $100,000 to $149,999 | 58 | 7.1% |
| $150,000 to $199,999 | 28 | 3.4% |
| $200,000+ | 54 | 6.6% |
Family Income by Famaliy Size in Goldendale
3-person families (253 | 30.8%) account for the highest median family income in Goldendale with $55,013 per family, while 3-person families (253 | 30.8%) have the highest median income of $18,338 per family member.
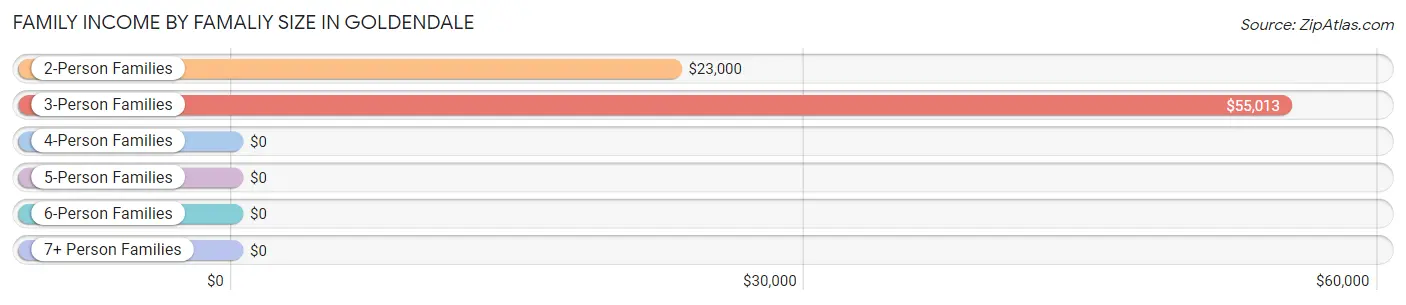
| Income Bracket | # Families | Median Income |
| 2-Person Families | 428 (52.1%) | $23,000 |
| 3-Person Families | 253 (30.8%) | $55,013 |
| 4-Person Families | 118 (14.4%) | $0 |
| 5-Person Families | 22 (2.7%) | $0 |
| 6-Person Families | 0 (0.0%) | $0 |
| 7+ Person Families | 0 (0.0%) | $0 |
| Total | 821 (100.0%) | $55,171 |
Family Income by Number of Earners in Goldendale
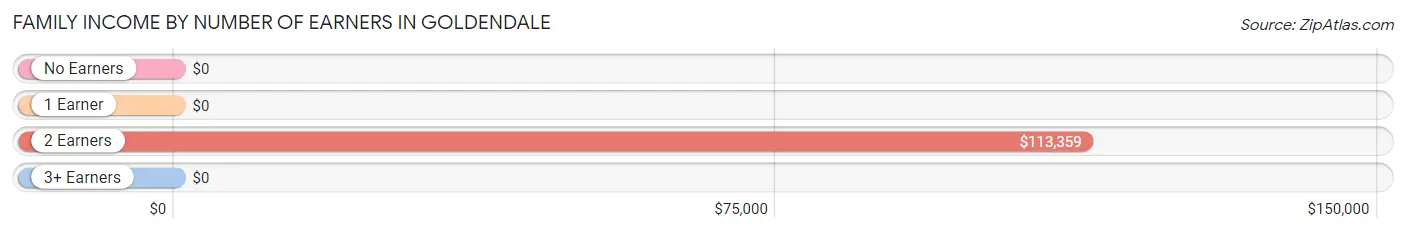
| Number of Earners | # Families | Median Income |
| No Earners | 205 (25.0%) | $0 |
| 1 Earner | 450 (54.8%) | $0 |
| 2 Earners | 149 (18.1%) | $113,359 |
| 3+ Earners | 17 (2.1%) | $0 |
| Total | 821 (100.0%) | $55,171 |
Household Income in Goldendale
Household Income Brackets in Goldendale
With 365 households falling in the category, the $35,000 to $49,999 income range is the most frequent in Goldendale, accounting for 22.9% of all households. In contrast, only 29 households (1.8%) fall into the $150,000 to $199,999 income bracket, making it the least populous group.
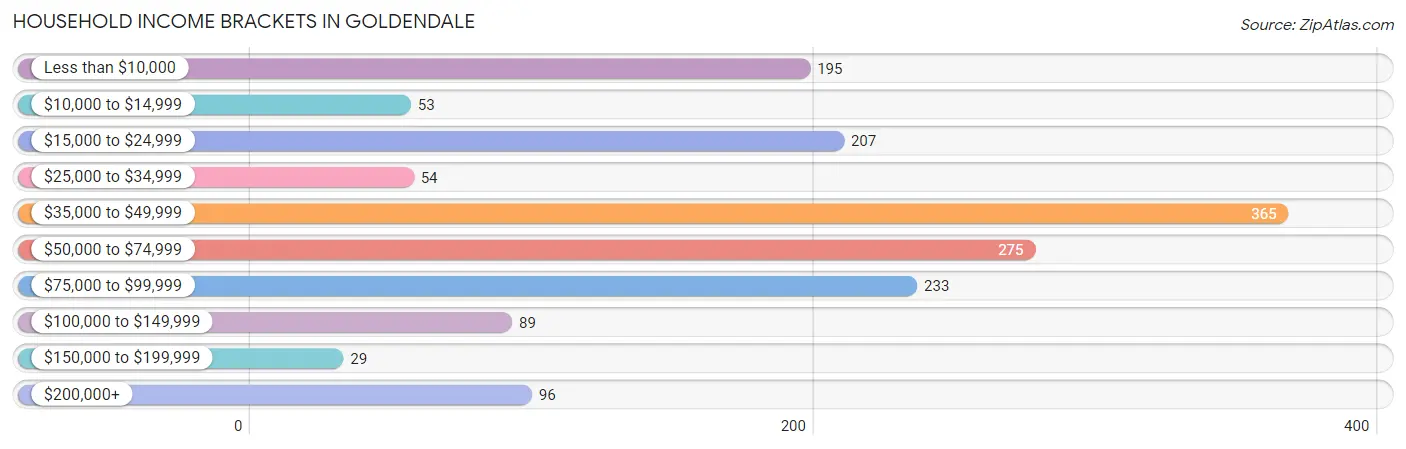
| Income Bracket | # Households | % Households |
| Less than $10,000 | 195 | 12.2% |
| $10,000 to $14,999 | 53 | 3.3% |
| $15,000 to $24,999 | 207 | 13.0% |
| $25,000 to $34,999 | 54 | 3.4% |
| $35,000 to $49,999 | 365 | 22.9% |
| $50,000 to $74,999 | 275 | 17.2% |
| $75,000 to $99,999 | 233 | 14.6% |
| $100,000 to $149,999 | 89 | 5.6% |
| $150,000 to $199,999 | 29 | 1.8% |
| $200,000+ | 96 | 6.0% |
Household Income by Householder Age in Goldendale
The median household income in Goldendale is $45,467, with the highest median household income of $55,829 found in the 25 to 44 years age bracket for the primary householder. A total of 715 households (44.8%) fall into this category. Meanwhile, the 15 to 24 years age bracket for the primary householder has the lowest median household income of $0, with 68 households (4.3%) in this group.
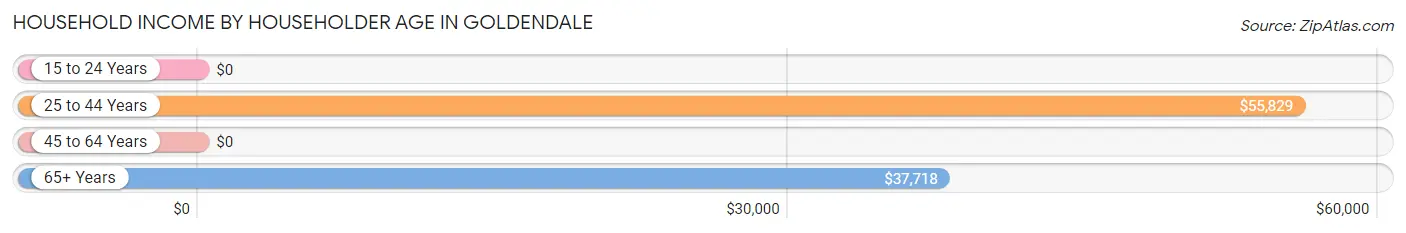
| Income Bracket | # Households | Median Income |
| 15 to 24 Years | 68 (4.3%) | $0 |
| 25 to 44 Years | 715 (44.8%) | $55,829 |
| 45 to 64 Years | 324 (20.3%) | $0 |
| 65+ Years | 489 (30.6%) | $37,718 |
| Total | 1,596 (100.0%) | $45,467 |
Poverty in Goldendale
Income Below Poverty by Sex and Age in Goldendale
With 30.5% poverty level for males and 24.7% for females among the residents of Goldendale, under 5 year old males and 45 to 54 year old females are the most vulnerable to poverty, with 27 males (100.0%) and 40 females (57.1%) in their respective age groups living below the poverty level.
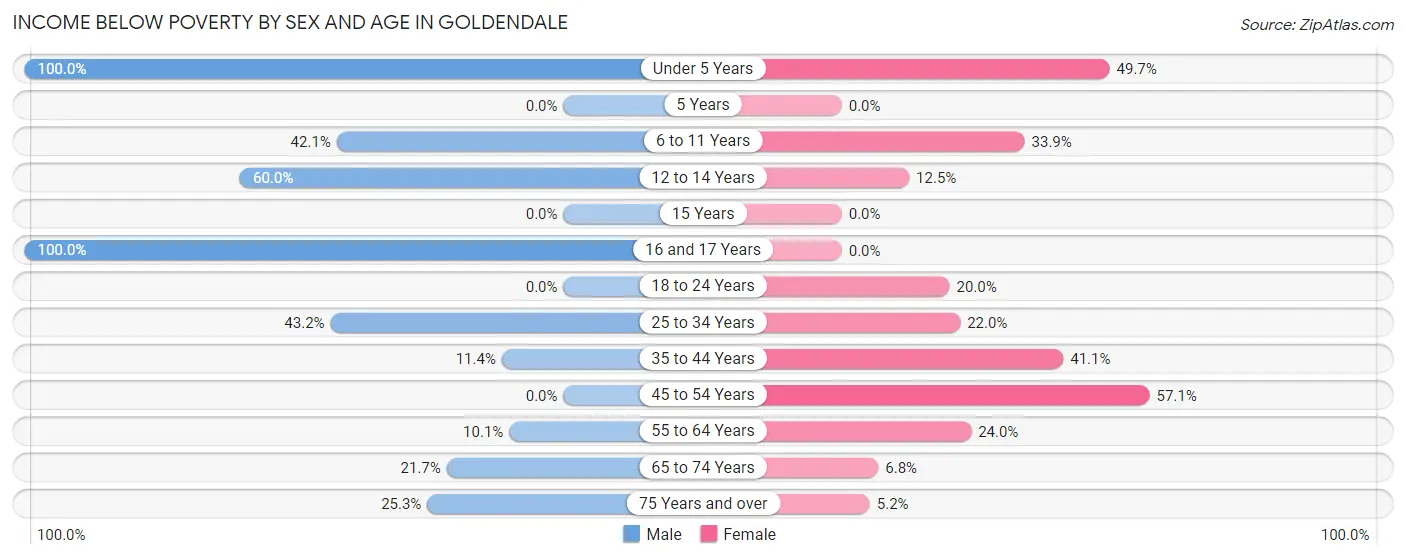
| Age Bracket | Male | Female |
| Under 5 Years | 27 (100.0%) | 87 (49.7%) |
| 5 Years | 0 (0.0%) | 0 (0.0%) |
| 6 to 11 Years | 170 (42.1%) | 19 (33.9%) |
| 12 to 14 Years | 18 (60.0%) | 19 (12.5%) |
| 15 Years | 0 (0.0%) | 0 (0.0%) |
| 16 and 17 Years | 32 (100.0%) | 0 (0.0%) |
| 18 to 24 Years | 0 (0.0%) | 19 (20.0%) |
| 25 to 34 Years | 160 (43.2%) | 51 (22.0%) |
| 35 to 44 Years | 35 (11.4%) | 111 (41.1%) |
| 45 to 54 Years | 0 (0.0%) | 40 (57.1%) |
| 55 to 64 Years | 16 (10.1%) | 61 (24.0%) |
| 65 to 74 Years | 26 (21.7%) | 12 (6.8%) |
| 75 Years and over | 23 (25.3%) | 14 (5.2%) |
| Total | 507 (30.5%) | 433 (24.7%) |
Income Above Poverty by Sex and Age in Goldendale
According to the poverty statistics in Goldendale, males aged 18 to 24 years and females aged 75 years and over are the age groups that are most secure financially, with 100.0% of males and 94.8% of females in these age groups living above the poverty line.
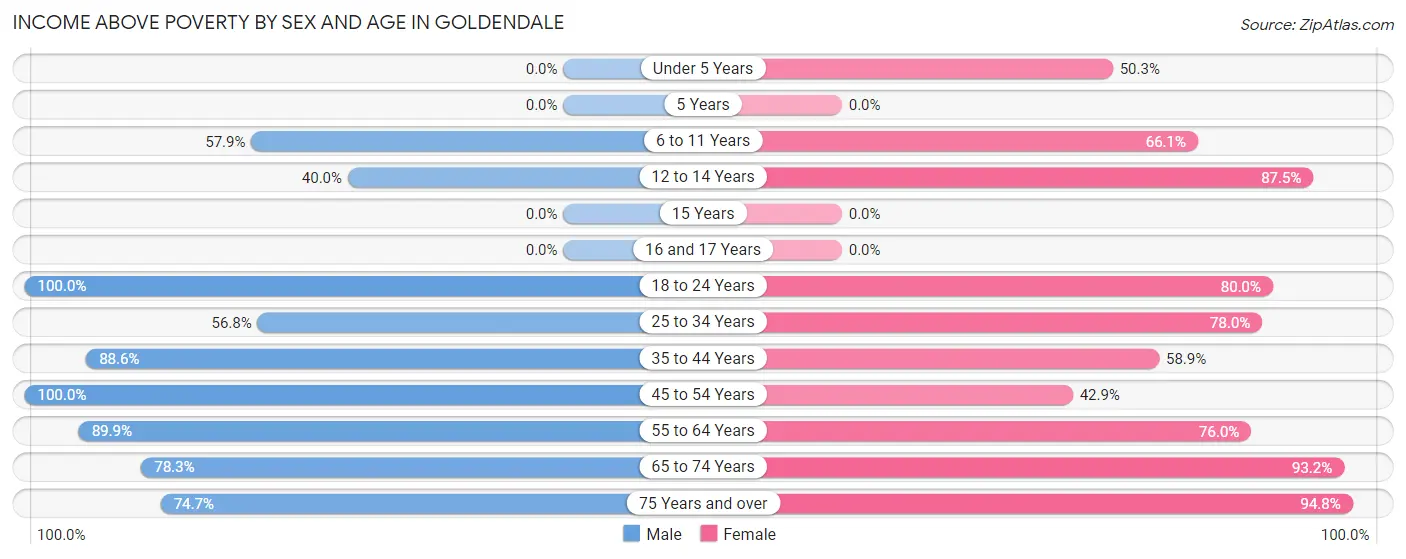
| Age Bracket | Male | Female |
| Under 5 Years | 0 (0.0%) | 88 (50.3%) |
| 5 Years | 0 (0.0%) | 0 (0.0%) |
| 6 to 11 Years | 234 (57.9%) | 37 (66.1%) |
| 12 to 14 Years | 12 (40.0%) | 133 (87.5%) |
| 15 Years | 0 (0.0%) | 0 (0.0%) |
| 16 and 17 Years | 0 (0.0%) | 0 (0.0%) |
| 18 to 24 Years | 93 (100.0%) | 76 (80.0%) |
| 25 to 34 Years | 210 (56.8%) | 181 (78.0%) |
| 35 to 44 Years | 271 (88.6%) | 159 (58.9%) |
| 45 to 54 Years | 32 (100.0%) | 30 (42.9%) |
| 55 to 64 Years | 143 (89.9%) | 193 (76.0%) |
| 65 to 74 Years | 94 (78.3%) | 165 (93.2%) |
| 75 Years and over | 68 (74.7%) | 255 (94.8%) |
| Total | 1,157 (69.5%) | 1,317 (75.3%) |
Income Below Poverty Among Married-Couple Families in Goldendale
The poverty statistics for married-couple families in Goldendale show that 3.1% or 14 of the total 448 families live below the poverty line. Families with no children have the highest poverty rate of 4.5%, comprising of 14 families. On the other hand, families with 1 or 2 children have the lowest poverty rate of 0.0%, which includes 0 families.
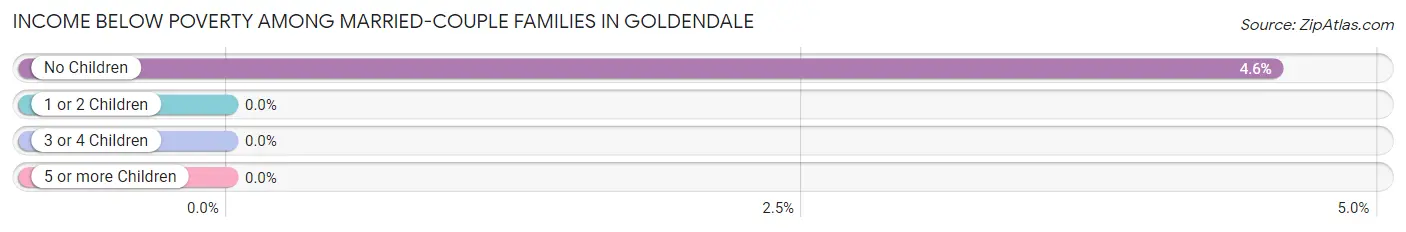
| Children | Above Poverty | Below Poverty |
| No Children | 294 (95.5%) | 14 (4.5%) |
| 1 or 2 Children | 118 (100.0%) | 0 (0.0%) |
| 3 or 4 Children | 22 (100.0%) | 0 (0.0%) |
| 5 or more Children | 0 (0.0%) | 0 (0.0%) |
| Total | 434 (96.9%) | 14 (3.1%) |
Income Below Poverty Among Single-Parent Households in Goldendale
According to the poverty data in Goldendale, 15.1% or 32 single-father households and 93.2% or 150 single-mother households are living below the poverty line. Among single-father households, those with no children have the highest poverty rate, with 16 households (61.5%) experiencing poverty. Likewise, among single-mother households, those with 1 or 2 children have the highest poverty rate, with 150 households (93.2%) falling below the poverty line.
| Children | Single Father | Single Mother |
| No Children | 16 (61.5%) | 0 (0.0%) |
| 1 or 2 Children | 16 (8.6%) | 150 (93.2%) |
| 3 or 4 Children | 0 (0.0%) | 0 (0.0%) |
| 5 or more Children | 0 (0.0%) | 0 (0.0%) |
| Total | 32 (15.1%) | 150 (93.2%) |
Income Below Poverty Among Married-Couple vs Single-Parent Households in Goldendale
The poverty data for Goldendale shows that 14 of the married-couple family households (3.1%) and 182 of the single-parent households (48.8%) are living below the poverty level. Within the married-couple family households, those with no children have the highest poverty rate, with 14 households (4.5%) falling below the poverty line. Among the single-parent households, those with no children have the highest poverty rate, with 16 household (61.5%) living below poverty.
| Children | Married-Couple Families | Single-Parent Households |
| No Children | 14 (4.5%) | 16 (61.5%) |
| 1 or 2 Children | 0 (0.0%) | 166 (47.8%) |
| 3 or 4 Children | 0 (0.0%) | 0 (0.0%) |
| 5 or more Children | 0 (0.0%) | 0 (0.0%) |
| Total | 14 (3.1%) | 182 (48.8%) |
Race in Goldendale
The most populous races in Goldendale are White / Caucasian (3,212 | 93.2%), Two or more Races (112 | 3.3%), and Native / Alaskan (99 | 2.9%).
| Race | # Population | % Population |
| Asian | 10 | 0.3% |
| Black / African American | 1 | 0.0% |
| Hawaiian / Pacific | 0 | 0.0% |
| Hispanic or Latino | 83 | 2.4% |
| Native / Alaskan | 99 | 2.9% |
| White / Caucasian | 3,212 | 93.2% |
| Two or more Races | 112 | 3.3% |
| Some other Race | 14 | 0.4% |
| Total | 3,448 | 100.0% |
Ancestry in Goldendale
The most populous ancestries reported in Goldendale are German (891 | 25.8%), Irish (538 | 15.6%), American (495 | 14.4%), Dutch (245 | 7.1%), and English (161 | 4.7%), together accounting for 67.6% of all Goldendale residents.
| Ancestry | # Population | % Population |
| American | 495 | 14.4% |
| Basque | 11 | 0.3% |
| Canadian | 22 | 0.6% |
| Czech | 17 | 0.5% |
| Danish | 63 | 1.8% |
| Dutch | 245 | 7.1% |
| English | 161 | 4.7% |
| European | 65 | 1.9% |
| Finnish | 39 | 1.1% |
| German | 891 | 25.8% |
| Irish | 538 | 15.6% |
| Italian | 62 | 1.8% |
| Korean | 10 | 0.3% |
| Mexican | 43 | 1.3% |
| Norwegian | 101 | 2.9% |
| Ottawa | 39 | 1.1% |
| Polish | 24 | 0.7% |
| Portuguese | 101 | 2.9% |
| Puerto Rican | 8 | 0.2% |
| Scandinavian | 15 | 0.4% |
| Scotch-Irish | 15 | 0.4% |
| Scottish | 35 | 1.0% |
| Swedish | 85 | 2.5% |
| Swiss | 11 | 0.3% |
| Welsh | 95 | 2.8% |
| Yakama | 83 | 2.4% | View All 26 Rows |
Immigrants in Goldendale
The most numerous immigrant groups reported in Goldendale came from Canada (22 | 0.6%), Asia (10 | 0.3%), Philippines (10 | 0.3%), South Eastern Asia (10 | 0.3%), and Central America (7 | 0.2%), together accounting for 1.7% of all Goldendale residents.
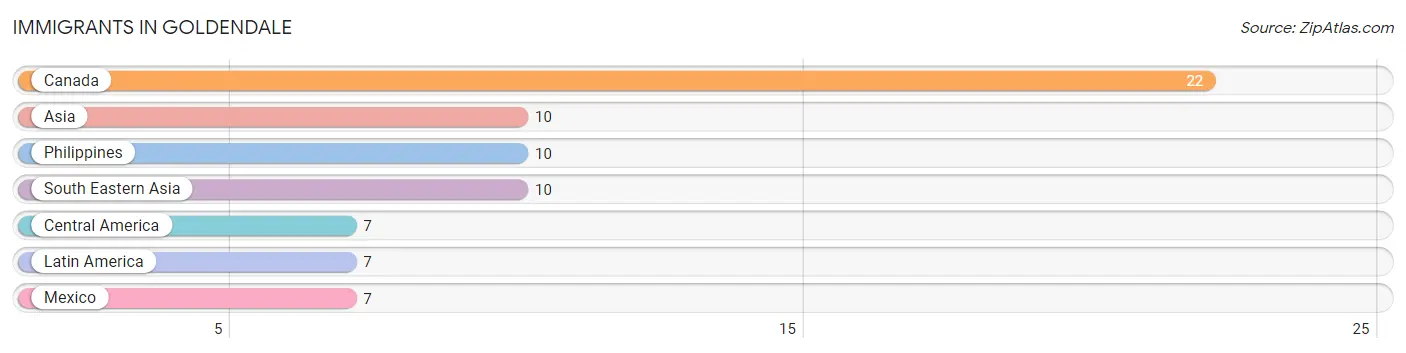
| Immigration Origin | # Population | % Population |
| Asia | 10 | 0.3% |
| Canada | 22 | 0.6% |
| Central America | 7 | 0.2% |
| Latin America | 7 | 0.2% |
| Mexico | 7 | 0.2% |
| Philippines | 10 | 0.3% |
| South Eastern Asia | 10 | 0.3% | View All 7 Rows |
Sex and Age in Goldendale
Sex and Age in Goldendale
The most populous age groups in Goldendale are 30 to 34 Years (328 | 19.5%) for men and 80 to 84 Years (196 | 11.1%) for women.
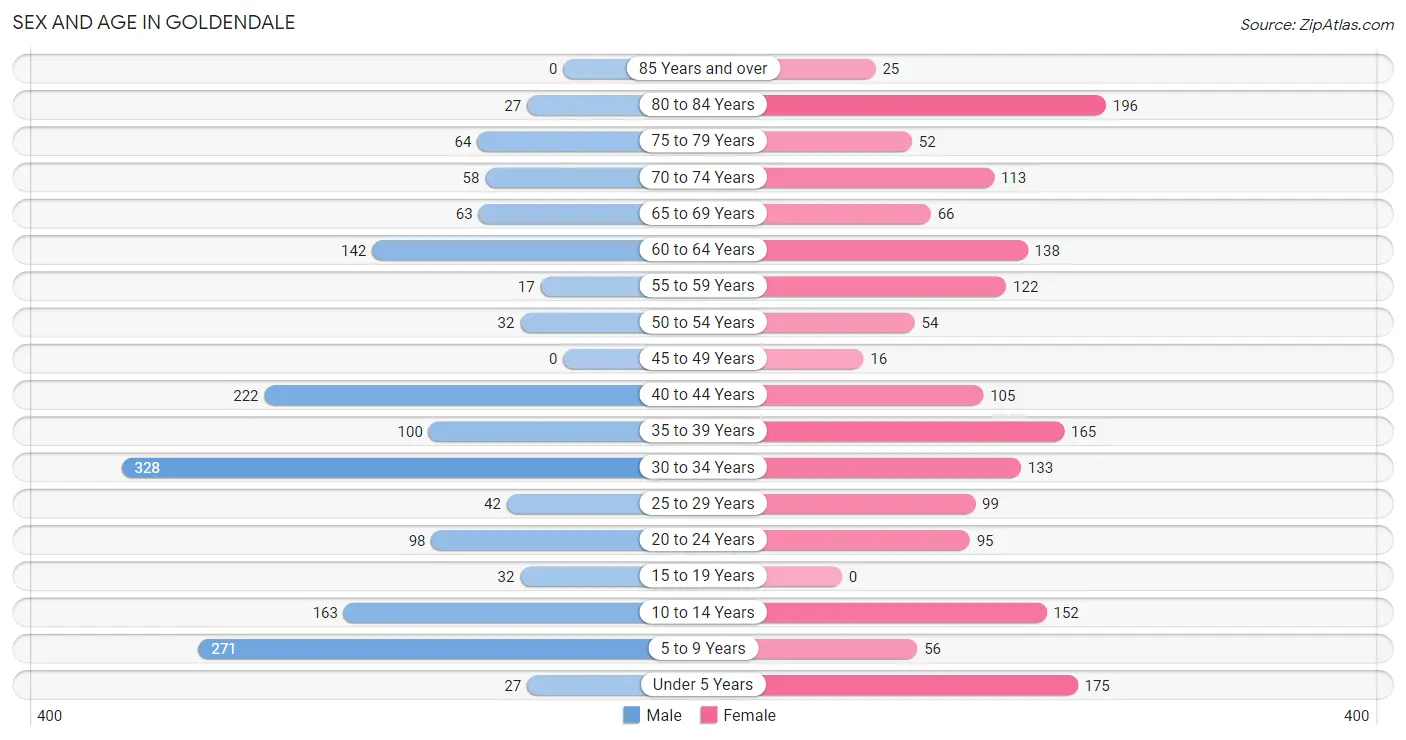
| Age Bracket | Male | Female |
| Under 5 Years | 27 (1.6%) | 175 (9.9%) |
| 5 to 9 Years | 271 (16.1%) | 56 (3.2%) |
| 10 to 14 Years | 163 (9.7%) | 152 (8.6%) |
| 15 to 19 Years | 32 (1.9%) | 0 (0.0%) |
| 20 to 24 Years | 98 (5.8%) | 95 (5.4%) |
| 25 to 29 Years | 42 (2.5%) | 99 (5.6%) |
| 30 to 34 Years | 328 (19.5%) | 133 (7.5%) |
| 35 to 39 Years | 100 (5.9%) | 165 (9.4%) |
| 40 to 44 Years | 222 (13.2%) | 105 (6.0%) |
| 45 to 49 Years | 0 (0.0%) | 16 (0.9%) |
| 50 to 54 Years | 32 (1.9%) | 54 (3.1%) |
| 55 to 59 Years | 17 (1.0%) | 122 (6.9%) |
| 60 to 64 Years | 142 (8.4%) | 138 (7.8%) |
| 65 to 69 Years | 63 (3.7%) | 66 (3.7%) |
| 70 to 74 Years | 58 (3.4%) | 113 (6.4%) |
| 75 to 79 Years | 64 (3.8%) | 52 (2.9%) |
| 80 to 84 Years | 27 (1.6%) | 196 (11.1%) |
| 85 Years and over | 0 (0.0%) | 25 (1.4%) |
| Total | 1,686 (100.0%) | 1,762 (100.0%) |
Families and Households in Goldendale
Median Family Size in Goldendale
The median family size in Goldendale is 2.89 persons per family, with single female/mother families (161 | 19.6%) accounting for the largest median family size of 3.27 persons per family. On the other hand, single male/father families (212 | 25.8%) represent the smallest median family size with 2.33 persons per family.
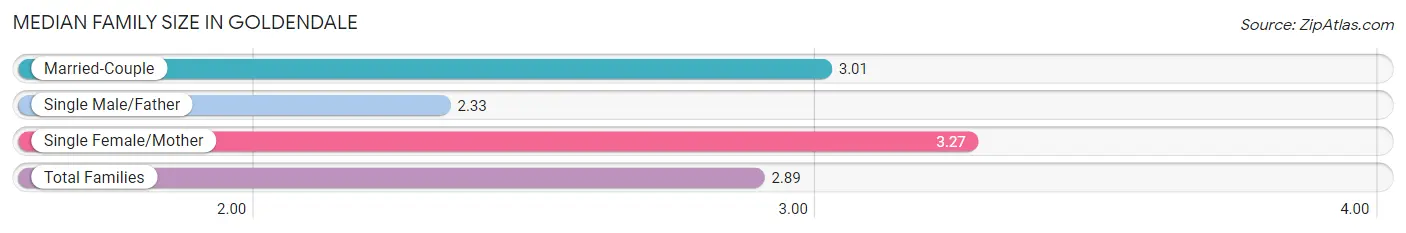
| Family Type | # Families | Family Size |
| Married-Couple | 448 (54.6%) | 3.01 |
| Single Male/Father | 212 (25.8%) | 2.33 |
| Single Female/Mother | 161 (19.6%) | 3.27 |
| Total Families | 821 (100.0%) | 2.89 |
Median Household Size in Goldendale
The median household size in Goldendale is 2.13 persons per household, with single female/mother households (161 | 10.1%) accounting for the largest median household size of 3.89 persons per household. non-family households (775 | 48.6%) represent the smallest median household size with 1.07 persons per household.
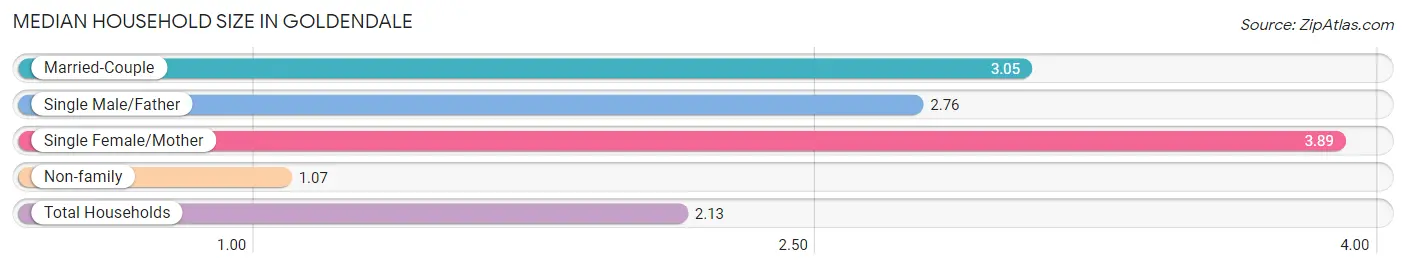
| Household Type | # Households | Household Size |
| Married-Couple | 448 (28.1%) | 3.05 |
| Single Male/Father | 212 (13.3%) | 2.76 |
| Single Female/Mother | 161 (10.1%) | 3.89 |
| Non-family | 775 (48.6%) | 1.07 |
| Total Households | 1,596 (100.0%) | 2.13 |
Household Size by Marriage Status in Goldendale
Out of a total of 1,596 households in Goldendale, 821 (51.4%) are family households, while 775 (48.6%) are nonfamily households. The most numerous type of family households are 2-person households, comprising 337, and the most common type of nonfamily households are 1-person households, comprising 732.
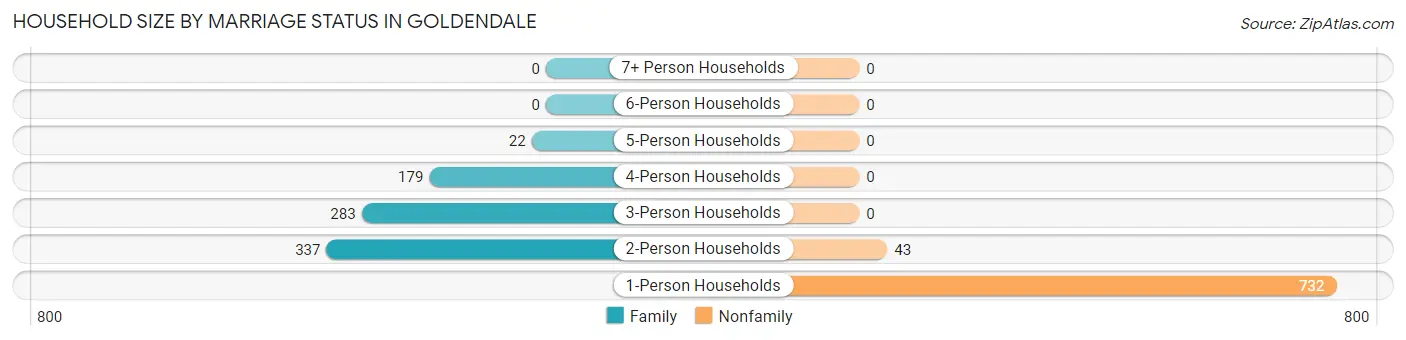
| Household Size | Family Households | Nonfamily Households |
| 1-Person Households | - | 732 (45.9%) |
| 2-Person Households | 337 (21.1%) | 43 (2.7%) |
| 3-Person Households | 283 (17.7%) | 0 (0.0%) |
| 4-Person Households | 179 (11.2%) | 0 (0.0%) |
| 5-Person Households | 22 (1.4%) | 0 (0.0%) |
| 6-Person Households | 0 (0.0%) | 0 (0.0%) |
| 7+ Person Households | 0 (0.0%) | 0 (0.0%) |
| Total | 821 (51.4%) | 775 (48.6%) |
Female Fertility in Goldendale
Fertility by Age in Goldendale
Average fertility rate in Goldendale is 124.0 births per 1,000 women. Women in the age bracket of 20 to 34 years have the highest fertility rate with 232.0 births per 1,000 women. Women in the age bracket of 20 to 34 years acount for 100.0% of all women with births.
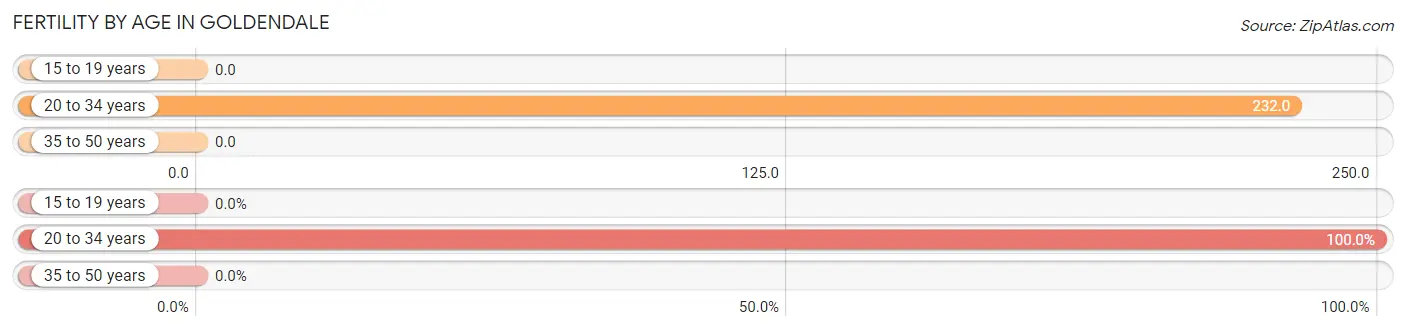
| Age Bracket | Women with Births | Births / 1,000 Women |
| 15 to 19 years | 0 (0.0%) | 0.0 |
| 20 to 34 years | 76 (100.0%) | 232.0 |
| 35 to 50 years | 0 (0.0%) | 0.0 |
| Total | 76 (100.0%) | 124.0 |
Fertility by Age by Marriage Status in Goldendale
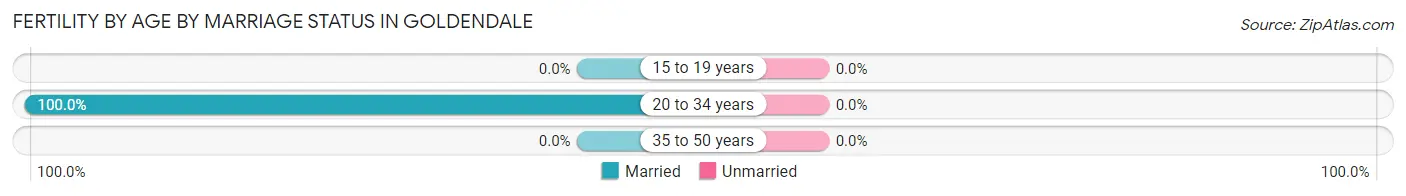
| Age Bracket | Married | Unmarried |
| 15 to 19 years | 0 (0.0%) | 0 (0.0%) |
| 20 to 34 years | 76 (100.0%) | 0 (0.0%) |
| 35 to 50 years | 0 (0.0%) | 0 (0.0%) |
| Total | 76 (100.0%) | 0 (0.0%) |
Fertility by Education in Goldendale
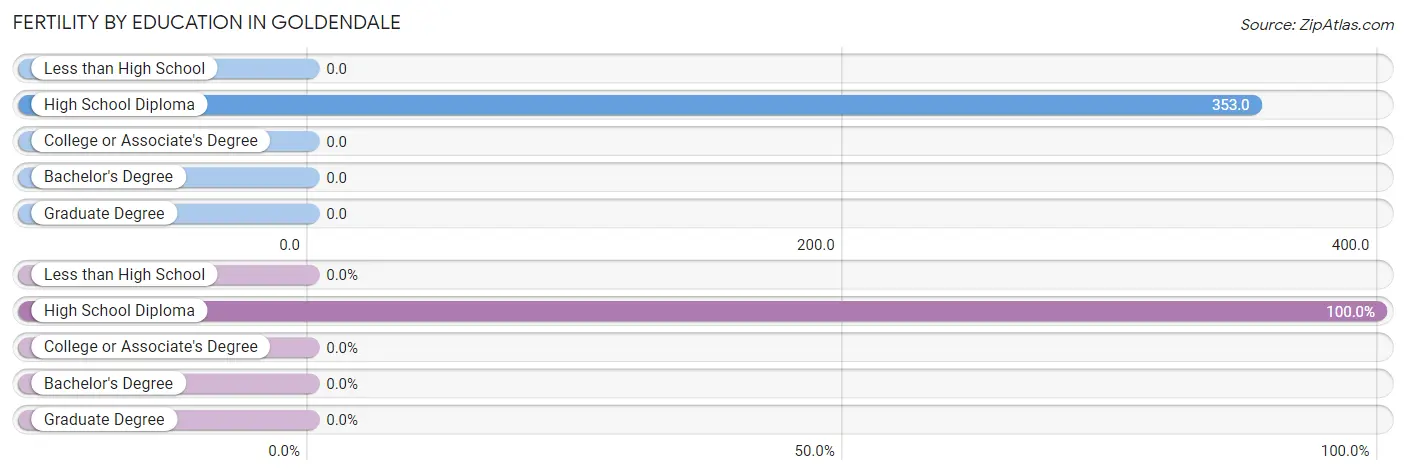
| Educational Attainment | Women with Births | Births / 1,000 Women |
| Less than High School | 0 (0.0%) | 0.0 |
| High School Diploma | 76 (100.0%) | 353.0 |
| College or Associate's Degree | 0 (0.0%) | 0.0 |
| Bachelor's Degree | 0 (0.0%) | 0.0 |
| Graduate Degree | 0 (0.0%) | 0.0 |
| Total | 76 (100.0%) | 124.0 |
Fertility by Education by Marriage Status in Goldendale
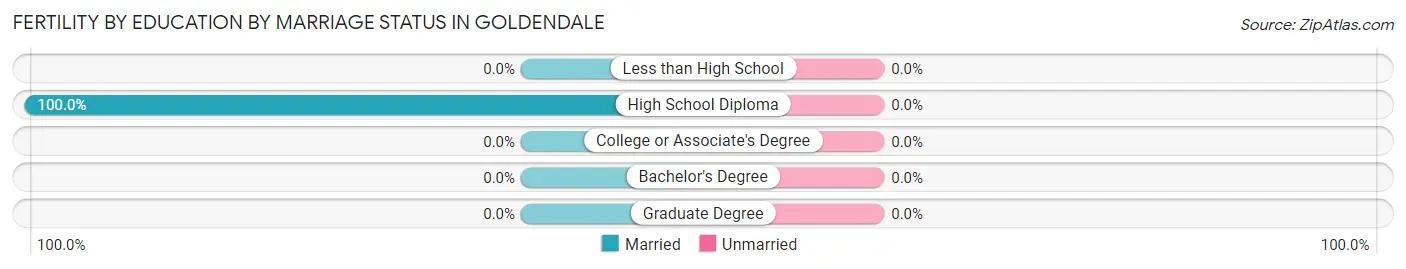
| Educational Attainment | Married | Unmarried |
| Less than High School | 0 (0.0%) | 0 (0.0%) |
| High School Diploma | 76 (100.0%) | 0 (0.0%) |
| College or Associate's Degree | 0 (0.0%) | 0 (0.0%) |
| Bachelor's Degree | 0 (0.0%) | 0 (0.0%) |
| Graduate Degree | 0 (0.0%) | 0 (0.0%) |
| Total | 76 (100.0%) | 0 (0.0%) |
Employment Characteristics in Goldendale
Employment by Class of Employer in Goldendale
Among the 1,190 employed individuals in Goldendale, private company employees (732 | 61.5%), local government employees (216 | 18.1%), and self-employed (not incorporated) (126 | 10.6%) make up the most common classes of employment.
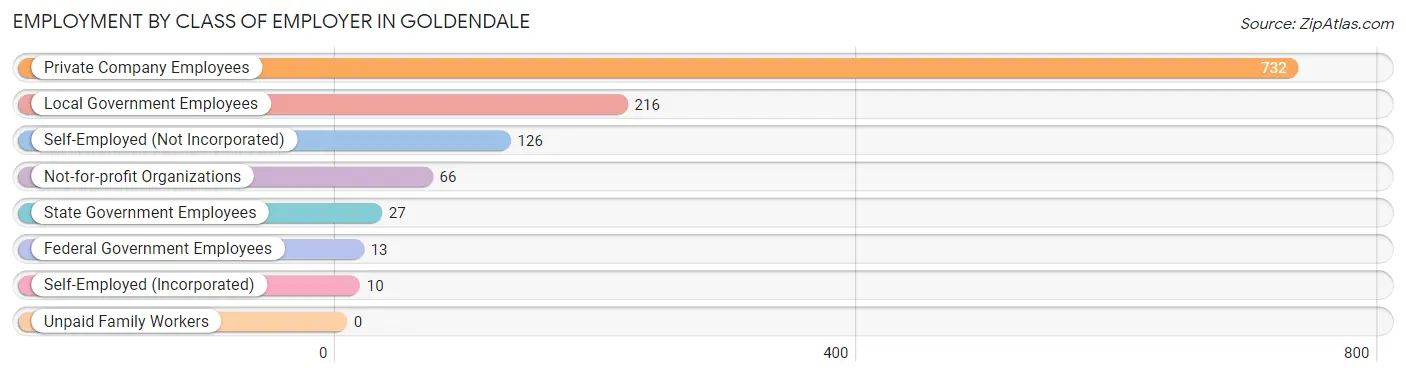
| Employer Class | # Employees | % Employees |
| Private Company Employees | 732 | 61.5% |
| Self-Employed (Incorporated) | 10 | 0.8% |
| Self-Employed (Not Incorporated) | 126 | 10.6% |
| Not-for-profit Organizations | 66 | 5.6% |
| Local Government Employees | 216 | 18.1% |
| State Government Employees | 27 | 2.3% |
| Federal Government Employees | 13 | 1.1% |
| Unpaid Family Workers | 0 | 0.0% |
| Total | 1,190 | 100.0% |
Employment Status by Age in Goldendale
According to the labor force statistics for Goldendale, out of the total population over 16 years of age (2,604), 56.2% or 1,463 individuals are in the labor force, with 18.7% or 274 of them unemployed. The age group with the highest labor force participation rate is 25 to 29 years, with 100.0% or 141 individuals in the labor force. Within the labor force, the 60 to 64 years age range has the highest percentage of unemployed individuals, with 64.2% or 61 of them being unemployed.
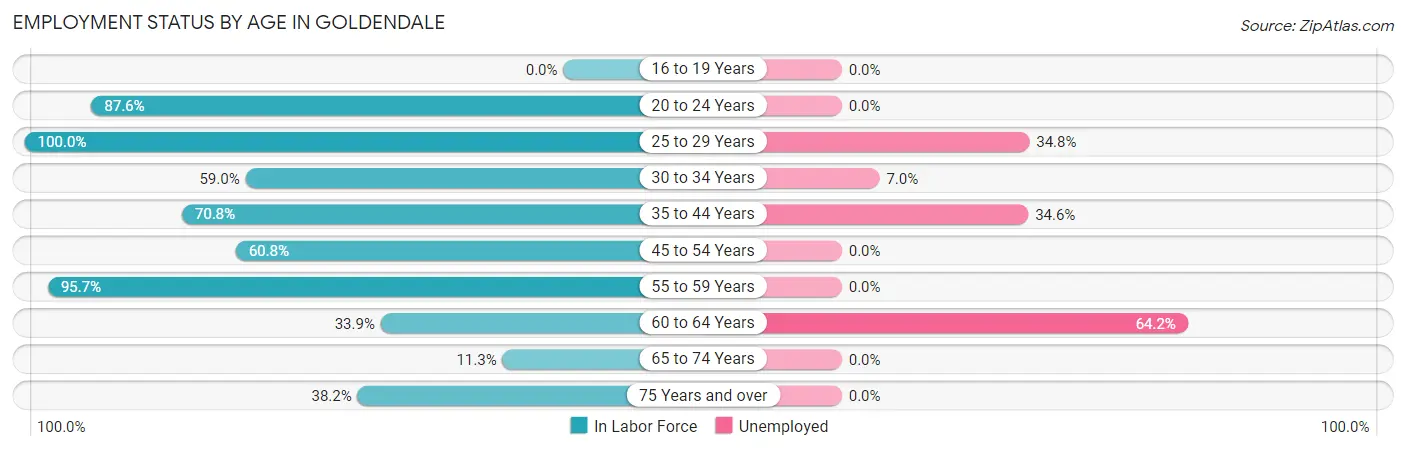
| Age Bracket | In Labor Force | Unemployed |
| 16 to 19 Years | 0 (0.0%) | 0 (0.0%) |
| 20 to 24 Years | 169 (87.6%) | 0 (0.0%) |
| 25 to 29 Years | 141 (100.0%) | 49 (34.8%) |
| 30 to 34 Years | 272 (59.0%) | 19 (7.0%) |
| 35 to 44 Years | 419 (70.8%) | 145 (34.6%) |
| 45 to 54 Years | 62 (60.8%) | 0 (0.0%) |
| 55 to 59 Years | 133 (95.7%) | 0 (0.0%) |
| 60 to 64 Years | 95 (33.9%) | 61 (64.2%) |
| 65 to 74 Years | 34 (11.3%) | 0 (0.0%) |
| 75 Years and over | 139 (38.2%) | 0 (0.0%) |
| Total | 1,463 (56.2%) | 274 (18.7%) |
Employment Status by Educational Attainment in Goldendale
According to labor force statistics for Goldendale, 65.4% of individuals (1,122) out of the total population between 25 and 64 years of age (1,715) are in the labor force, with 24.4% or 274 of them being unemployed. The group with the highest labor force participation rate are those with the educational attainment of bachelor's degree or higher, with 76.6% or 304 individuals in the labor force. Within the labor force, individuals with high school diploma education have the highest percentage of unemployment, with 32.6% or 129 of them being unemployed.
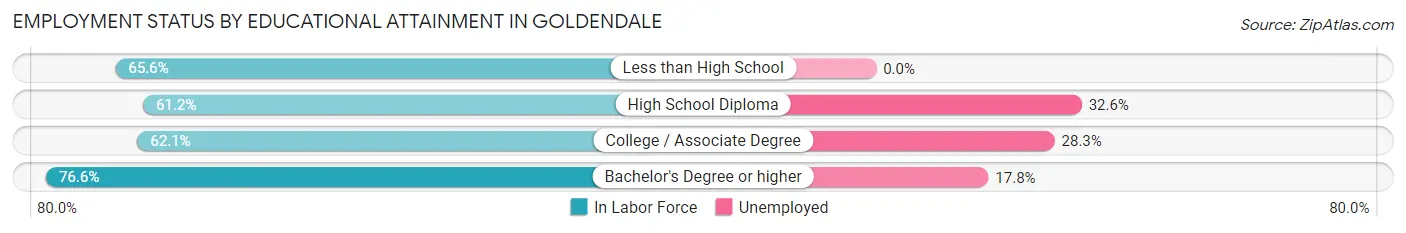
| Educational Attainment | In Labor Force | Unemployed |
| Less than High School | 101 (65.6%) | 0 (0.0%) |
| High School Diploma | 396 (61.2%) | 211 (32.6%) |
| College / Associate Degree | 321 (62.1%) | 146 (28.3%) |
| Bachelor's Degree or higher | 304 (76.6%) | 71 (17.8%) |
| Total | 1,122 (65.4%) | 418 (24.4%) |
Employment Occupations by Sex in Goldendale
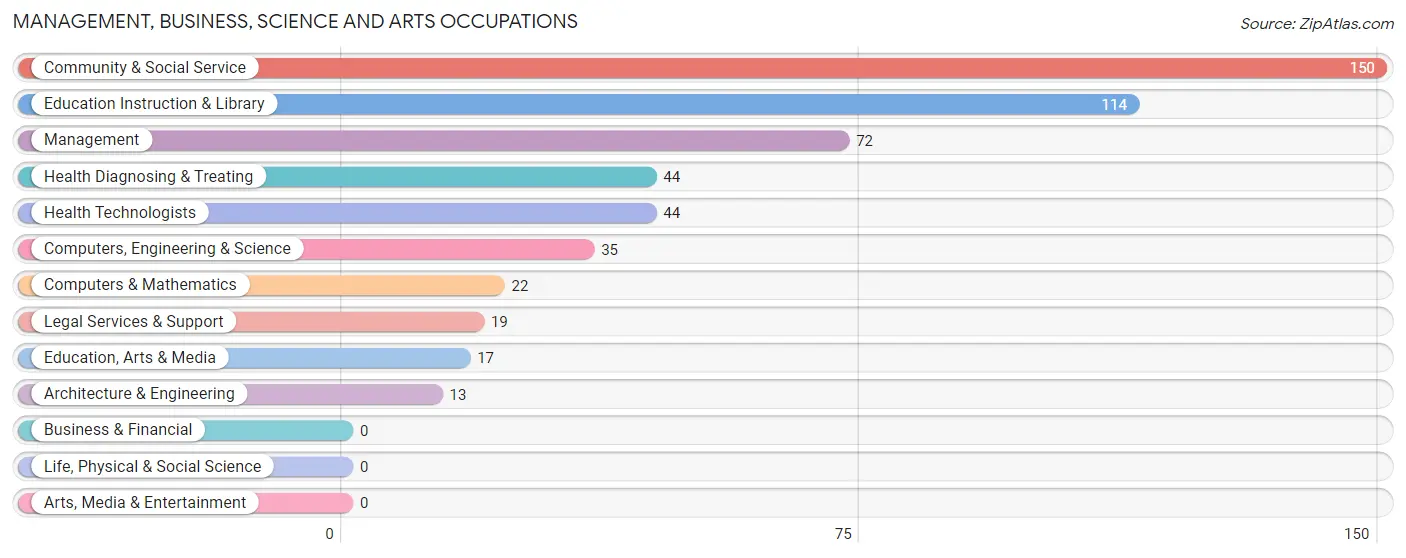
Management, Business, Science and Arts Occupations
The most common Management, Business, Science and Arts occupations in Goldendale are Community & Social Service (150 | 12.6%), Education Instruction & Library (114 | 9.6%), Management (72 | 6.0%), Health Diagnosing & Treating (44 | 3.7%), and Health Technologists (44 | 3.7%).
Management, Business, Science and Arts Occupations by Sex
Within the Management, Business, Science and Arts occupations in Goldendale, the most male-oriented occupations are Computers, Engineering & Science (100.0%), Computers & Mathematics (100.0%), and Architecture & Engineering (100.0%), while the most female-oriented occupations are Legal Services & Support (100.0%), Education Instruction & Library (100.0%), and Community & Social Service (88.7%).
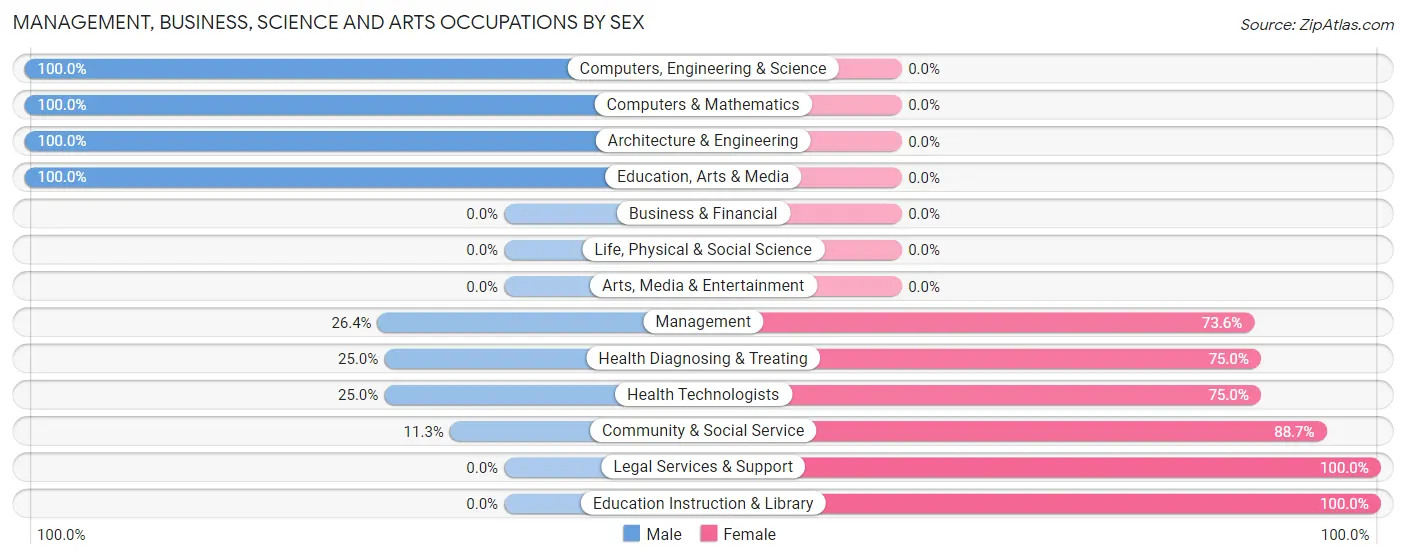
| Occupation | Male | Female |
| Management | 19 (26.4%) | 53 (73.6%) |
| Business & Financial | 0 (0.0%) | 0 (0.0%) |
| Computers, Engineering & Science | 35 (100.0%) | 0 (0.0%) |
| Computers & Mathematics | 22 (100.0%) | 0 (0.0%) |
| Architecture & Engineering | 13 (100.0%) | 0 (0.0%) |
| Life, Physical & Social Science | 0 (0.0%) | 0 (0.0%) |
| Community & Social Service | 17 (11.3%) | 133 (88.7%) |
| Education, Arts & Media | 17 (100.0%) | 0 (0.0%) |
| Legal Services & Support | 0 (0.0%) | 19 (100.0%) |
| Education Instruction & Library | 0 (0.0%) | 114 (100.0%) |
| Arts, Media & Entertainment | 0 (0.0%) | 0 (0.0%) |
| Health Diagnosing & Treating | 11 (25.0%) | 33 (75.0%) |
| Health Technologists | 11 (25.0%) | 33 (75.0%) |
| Total (Category) | 82 (27.2%) | 219 (72.8%) |
| Total (Overall) | 540 (45.4%) | 650 (54.6%) |
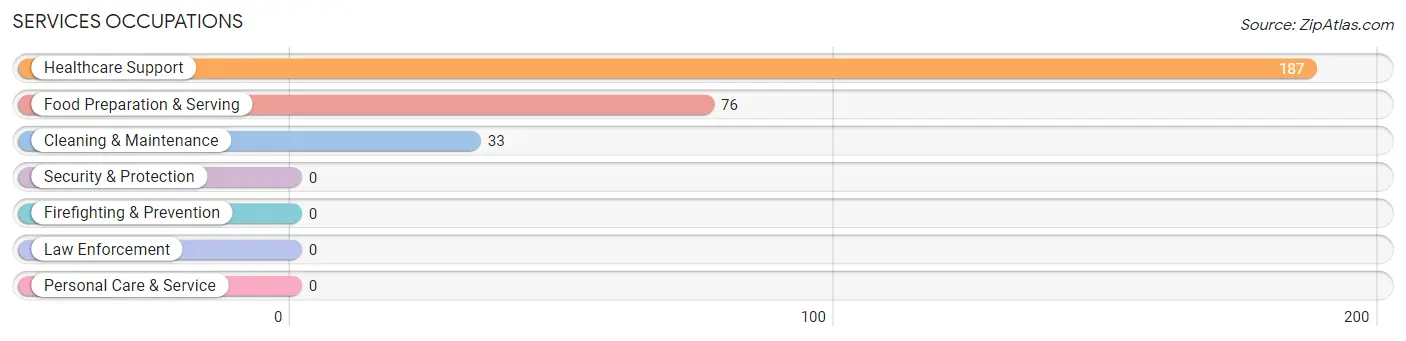
Services Occupations
The most common Services occupations in Goldendale are Healthcare Support (187 | 15.7%), Food Preparation & Serving (76 | 6.4%), and Cleaning & Maintenance (33 | 2.8%).
Services Occupations by Sex
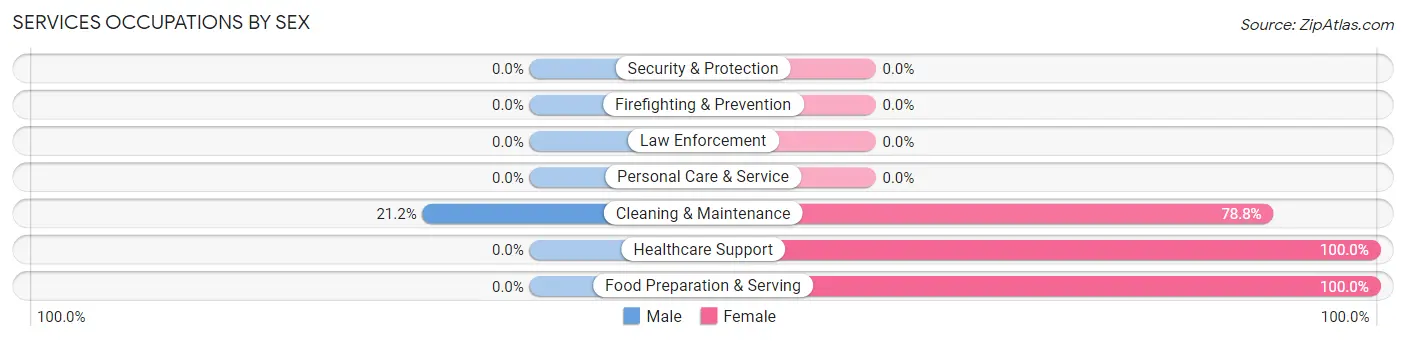
| Occupation | Male | Female |
| Healthcare Support | 0 (0.0%) | 187 (100.0%) |
| Security & Protection | 0 (0.0%) | 0 (0.0%) |
| Firefighting & Prevention | 0 (0.0%) | 0 (0.0%) |
| Law Enforcement | 0 (0.0%) | 0 (0.0%) |
| Food Preparation & Serving | 0 (0.0%) | 76 (100.0%) |
| Cleaning & Maintenance | 7 (21.2%) | 26 (78.8%) |
| Personal Care & Service | 0 (0.0%) | 0 (0.0%) |
| Total (Category) | 7 (2.4%) | 289 (97.6%) |
| Total (Overall) | 540 (45.4%) | 650 (54.6%) |
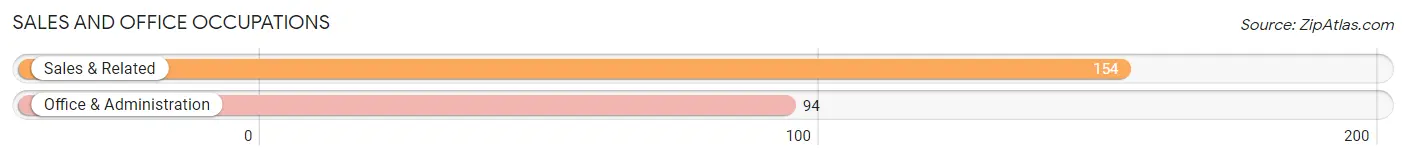
Sales and Office Occupations
The most common Sales and Office occupations in Goldendale are Sales & Related (154 | 12.9%), and Office & Administration (94 | 7.9%).
Sales and Office Occupations by Sex
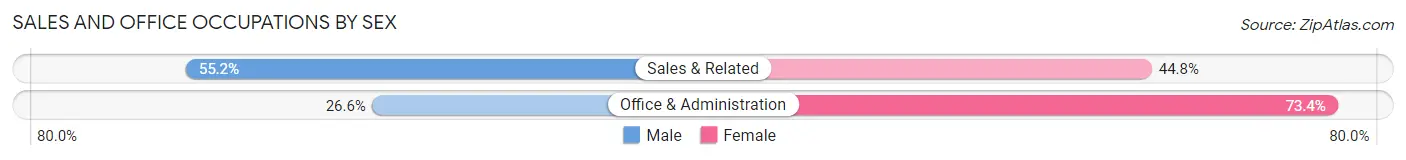
| Occupation | Male | Female |
| Sales & Related | 85 (55.2%) | 69 (44.8%) |
| Office & Administration | 25 (26.6%) | 69 (73.4%) |
| Total (Category) | 110 (44.4%) | 138 (55.6%) |
| Total (Overall) | 540 (45.4%) | 650 (54.6%) |
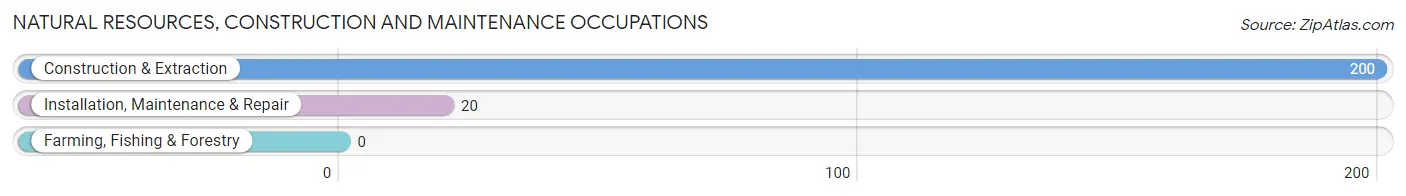
Natural Resources, Construction and Maintenance Occupations
The most common Natural Resources, Construction and Maintenance occupations in Goldendale are Construction & Extraction (200 | 16.8%), and Installation, Maintenance & Repair (20 | 1.7%).
Natural Resources, Construction and Maintenance Occupations by Sex
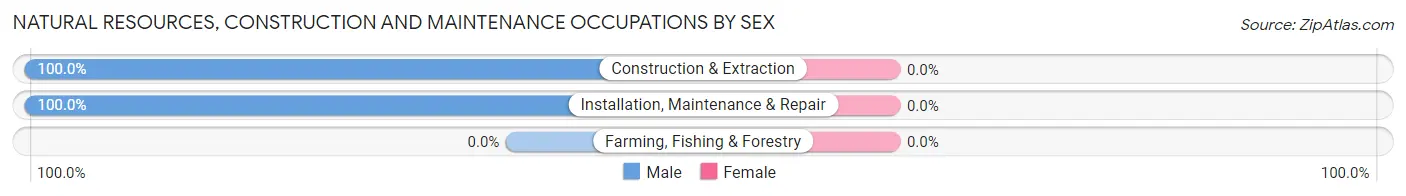
| Occupation | Male | Female |
| Farming, Fishing & Forestry | 0 (0.0%) | 0 (0.0%) |
| Construction & Extraction | 200 (100.0%) | 0 (0.0%) |
| Installation, Maintenance & Repair | 20 (100.0%) | 0 (0.0%) |
| Total (Category) | 220 (100.0%) | 0 (0.0%) |
| Total (Overall) | 540 (45.4%) | 650 (54.6%) |
Production, Transportation and Moving Occupations
The most common Production, Transportation and Moving occupations in Goldendale are Production (69 | 5.8%), Material Moving (38 | 3.2%), and Transportation (18 | 1.5%).
Production, Transportation and Moving Occupations by Sex
| Occupation | Male | Female |
| Production | 69 (100.0%) | 0 (0.0%) |
| Transportation | 14 (77.8%) | 4 (22.2%) |
| Material Moving | 38 (100.0%) | 0 (0.0%) |
| Total (Category) | 121 (96.8%) | 4 (3.2%) |
| Total (Overall) | 540 (45.4%) | 650 (54.6%) |
Employment Industries by Sex in Goldendale
Employment Industries in Goldendale
The major employment industries in Goldendale include Health Care & Social Assistance (281 | 23.6%), Accommodation & Food Services (197 | 16.6%), Educational Services (141 | 11.8%), Construction (117 | 9.8%), and Retail Trade (111 | 9.3%).
Employment Industries by Sex in Goldendale
The Goldendale industries that see more men than women are Agriculture, Fishing & Hunting (100.0%), Construction (100.0%), and Manufacturing (100.0%), whereas the industries that tend to have a higher number of women are Finance & Insurance (100.0%), Public Administration (100.0%), and Health Care & Social Assistance (96.1%).
| Industry | Male | Female |
| Agriculture, Fishing & Hunting | 5 (100.0%) | 0 (0.0%) |
| Mining, Quarrying, & Extraction | 0 (0.0%) | 0 (0.0%) |
| Construction | 117 (100.0%) | 0 (0.0%) |
| Manufacturing | 67 (100.0%) | 0 (0.0%) |
| Wholesale Trade | 0 (0.0%) | 0 (0.0%) |
| Retail Trade | 42 (37.8%) | 69 (62.2%) |
| Transportation & Warehousing | 14 (77.8%) | 4 (22.2%) |
| Utilities | 65 (100.0%) | 0 (0.0%) |
| Information | 6 (100.0%) | 0 (0.0%) |
| Finance & Insurance | 0 (0.0%) | 43 (100.0%) |
| Real Estate, Rental & Leasing | 0 (0.0%) | 0 (0.0%) |
| Professional & Scientific | 22 (100.0%) | 0 (0.0%) |
| Enterprise Management | 0 (0.0%) | 0 (0.0%) |
| Administrative & Support | 48 (100.0%) | 0 (0.0%) |
| Educational Services | 19 (13.5%) | 122 (86.5%) |
| Health Care & Social Assistance | 11 (3.9%) | 270 (96.1%) |
| Arts, Entertainment & Recreation | 7 (21.2%) | 26 (78.8%) |
| Accommodation & Food Services | 100 (50.8%) | 97 (49.2%) |
| Public Administration | 0 (0.0%) | 19 (100.0%) |
| Total | 540 (45.4%) | 650 (54.6%) |
Education in Goldendale
School Enrollment in Goldendale
The most common levels of schooling among the 752 students in Goldendale are elementary school (328 | 43.6%), middle school (201 | 26.7%), and high school (89 | 11.8%).
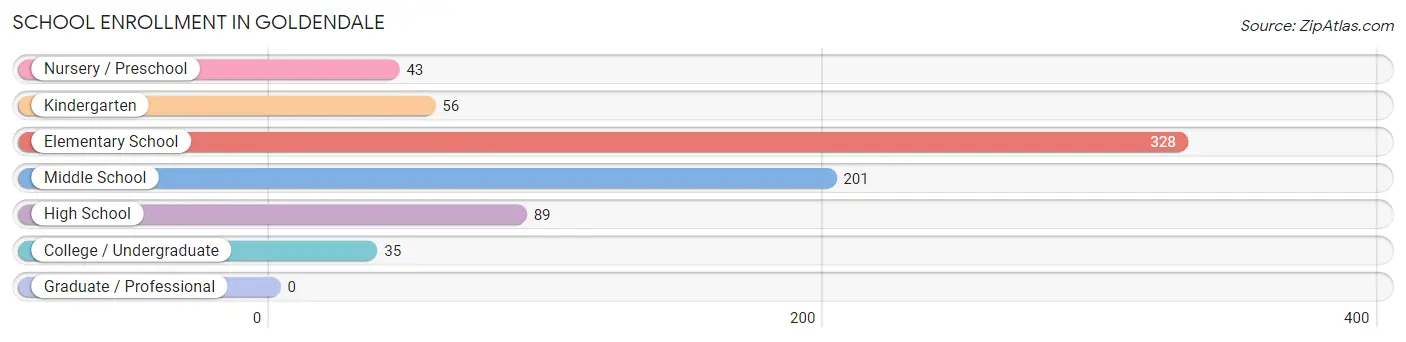
| School Level | # Students | % Students |
| Nursery / Preschool | 43 | 5.7% |
| Kindergarten | 56 | 7.4% |
| Elementary School | 328 | 43.6% |
| Middle School | 201 | 26.7% |
| High School | 89 | 11.8% |
| College / Undergraduate | 35 | 4.6% |
| Graduate / Professional | 0 | 0.0% |
| Total | 752 | 100.0% |
School Enrollment by Age by Funding Source in Goldendale
Out of a total of 752 students who are enrolled in schools in Goldendale, 86 (11.4%) attend a private institution, while the remaining 666 (88.6%) are enrolled in public schools. The age group of 3 to 4 year olds has the highest likelihood of being enrolled in private schools, with 43 (100.0% in the age bracket) enrolled. Conversely, the age group of 5 to 9 year old has the lowest likelihood of being enrolled in a private school, with 327 (100.0% in the age bracket) attending a public institution.
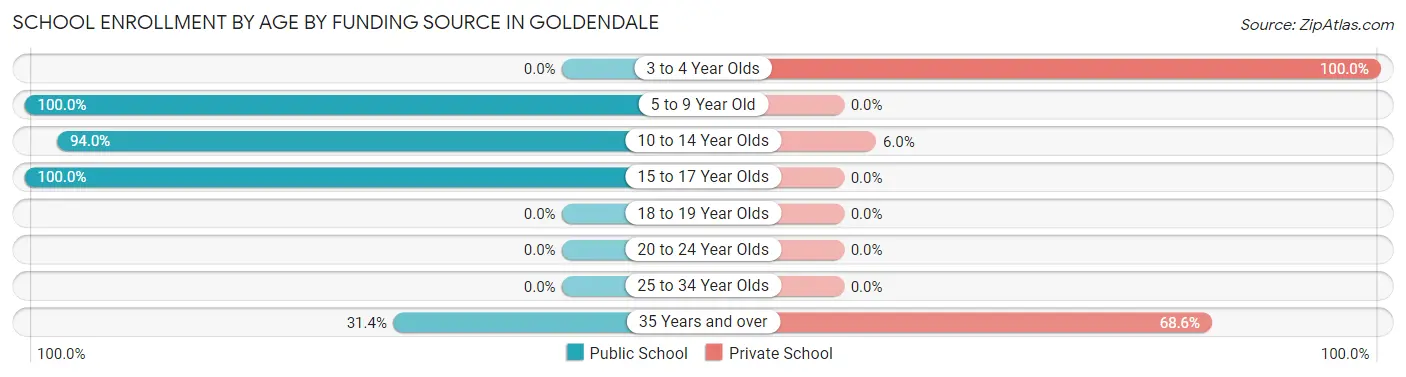
| Age Bracket | Public School | Private School |
| 3 to 4 Year Olds | 0 (0.0%) | 43 (100.0%) |
| 5 to 9 Year Old | 327 (100.0%) | 0 (0.0%) |
| 10 to 14 Year Olds | 296 (94.0%) | 19 (6.0%) |
| 15 to 17 Year Olds | 32 (100.0%) | 0 (0.0%) |
| 18 to 19 Year Olds | 0 (0.0%) | 0 (0.0%) |
| 20 to 24 Year Olds | 0 (0.0%) | 0 (0.0%) |
| 25 to 34 Year Olds | 0 (0.0%) | 0 (0.0%) |
| 35 Years and over | 11 (31.4%) | 24 (68.6%) |
| Total | 666 (88.6%) | 86 (11.4%) |
Educational Attainment by Field of Study in Goldendale
Science & technology (76 | 15.7%), business (74 | 15.3%), liberal arts & history (73 | 15.1%), education (65 | 13.5%), and literature & languages (62 | 12.8%) are the most common fields of study among 483 individuals in Goldendale who have obtained a bachelor's degree or higher.
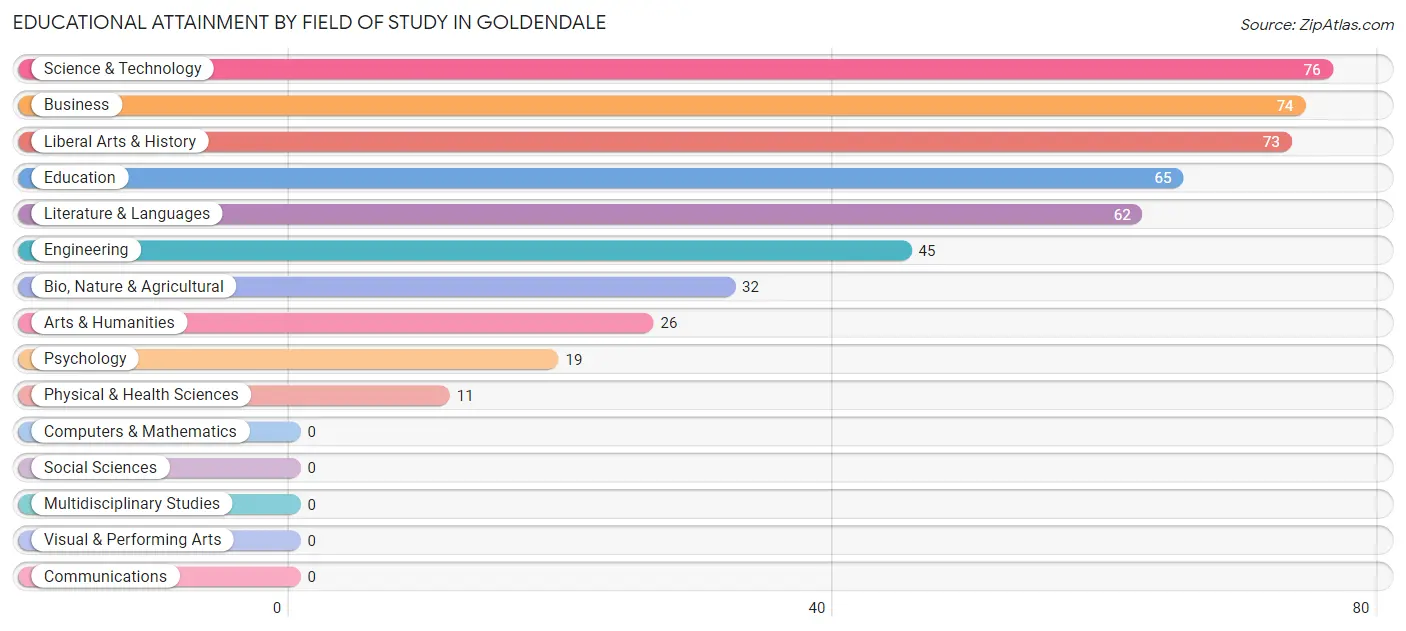
| Field of Study | # Graduates | % Graduates |
| Computers & Mathematics | 0 | 0.0% |
| Bio, Nature & Agricultural | 32 | 6.6% |
| Physical & Health Sciences | 11 | 2.3% |
| Psychology | 19 | 3.9% |
| Social Sciences | 0 | 0.0% |
| Engineering | 45 | 9.3% |
| Multidisciplinary Studies | 0 | 0.0% |
| Science & Technology | 76 | 15.7% |
| Business | 74 | 15.3% |
| Education | 65 | 13.5% |
| Literature & Languages | 62 | 12.8% |
| Liberal Arts & History | 73 | 15.1% |
| Visual & Performing Arts | 0 | 0.0% |
| Communications | 0 | 0.0% |
| Arts & Humanities | 26 | 5.4% |
| Total | 483 | 100.0% |
Transportation & Commute in Goldendale
Vehicle Availability by Sex in Goldendale
The most prevalent vehicle ownership categories in Goldendale are males with 1 vehicle (219, accounting for 40.9%) and females with 1 vehicle (284, making up 33.7%).
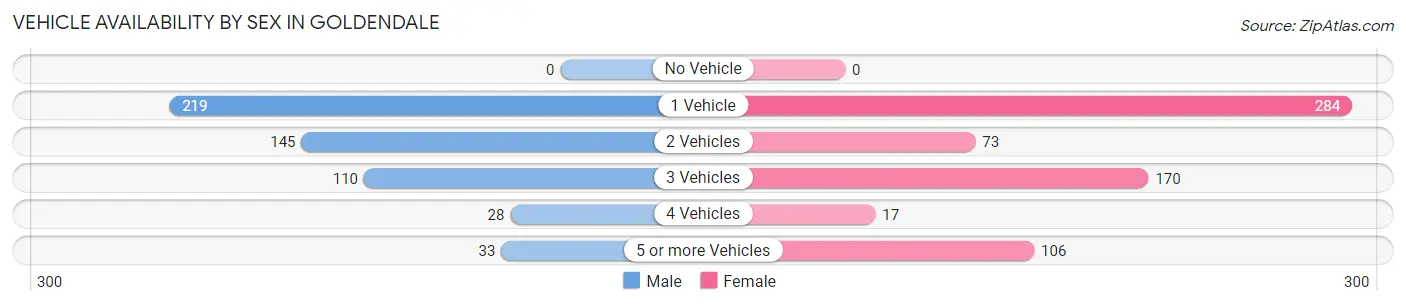
| Vehicles Available | Male | Female |
| No Vehicle | 0 (0.0%) | 0 (0.0%) |
| 1 Vehicle | 219 (40.9%) | 284 (43.7%) |
| 2 Vehicles | 145 (27.1%) | 73 (11.2%) |
| 3 Vehicles | 110 (20.6%) | 170 (26.2%) |
| 4 Vehicles | 28 (5.2%) | 17 (2.6%) |
| 5 or more Vehicles | 33 (6.2%) | 106 (16.3%) |
| Total | 535 (100.0%) | 650 (100.0%) |
Commute Time in Goldendale
The most frequently occuring commute durations in Goldendale are less than 5 minutes (319 commuters, 27.7%), 45 to 59 minutes (210 commuters, 18.2%), and 15 to 19 minutes (186 commuters, 16.2%).
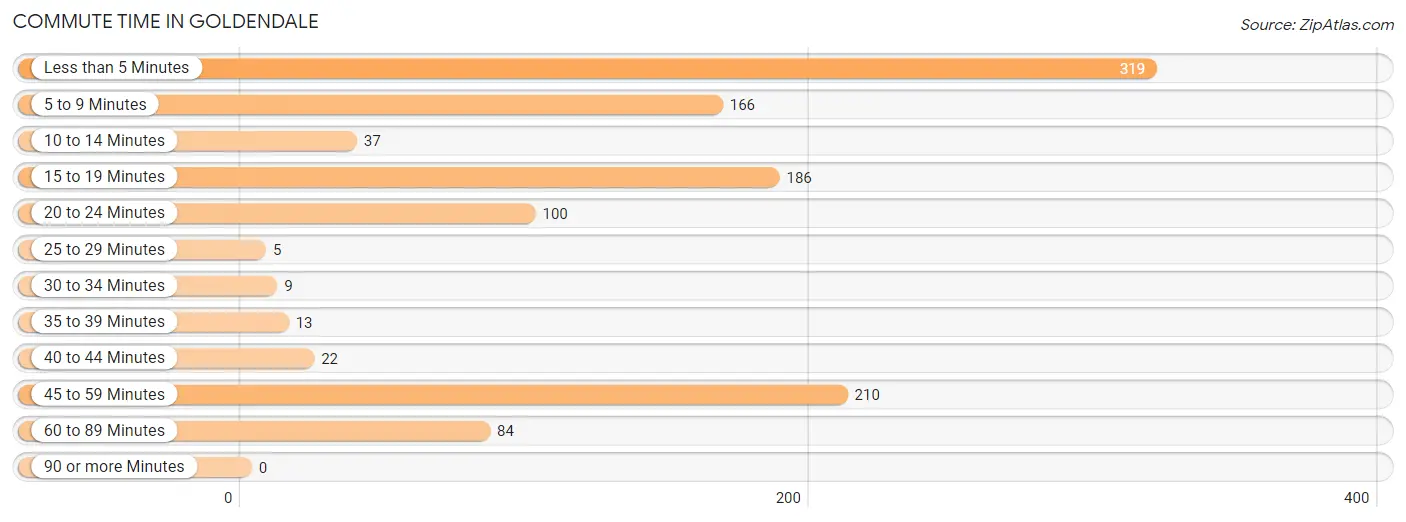
| Commute Time | # Commuters | % Commuters |
| Less than 5 Minutes | 319 | 27.7% |
| 5 to 9 Minutes | 166 | 14.4% |
| 10 to 14 Minutes | 37 | 3.2% |
| 15 to 19 Minutes | 186 | 16.2% |
| 20 to 24 Minutes | 100 | 8.7% |
| 25 to 29 Minutes | 5 | 0.4% |
| 30 to 34 Minutes | 9 | 0.8% |
| 35 to 39 Minutes | 13 | 1.1% |
| 40 to 44 Minutes | 22 | 1.9% |
| 45 to 59 Minutes | 210 | 18.2% |
| 60 to 89 Minutes | 84 | 7.3% |
| 90 or more Minutes | 0 | 0.0% |
Commute Time by Sex in Goldendale
The most common commute times in Goldendale are 45 to 59 minutes (210 commuters, 41.9%) for males and less than 5 minutes (281 commuters, 43.2%) for females.
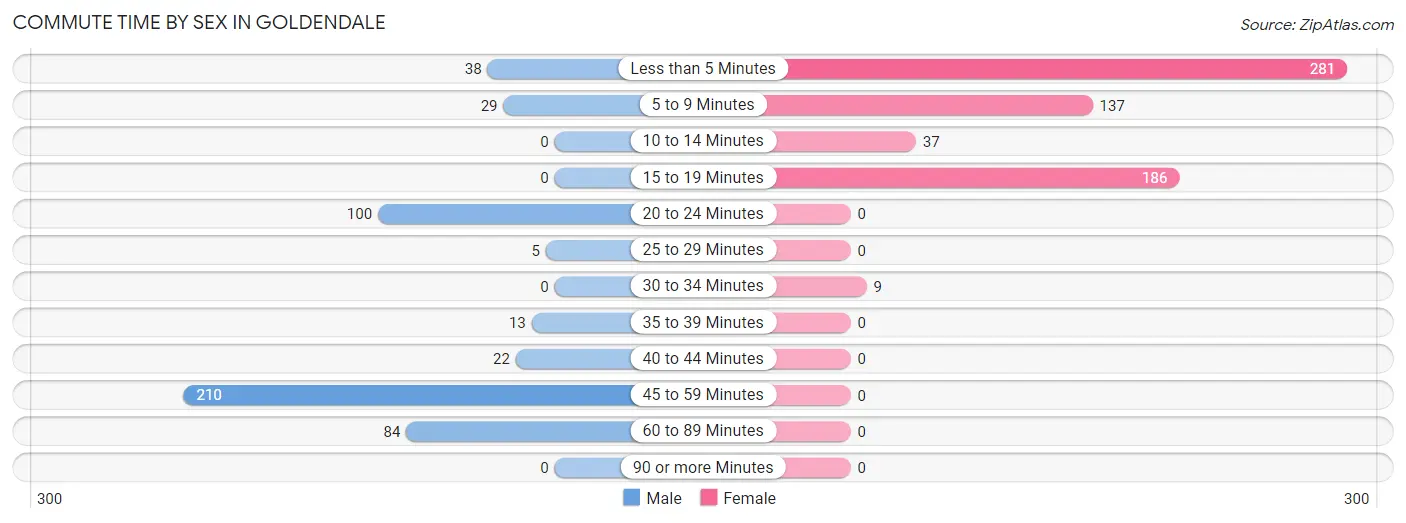
| Commute Time | Male | Female |
| Less than 5 Minutes | 38 (7.6%) | 281 (43.2%) |
| 5 to 9 Minutes | 29 (5.8%) | 137 (21.1%) |
| 10 to 14 Minutes | 0 (0.0%) | 37 (5.7%) |
| 15 to 19 Minutes | 0 (0.0%) | 186 (28.6%) |
| 20 to 24 Minutes | 100 (20.0%) | 0 (0.0%) |
| 25 to 29 Minutes | 5 (1.0%) | 0 (0.0%) |
| 30 to 34 Minutes | 0 (0.0%) | 9 (1.4%) |
| 35 to 39 Minutes | 13 (2.6%) | 0 (0.0%) |
| 40 to 44 Minutes | 22 (4.4%) | 0 (0.0%) |
| 45 to 59 Minutes | 210 (41.9%) | 0 (0.0%) |
| 60 to 89 Minutes | 84 (16.8%) | 0 (0.0%) |
| 90 or more Minutes | 0 (0.0%) | 0 (0.0%) |
Time of Departure to Work by Sex in Goldendale
The most frequent times of departure to work in Goldendale are 6:00 AM to 6:29 AM (166, 33.1%) for males and 7:00 AM to 7:29 AM (238, 36.6%) for females.
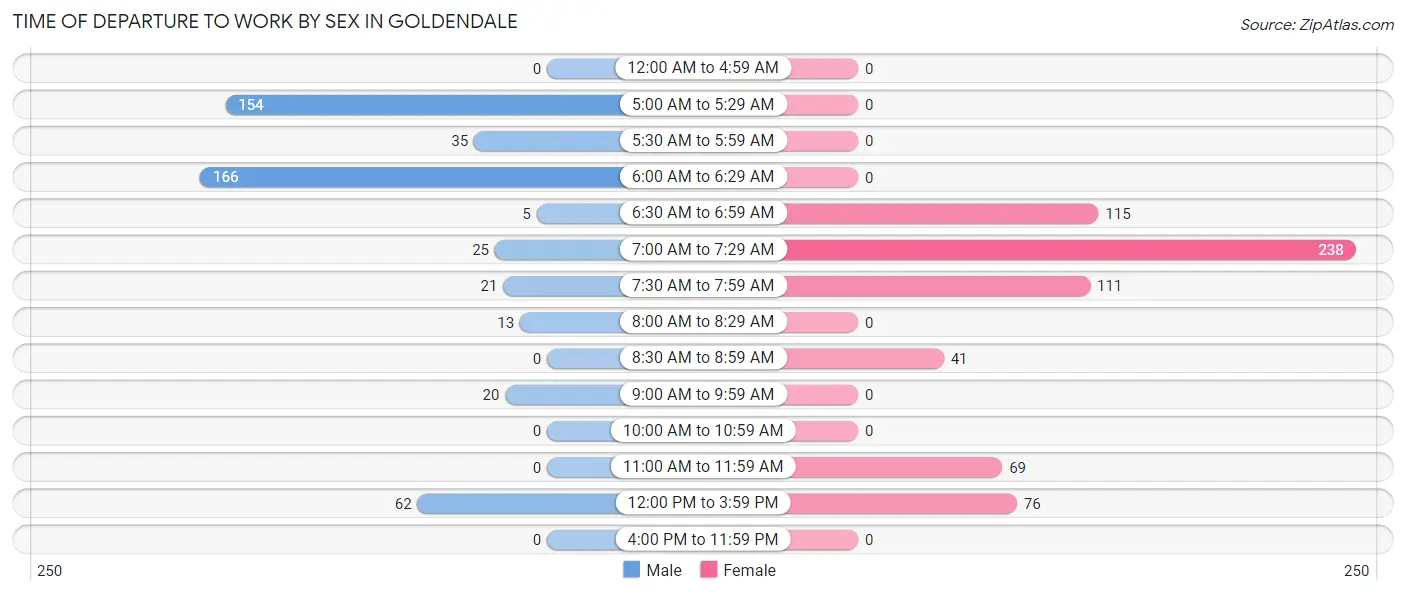
| Time of Departure | Male | Female |
| 12:00 AM to 4:59 AM | 0 (0.0%) | 0 (0.0%) |
| 5:00 AM to 5:29 AM | 154 (30.7%) | 0 (0.0%) |
| 5:30 AM to 5:59 AM | 35 (7.0%) | 0 (0.0%) |
| 6:00 AM to 6:29 AM | 166 (33.1%) | 0 (0.0%) |
| 6:30 AM to 6:59 AM | 5 (1.0%) | 115 (17.7%) |
| 7:00 AM to 7:29 AM | 25 (5.0%) | 238 (36.6%) |
| 7:30 AM to 7:59 AM | 21 (4.2%) | 111 (17.1%) |
| 8:00 AM to 8:29 AM | 13 (2.6%) | 0 (0.0%) |
| 8:30 AM to 8:59 AM | 0 (0.0%) | 41 (6.3%) |
| 9:00 AM to 9:59 AM | 20 (4.0%) | 0 (0.0%) |
| 10:00 AM to 10:59 AM | 0 (0.0%) | 0 (0.0%) |
| 11:00 AM to 11:59 AM | 0 (0.0%) | 69 (10.6%) |
| 12:00 PM to 3:59 PM | 62 (12.4%) | 76 (11.7%) |
| 4:00 PM to 11:59 PM | 0 (0.0%) | 0 (0.0%) |
| Total | 501 (100.0%) | 650 (100.0%) |
Housing Occupancy in Goldendale
Occupancy by Ownership in Goldendale
Of the total 1,596 dwellings in Goldendale, owner-occupied units account for 812 (50.9%), while renter-occupied units make up 784 (49.1%).
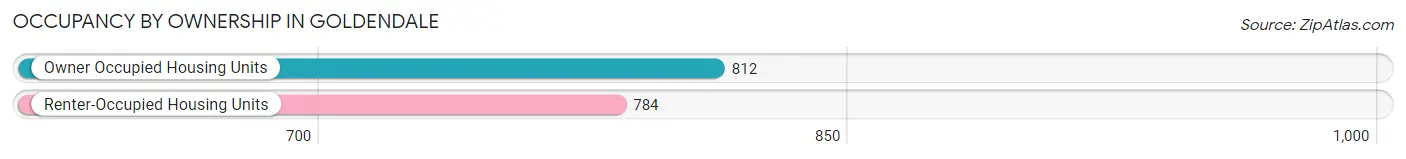
| Occupancy | # Housing Units | % Housing Units |
| Owner Occupied Housing Units | 812 | 50.9% |
| Renter-Occupied Housing Units | 784 | 49.1% |
| Total Occupied Housing Units | 1,596 | 100.0% |
Occupancy by Household Size in Goldendale
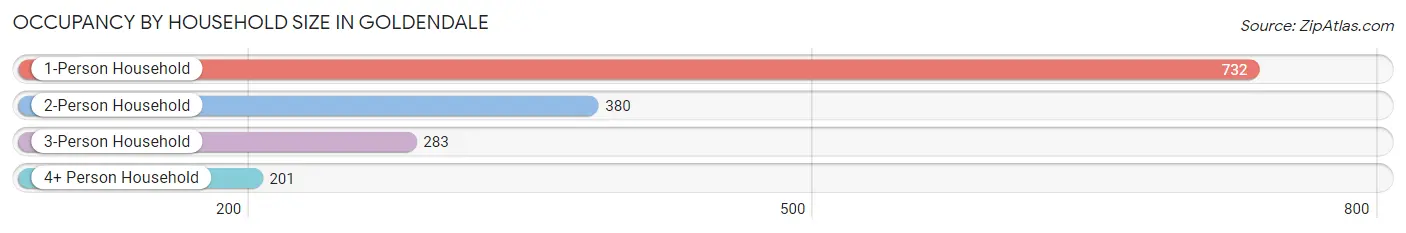
| Household Size | # Housing Units | % Housing Units |
| 1-Person Household | 732 | 45.9% |
| 2-Person Household | 380 | 23.8% |
| 3-Person Household | 283 | 17.7% |
| 4+ Person Household | 201 | 12.6% |
| Total Housing Units | 1,596 | 100.0% |
Occupancy by Ownership by Household Size in Goldendale
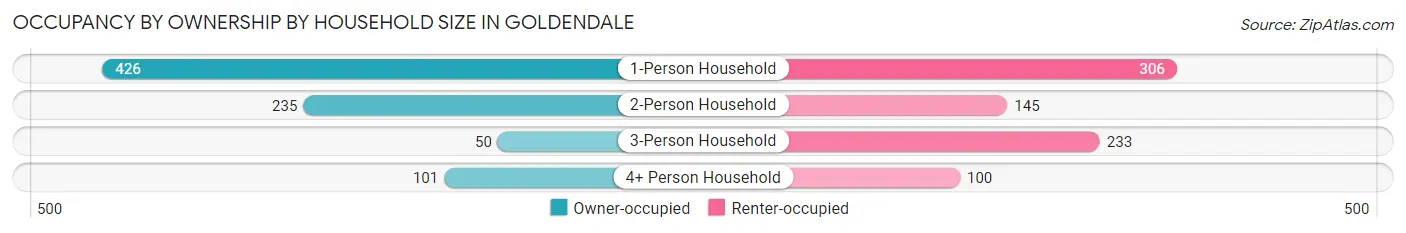
| Household Size | Owner-occupied | Renter-occupied |
| 1-Person Household | 426 (58.2%) | 306 (41.8%) |
| 2-Person Household | 235 (61.8%) | 145 (38.2%) |
| 3-Person Household | 50 (17.7%) | 233 (82.3%) |
| 4+ Person Household | 101 (50.2%) | 100 (49.7%) |
| Total Housing Units | 812 (50.9%) | 784 (49.1%) |
Occupancy by Educational Attainment in Goldendale
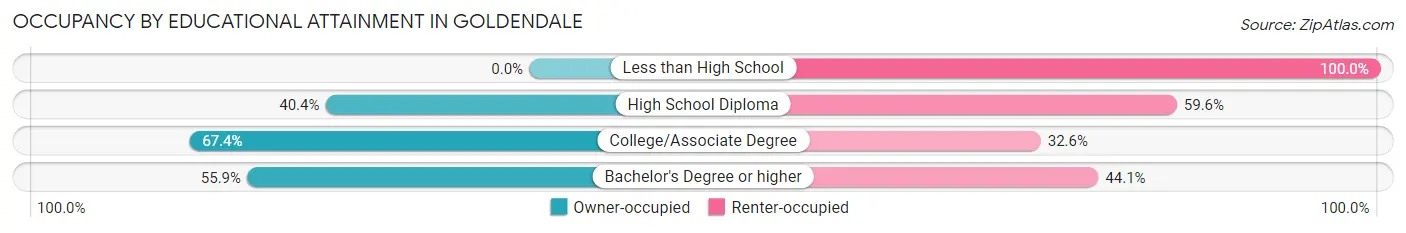
| Household Size | Owner-occupied | Renter-occupied |
| Less than High School | 0 (0.0%) | 113 (100.0%) |
| High School Diploma | 231 (40.4%) | 341 (59.6%) |
| College/Associate Degree | 421 (67.4%) | 204 (32.6%) |
| Bachelor's Degree or higher | 160 (55.9%) | 126 (44.1%) |
Occupancy by Age of Householder in Goldendale

| Age Bracket | # Households | % Households |
| Under 35 Years | 388 | 24.3% |
| 35 to 44 Years | 395 | 24.7% |
| 45 to 54 Years | 56 | 3.5% |
| 55 to 64 Years | 268 | 16.8% |
| 65 to 74 Years | 228 | 14.3% |
| 75 to 84 Years | 261 | 16.4% |
| 85 Years and Over | 0 | 0.0% |
| Total | 1,596 | 100.0% |
Housing Finances in Goldendale
Median Income by Occupancy in Goldendale
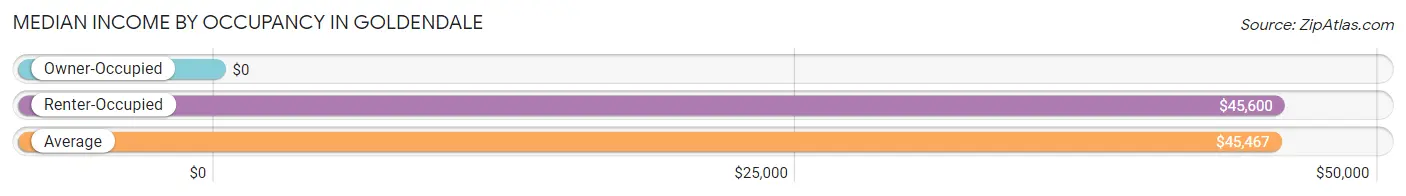
| Occupancy Type | # Households | Median Income |
| Owner-Occupied | 812 (50.9%) | $0 |
| Renter-Occupied | 784 (49.1%) | $45,600 |
| Average | 1,596 (100.0%) | $45,467 |
Occupancy by Householder Income Bracket in Goldendale
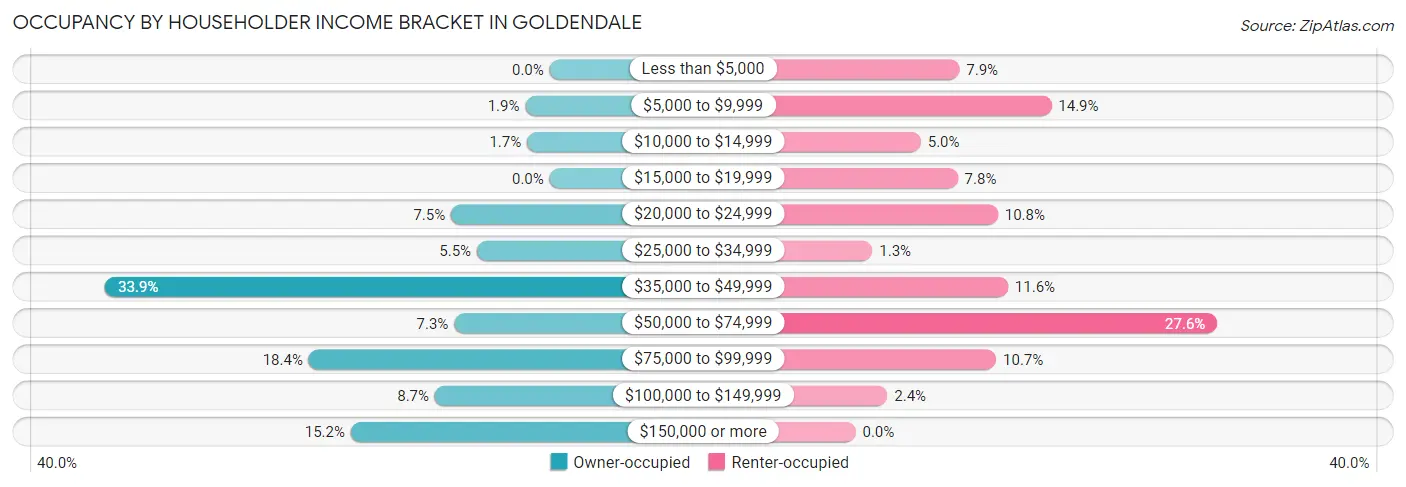
| Income Bracket | Owner-occupied | Renter-occupied |
| Less than $5,000 | 0 (0.0%) | 62 (7.9%) |
| $5,000 to $9,999 | 15 (1.8%) | 117 (14.9%) |
| $10,000 to $14,999 | 14 (1.7%) | 39 (5.0%) |
| $15,000 to $19,999 | 0 (0.0%) | 61 (7.8%) |
| $20,000 to $24,999 | 61 (7.5%) | 85 (10.8%) |
| $25,000 to $34,999 | 45 (5.5%) | 10 (1.3%) |
| $35,000 to $49,999 | 275 (33.9%) | 91 (11.6%) |
| $50,000 to $74,999 | 59 (7.3%) | 216 (27.6%) |
| $75,000 to $99,999 | 149 (18.3%) | 84 (10.7%) |
| $100,000 to $149,999 | 71 (8.7%) | 19 (2.4%) |
| $150,000 or more | 123 (15.1%) | 0 (0.0%) |
| Total | 812 (100.0%) | 784 (100.0%) |
Monthly Housing Cost Tiers in Goldendale
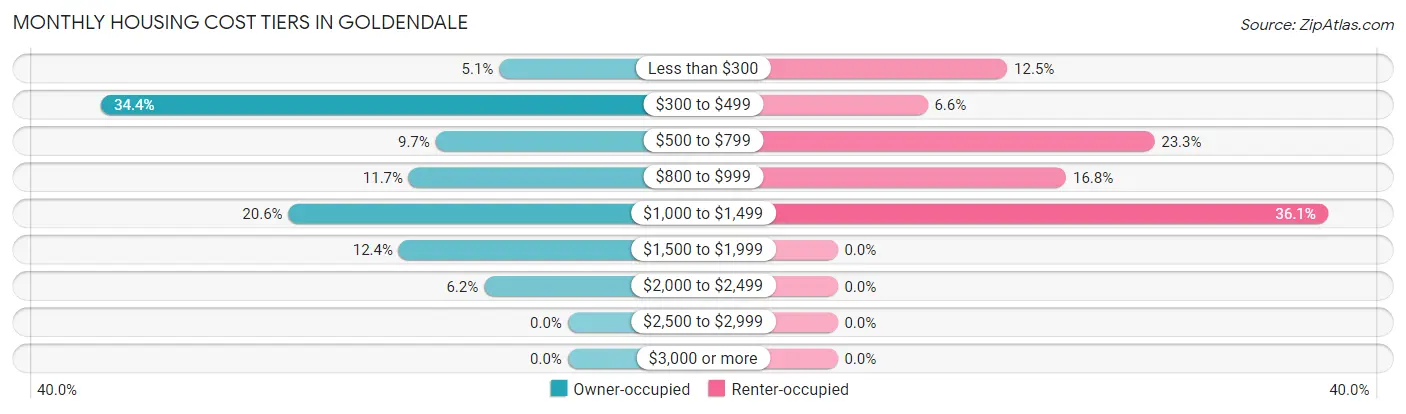
| Monthly Cost | Owner-occupied | Renter-occupied |
| Less than $300 | 41 (5.1%) | 98 (12.5%) |
| $300 to $499 | 279 (34.4%) | 52 (6.6%) |
| $500 to $799 | 79 (9.7%) | 183 (23.3%) |
| $800 to $999 | 95 (11.7%) | 132 (16.8%) |
| $1,000 to $1,499 | 167 (20.6%) | 283 (36.1%) |
| $1,500 to $1,999 | 101 (12.4%) | 0 (0.0%) |
| $2,000 to $2,499 | 50 (6.2%) | 0 (0.0%) |
| $2,500 to $2,999 | 0 (0.0%) | 0 (0.0%) |
| $3,000 or more | 0 (0.0%) | 0 (0.0%) |
| Total | 812 (100.0%) | 784 (100.0%) |
Physical Housing Characteristics in Goldendale
Housing Structures in Goldendale
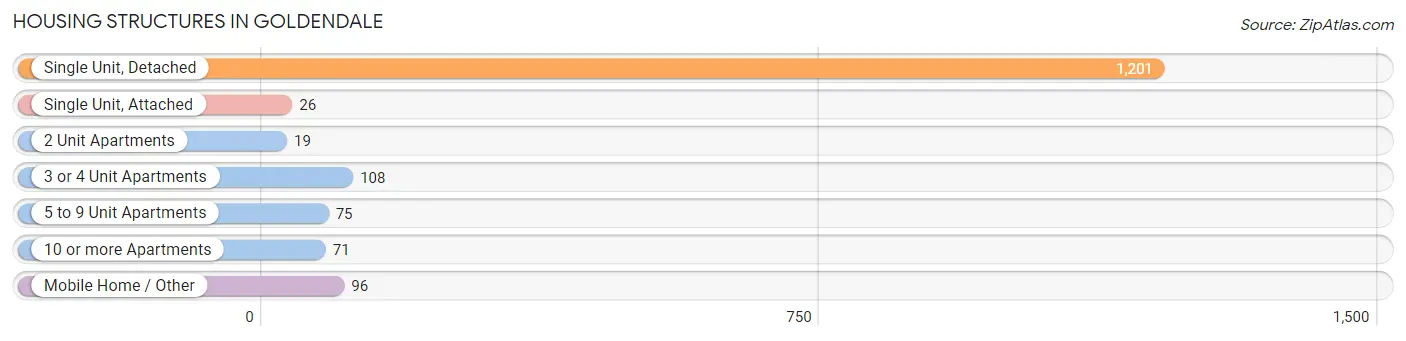
| Structure Type | # Housing Units | % Housing Units |
| Single Unit, Detached | 1,201 | 75.2% |
| Single Unit, Attached | 26 | 1.6% |
| 2 Unit Apartments | 19 | 1.2% |
| 3 or 4 Unit Apartments | 108 | 6.8% |
| 5 to 9 Unit Apartments | 75 | 4.7% |
| 10 or more Apartments | 71 | 4.4% |
| Mobile Home / Other | 96 | 6.0% |
| Total | 1,596 | 100.0% |
Housing Structures by Occupancy in Goldendale
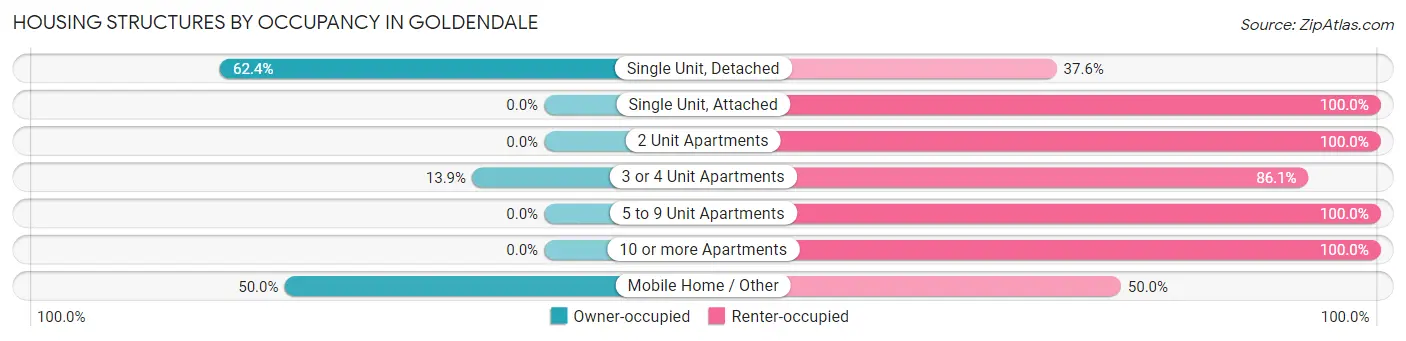
| Structure Type | Owner-occupied | Renter-occupied |
| Single Unit, Detached | 749 (62.4%) | 452 (37.6%) |
| Single Unit, Attached | 0 (0.0%) | 26 (100.0%) |
| 2 Unit Apartments | 0 (0.0%) | 19 (100.0%) |
| 3 or 4 Unit Apartments | 15 (13.9%) | 93 (86.1%) |
| 5 to 9 Unit Apartments | 0 (0.0%) | 75 (100.0%) |
| 10 or more Apartments | 0 (0.0%) | 71 (100.0%) |
| Mobile Home / Other | 48 (50.0%) | 48 (50.0%) |
| Total | 812 (50.9%) | 784 (49.1%) |
Housing Structures by Number of Rooms in Goldendale
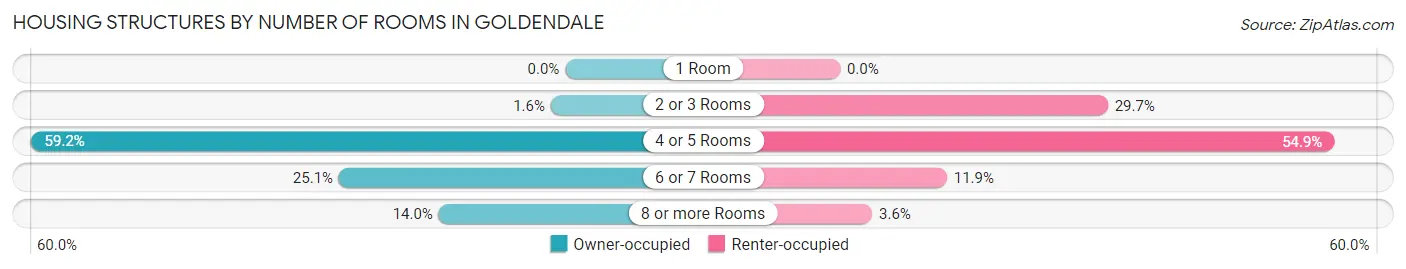
| Number of Rooms | Owner-occupied | Renter-occupied |
| 1 Room | 0 (0.0%) | 0 (0.0%) |
| 2 or 3 Rooms | 13 (1.6%) | 233 (29.7%) |
| 4 or 5 Rooms | 481 (59.2%) | 430 (54.8%) |
| 6 or 7 Rooms | 204 (25.1%) | 93 (11.9%) |
| 8 or more Rooms | 114 (14.0%) | 28 (3.6%) |
| Total | 812 (100.0%) | 784 (100.0%) |
Housing Structure by Heating Type in Goldendale
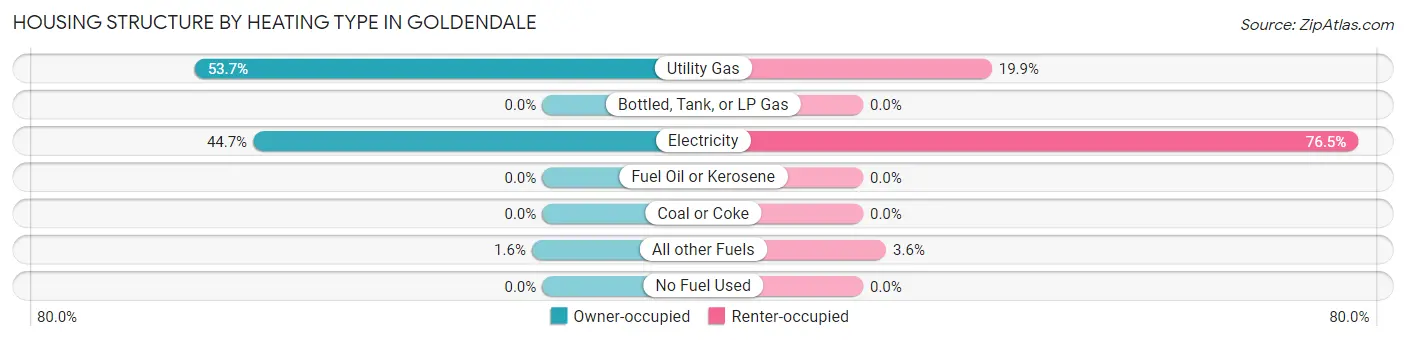
| Heating Type | Owner-occupied | Renter-occupied |
| Utility Gas | 436 (53.7%) | 156 (19.9%) |
| Bottled, Tank, or LP Gas | 0 (0.0%) | 0 (0.0%) |
| Electricity | 363 (44.7%) | 600 (76.5%) |
| Fuel Oil or Kerosene | 0 (0.0%) | 0 (0.0%) |
| Coal or Coke | 0 (0.0%) | 0 (0.0%) |
| All other Fuels | 13 (1.6%) | 28 (3.6%) |
| No Fuel Used | 0 (0.0%) | 0 (0.0%) |
| Total | 812 (100.0%) | 784 (100.0%) |
Household Vehicle Usage in Goldendale
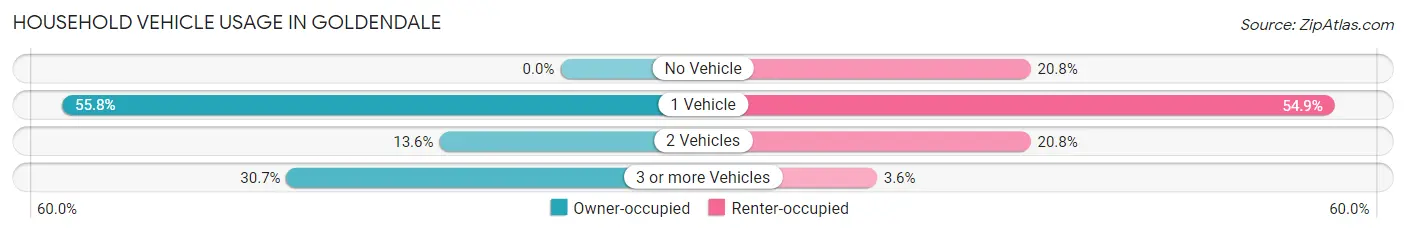
| Vehicles per Household | Owner-occupied | Renter-occupied |
| No Vehicle | 0 (0.0%) | 163 (20.8%) |
| 1 Vehicle | 453 (55.8%) | 430 (54.8%) |
| 2 Vehicles | 110 (13.6%) | 163 (20.8%) |
| 3 or more Vehicles | 249 (30.7%) | 28 (3.6%) |
| Total | 812 (100.0%) | 784 (100.0%) |
Real Estate & Mortgages in Goldendale
Real Estate and Mortgage Overview in Goldendale
| Characteristic | Without Mortgage | With Mortgage |
| Housing Units | 383 | 429 |
| Median Property Value | $161,100 | $169,800 |
| Median Household Income | $38,472 | $49 |
| Monthly Housing Costs | $457 | $0 |
| Real Estate Taxes | $997 | $0 |
Property Value by Mortgage Status in Goldendale
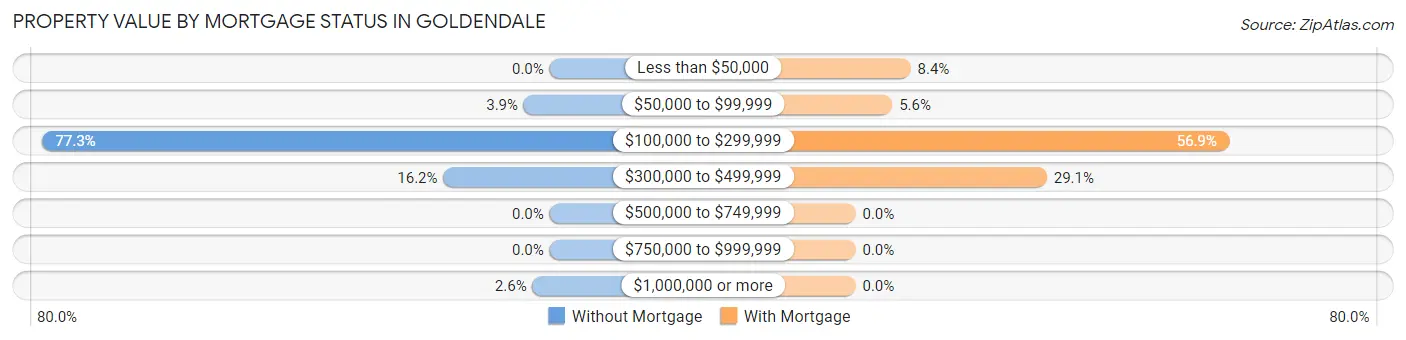
| Property Value | Without Mortgage | With Mortgage |
| Less than $50,000 | 0 (0.0%) | 36 (8.4%) |
| $50,000 to $99,999 | 15 (3.9%) | 24 (5.6%) |
| $100,000 to $299,999 | 296 (77.3%) | 244 (56.9%) |
| $300,000 to $499,999 | 62 (16.2%) | 125 (29.1%) |
| $500,000 to $749,999 | 0 (0.0%) | 0 (0.0%) |
| $750,000 to $999,999 | 0 (0.0%) | 0 (0.0%) |
| $1,000,000 or more | 10 (2.6%) | 0 (0.0%) |
| Total | 383 (100.0%) | 429 (100.0%) |
Household Income by Mortgage Status in Goldendale
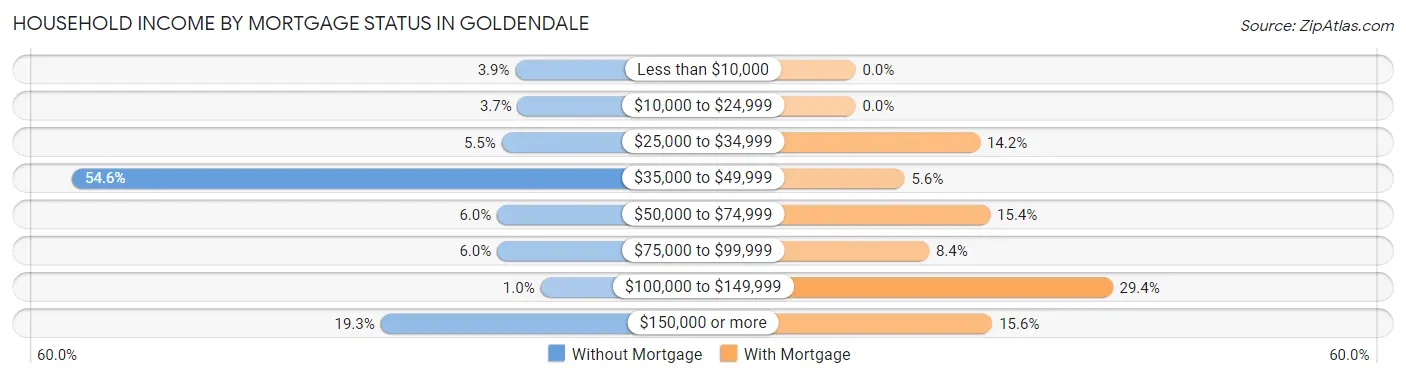
| Household Income | Without Mortgage | With Mortgage |
| Less than $10,000 | 15 (3.9%) | 0 (0.0%) |
| $10,000 to $24,999 | 14 (3.7%) | 0 (0.0%) |
| $25,000 to $34,999 | 21 (5.5%) | 61 (14.2%) |
| $35,000 to $49,999 | 209 (54.6%) | 24 (5.6%) |
| $50,000 to $74,999 | 23 (6.0%) | 66 (15.4%) |
| $75,000 to $99,999 | 23 (6.0%) | 36 (8.4%) |
| $100,000 to $149,999 | 4 (1.0%) | 126 (29.4%) |
| $150,000 or more | 74 (19.3%) | 67 (15.6%) |
| Total | 383 (100.0%) | 429 (100.0%) |
Property Value to Household Income Ratio in Goldendale
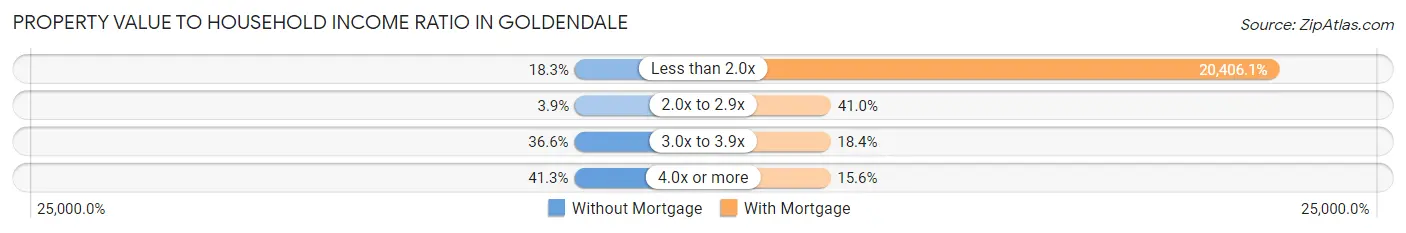
| Value-to-Income Ratio | Without Mortgage | With Mortgage |
| Less than 2.0x | 70 (18.3%) | 87,542 (20,406.1%) |
| 2.0x to 2.9x | 15 (3.9%) | 176 (41.0%) |
| 3.0x to 3.9x | 140 (36.5%) | 79 (18.4%) |
| 4.0x or more | 158 (41.2%) | 67 (15.6%) |
| Total | 383 (100.0%) | 429 (100.0%) |
Real Estate Taxes by Mortgage Status in Goldendale
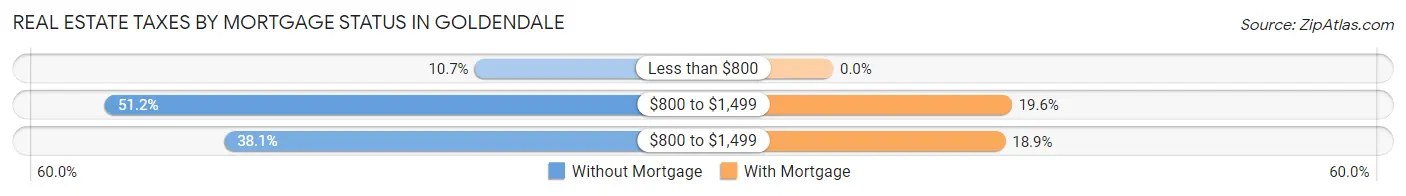
| Property Taxes | Without Mortgage | With Mortgage |
| Less than $800 | 41 (10.7%) | 0 (0.0%) |
| $800 to $1,499 | 196 (51.2%) | 84 (19.6%) |
| $800 to $1,499 | 146 (38.1%) | 81 (18.9%) |
| Total | 383 (100.0%) | 429 (100.0%) |
Health & Disability in Goldendale
Health Insurance Coverage by Age in Goldendale
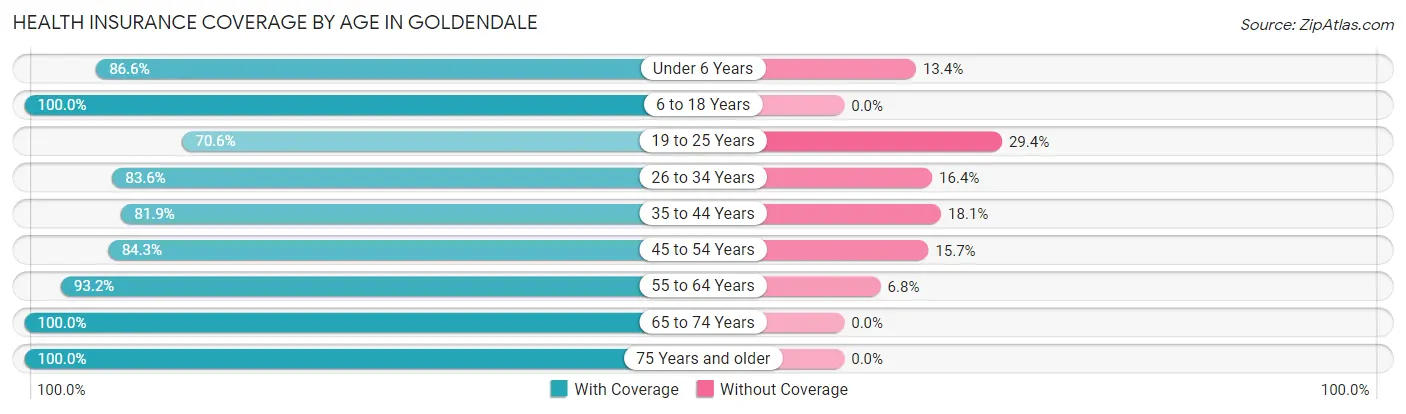
| Age Bracket | With Coverage | Without Coverage |
| Under 6 Years | 175 (86.6%) | 27 (13.4%) |
| 6 to 18 Years | 674 (100.0%) | 0 (0.0%) |
| 19 to 25 Years | 144 (70.6%) | 60 (29.4%) |
| 26 to 34 Years | 490 (83.6%) | 96 (16.4%) |
| 35 to 44 Years | 472 (81.9%) | 104 (18.1%) |
| 45 to 54 Years | 86 (84.3%) | 16 (15.7%) |
| 55 to 64 Years | 385 (93.2%) | 28 (6.8%) |
| 65 to 74 Years | 297 (100.0%) | 0 (0.0%) |
| 75 Years and older | 360 (100.0%) | 0 (0.0%) |
| Total | 3,083 (90.3%) | 331 (9.7%) |
Health Insurance Coverage by Citizenship Status in Goldendale
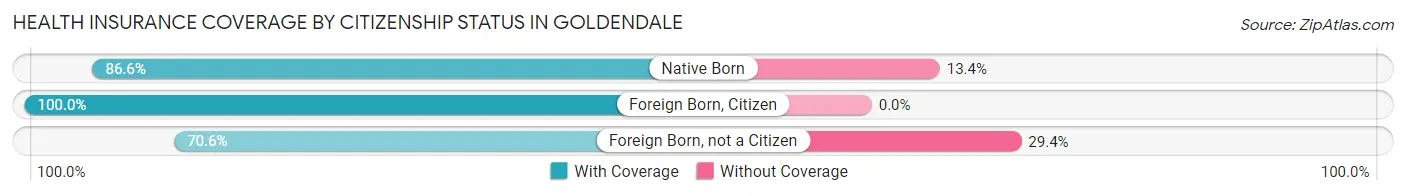
| Citizenship Status | With Coverage | Without Coverage |
| Native Born | 175 (86.6%) | 27 (13.4%) |
| Foreign Born, Citizen | 674 (100.0%) | 0 (0.0%) |
| Foreign Born, not a Citizen | 144 (70.6%) | 60 (29.4%) |
Health Insurance Coverage by Household Income in Goldendale
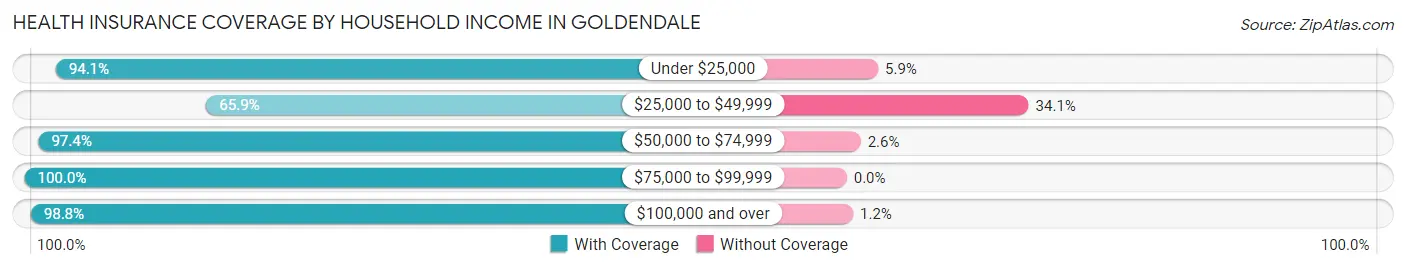
| Household Income | With Coverage | Without Coverage |
| Under $25,000 | 996 (94.1%) | 62 (5.9%) |
| $25,000 to $49,999 | 476 (65.9%) | 246 (34.1%) |
| $50,000 to $74,999 | 597 (97.4%) | 16 (2.6%) |
| $75,000 to $99,999 | 421 (100.0%) | 0 (0.0%) |
| $100,000 and over | 584 (98.8%) | 7 (1.2%) |
Public vs Private Health Insurance Coverage by Age in Goldendale
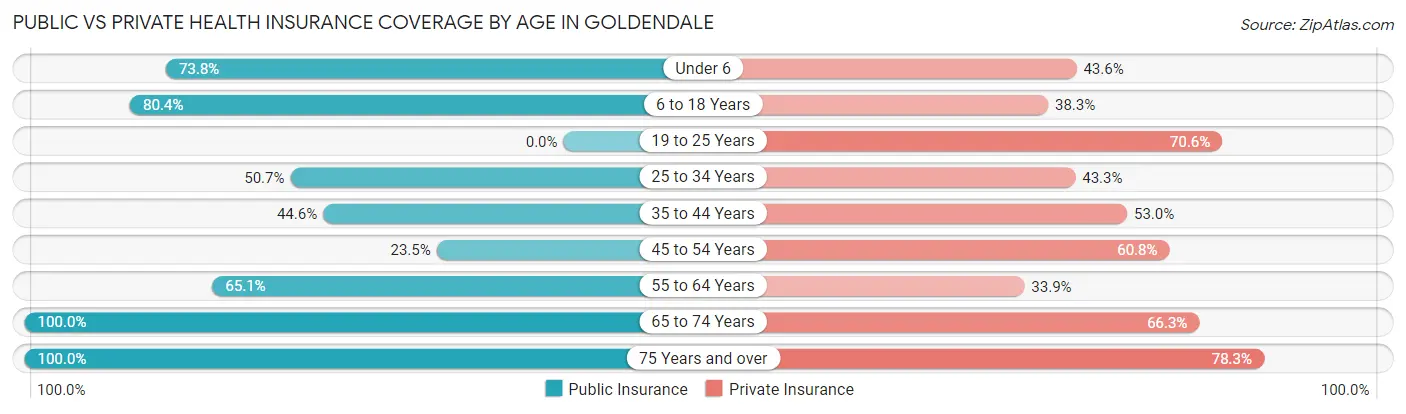
| Age Bracket | Public Insurance | Private Insurance |
| Under 6 | 149 (73.8%) | 88 (43.6%) |
| 6 to 18 Years | 542 (80.4%) | 258 (38.3%) |
| 19 to 25 Years | 0 (0.0%) | 144 (70.6%) |
| 25 to 34 Years | 297 (50.7%) | 254 (43.3%) |
| 35 to 44 Years | 257 (44.6%) | 305 (52.9%) |
| 45 to 54 Years | 24 (23.5%) | 62 (60.8%) |
| 55 to 64 Years | 269 (65.1%) | 140 (33.9%) |
| 65 to 74 Years | 297 (100.0%) | 197 (66.3%) |
| 75 Years and over | 360 (100.0%) | 282 (78.3%) |
| Total | 2,195 (64.3%) | 1,730 (50.7%) |
Disability Status by Sex by Age in Goldendale
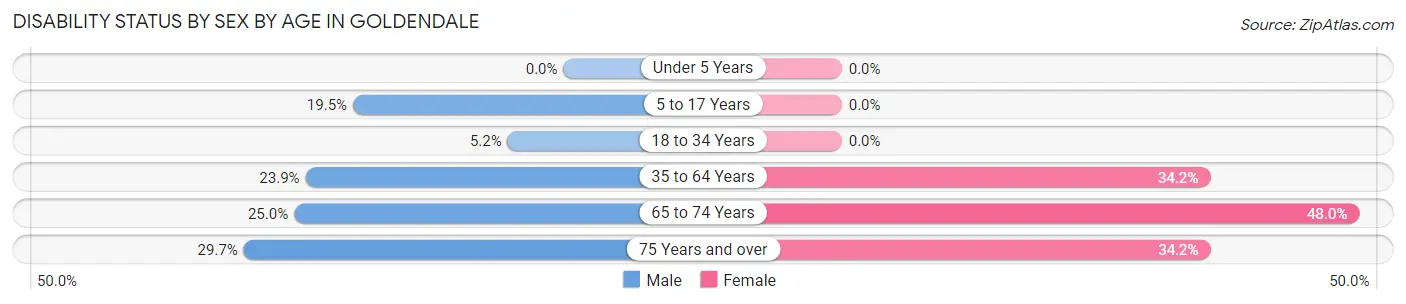
| Age Bracket | Male | Female |
| Under 5 Years | 0 (0.0%) | 0 (0.0%) |
| 5 to 17 Years | 91 (19.5%) | 0 (0.0%) |
| 18 to 34 Years | 24 (5.2%) | 0 (0.0%) |
| 35 to 64 Years | 119 (23.9%) | 203 (34.2%) |
| 65 to 74 Years | 30 (25.0%) | 85 (48.0%) |
| 75 Years and over | 27 (29.7%) | 92 (34.2%) |
Disability Class by Sex by Age in Goldendale
Disability Class: Hearing Difficulty
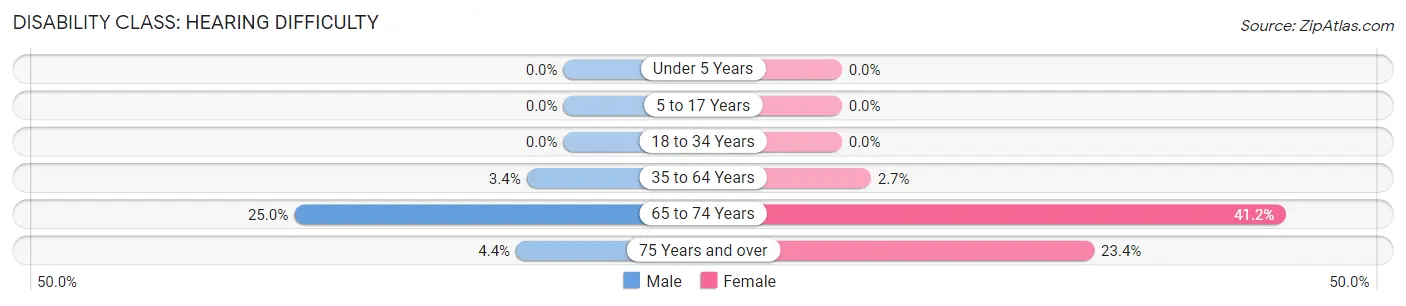
| Age Bracket | Male | Female |
| Under 5 Years | 0 (0.0%) | 0 (0.0%) |
| 5 to 17 Years | 0 (0.0%) | 0 (0.0%) |
| 18 to 34 Years | 0 (0.0%) | 0 (0.0%) |
| 35 to 64 Years | 17 (3.4%) | 16 (2.7%) |
| 65 to 74 Years | 30 (25.0%) | 73 (41.2%) |
| 75 Years and over | 4 (4.4%) | 63 (23.4%) |
Disability Class: Vision Difficulty
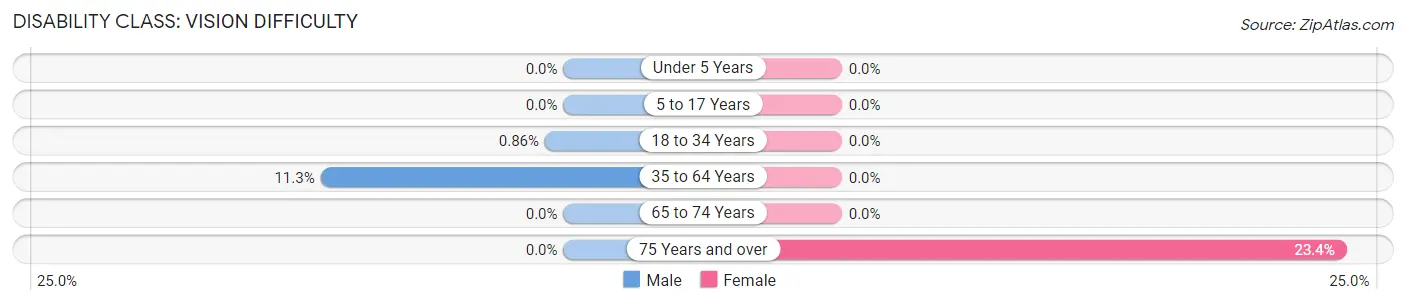
| Age Bracket | Male | Female |
| Under 5 Years | 0 (0.0%) | 0 (0.0%) |
| 5 to 17 Years | 0 (0.0%) | 0 (0.0%) |
| 18 to 34 Years | 4 (0.9%) | 0 (0.0%) |
| 35 to 64 Years | 56 (11.3%) | 0 (0.0%) |
| 65 to 74 Years | 0 (0.0%) | 0 (0.0%) |
| 75 Years and over | 0 (0.0%) | 63 (23.4%) |
Disability Class: Cognitive Difficulty
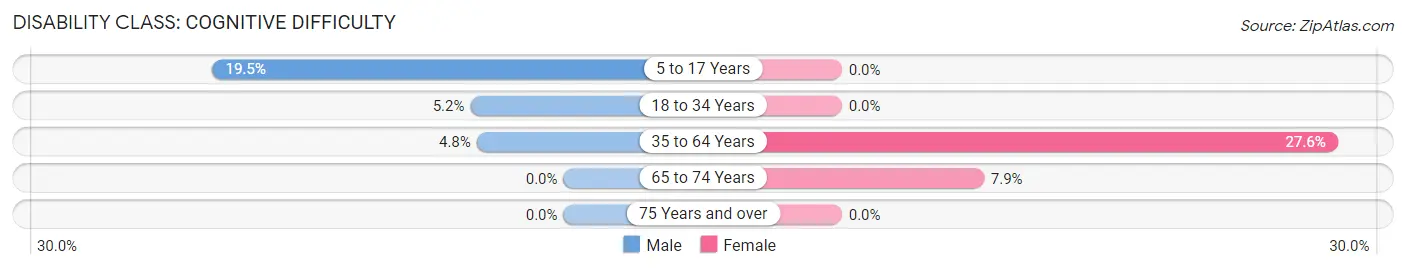
| Age Bracket | Male | Female |
| 5 to 17 Years | 91 (19.5%) | 0 (0.0%) |
| 18 to 34 Years | 24 (5.2%) | 0 (0.0%) |
| 35 to 64 Years | 24 (4.8%) | 164 (27.6%) |
| 65 to 74 Years | 0 (0.0%) | 14 (7.9%) |
| 75 Years and over | 0 (0.0%) | 0 (0.0%) |
Disability Class: Ambulatory Difficulty
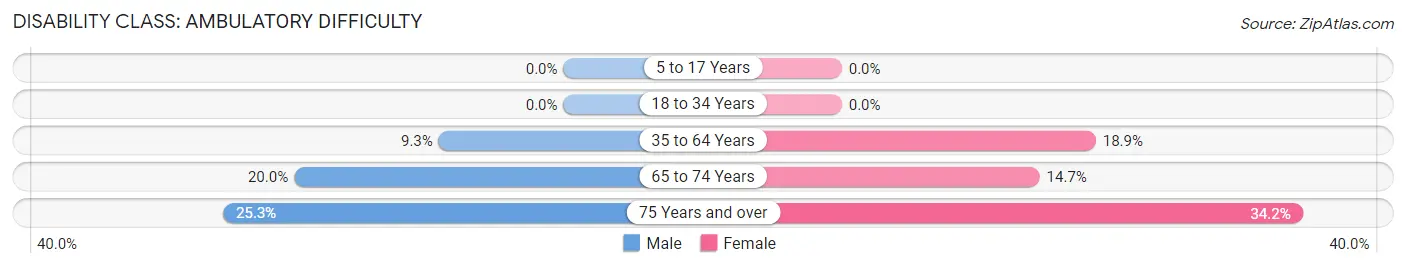
| Age Bracket | Male | Female |
| 5 to 17 Years | 0 (0.0%) | 0 (0.0%) |
| 18 to 34 Years | 0 (0.0%) | 0 (0.0%) |
| 35 to 64 Years | 46 (9.3%) | 112 (18.9%) |
| 65 to 74 Years | 24 (20.0%) | 26 (14.7%) |
| 75 Years and over | 23 (25.3%) | 92 (34.2%) |
Disability Class: Self-Care Difficulty
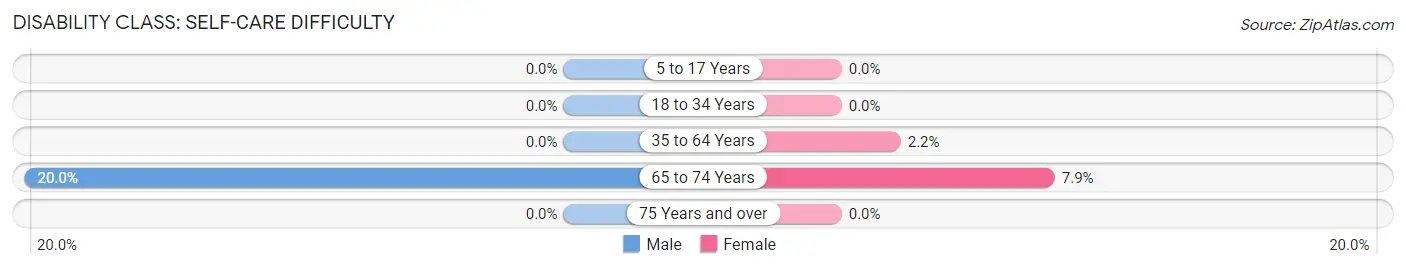
| Age Bracket | Male | Female |
| 5 to 17 Years | 0 (0.0%) | 0 (0.0%) |
| 18 to 34 Years | 0 (0.0%) | 0 (0.0%) |
| 35 to 64 Years | 0 (0.0%) | 13 (2.2%) |
| 65 to 74 Years | 24 (20.0%) | 14 (7.9%) |
| 75 Years and over | 0 (0.0%) | 0 (0.0%) |
Technology Access in Goldendale
Computing Device Access in Goldendale
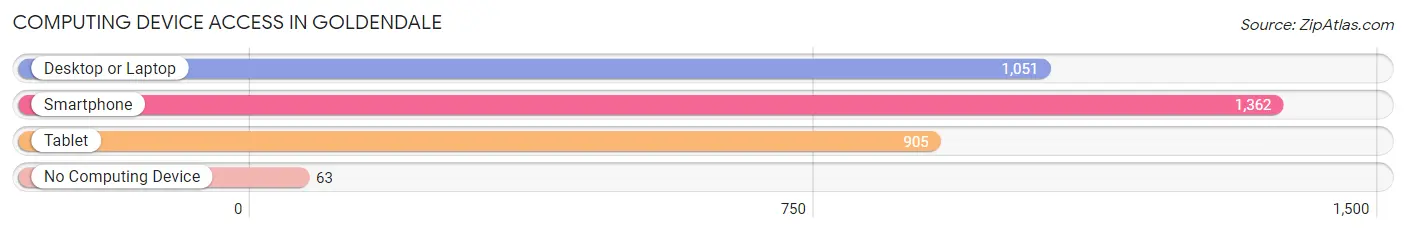
| Device Type | # Households | % Households |
| Desktop or Laptop | 1,051 | 65.8% |
| Smartphone | 1,362 | 85.3% |
| Tablet | 905 | 56.7% |
| No Computing Device | 63 | 4.0% |
| Total | 1,596 | 100.0% |
Internet Access in Goldendale
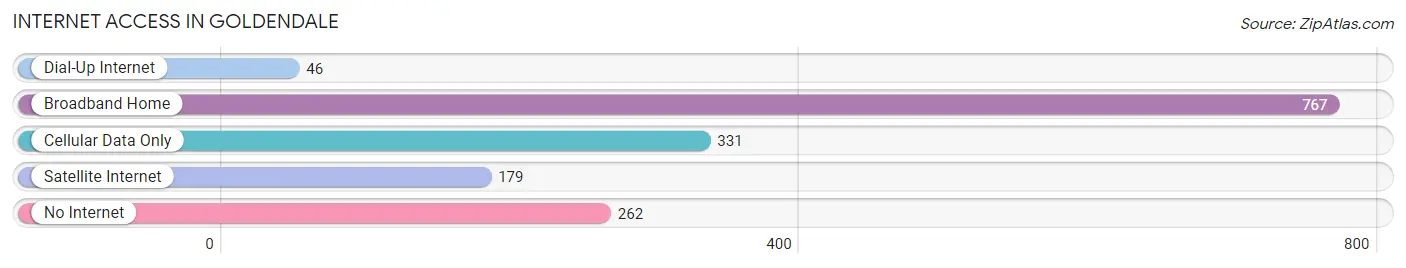
| Internet Type | # Households | % Households |
| Dial-Up Internet | 46 | 2.9% |
| Broadband Home | 767 | 48.1% |
| Cellular Data Only | 331 | 20.7% |
| Satellite Internet | 179 | 11.2% |
| No Internet | 262 | 16.4% |
| Total | 1,596 | 100.0% |
Goldendale Summary
History
The area now known as Goldendale, Washington was first inhabited by the Klickitat tribe of Native Americans. The Klickitat were a semi-nomadic people who lived in the area for thousands of years before the arrival of European settlers. The first recorded European exploration of the area was in 1805, when Lewis and Clark passed through on their expedition.
In 1847, the first permanent settlers arrived in the area. These settlers were mostly miners and farmers who were drawn to the area by the promise of gold. The town of Goldendale was officially founded in 1859, and the first post office was established in 1860.
The town quickly grew, and by the late 1800s, it had become a bustling center of commerce and industry. The town was home to several gold mines, as well as a number of businesses, including a flour mill, a sawmill, and a brickyard.
In the early 1900s, the town began to decline as the gold mines began to run dry. The town’s population dwindled, and many of the businesses closed. However, the town was able to survive due to its location on the Columbia River, which provided a steady source of income from shipping and transportation.
In the 1950s, the town began to experience a resurgence. The construction of the John Day Dam on the Columbia River provided a new source of income for the town, and the population began to grow again.
Today, Goldendale is a small but vibrant town. It is home to a number of businesses, including a winery, a brewery, and a distillery. The town is also home to a number of historic sites, including the Goldendale Observatory and the Goldendale Pioneer Cemetery.
Geography
Goldendale is located in the south-central part of Washington State, in Klickitat County. The town is situated on the Columbia River, at the base of the Cascade Mountains. The town is surrounded by rolling hills and grasslands, and is home to a number of lakes and rivers.
The climate in Goldendale is semi-arid, with hot summers and cold winters. The average annual temperature is around 50 degrees Fahrenheit, and the average annual precipitation is around 15 inches.
Economy
The economy of Goldendale is largely based on agriculture and tourism. The town is home to a number of wineries, breweries, and distilleries, which attract visitors from all over the world. The town is also home to a number of historic sites, which attract tourists from all over the country.
The town is also home to a number of manufacturing and industrial businesses, including a lumber mill, a paper mill, and a metal fabrication plant. The town is also home to a number of retail stores, restaurants, and other businesses.
Demographics
As of the 2010 census, the population of Goldendale was 2,919. The town is predominantly white, with a small Hispanic population. The median household income is around $40,000, and the median home value is around $150,000. The town has a low unemployment rate, and the poverty rate is below the national average.
Common Questions
What is Per Capita Income in Goldendale?
Per Capita income in Goldendale is $33,490.
What is the Median Family Income in Goldendale?
Median Family Income in Goldendale is $55,171.
What is the Median Household income in Goldendale?
Median Household Income in Goldendale is $45,467.
What is Income or Wage Gap in Goldendale?
Income or Wage Gap in Goldendale is 48.5%.
Women in Goldendale earn 51.5 cents for every dollar earned by a man.
What is Inequality or Gini Index in Goldendale?
Inequality or Gini Index in Goldendale is 0.52.
What is the Total Population of Goldendale?
Total Population of Goldendale is 3,448.
What is the Total Male Population of Goldendale?
Total Male Population of Goldendale is 1,686.
What is the Total Female Population of Goldendale?
Total Female Population of Goldendale is 1,762.
What is the Ratio of Males per 100 Females in Goldendale?
There are 95.69 Males per 100 Females in Goldendale.
What is the Ratio of Females per 100 Males in Goldendale?
There are 104.51 Females per 100 Males in Goldendale.
What is the Median Population Age in Goldendale?
Median Population Age in Goldendale is 36.4 Years.
What is the Average Family Size in Goldendale
Average Family Size in Goldendale is 2.9 People.
What is the Average Household Size in Goldendale
Average Household Size in Goldendale is 2.1 People.
How Large is the Labor Force in Goldendale?
There are 1,463 People in the Labor Forcein in Goldendale.
What is the Percentage of People in the Labor Force in Goldendale?
56.2% of People are in the Labor Force in Goldendale.
What is the Unemployment Rate in Goldendale?
Unemployment Rate in Goldendale is 18.7%.