Cathlamet, WA Map & Demographics
Cathlamet Map
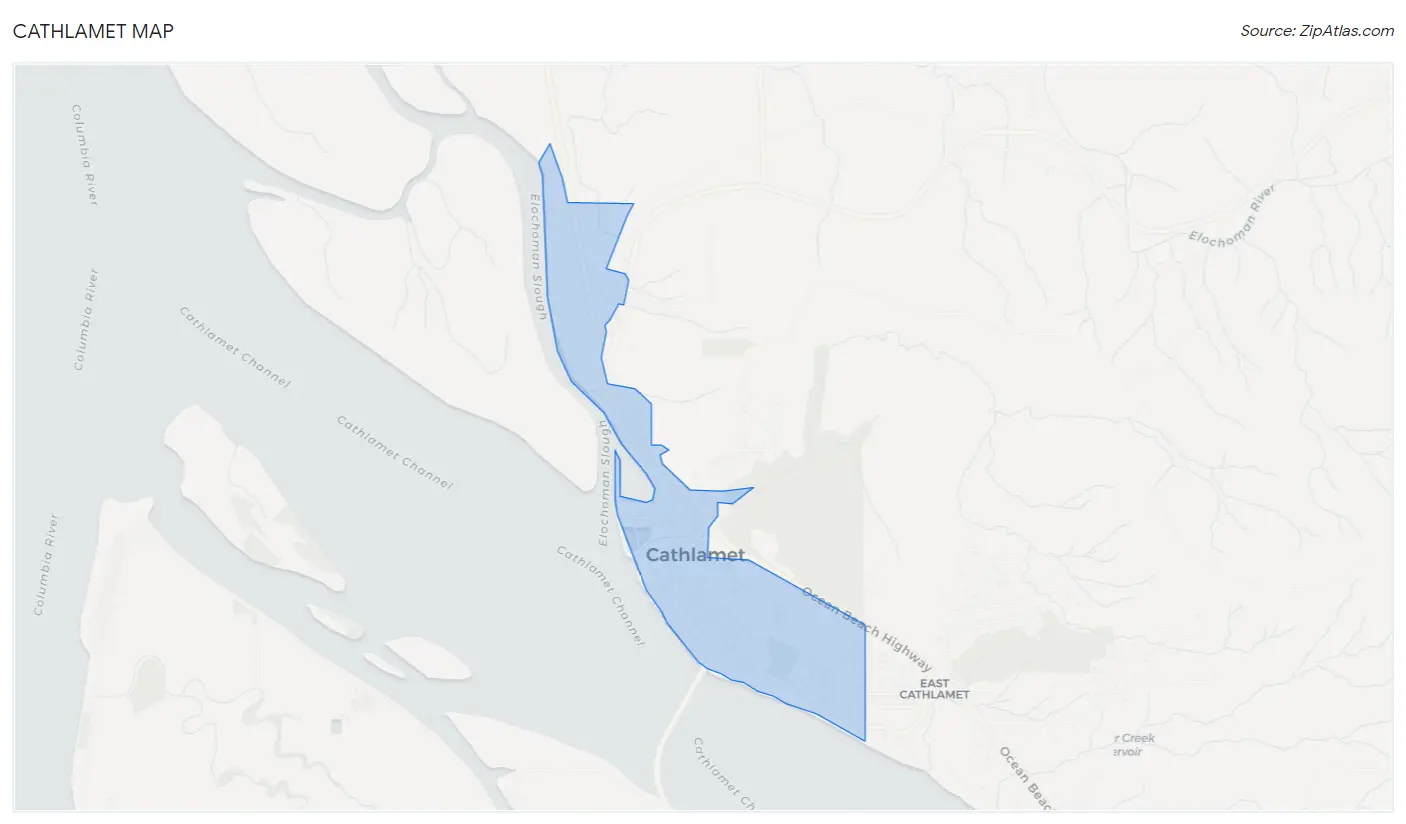
Cathlamet Overview
$34,059
PER CAPITA INCOME
$56,429
AVG FAMILY INCOME
$55,694
AVG HOUSEHOLD INCOME
11.5%
WAGE / INCOME GAP [ % ]
88.5¢/ $1
WAGE / INCOME GAP [ $ ]
$8,573
FAMILY INCOME DEFICIT
0.39
INEQUALITY / GINI INDEX
546
TOTAL POPULATION
246
MALE POPULATION
300
FEMALE POPULATION
82.00
MALES / 100 FEMALES
121.95
FEMALES / 100 MALES
59.4
MEDIAN AGE
2.3
AVG FAMILY SIZE
1.9
AVG HOUSEHOLD SIZE
182
LABOR FORCE [ PEOPLE ]
35.8%
PERCENT IN LABOR FORCE
2.2%
UNEMPLOYMENT RATE
Cathlamet Zip Codes
Cathlamet Area Codes
Income in Cathlamet
Income Overview in Cathlamet
Per Capita Income in Cathlamet is $34,059, while median incomes of families and households are $56,429 and $55,694 respectively.
| Characteristic | Number | Measure |
| Per Capita Income | 546 | $34,059 |
| Median Family Income | 146 | $56,429 |
| Mean Family Income | 146 | $74,310 |
| Median Household Income | 269 | $55,694 |
| Mean Household Income | 269 | $65,301 |
| Income Deficit | 146 | $8,573 |
| Wage / Income Gap (%) | 546 | 11.50% |
| Wage / Income Gap ($) | 546 | 88.50¢ per $1 |
| Gini / Inequality Index | 546 | 0.39 |
Earnings by Sex in Cathlamet
Average Earnings in Cathlamet are $27,841, $28,250 for men and $25,000 for women, a difference of 11.5%.
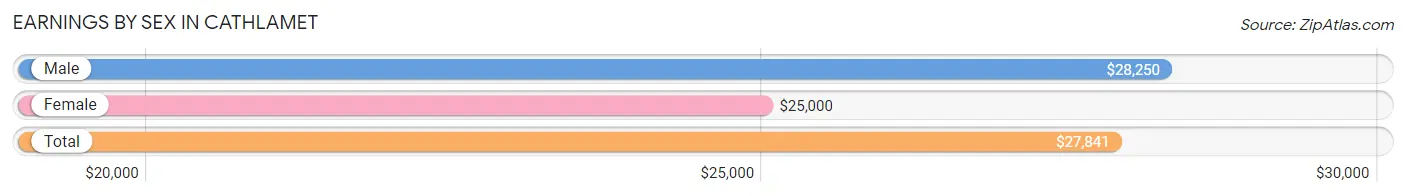
| Sex | Number | Average Earnings |
| Male | 135 (57.9%) | $28,250 |
| Female | 98 (42.1%) | $25,000 |
| Total | 233 (100.0%) | $27,841 |
Earnings by Sex by Income Bracket in Cathlamet
The most common earnings brackets in Cathlamet are $2,499 or less for men (22 | 16.3%) and $2,499 or less for women (13 | 13.3%).
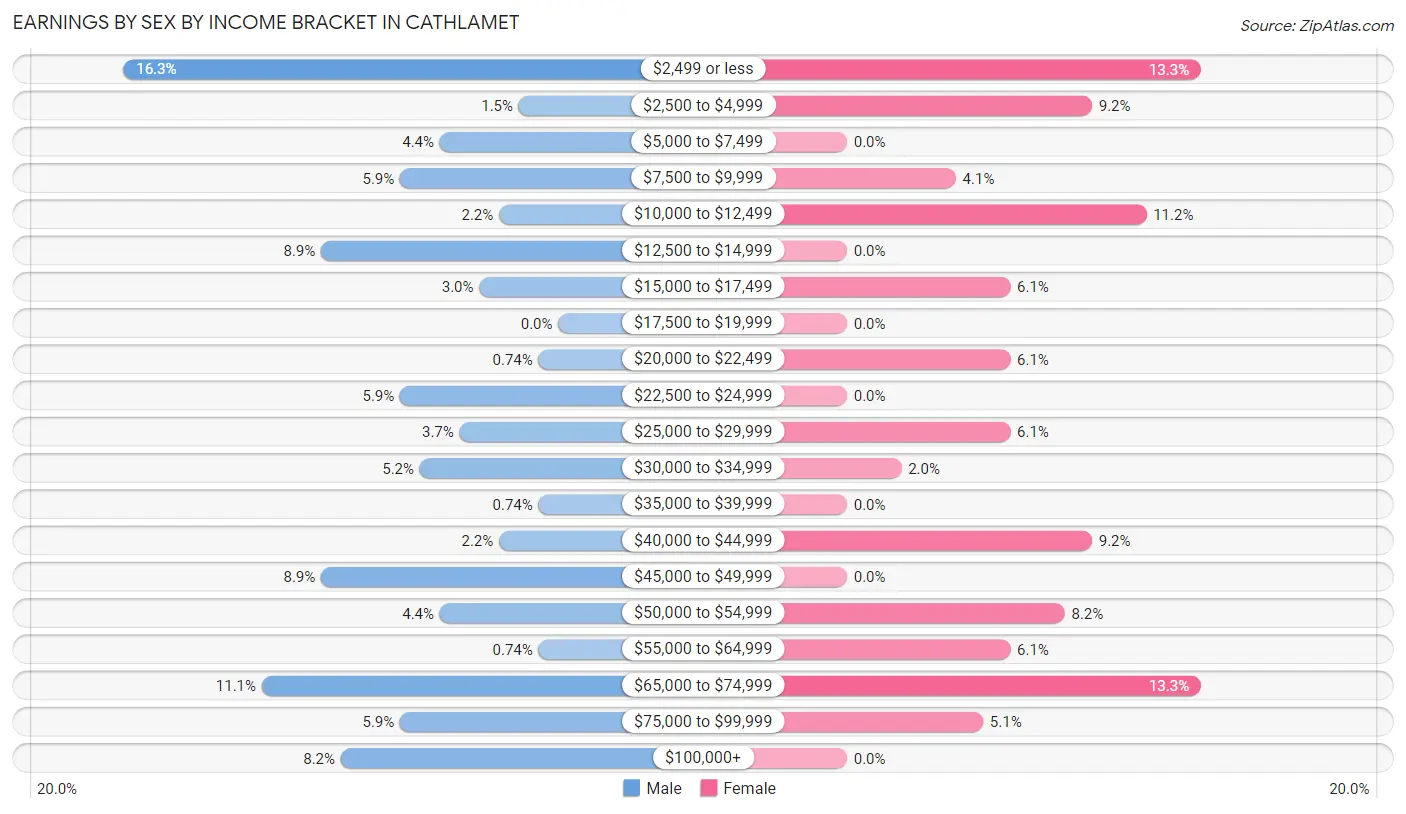
| Income | Male | Female |
| $2,499 or less | 22 (16.3%) | 13 (13.3%) |
| $2,500 to $4,999 | 2 (1.5%) | 9 (9.2%) |
| $5,000 to $7,499 | 6 (4.4%) | 0 (0.0%) |
| $7,500 to $9,999 | 8 (5.9%) | 4 (4.1%) |
| $10,000 to $12,499 | 3 (2.2%) | 11 (11.2%) |
| $12,500 to $14,999 | 12 (8.9%) | 0 (0.0%) |
| $15,000 to $17,499 | 4 (3.0%) | 6 (6.1%) |
| $17,500 to $19,999 | 0 (0.0%) | 0 (0.0%) |
| $20,000 to $22,499 | 1 (0.7%) | 6 (6.1%) |
| $22,500 to $24,999 | 8 (5.9%) | 0 (0.0%) |
| $25,000 to $29,999 | 5 (3.7%) | 6 (6.1%) |
| $30,000 to $34,999 | 7 (5.2%) | 2 (2.0%) |
| $35,000 to $39,999 | 1 (0.7%) | 0 (0.0%) |
| $40,000 to $44,999 | 3 (2.2%) | 9 (9.2%) |
| $45,000 to $49,999 | 12 (8.9%) | 0 (0.0%) |
| $50,000 to $54,999 | 6 (4.4%) | 8 (8.2%) |
| $55,000 to $64,999 | 1 (0.7%) | 6 (6.1%) |
| $65,000 to $74,999 | 15 (11.1%) | 13 (13.3%) |
| $75,000 to $99,999 | 8 (5.9%) | 5 (5.1%) |
| $100,000+ | 11 (8.2%) | 0 (0.0%) |
| Total | 135 (100.0%) | 98 (100.0%) |
Earnings by Sex by Educational Attainment in Cathlamet
Average earnings in Cathlamet are $23,750 for men and $29,583 for women, a difference of 19.7%. Men with an educational attainment of bachelor's degree enjoy the highest average annual earnings of $100,714, while those with less than high school education earn the least with $9,688. Women with an educational attainment of college or associate's degree earn the most with the average annual earnings of $42,639, while those with college or associate's degree education have the smallest earnings of $42,639.
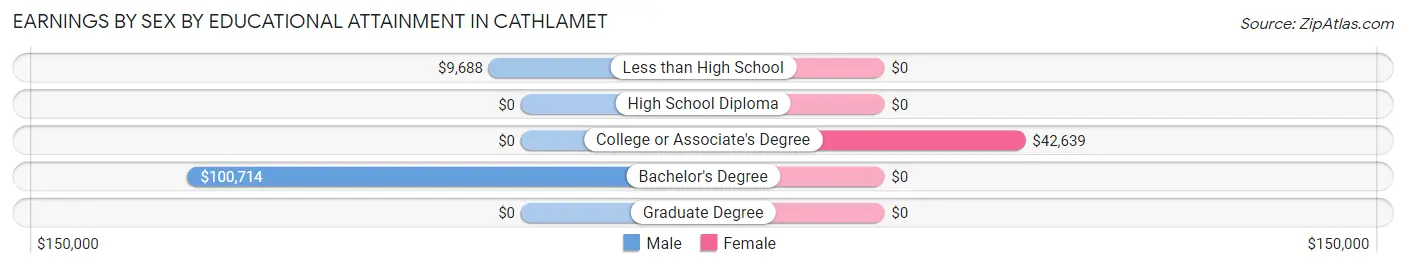
| Educational Attainment | Male Income | Female Income |
| Less than High School | $9,688 | $0 |
| High School Diploma | - | - |
| College or Associate's Degree | - | - |
| Bachelor's Degree | $100,714 | $0 |
| Graduate Degree | - | - |
| Total | $23,750 | $29,583 |
Family Income in Cathlamet
Family Income Brackets in Cathlamet
According to the Cathlamet family income data, there are 51 families falling into the $50,000 to $74,999 income range, which is the most common income bracket and makes up 34.9% of all families. Conversely, the $10,000 to $14,999 income bracket is the least frequent group with only 1 families (0.7%) belonging to this category.
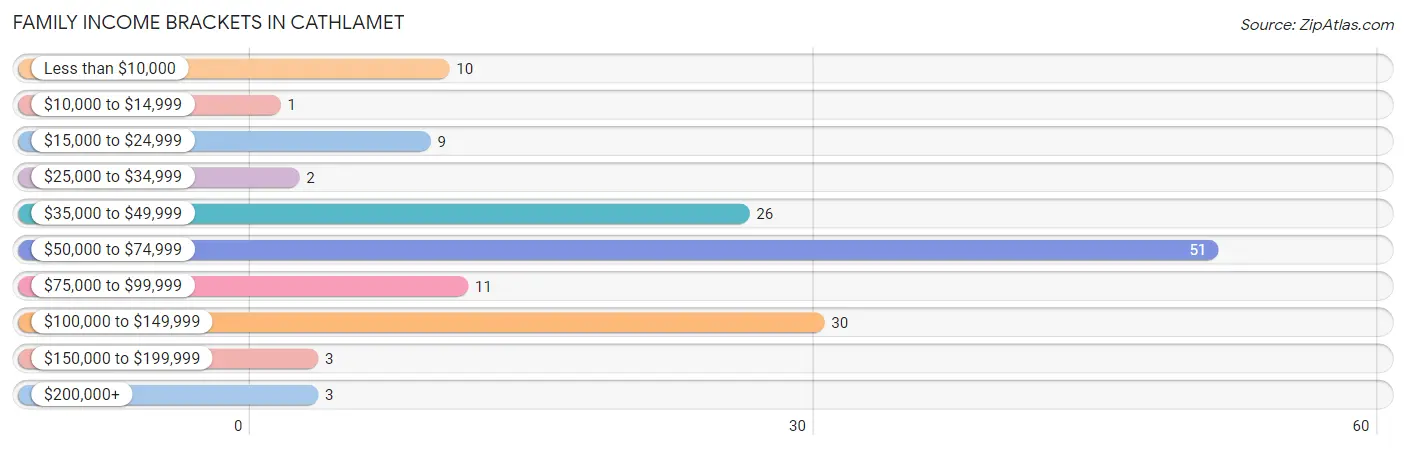
| Income Bracket | # Families | % Families |
| Less than $10,000 | 10 | 6.8% |
| $10,000 to $14,999 | 1 | 0.7% |
| $15,000 to $24,999 | 9 | 6.2% |
| $25,000 to $34,999 | 2 | 1.4% |
| $35,000 to $49,999 | 26 | 17.8% |
| $50,000 to $74,999 | 51 | 34.9% |
| $75,000 to $99,999 | 11 | 7.5% |
| $100,000 to $149,999 | 30 | 20.5% |
| $150,000 to $199,999 | 3 | 2.1% |
| $200,000+ | 3 | 2.1% |
Family Income by Famaliy Size in Cathlamet
3-person families (6 | 4.1%) account for the highest median family income in Cathlamet with $165,000 per family, while 3-person families (6 | 4.1%) have the highest median income of $55,000 per family member.
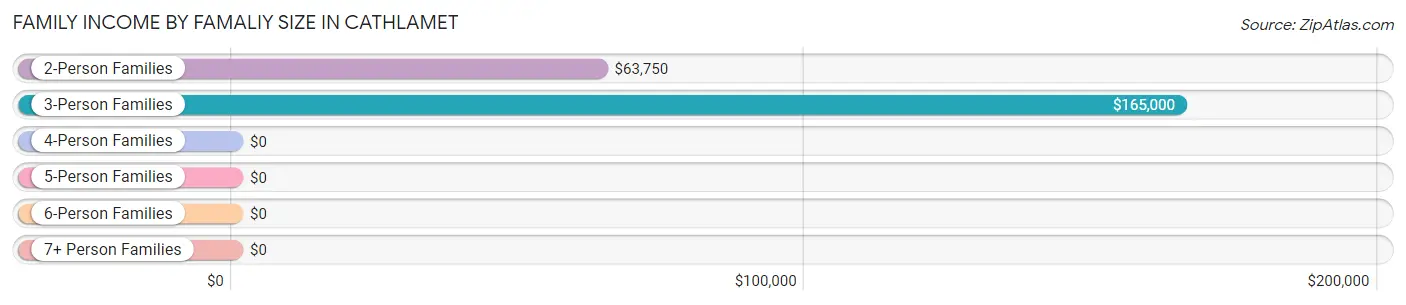
| Income Bracket | # Families | Median Income |
| 2-Person Families | 110 (75.3%) | $63,750 |
| 3-Person Families | 6 (4.1%) | $165,000 |
| 4-Person Families | 8 (5.5%) | $0 |
| 5-Person Families | 21 (14.4%) | $0 |
| 6-Person Families | 1 (0.7%) | $0 |
| 7+ Person Families | 0 (0.0%) | $0 |
| Total | 146 (100.0%) | $56,429 |
Family Income by Number of Earners in Cathlamet
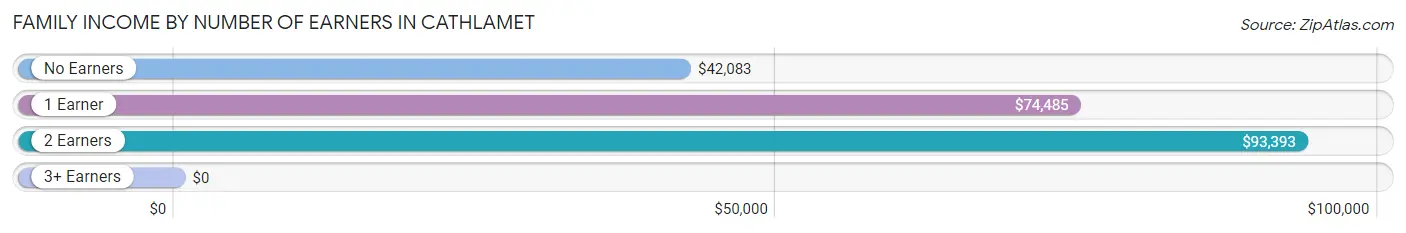
| Number of Earners | # Families | Median Income |
| No Earners | 59 (40.4%) | $42,083 |
| 1 Earner | 49 (33.6%) | $74,485 |
| 2 Earners | 33 (22.6%) | $93,393 |
| 3+ Earners | 5 (3.4%) | $0 |
| Total | 146 (100.0%) | $56,429 |
Household Income in Cathlamet
Household Income Brackets in Cathlamet
With 76 households falling in the category, the $50,000 to $74,999 income range is the most frequent in Cathlamet, accounting for 28.2% of all households. In contrast, only 3 households (1.1%) fall into the $200,000+ income bracket, making it the least populous group.
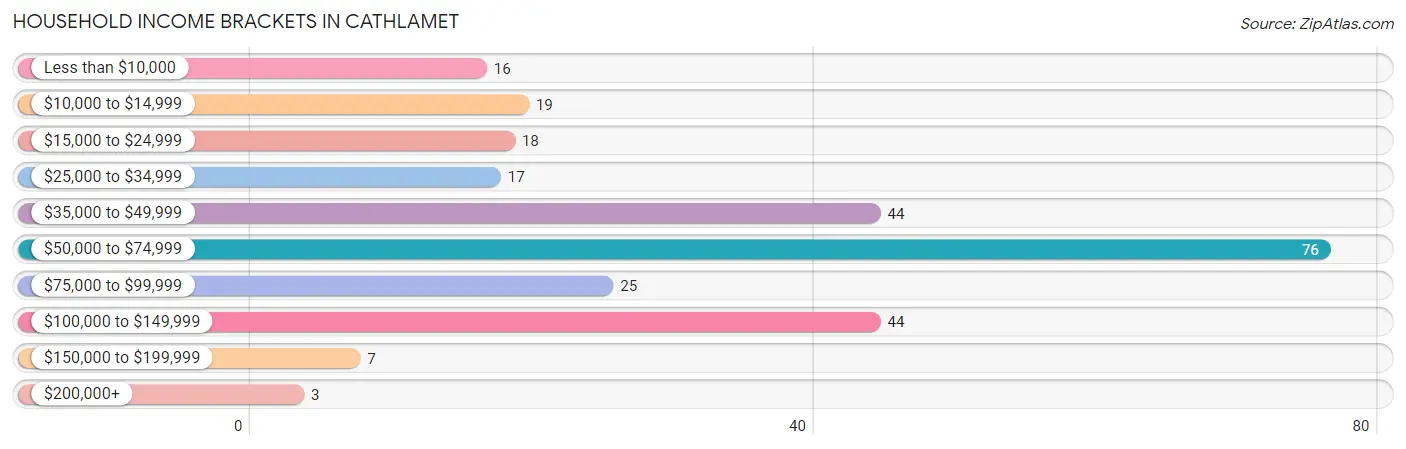
| Income Bracket | # Households | % Households |
| Less than $10,000 | 16 | 5.9% |
| $10,000 to $14,999 | 19 | 7.1% |
| $15,000 to $24,999 | 18 | 6.7% |
| $25,000 to $34,999 | 17 | 6.3% |
| $35,000 to $49,999 | 44 | 16.4% |
| $50,000 to $74,999 | 76 | 28.3% |
| $75,000 to $99,999 | 25 | 9.3% |
| $100,000 to $149,999 | 44 | 16.4% |
| $150,000 to $199,999 | 7 | 2.6% |
| $200,000+ | 3 | 1.1% |
Household Income by Householder Age in Cathlamet
The median household income in Cathlamet is $55,694, with the highest median household income of $56,875 found in the 25 to 44 years age bracket for the primary householder. A total of 22 households (8.2%) fall into this category. Meanwhile, the 15 to 24 years age bracket for the primary householder has the lowest median household income of $0, with 17 households (6.3%) in this group.
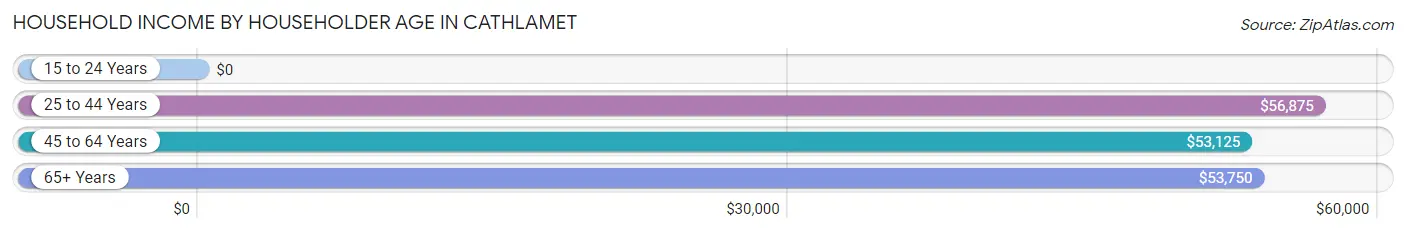
| Income Bracket | # Households | Median Income |
| 15 to 24 Years | 17 (6.3%) | $0 |
| 25 to 44 Years | 22 (8.2%) | $56,875 |
| 45 to 64 Years | 78 (29.0%) | $53,125 |
| 65+ Years | 152 (56.5%) | $53,750 |
| Total | 269 (100.0%) | $55,694 |
Poverty in Cathlamet
Income Below Poverty by Sex and Age in Cathlamet
With 21.5% poverty level for males and 14.7% for females among the residents of Cathlamet, 16 and 17 year old males and 55 to 64 year old females are the most vulnerable to poverty, with 10 males (100.0%) and 19 females (38.0%) in their respective age groups living below the poverty level.
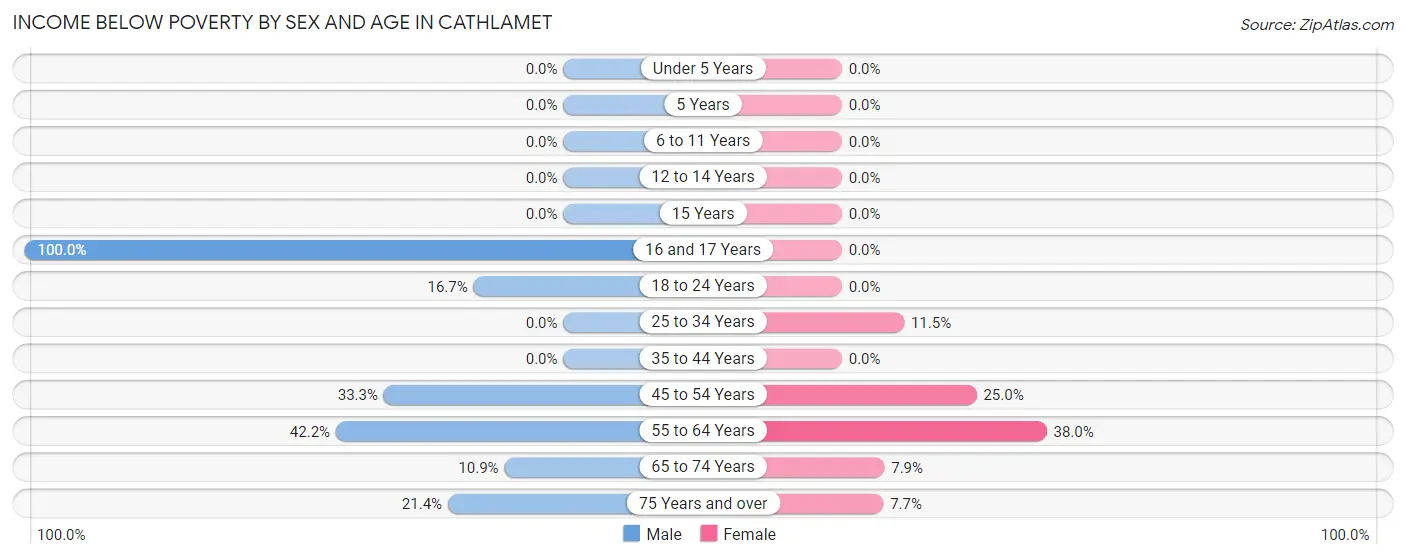
| Age Bracket | Male | Female |
| Under 5 Years | 0 (0.0%) | 0 (0.0%) |
| 5 Years | 0 (0.0%) | 0 (0.0%) |
| 6 to 11 Years | 0 (0.0%) | 0 (0.0%) |
| 12 to 14 Years | 0 (0.0%) | 0 (0.0%) |
| 15 Years | 0 (0.0%) | 0 (0.0%) |
| 16 and 17 Years | 10 (100.0%) | 0 (0.0%) |
| 18 to 24 Years | 4 (16.7%) | 0 (0.0%) |
| 25 to 34 Years | 0 (0.0%) | 3 (11.5%) |
| 35 to 44 Years | 0 (0.0%) | 0 (0.0%) |
| 45 to 54 Years | 7 (33.3%) | 10 (25.0%) |
| 55 to 64 Years | 19 (42.2%) | 19 (38.0%) |
| 65 to 74 Years | 7 (10.9%) | 6 (7.9%) |
| 75 Years and over | 3 (21.4%) | 3 (7.7%) |
| Total | 50 (21.5%) | 41 (14.7%) |
Income Above Poverty by Sex and Age in Cathlamet
According to the poverty statistics in Cathlamet, males aged under 5 years and females aged under 5 years are the age groups that are most secure financially, with 100.0% of males and 100.0% of females in these age groups living above the poverty line.
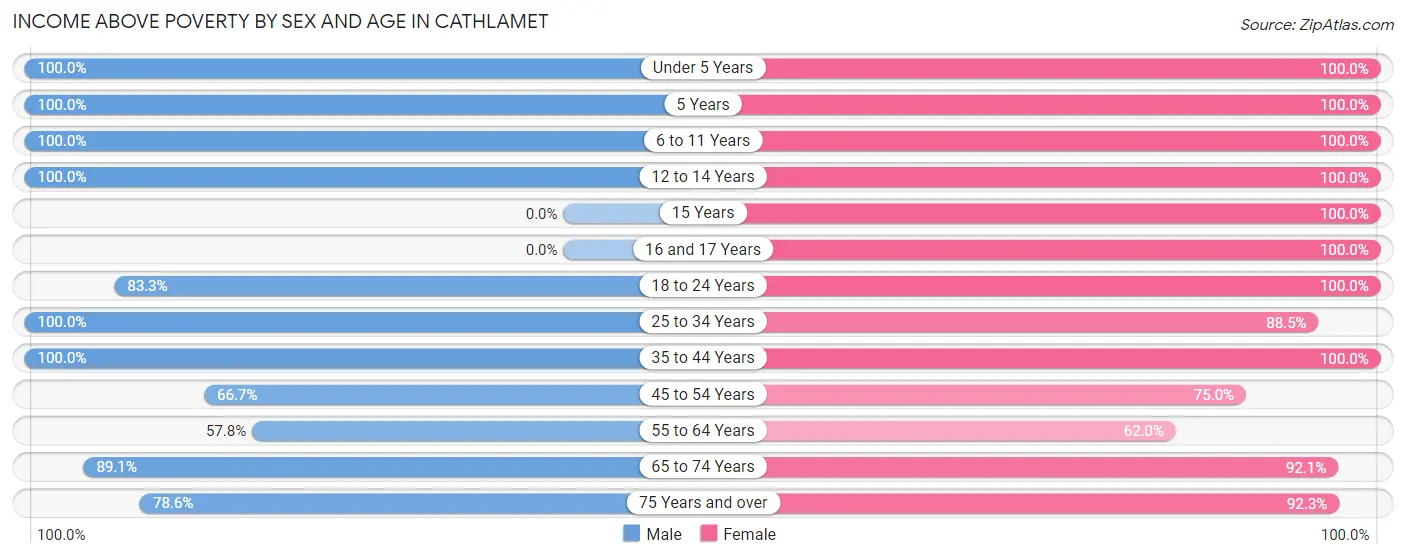
| Age Bracket | Male | Female |
| Under 5 Years | 5 (100.0%) | 7 (100.0%) |
| 5 Years | 1 (100.0%) | 3 (100.0%) |
| 6 to 11 Years | 17 (100.0%) | 1 (100.0%) |
| 12 to 14 Years | 1 (100.0%) | 1 (100.0%) |
| 15 Years | 0 (0.0%) | 1 (100.0%) |
| 16 and 17 Years | 0 (0.0%) | 3 (100.0%) |
| 18 to 24 Years | 20 (83.3%) | 17 (100.0%) |
| 25 to 34 Years | 17 (100.0%) | 23 (88.5%) |
| 35 to 44 Years | 13 (100.0%) | 14 (100.0%) |
| 45 to 54 Years | 14 (66.7%) | 30 (75.0%) |
| 55 to 64 Years | 26 (57.8%) | 31 (62.0%) |
| 65 to 74 Years | 57 (89.1%) | 70 (92.1%) |
| 75 Years and over | 11 (78.6%) | 36 (92.3%) |
| Total | 182 (78.4%) | 237 (85.3%) |
Income Below Poverty Among Married-Couple Families in Cathlamet
The poverty statistics for married-couple families in Cathlamet show that 12.3% or 15 of the total 122 families live below the poverty line. Families with no children have the highest poverty rate of 15.5%, comprising of 15 families. On the other hand, families with 1 or 2 children have the lowest poverty rate of 0.0%, which includes 0 families.
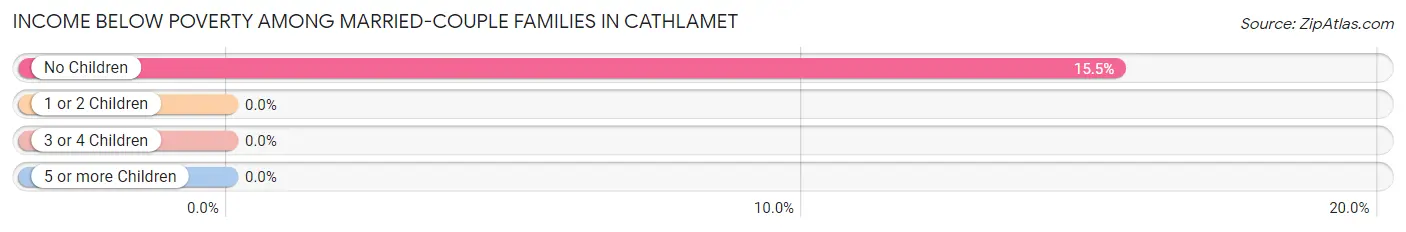
| Children | Above Poverty | Below Poverty |
| No Children | 82 (84.5%) | 15 (15.5%) |
| 1 or 2 Children | 3 (100.0%) | 0 (0.0%) |
| 3 or 4 Children | 22 (100.0%) | 0 (0.0%) |
| 5 or more Children | 0 (0.0%) | 0 (0.0%) |
| Total | 107 (87.7%) | 15 (12.3%) |
Income Below Poverty Among Single-Parent Households in Cathlamet
| Children | Single Father | Single Mother |
| No Children | 0 (0.0%) | 0 (0.0%) |
| 1 or 2 Children | 0 (0.0%) | 0 (0.0%) |
| 3 or 4 Children | 0 (0.0%) | 0 (0.0%) |
| 5 or more Children | 0 (0.0%) | 0 (0.0%) |
| Total | 0 (0.0%) | 0 (0.0%) |
Income Below Poverty Among Married-Couple vs Single-Parent Households in Cathlamet
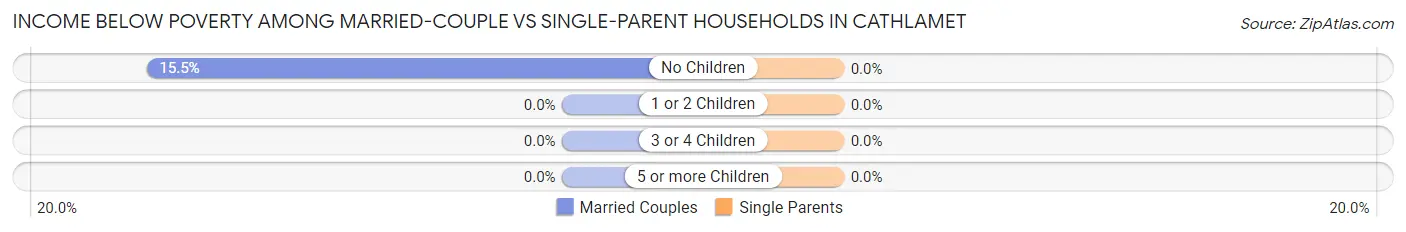
| Children | Married-Couple Families | Single-Parent Households |
| No Children | 15 (15.5%) | 0 (0.0%) |
| 1 or 2 Children | 0 (0.0%) | 0 (0.0%) |
| 3 or 4 Children | 0 (0.0%) | 0 (0.0%) |
| 5 or more Children | 0 (0.0%) | 0 (0.0%) |
| Total | 15 (12.3%) | 0 (0.0%) |
Race in Cathlamet
The most populous races in Cathlamet are White / Caucasian (524 | 96.0%), Hispanic or Latino (15 | 2.8%), and Two or more Races (8 | 1.5%).
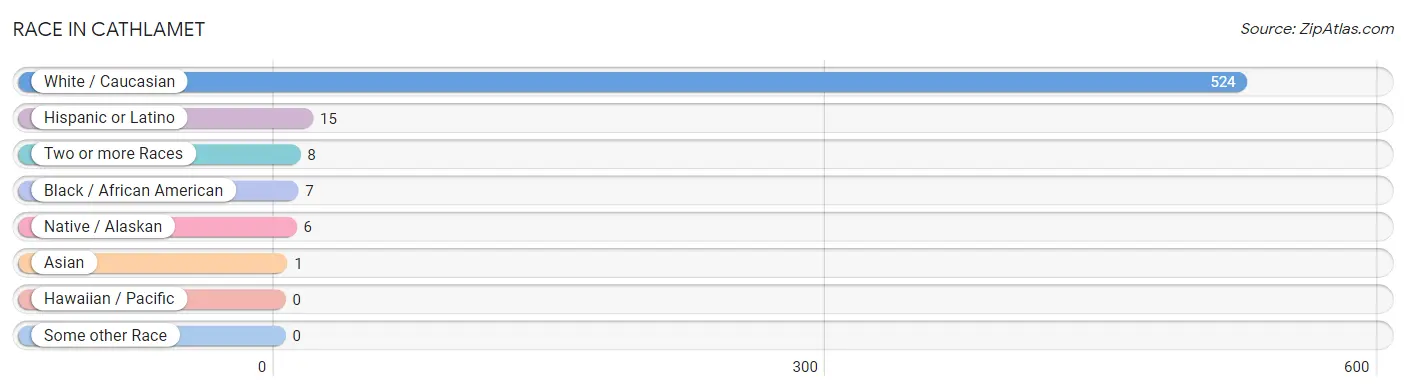
| Race | # Population | % Population |
| Asian | 1 | 0.2% |
| Black / African American | 7 | 1.3% |
| Hawaiian / Pacific | 0 | 0.0% |
| Hispanic or Latino | 15 | 2.8% |
| Native / Alaskan | 6 | 1.1% |
| White / Caucasian | 524 | 96.0% |
| Two or more Races | 8 | 1.5% |
| Some other Race | 0 | 0.0% |
| Total | 546 | 100.0% |
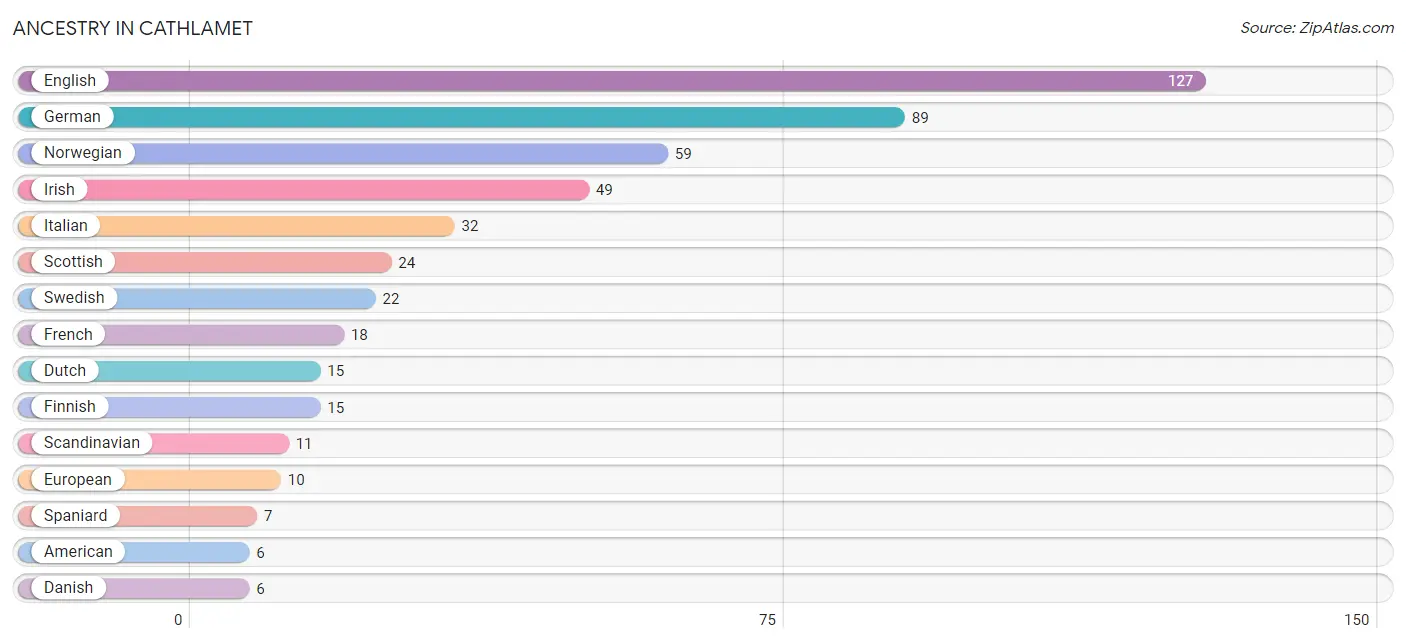
Ancestry in Cathlamet
The most populous ancestries reported in Cathlamet are English (127 | 23.3%), German (89 | 16.3%), Norwegian (59 | 10.8%), Irish (49 | 9.0%), and Italian (32 | 5.9%), together accounting for 65.2% of all Cathlamet residents.
| Ancestry | # Population | % Population |
| American | 6 | 1.1% |
| Apache | 1 | 0.2% |
| Blackfeet | 1 | 0.2% |
| Burmese | 4 | 0.7% |
| Cherokee | 3 | 0.5% |
| Czech | 4 | 0.7% |
| Danish | 6 | 1.1% |
| Dutch | 15 | 2.8% |
| Eastern European | 6 | 1.1% |
| English | 127 | 23.3% |
| European | 10 | 1.8% |
| Finnish | 15 | 2.8% |
| French | 18 | 3.3% |
| German | 89 | 16.3% |
| Indian (Asian) | 1 | 0.2% |
| Irish | 49 | 9.0% |
| Italian | 32 | 5.9% |
| Mexican | 5 | 0.9% |
| Northern European | 3 | 0.5% |
| Norwegian | 59 | 10.8% |
| Polish | 3 | 0.5% |
| Puerto Rican | 3 | 0.5% |
| Russian | 3 | 0.5% |
| Scandinavian | 11 | 2.0% |
| Scotch-Irish | 6 | 1.1% |
| Scottish | 24 | 4.4% |
| Spaniard | 7 | 1.3% |
| Swedish | 22 | 4.0% |
| Welsh | 6 | 1.1% | View All 29 Rows |
Immigrants in Cathlamet
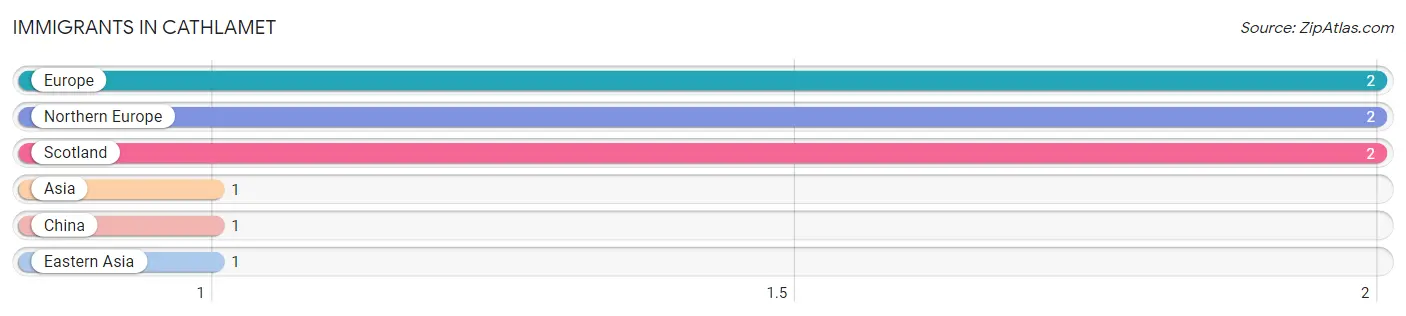
The most numerous immigrant groups reported in Cathlamet came from Europe (2 | 0.4%), Northern Europe (2 | 0.4%), Scotland (2 | 0.4%), Asia (1 | 0.2%), and China (1 | 0.2%), together accounting for 1.5% of all Cathlamet residents.
| Immigration Origin | # Population | % Population |
| Asia | 1 | 0.2% |
| China | 1 | 0.2% |
| Eastern Asia | 1 | 0.2% |
| Europe | 2 | 0.4% |
| Northern Europe | 2 | 0.4% |
| Scotland | 2 | 0.4% | View All 6 Rows |
Sex and Age in Cathlamet
Sex and Age in Cathlamet
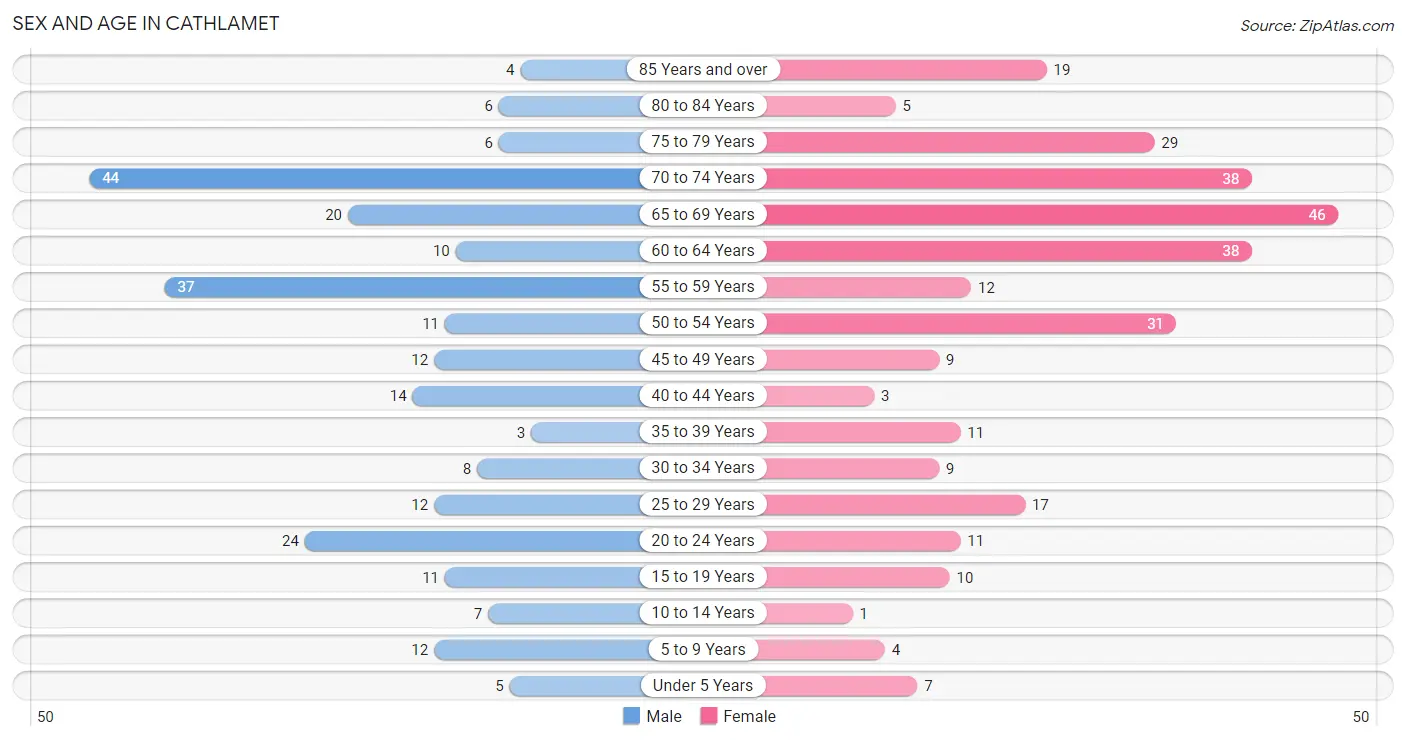
The most populous age groups in Cathlamet are 70 to 74 Years (44 | 17.9%) for men and 65 to 69 Years (46 | 15.3%) for women.
| Age Bracket | Male | Female |
| Under 5 Years | 5 (2.0%) | 7 (2.3%) |
| 5 to 9 Years | 12 (4.9%) | 4 (1.3%) |
| 10 to 14 Years | 7 (2.9%) | 1 (0.3%) |
| 15 to 19 Years | 11 (4.5%) | 10 (3.3%) |
| 20 to 24 Years | 24 (9.8%) | 11 (3.7%) |
| 25 to 29 Years | 12 (4.9%) | 17 (5.7%) |
| 30 to 34 Years | 8 (3.3%) | 9 (3.0%) |
| 35 to 39 Years | 3 (1.2%) | 11 (3.7%) |
| 40 to 44 Years | 14 (5.7%) | 3 (1.0%) |
| 45 to 49 Years | 12 (4.9%) | 9 (3.0%) |
| 50 to 54 Years | 11 (4.5%) | 31 (10.3%) |
| 55 to 59 Years | 37 (15.0%) | 12 (4.0%) |
| 60 to 64 Years | 10 (4.1%) | 38 (12.7%) |
| 65 to 69 Years | 20 (8.1%) | 46 (15.3%) |
| 70 to 74 Years | 44 (17.9%) | 38 (12.7%) |
| 75 to 79 Years | 6 (2.4%) | 29 (9.7%) |
| 80 to 84 Years | 6 (2.4%) | 5 (1.7%) |
| 85 Years and over | 4 (1.6%) | 19 (6.3%) |
| Total | 246 (100.0%) | 300 (100.0%) |
Families and Households in Cathlamet
Median Family Size in Cathlamet
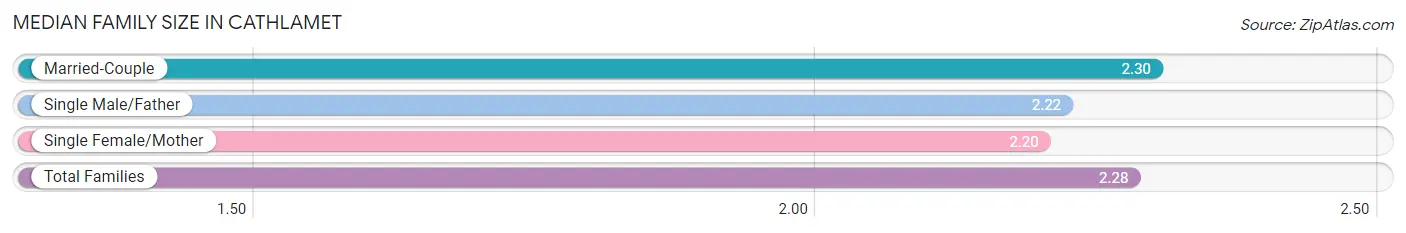
The median family size in Cathlamet is 2.28 persons per family, with married-couple families (122 | 83.6%) accounting for the largest median family size of 2.3 persons per family. On the other hand, single female/mother families (15 | 10.3%) represent the smallest median family size with 2.20 persons per family.
| Family Type | # Families | Family Size |
| Married-Couple | 122 (83.6%) | 2.30 |
| Single Male/Father | 9 (6.2%) | 2.22 |
| Single Female/Mother | 15 (10.3%) | 2.20 |
| Total Families | 146 (100.0%) | 2.28 |
Median Household Size in Cathlamet
The median household size in Cathlamet is 1.86 persons per household, with single female/mother households (15 | 5.6%) accounting for the largest median household size of 3.13 persons per household. non-family households (123 | 45.7%) represent the smallest median household size with 1.20 persons per household.

| Household Type | # Households | Household Size |
| Married-Couple | 122 (45.4%) | 2.30 |
| Single Male/Father | 9 (3.4%) | 2.89 |
| Single Female/Mother | 15 (5.6%) | 3.13 |
| Non-family | 123 (45.7%) | 1.20 |
| Total Households | 269 (100.0%) | 1.86 |
Household Size by Marriage Status in Cathlamet
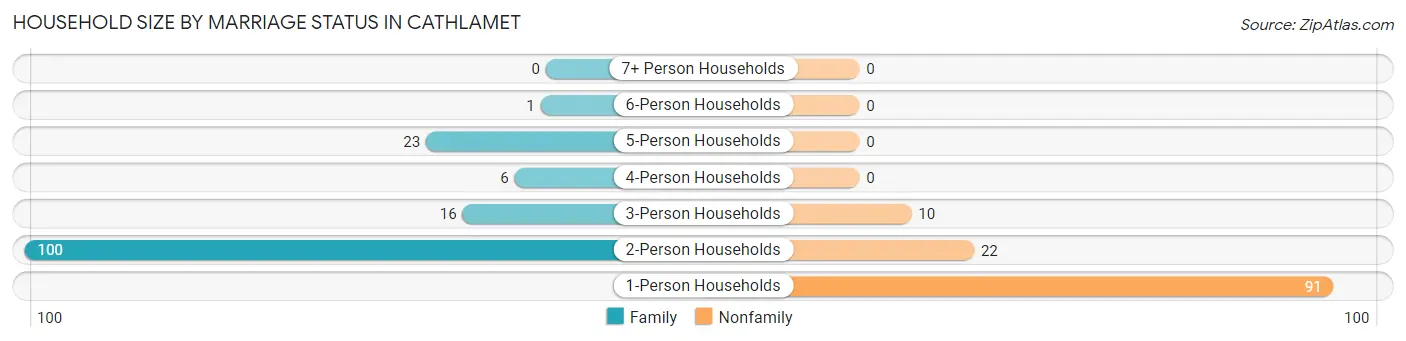
Out of a total of 269 households in Cathlamet, 146 (54.3%) are family households, while 123 (45.7%) are nonfamily households. The most numerous type of family households are 2-person households, comprising 100, and the most common type of nonfamily households are 1-person households, comprising 91.
| Household Size | Family Households | Nonfamily Households |
| 1-Person Households | - | 91 (33.8%) |
| 2-Person Households | 100 (37.2%) | 22 (8.2%) |
| 3-Person Households | 16 (5.9%) | 10 (3.7%) |
| 4-Person Households | 6 (2.2%) | 0 (0.0%) |
| 5-Person Households | 23 (8.6%) | 0 (0.0%) |
| 6-Person Households | 1 (0.4%) | 0 (0.0%) |
| 7+ Person Households | 0 (0.0%) | 0 (0.0%) |
| Total | 146 (54.3%) | 123 (45.7%) |
Female Fertility in Cathlamet
Fertility by Age in Cathlamet
Average fertility rate in Cathlamet is 41.0 births per 1,000 women. Women in the age bracket of 35 to 50 years have the highest fertility rate with 77.0 births per 1,000 women. Women in the age bracket of 35 to 50 years acount for 66.7% of all women with births.
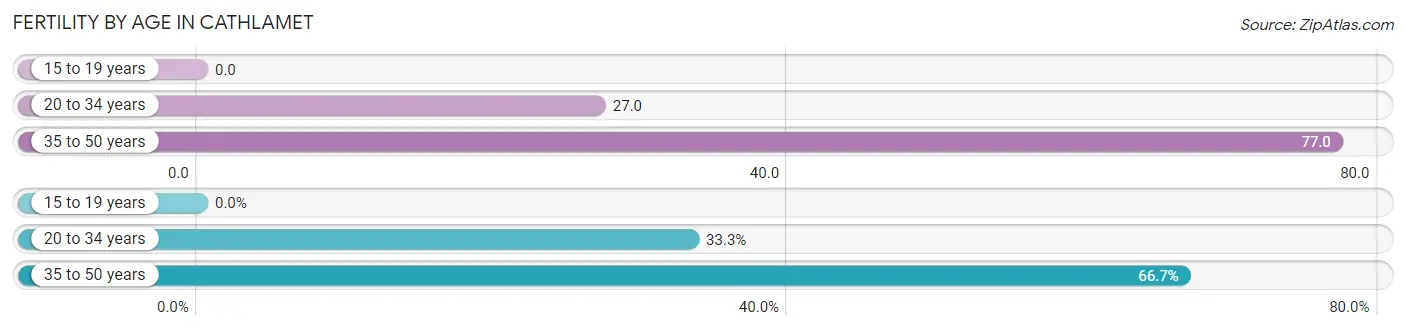
| Age Bracket | Women with Births | Births / 1,000 Women |
| 15 to 19 years | 0 (0.0%) | 0.0 |
| 20 to 34 years | 1 (33.3%) | 27.0 |
| 35 to 50 years | 2 (66.7%) | 77.0 |
| Total | 3 (100.0%) | 41.0 |
Fertility by Age by Marriage Status in Cathlamet
33.3% of women with births (3) in Cathlamet are married. The highest percentage of unmarried women with births falls into 35 to 50 years age bracket with 100.0% of them unmarried at the time of birth, while the lowest percentage of unmarried women with births belong to 20 to 34 years age bracket with 0.0% of them unmarried.
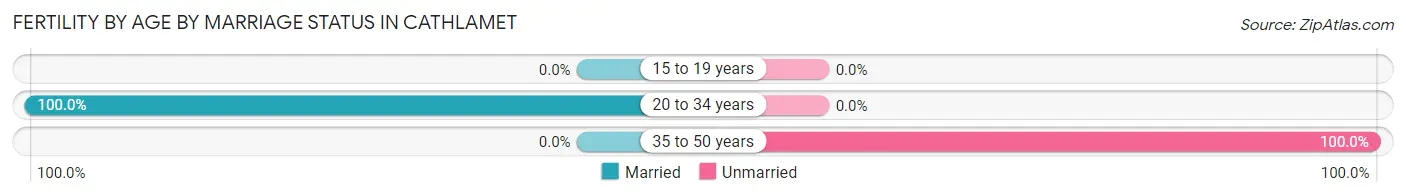
| Age Bracket | Married | Unmarried |
| 15 to 19 years | 0 (0.0%) | 0 (0.0%) |
| 20 to 34 years | 1 (100.0%) | 0 (0.0%) |
| 35 to 50 years | 0 (0.0%) | 2 (100.0%) |
| Total | 1 (33.3%) | 2 (66.7%) |
Fertility by Education in Cathlamet
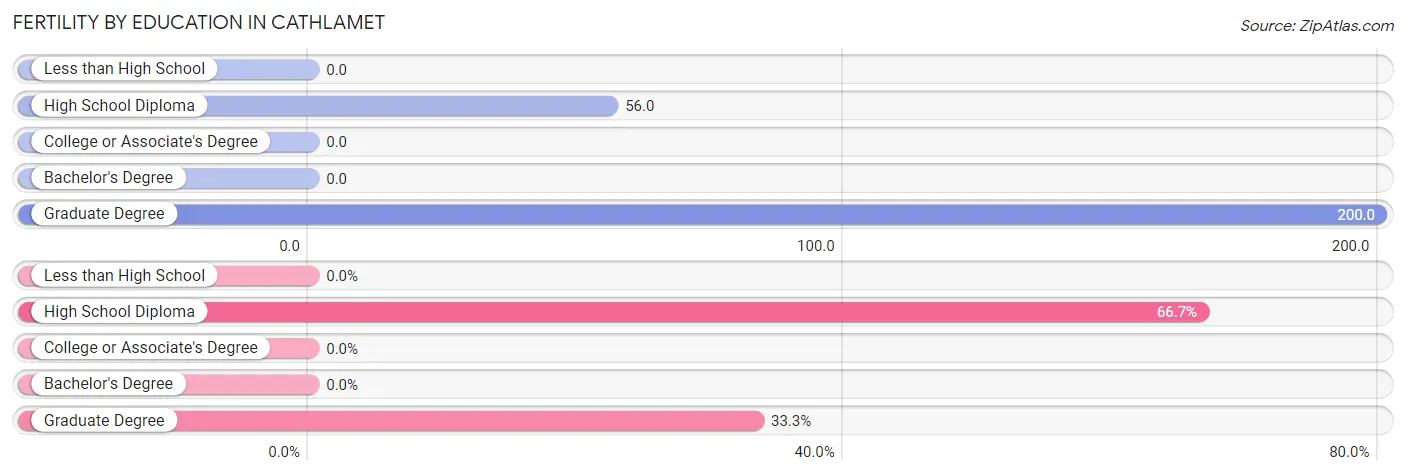
| Educational Attainment | Women with Births | Births / 1,000 Women |
| Less than High School | 0 (0.0%) | 0.0 |
| High School Diploma | 2 (66.7%) | 56.0 |
| College or Associate's Degree | 0 (0.0%) | 0.0 |
| Bachelor's Degree | 0 (0.0%) | 0.0 |
| Graduate Degree | 1 (33.3%) | 200.0 |
| Total | 3 (100.0%) | 41.0 |
Fertility by Education by Marriage Status in Cathlamet
66.7% of women with births in Cathlamet are unmarried. Women with the educational attainment of graduate degree are most likely to be married with 100.0% of them married at childbirth, while women with the educational attainment of high school diploma are least likely to be married with 100.0% of them unmarried at childbirth.
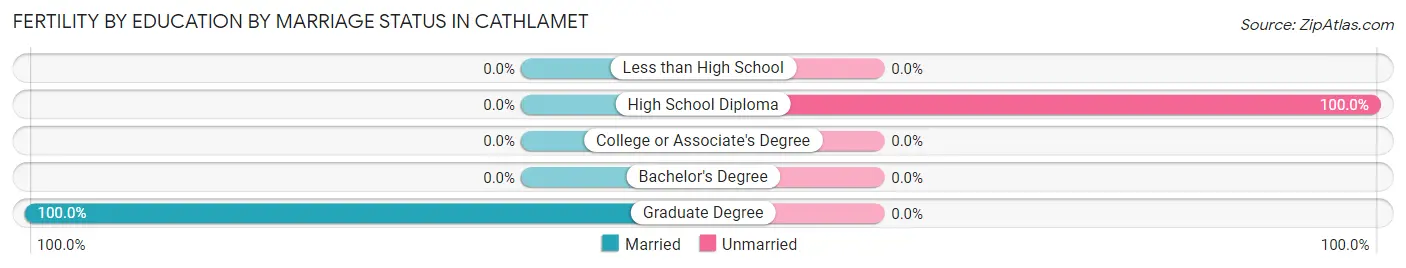
| Educational Attainment | Married | Unmarried |
| Less than High School | 0 (0.0%) | 0 (0.0%) |
| High School Diploma | 0 (0.0%) | 2 (100.0%) |
| College or Associate's Degree | 0 (0.0%) | 0 (0.0%) |
| Bachelor's Degree | 0 (0.0%) | 0 (0.0%) |
| Graduate Degree | 1 (100.0%) | 0 (0.0%) |
| Total | 1 (33.3%) | 2 (66.7%) |
Employment Characteristics in Cathlamet
Employment by Class of Employer in Cathlamet
Among the 174 employed individuals in Cathlamet, private company employees (67 | 38.5%), local government employees (66 | 37.9%), and self-employed (not incorporated) (10 | 5.8%) make up the most common classes of employment.
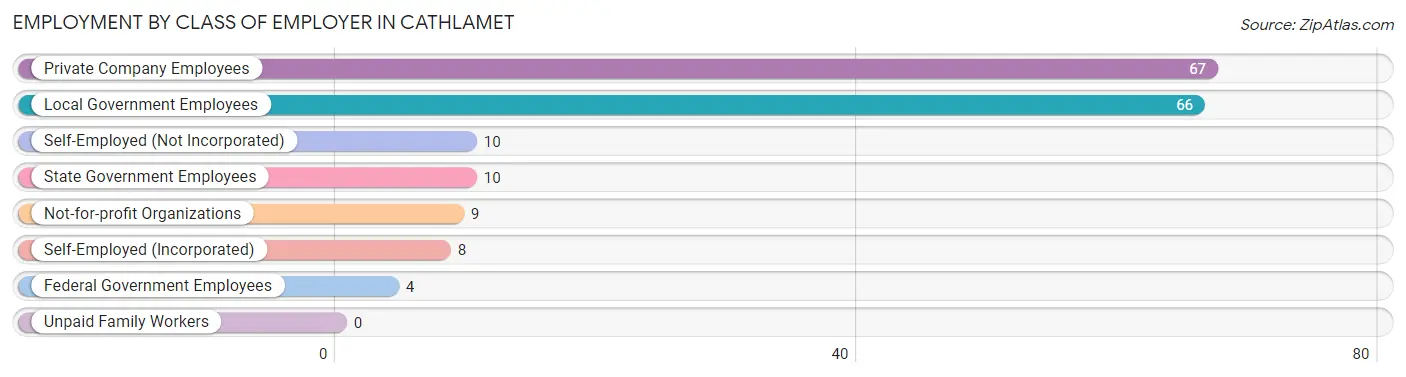
| Employer Class | # Employees | % Employees |
| Private Company Employees | 67 | 38.5% |
| Self-Employed (Incorporated) | 8 | 4.6% |
| Self-Employed (Not Incorporated) | 10 | 5.8% |
| Not-for-profit Organizations | 9 | 5.2% |
| Local Government Employees | 66 | 37.9% |
| State Government Employees | 10 | 5.8% |
| Federal Government Employees | 4 | 2.3% |
| Unpaid Family Workers | 0 | 0.0% |
| Total | 174 | 100.0% |
Employment Status by Age in Cathlamet
According to the labor force statistics for Cathlamet, out of the total population over 16 years of age (509), 35.8% or 182 individuals are in the labor force, with 2.2% or 4 of them unemployed. The age group with the highest labor force participation rate is 25 to 29 years, with 100.0% or 29 individuals in the labor force. Within the labor force, the 20 to 24 years age range has the highest percentage of unemployed individuals, with 16.7% or 4 of them being unemployed.
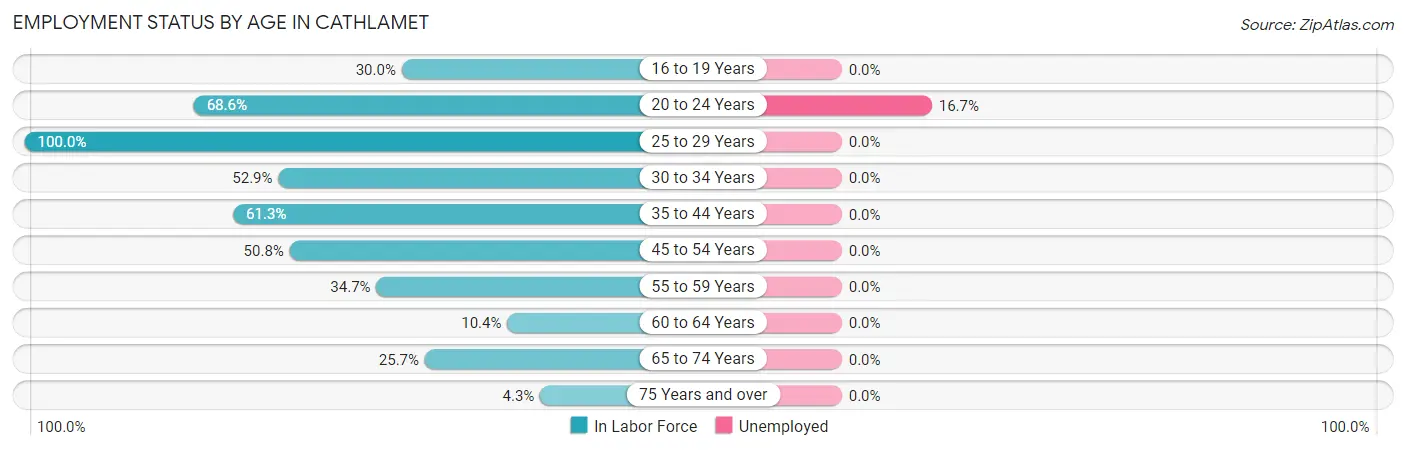
| Age Bracket | In Labor Force | Unemployed |
| 16 to 19 Years | 6 (30.0%) | 0 (0.0%) |
| 20 to 24 Years | 24 (68.6%) | 4 (16.7%) |
| 25 to 29 Years | 29 (100.0%) | 0 (0.0%) |
| 30 to 34 Years | 9 (52.9%) | 0 (0.0%) |
| 35 to 44 Years | 19 (61.3%) | 0 (0.0%) |
| 45 to 54 Years | 32 (50.8%) | 0 (0.0%) |
| 55 to 59 Years | 17 (34.7%) | 0 (0.0%) |
| 60 to 64 Years | 5 (10.4%) | 0 (0.0%) |
| 65 to 74 Years | 38 (25.7%) | 0 (0.0%) |
| 75 Years and over | 3 (4.3%) | 0 (0.0%) |
| Total | 182 (35.8%) | 4 (2.2%) |
Employment Status by Educational Attainment in Cathlamet
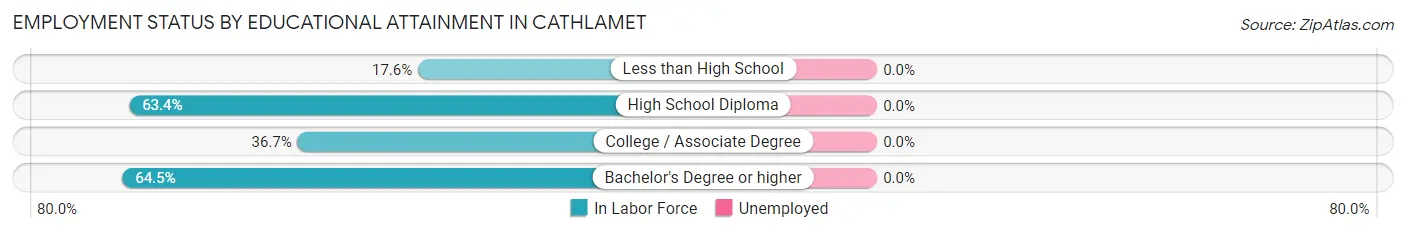
| Educational Attainment | In Labor Force | Unemployed |
| Less than High School | 6 (17.6%) | 0 (0.0%) |
| High School Diploma | 52 (63.4%) | 0 (0.0%) |
| College / Associate Degree | 33 (36.7%) | 0 (0.0%) |
| Bachelor's Degree or higher | 20 (64.5%) | 0 (0.0%) |
| Total | 111 (46.8%) | 0 (0.0%) |
Employment Occupations by Sex in Cathlamet
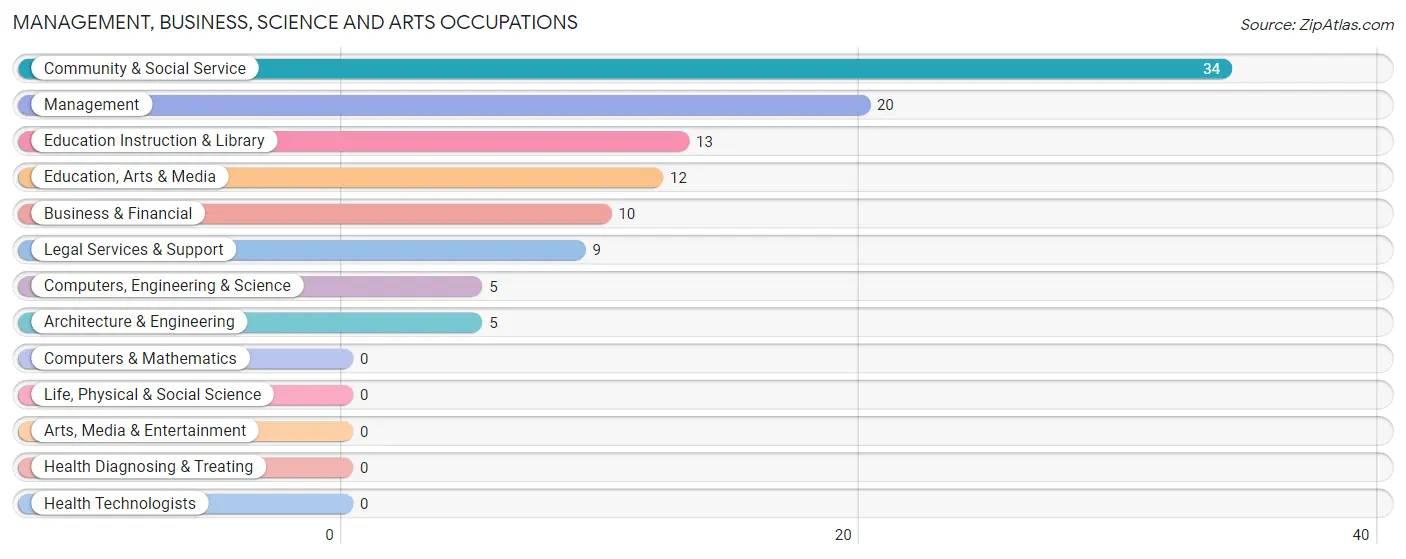
Management, Business, Science and Arts Occupations
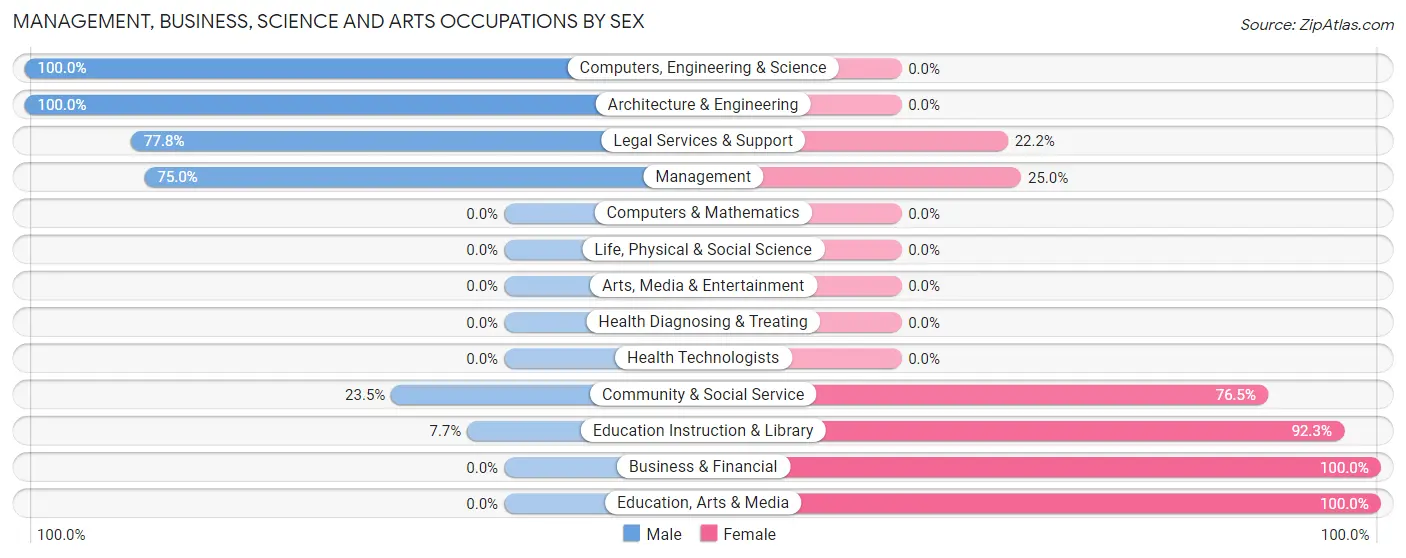
The most common Management, Business, Science and Arts occupations in Cathlamet are Community & Social Service (34 | 19.1%), Management (20 | 11.2%), Education Instruction & Library (13 | 7.3%), Education, Arts & Media (12 | 6.7%), and Business & Financial (10 | 5.6%).
Management, Business, Science and Arts Occupations by Sex
Within the Management, Business, Science and Arts occupations in Cathlamet, the most male-oriented occupations are Computers, Engineering & Science (100.0%), Architecture & Engineering (100.0%), and Legal Services & Support (77.8%), while the most female-oriented occupations are Business & Financial (100.0%), Education, Arts & Media (100.0%), and Education Instruction & Library (92.3%).
| Occupation | Male | Female |
| Management | 15 (75.0%) | 5 (25.0%) |
| Business & Financial | 0 (0.0%) | 10 (100.0%) |
| Computers, Engineering & Science | 5 (100.0%) | 0 (0.0%) |
| Computers & Mathematics | 0 (0.0%) | 0 (0.0%) |
| Architecture & Engineering | 5 (100.0%) | 0 (0.0%) |
| Life, Physical & Social Science | 0 (0.0%) | 0 (0.0%) |
| Community & Social Service | 8 (23.5%) | 26 (76.5%) |
| Education, Arts & Media | 0 (0.0%) | 12 (100.0%) |
| Legal Services & Support | 7 (77.8%) | 2 (22.2%) |
| Education Instruction & Library | 1 (7.7%) | 12 (92.3%) |
| Arts, Media & Entertainment | 0 (0.0%) | 0 (0.0%) |
| Health Diagnosing & Treating | 0 (0.0%) | 0 (0.0%) |
| Health Technologists | 0 (0.0%) | 0 (0.0%) |
| Total (Category) | 28 (40.6%) | 41 (59.4%) |
| Total (Overall) | 97 (54.5%) | 81 (45.5%) |
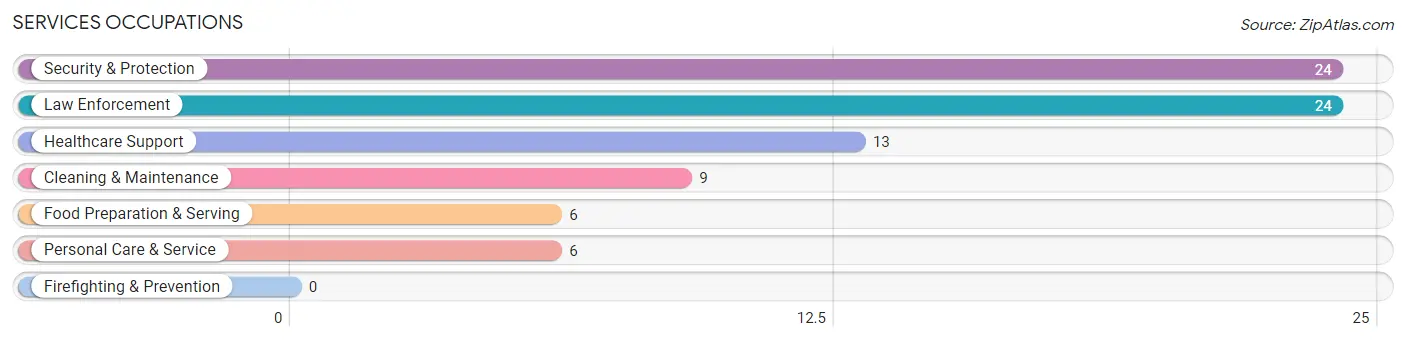
Services Occupations
The most common Services occupations in Cathlamet are Security & Protection (24 | 13.5%), Law Enforcement (24 | 13.5%), Healthcare Support (13 | 7.3%), Cleaning & Maintenance (9 | 5.1%), and Food Preparation & Serving (6 | 3.4%).
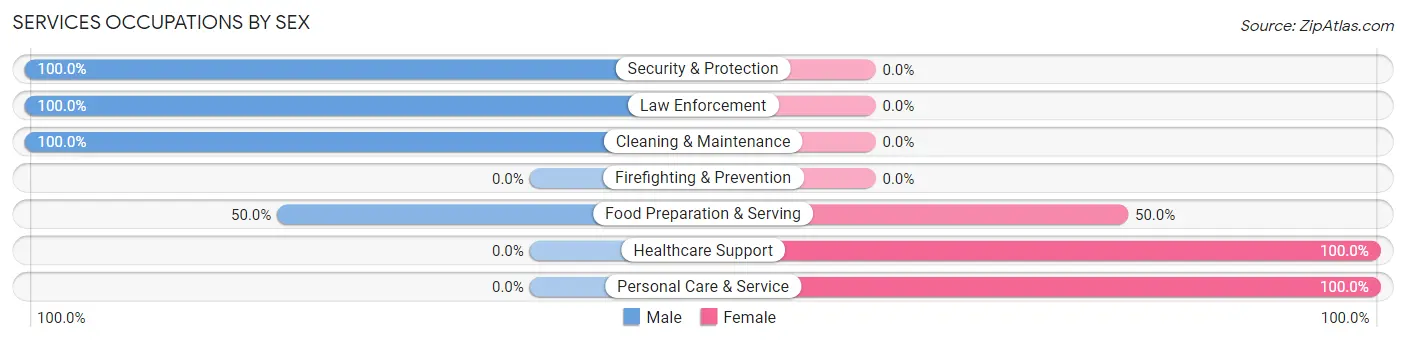
Services Occupations by Sex
Within the Services occupations in Cathlamet, the most male-oriented occupations are Security & Protection (100.0%), Law Enforcement (100.0%), and Cleaning & Maintenance (100.0%), while the most female-oriented occupations are Healthcare Support (100.0%), Personal Care & Service (100.0%), and Food Preparation & Serving (50.0%).
| Occupation | Male | Female |
| Healthcare Support | 0 (0.0%) | 13 (100.0%) |
| Security & Protection | 24 (100.0%) | 0 (0.0%) |
| Firefighting & Prevention | 0 (0.0%) | 0 (0.0%) |
| Law Enforcement | 24 (100.0%) | 0 (0.0%) |
| Food Preparation & Serving | 3 (50.0%) | 3 (50.0%) |
| Cleaning & Maintenance | 9 (100.0%) | 0 (0.0%) |
| Personal Care & Service | 0 (0.0%) | 6 (100.0%) |
| Total (Category) | 36 (62.1%) | 22 (37.9%) |
| Total (Overall) | 97 (54.5%) | 81 (45.5%) |
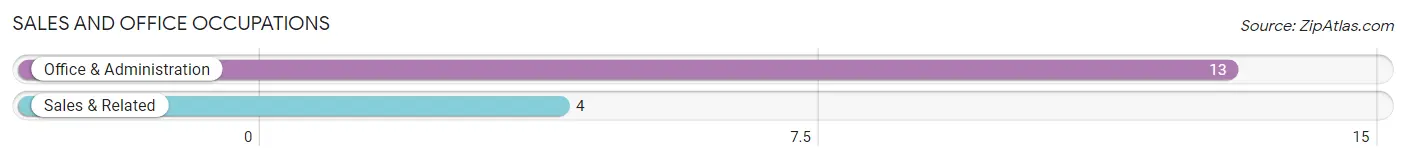
Sales and Office Occupations
The most common Sales and Office occupations in Cathlamet are Office & Administration (13 | 7.3%), and Sales & Related (4 | 2.2%).
Sales and Office Occupations by Sex
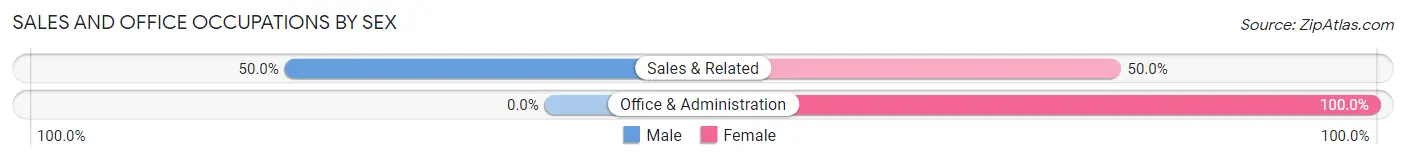
| Occupation | Male | Female |
| Sales & Related | 2 (50.0%) | 2 (50.0%) |
| Office & Administration | 0 (0.0%) | 13 (100.0%) |
| Total (Category) | 2 (11.8%) | 15 (88.2%) |
| Total (Overall) | 97 (54.5%) | 81 (45.5%) |
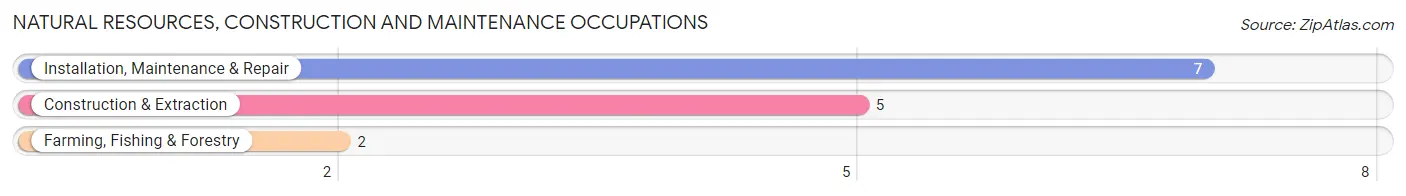
Natural Resources, Construction and Maintenance Occupations
The most common Natural Resources, Construction and Maintenance occupations in Cathlamet are Installation, Maintenance & Repair (7 | 3.9%), Construction & Extraction (5 | 2.8%), and Farming, Fishing & Forestry (2 | 1.1%).
Natural Resources, Construction and Maintenance Occupations by Sex
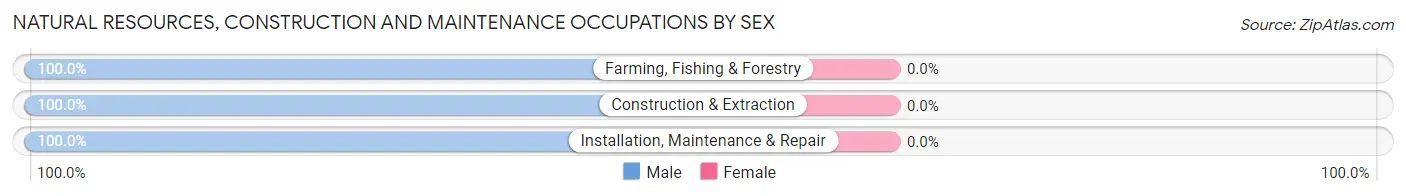
| Occupation | Male | Female |
| Farming, Fishing & Forestry | 2 (100.0%) | 0 (0.0%) |
| Construction & Extraction | 5 (100.0%) | 0 (0.0%) |
| Installation, Maintenance & Repair | 7 (100.0%) | 0 (0.0%) |
| Total (Category) | 14 (100.0%) | 0 (0.0%) |
| Total (Overall) | 97 (54.5%) | 81 (45.5%) |
Production, Transportation and Moving Occupations
The most common Production, Transportation and Moving occupations in Cathlamet are Material Moving (10 | 5.6%), Transportation (7 | 3.9%), and Production (3 | 1.7%).
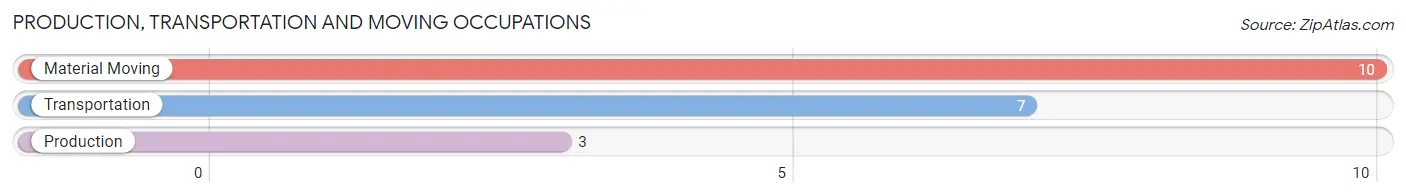
Production, Transportation and Moving Occupations by Sex
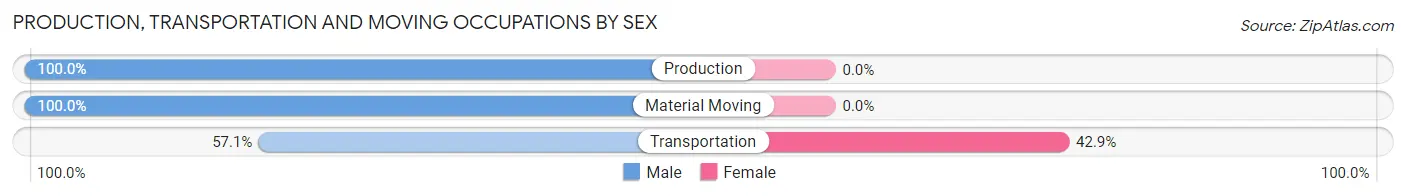
| Occupation | Male | Female |
| Production | 3 (100.0%) | 0 (0.0%) |
| Transportation | 4 (57.1%) | 3 (42.9%) |
| Material Moving | 10 (100.0%) | 0 (0.0%) |
| Total (Category) | 17 (85.0%) | 3 (15.0%) |
| Total (Overall) | 97 (54.5%) | 81 (45.5%) |
Employment Industries by Sex in Cathlamet
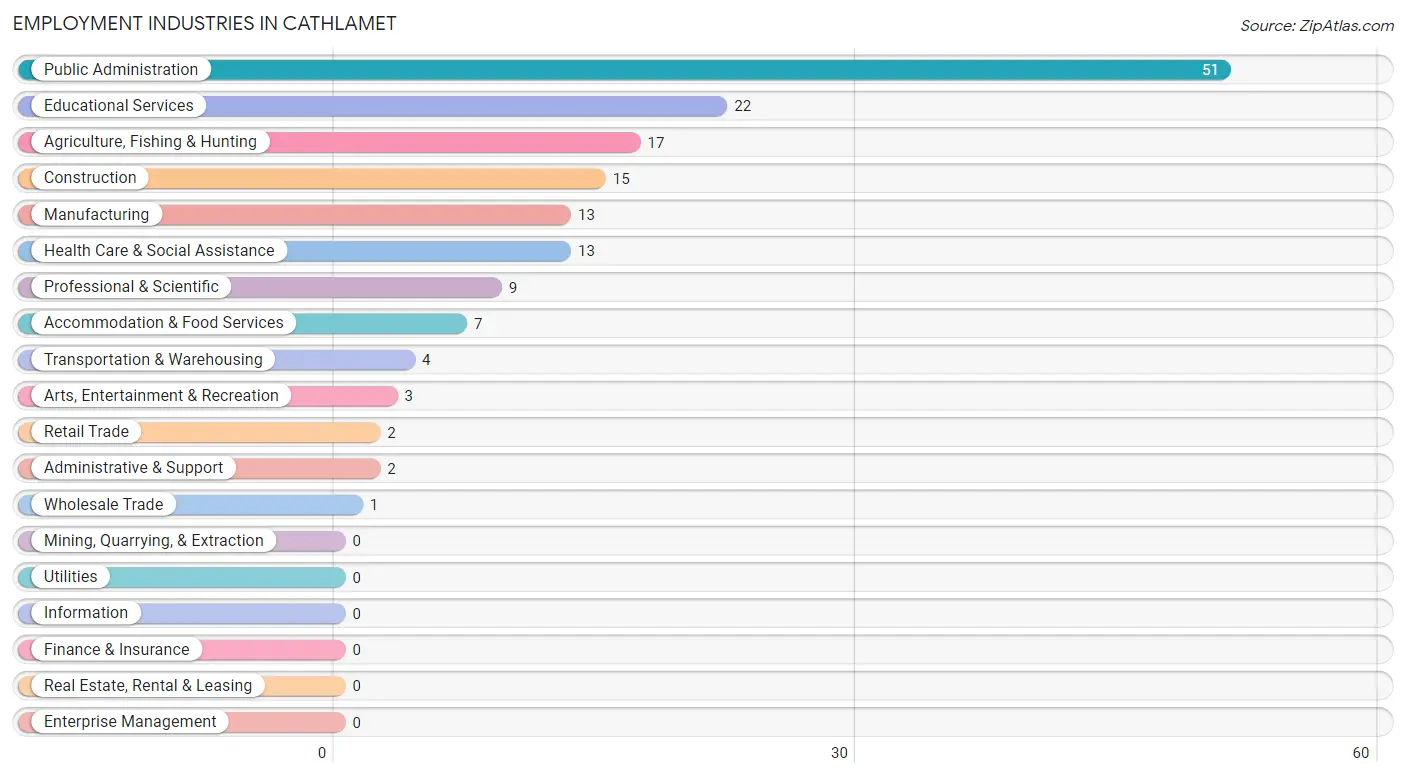
Employment Industries in Cathlamet
The major employment industries in Cathlamet include Public Administration (51 | 28.6%), Educational Services (22 | 12.4%), Agriculture, Fishing & Hunting (17 | 9.6%), Construction (15 | 8.4%), and Manufacturing (13 | 7.3%).
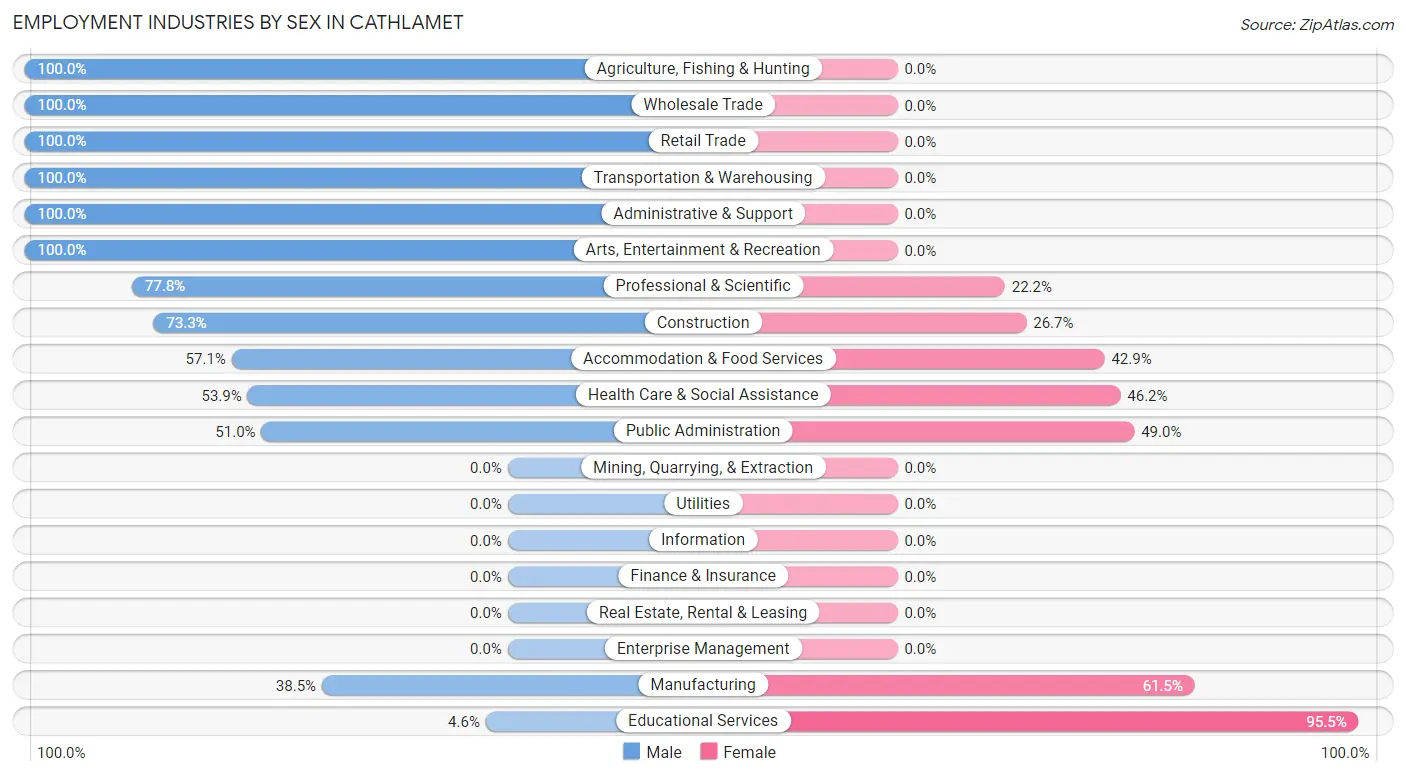
Employment Industries by Sex in Cathlamet
The Cathlamet industries that see more men than women are Agriculture, Fishing & Hunting (100.0%), Wholesale Trade (100.0%), and Retail Trade (100.0%), whereas the industries that tend to have a higher number of women are Educational Services (95.5%), Manufacturing (61.5%), and Public Administration (49.0%).
| Industry | Male | Female |
| Agriculture, Fishing & Hunting | 17 (100.0%) | 0 (0.0%) |
| Mining, Quarrying, & Extraction | 0 (0.0%) | 0 (0.0%) |
| Construction | 11 (73.3%) | 4 (26.7%) |
| Manufacturing | 5 (38.5%) | 8 (61.5%) |
| Wholesale Trade | 1 (100.0%) | 0 (0.0%) |
| Retail Trade | 2 (100.0%) | 0 (0.0%) |
| Transportation & Warehousing | 4 (100.0%) | 0 (0.0%) |
| Utilities | 0 (0.0%) | 0 (0.0%) |
| Information | 0 (0.0%) | 0 (0.0%) |
| Finance & Insurance | 0 (0.0%) | 0 (0.0%) |
| Real Estate, Rental & Leasing | 0 (0.0%) | 0 (0.0%) |
| Professional & Scientific | 7 (77.8%) | 2 (22.2%) |
| Enterprise Management | 0 (0.0%) | 0 (0.0%) |
| Administrative & Support | 2 (100.0%) | 0 (0.0%) |
| Educational Services | 1 (4.5%) | 21 (95.5%) |
| Health Care & Social Assistance | 7 (53.8%) | 6 (46.2%) |
| Arts, Entertainment & Recreation | 3 (100.0%) | 0 (0.0%) |
| Accommodation & Food Services | 4 (57.1%) | 3 (42.9%) |
| Public Administration | 26 (51.0%) | 25 (49.0%) |
| Total | 97 (54.5%) | 81 (45.5%) |
Education in Cathlamet
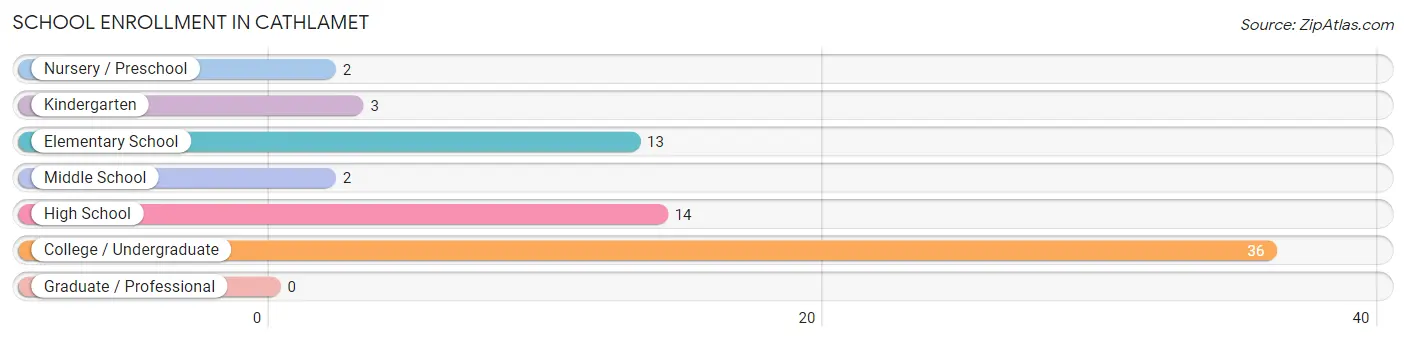
School Enrollment in Cathlamet
The most common levels of schooling among the 70 students in Cathlamet are college / undergraduate (36 | 51.4%), high school (14 | 20.0%), and elementary school (13 | 18.6%).
| School Level | # Students | % Students |
| Nursery / Preschool | 2 | 2.9% |
| Kindergarten | 3 | 4.3% |
| Elementary School | 13 | 18.6% |
| Middle School | 2 | 2.9% |
| High School | 14 | 20.0% |
| College / Undergraduate | 36 | 51.4% |
| Graduate / Professional | 0 | 0.0% |
| Total | 70 | 100.0% |
School Enrollment by Age by Funding Source in Cathlamet
Out of a total of 70 students who are enrolled in schools in Cathlamet, 24 (34.3%) attend a private institution, while the remaining 46 (65.7%) are enrolled in public schools. The age group of 3 to 4 year olds has the highest likelihood of being enrolled in private schools, with 2 (100.0% in the age bracket) enrolled. Conversely, the age group of 5 to 9 year old has the lowest likelihood of being enrolled in a private school, with 10 (100.0% in the age bracket) attending a public institution.
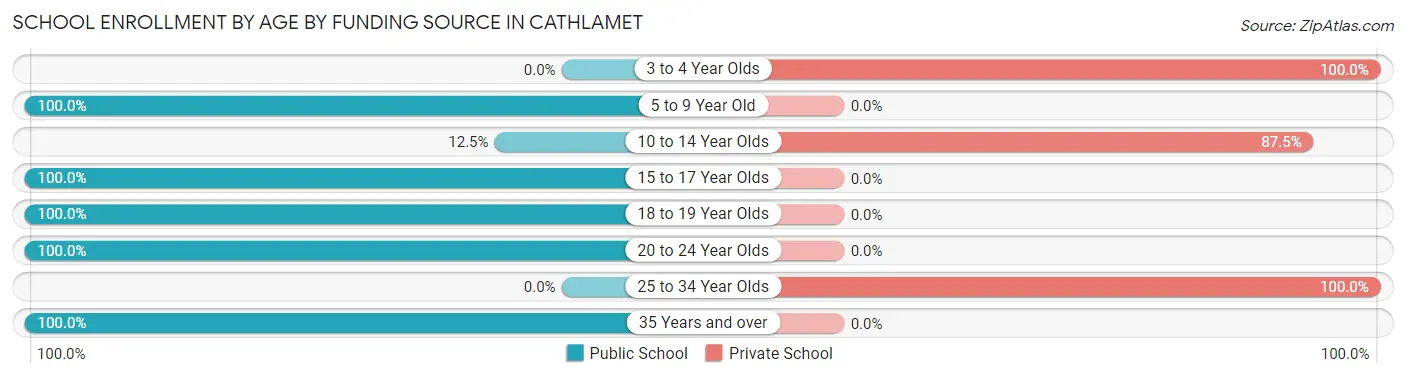
| Age Bracket | Public School | Private School |
| 3 to 4 Year Olds | 0 (0.0%) | 2 (100.0%) |
| 5 to 9 Year Old | 10 (100.0%) | 0 (0.0%) |
| 10 to 14 Year Olds | 1 (12.5%) | 7 (87.5%) |
| 15 to 17 Year Olds | 14 (100.0%) | 0 (0.0%) |
| 18 to 19 Year Olds | 6 (100.0%) | 0 (0.0%) |
| 20 to 24 Year Olds | 8 (100.0%) | 0 (0.0%) |
| 25 to 34 Year Olds | 0 (0.0%) | 15 (100.0%) |
| 35 Years and over | 7 (100.0%) | 0 (0.0%) |
| Total | 46 (65.7%) | 24 (34.3%) |
Educational Attainment by Field of Study in Cathlamet
Education (30 | 27.3%), science & technology (18 | 16.4%), physical & health sciences (13 | 11.8%), psychology (11 | 10.0%), and bio, nature & agricultural (10 | 9.1%) are the most common fields of study among 110 individuals in Cathlamet who have obtained a bachelor's degree or higher.
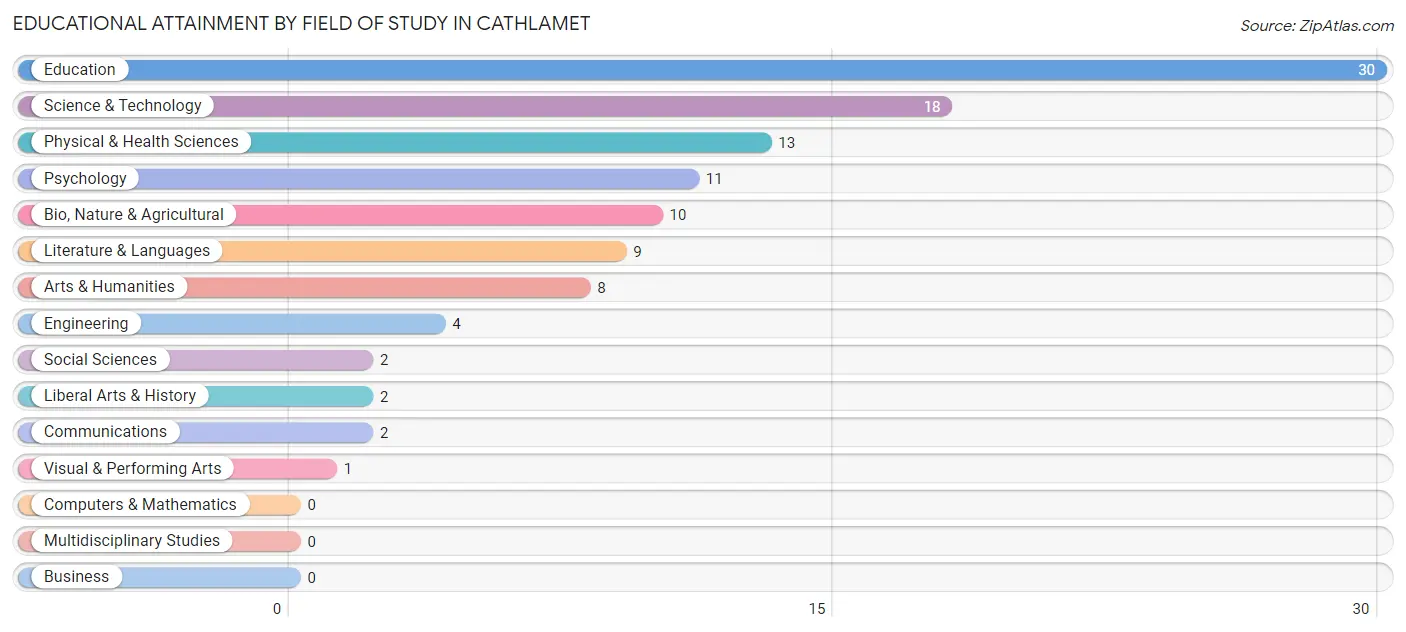
| Field of Study | # Graduates | % Graduates |
| Computers & Mathematics | 0 | 0.0% |
| Bio, Nature & Agricultural | 10 | 9.1% |
| Physical & Health Sciences | 13 | 11.8% |
| Psychology | 11 | 10.0% |
| Social Sciences | 2 | 1.8% |
| Engineering | 4 | 3.6% |
| Multidisciplinary Studies | 0 | 0.0% |
| Science & Technology | 18 | 16.4% |
| Business | 0 | 0.0% |
| Education | 30 | 27.3% |
| Literature & Languages | 9 | 8.2% |
| Liberal Arts & History | 2 | 1.8% |
| Visual & Performing Arts | 1 | 0.9% |
| Communications | 2 | 1.8% |
| Arts & Humanities | 8 | 7.3% |
| Total | 110 | 100.0% |
Transportation & Commute in Cathlamet
Vehicle Availability by Sex in Cathlamet
The most prevalent vehicle ownership categories in Cathlamet are males with 2 vehicles (32, accounting for 34.0%) and females with 2 vehicles (41, making up 42.7%).
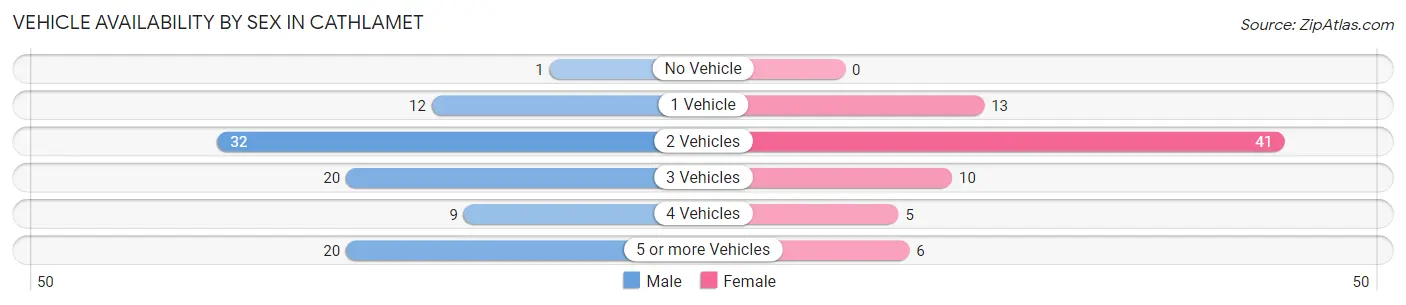
| Vehicles Available | Male | Female |
| No Vehicle | 1 (1.1%) | 0 (0.0%) |
| 1 Vehicle | 12 (12.8%) | 13 (17.3%) |
| 2 Vehicles | 32 (34.0%) | 41 (54.7%) |
| 3 Vehicles | 20 (21.3%) | 10 (13.3%) |
| 4 Vehicles | 9 (9.6%) | 5 (6.7%) |
| 5 or more Vehicles | 20 (21.3%) | 6 (8.0%) |
| Total | 94 (100.0%) | 75 (100.0%) |
Commute Time in Cathlamet
The most frequently occuring commute durations in Cathlamet are less than 5 minutes (62 commuters, 37.6%), 30 to 34 minutes (28 commuters, 17.0%), and 15 to 19 minutes (19 commuters, 11.5%).
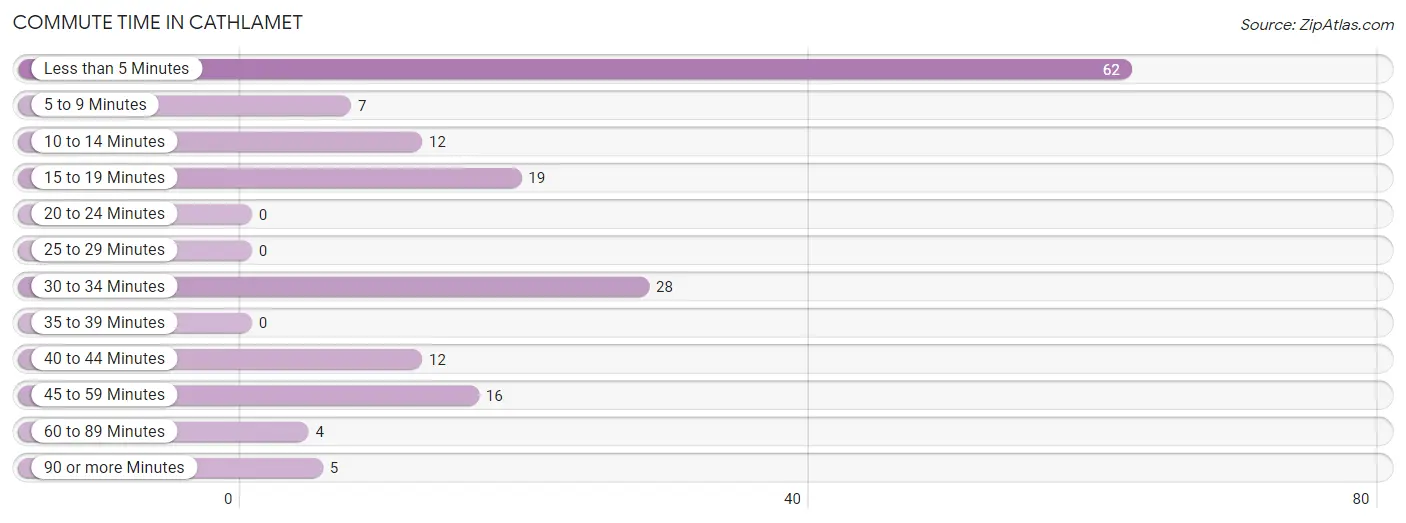
| Commute Time | # Commuters | % Commuters |
| Less than 5 Minutes | 62 | 37.6% |
| 5 to 9 Minutes | 7 | 4.2% |
| 10 to 14 Minutes | 12 | 7.3% |
| 15 to 19 Minutes | 19 | 11.5% |
| 20 to 24 Minutes | 0 | 0.0% |
| 25 to 29 Minutes | 0 | 0.0% |
| 30 to 34 Minutes | 28 | 17.0% |
| 35 to 39 Minutes | 0 | 0.0% |
| 40 to 44 Minutes | 12 | 7.3% |
| 45 to 59 Minutes | 16 | 9.7% |
| 60 to 89 Minutes | 4 | 2.4% |
| 90 or more Minutes | 5 | 3.0% |
Commute Time by Sex in Cathlamet
The most common commute times in Cathlamet are less than 5 minutes (33 commuters, 34.7%) for males and less than 5 minutes (29 commuters, 41.4%) for females.
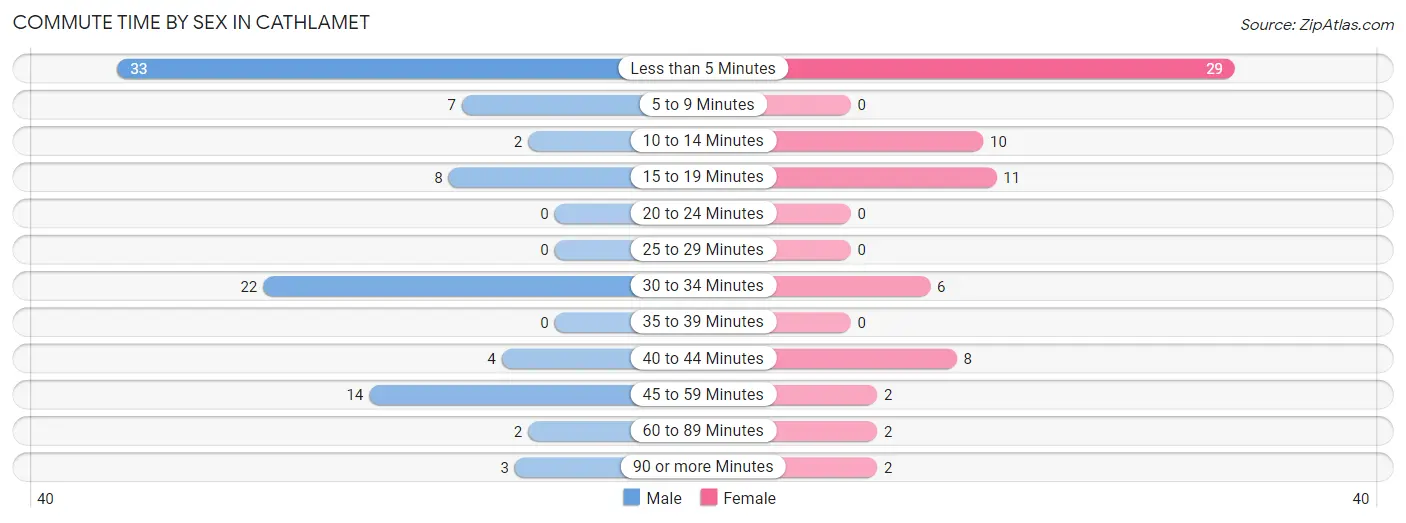
| Commute Time | Male | Female |
| Less than 5 Minutes | 33 (34.7%) | 29 (41.4%) |
| 5 to 9 Minutes | 7 (7.4%) | 0 (0.0%) |
| 10 to 14 Minutes | 2 (2.1%) | 10 (14.3%) |
| 15 to 19 Minutes | 8 (8.4%) | 11 (15.7%) |
| 20 to 24 Minutes | 0 (0.0%) | 0 (0.0%) |
| 25 to 29 Minutes | 0 (0.0%) | 0 (0.0%) |
| 30 to 34 Minutes | 22 (23.2%) | 6 (8.6%) |
| 35 to 39 Minutes | 0 (0.0%) | 0 (0.0%) |
| 40 to 44 Minutes | 4 (4.2%) | 8 (11.4%) |
| 45 to 59 Minutes | 14 (14.7%) | 2 (2.9%) |
| 60 to 89 Minutes | 2 (2.1%) | 2 (2.9%) |
| 90 or more Minutes | 3 (3.2%) | 2 (2.9%) |
Time of Departure to Work by Sex in Cathlamet
The most frequent times of departure to work in Cathlamet are 6:30 AM to 6:59 AM (21, 22.1%) for males and 7:00 AM to 7:29 AM (20, 28.6%) for females.
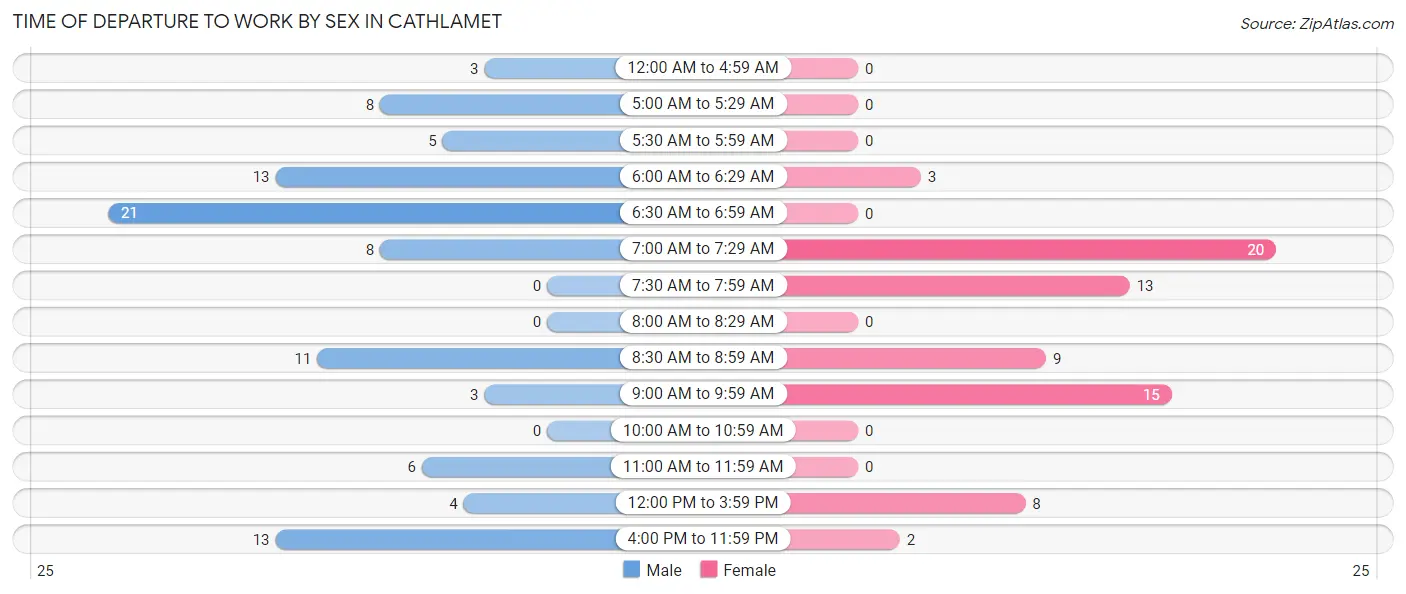
| Time of Departure | Male | Female |
| 12:00 AM to 4:59 AM | 3 (3.2%) | 0 (0.0%) |
| 5:00 AM to 5:29 AM | 8 (8.4%) | 0 (0.0%) |
| 5:30 AM to 5:59 AM | 5 (5.3%) | 0 (0.0%) |
| 6:00 AM to 6:29 AM | 13 (13.7%) | 3 (4.3%) |
| 6:30 AM to 6:59 AM | 21 (22.1%) | 0 (0.0%) |
| 7:00 AM to 7:29 AM | 8 (8.4%) | 20 (28.6%) |
| 7:30 AM to 7:59 AM | 0 (0.0%) | 13 (18.6%) |
| 8:00 AM to 8:29 AM | 0 (0.0%) | 0 (0.0%) |
| 8:30 AM to 8:59 AM | 11 (11.6%) | 9 (12.9%) |
| 9:00 AM to 9:59 AM | 3 (3.2%) | 15 (21.4%) |
| 10:00 AM to 10:59 AM | 0 (0.0%) | 0 (0.0%) |
| 11:00 AM to 11:59 AM | 6 (6.3%) | 0 (0.0%) |
| 12:00 PM to 3:59 PM | 4 (4.2%) | 8 (11.4%) |
| 4:00 PM to 11:59 PM | 13 (13.7%) | 2 (2.9%) |
| Total | 95 (100.0%) | 70 (100.0%) |
Housing Occupancy in Cathlamet
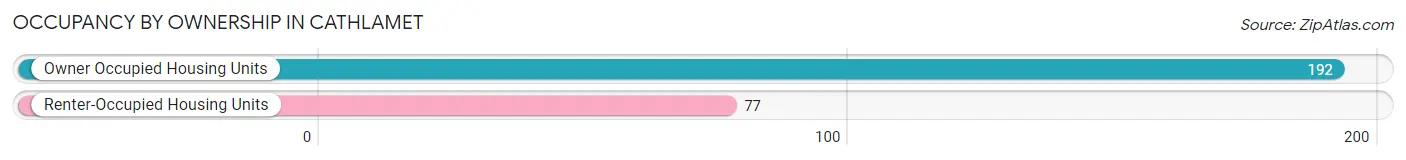
Occupancy by Ownership in Cathlamet
Of the total 269 dwellings in Cathlamet, owner-occupied units account for 192 (71.4%), while renter-occupied units make up 77 (28.6%).
| Occupancy | # Housing Units | % Housing Units |
| Owner Occupied Housing Units | 192 | 71.4% |
| Renter-Occupied Housing Units | 77 | 28.6% |
| Total Occupied Housing Units | 269 | 100.0% |
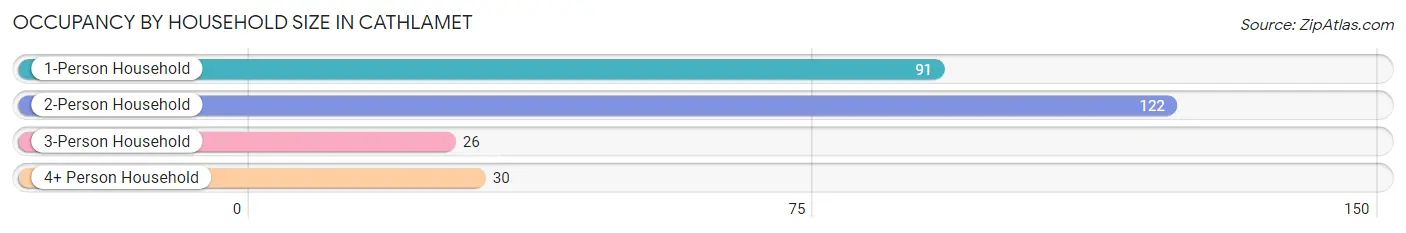
Occupancy by Household Size in Cathlamet
| Household Size | # Housing Units | % Housing Units |
| 1-Person Household | 91 | 33.8% |
| 2-Person Household | 122 | 45.4% |
| 3-Person Household | 26 | 9.7% |
| 4+ Person Household | 30 | 11.2% |
| Total Housing Units | 269 | 100.0% |
Occupancy by Ownership by Household Size in Cathlamet
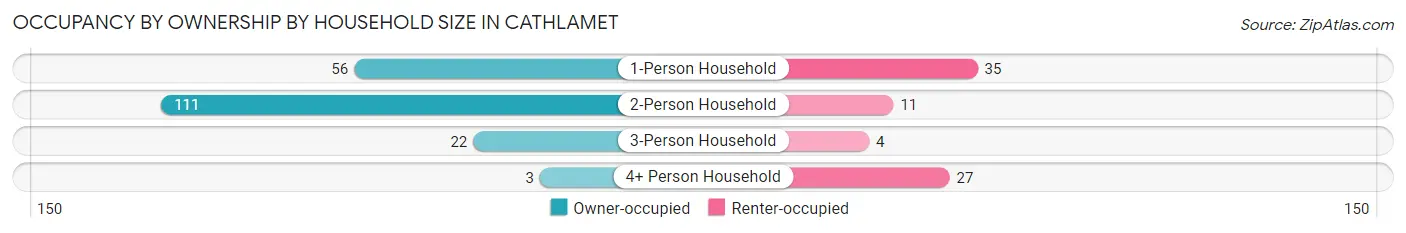
| Household Size | Owner-occupied | Renter-occupied |
| 1-Person Household | 56 (61.5%) | 35 (38.5%) |
| 2-Person Household | 111 (91.0%) | 11 (9.0%) |
| 3-Person Household | 22 (84.6%) | 4 (15.4%) |
| 4+ Person Household | 3 (10.0%) | 27 (90.0%) |
| Total Housing Units | 192 (71.4%) | 77 (28.6%) |
Occupancy by Educational Attainment in Cathlamet
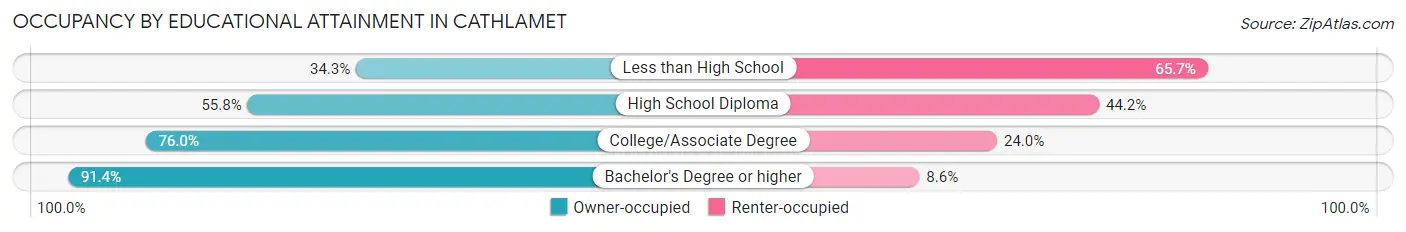
| Household Size | Owner-occupied | Renter-occupied |
| Less than High School | 12 (34.3%) | 23 (65.7%) |
| High School Diploma | 24 (55.8%) | 19 (44.2%) |
| College/Associate Degree | 92 (76.0%) | 29 (24.0%) |
| Bachelor's Degree or higher | 64 (91.4%) | 6 (8.6%) |
Occupancy by Age of Householder in Cathlamet
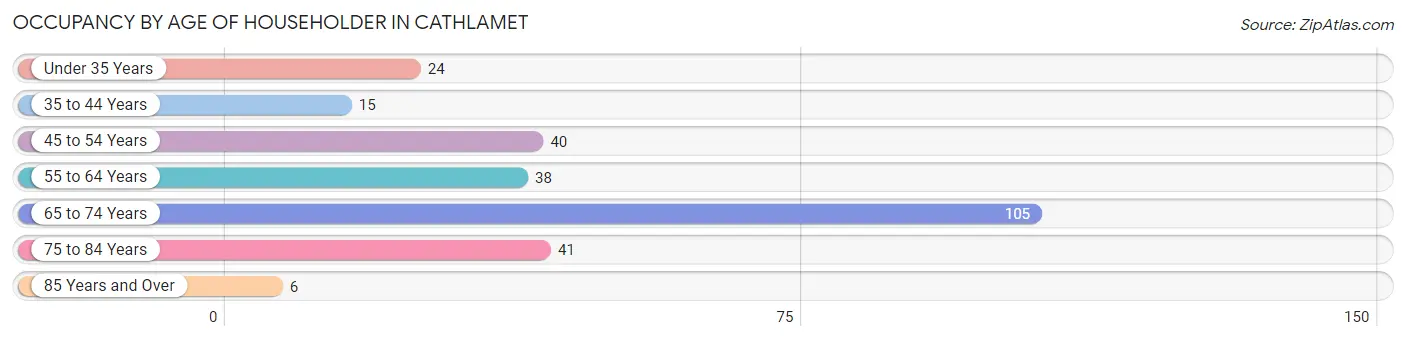
| Age Bracket | # Households | % Households |
| Under 35 Years | 24 | 8.9% |
| 35 to 44 Years | 15 | 5.6% |
| 45 to 54 Years | 40 | 14.9% |
| 55 to 64 Years | 38 | 14.1% |
| 65 to 74 Years | 105 | 39.0% |
| 75 to 84 Years | 41 | 15.2% |
| 85 Years and Over | 6 | 2.2% |
| Total | 269 | 100.0% |
Housing Finances in Cathlamet
Median Income by Occupancy in Cathlamet
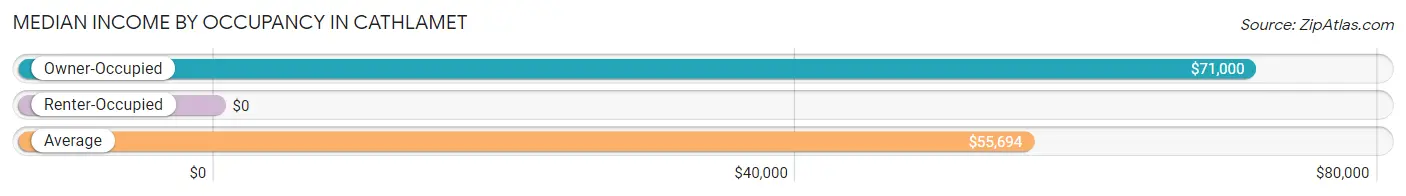
| Occupancy Type | # Households | Median Income |
| Owner-Occupied | 192 (71.4%) | $71,000 |
| Renter-Occupied | 77 (28.6%) | $0 |
| Average | 269 (100.0%) | $55,694 |
Occupancy by Householder Income Bracket in Cathlamet
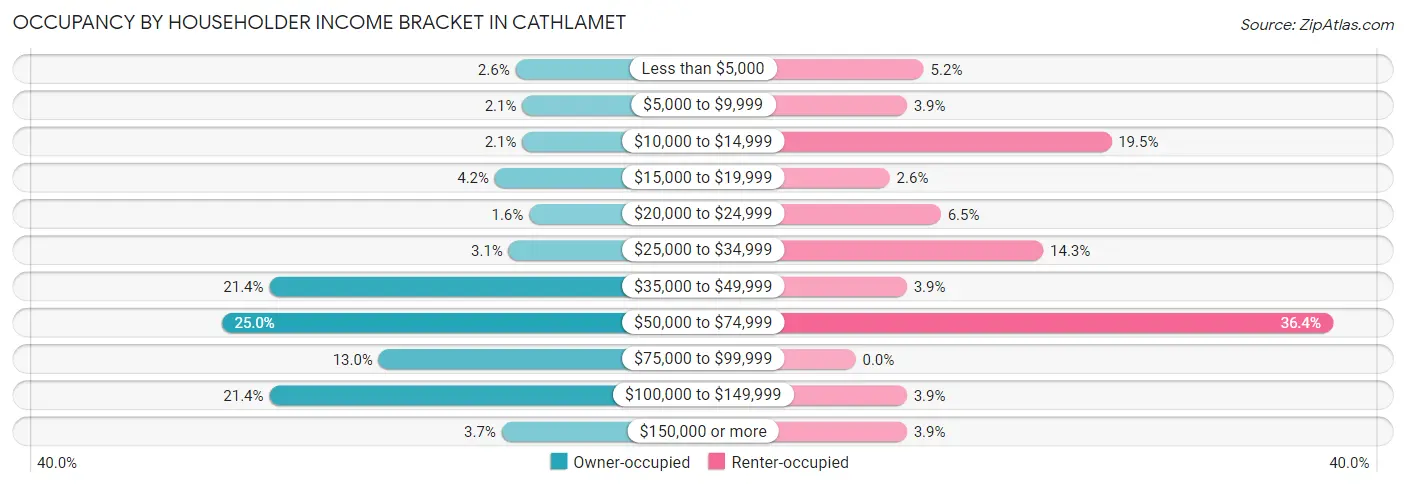
| Income Bracket | Owner-occupied | Renter-occupied |
| Less than $5,000 | 5 (2.6%) | 4 (5.2%) |
| $5,000 to $9,999 | 4 (2.1%) | 3 (3.9%) |
| $10,000 to $14,999 | 4 (2.1%) | 15 (19.5%) |
| $15,000 to $19,999 | 8 (4.2%) | 2 (2.6%) |
| $20,000 to $24,999 | 3 (1.6%) | 5 (6.5%) |
| $25,000 to $34,999 | 6 (3.1%) | 11 (14.3%) |
| $35,000 to $49,999 | 41 (21.3%) | 3 (3.9%) |
| $50,000 to $74,999 | 48 (25.0%) | 28 (36.4%) |
| $75,000 to $99,999 | 25 (13.0%) | 0 (0.0%) |
| $100,000 to $149,999 | 41 (21.3%) | 3 (3.9%) |
| $150,000 or more | 7 (3.6%) | 3 (3.9%) |
| Total | 192 (100.0%) | 77 (100.0%) |
Monthly Housing Cost Tiers in Cathlamet
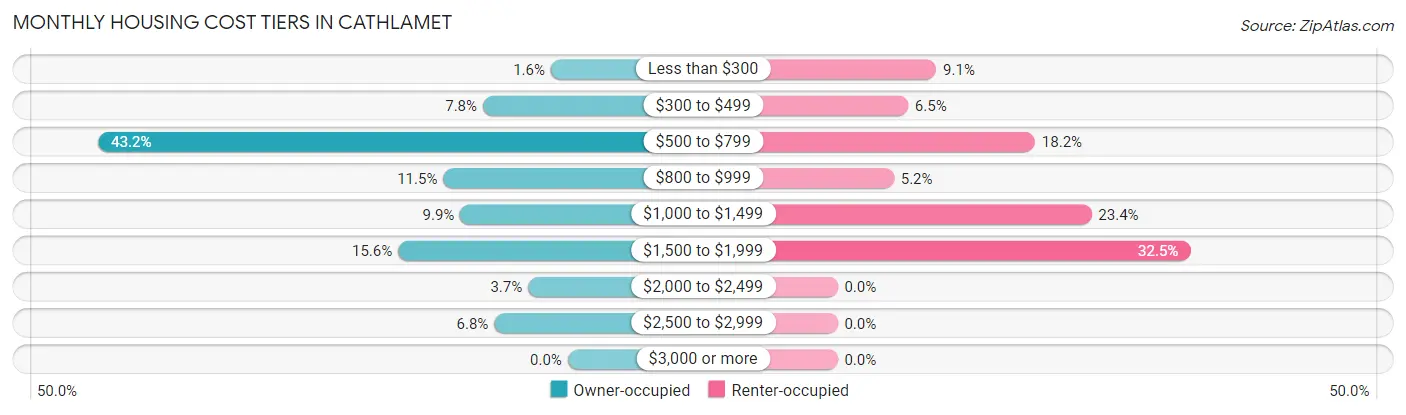
| Monthly Cost | Owner-occupied | Renter-occupied |
| Less than $300 | 3 (1.6%) | 7 (9.1%) |
| $300 to $499 | 15 (7.8%) | 5 (6.5%) |
| $500 to $799 | 83 (43.2%) | 14 (18.2%) |
| $800 to $999 | 22 (11.5%) | 4 (5.2%) |
| $1,000 to $1,499 | 19 (9.9%) | 18 (23.4%) |
| $1,500 to $1,999 | 30 (15.6%) | 25 (32.5%) |
| $2,000 to $2,499 | 7 (3.6%) | 0 (0.0%) |
| $2,500 to $2,999 | 13 (6.8%) | 0 (0.0%) |
| $3,000 or more | 0 (0.0%) | 0 (0.0%) |
| Total | 192 (100.0%) | 77 (100.0%) |
Physical Housing Characteristics in Cathlamet
Housing Structures in Cathlamet
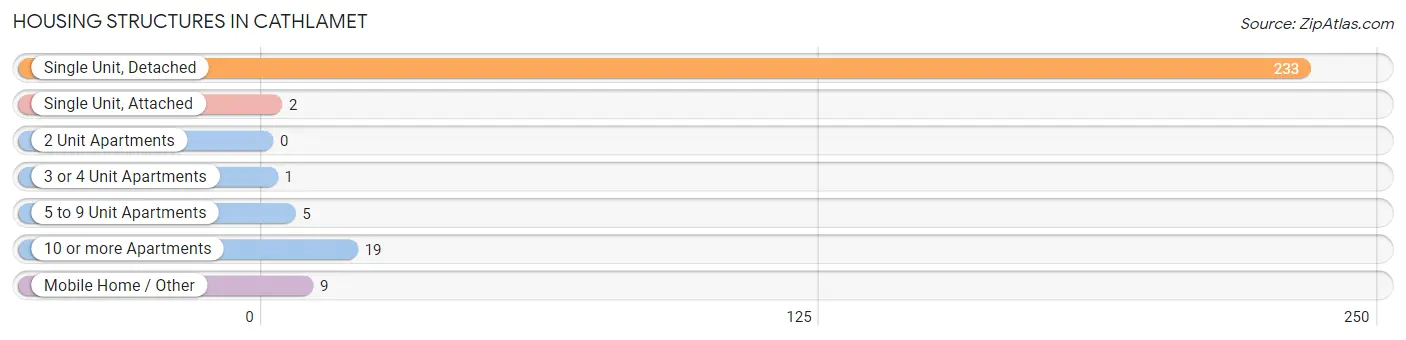
| Structure Type | # Housing Units | % Housing Units |
| Single Unit, Detached | 233 | 86.6% |
| Single Unit, Attached | 2 | 0.7% |
| 2 Unit Apartments | 0 | 0.0% |
| 3 or 4 Unit Apartments | 1 | 0.4% |
| 5 to 9 Unit Apartments | 5 | 1.9% |
| 10 or more Apartments | 19 | 7.1% |
| Mobile Home / Other | 9 | 3.4% |
| Total | 269 | 100.0% |
Housing Structures by Occupancy in Cathlamet
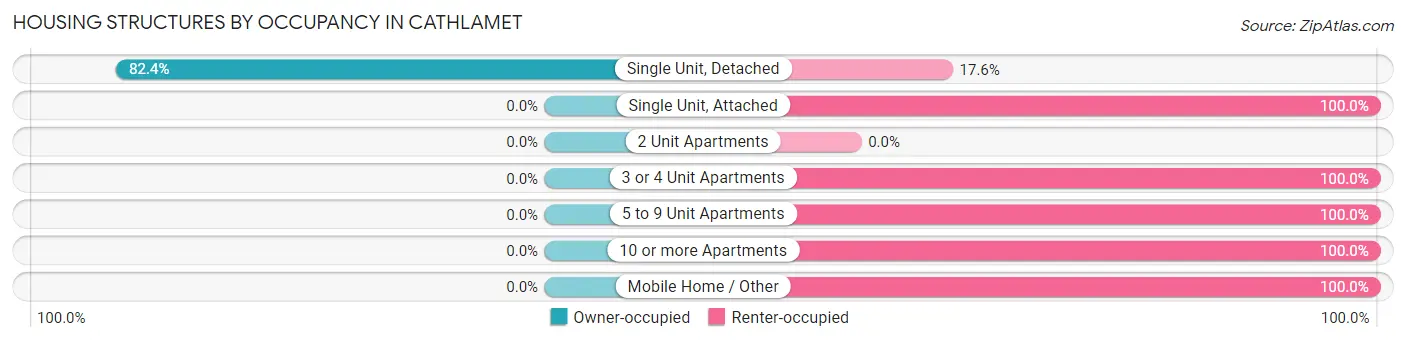
| Structure Type | Owner-occupied | Renter-occupied |
| Single Unit, Detached | 192 (82.4%) | 41 (17.6%) |
| Single Unit, Attached | 0 (0.0%) | 2 (100.0%) |
| 2 Unit Apartments | 0 (0.0%) | 0 (0.0%) |
| 3 or 4 Unit Apartments | 0 (0.0%) | 1 (100.0%) |
| 5 to 9 Unit Apartments | 0 (0.0%) | 5 (100.0%) |
| 10 or more Apartments | 0 (0.0%) | 19 (100.0%) |
| Mobile Home / Other | 0 (0.0%) | 9 (100.0%) |
| Total | 192 (71.4%) | 77 (28.6%) |
Housing Structures by Number of Rooms in Cathlamet
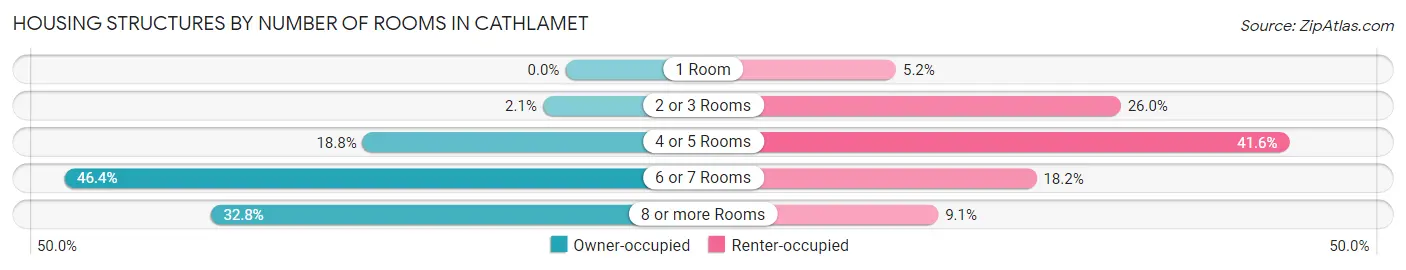
| Number of Rooms | Owner-occupied | Renter-occupied |
| 1 Room | 0 (0.0%) | 4 (5.2%) |
| 2 or 3 Rooms | 4 (2.1%) | 20 (26.0%) |
| 4 or 5 Rooms | 36 (18.8%) | 32 (41.6%) |
| 6 or 7 Rooms | 89 (46.4%) | 14 (18.2%) |
| 8 or more Rooms | 63 (32.8%) | 7 (9.1%) |
| Total | 192 (100.0%) | 77 (100.0%) |
Housing Structure by Heating Type in Cathlamet
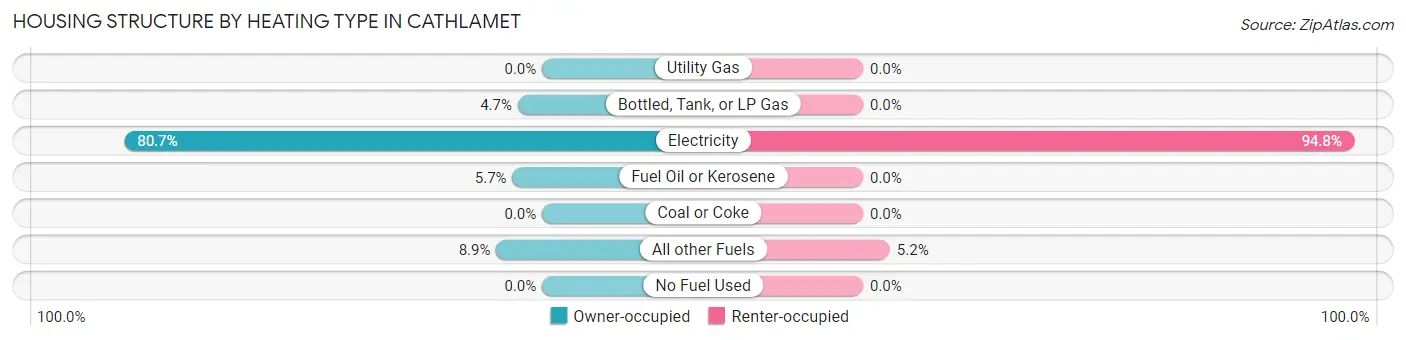
| Heating Type | Owner-occupied | Renter-occupied |
| Utility Gas | 0 (0.0%) | 0 (0.0%) |
| Bottled, Tank, or LP Gas | 9 (4.7%) | 0 (0.0%) |
| Electricity | 155 (80.7%) | 73 (94.8%) |
| Fuel Oil or Kerosene | 11 (5.7%) | 0 (0.0%) |
| Coal or Coke | 0 (0.0%) | 0 (0.0%) |
| All other Fuels | 17 (8.8%) | 4 (5.2%) |
| No Fuel Used | 0 (0.0%) | 0 (0.0%) |
| Total | 192 (100.0%) | 77 (100.0%) |
Household Vehicle Usage in Cathlamet
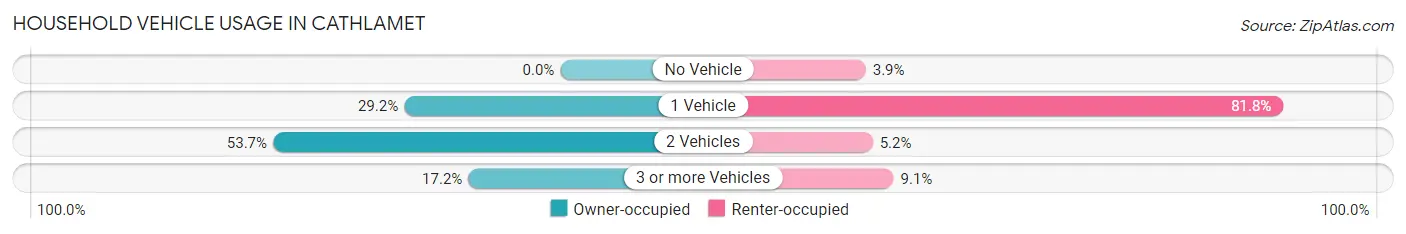
| Vehicles per Household | Owner-occupied | Renter-occupied |
| No Vehicle | 0 (0.0%) | 3 (3.9%) |
| 1 Vehicle | 56 (29.2%) | 63 (81.8%) |
| 2 Vehicles | 103 (53.6%) | 4 (5.2%) |
| 3 or more Vehicles | 33 (17.2%) | 7 (9.1%) |
| Total | 192 (100.0%) | 77 (100.0%) |
Real Estate & Mortgages in Cathlamet
Real Estate and Mortgage Overview in Cathlamet
| Characteristic | Without Mortgage | With Mortgage |
| Housing Units | 95 | 97 |
| Median Property Value | $382,700 | $270,300 |
| Median Household Income | $73,750 | $5 |
| Monthly Housing Costs | $637 | $0 |
| Real Estate Taxes | $2,671 | $0 |
Property Value by Mortgage Status in Cathlamet
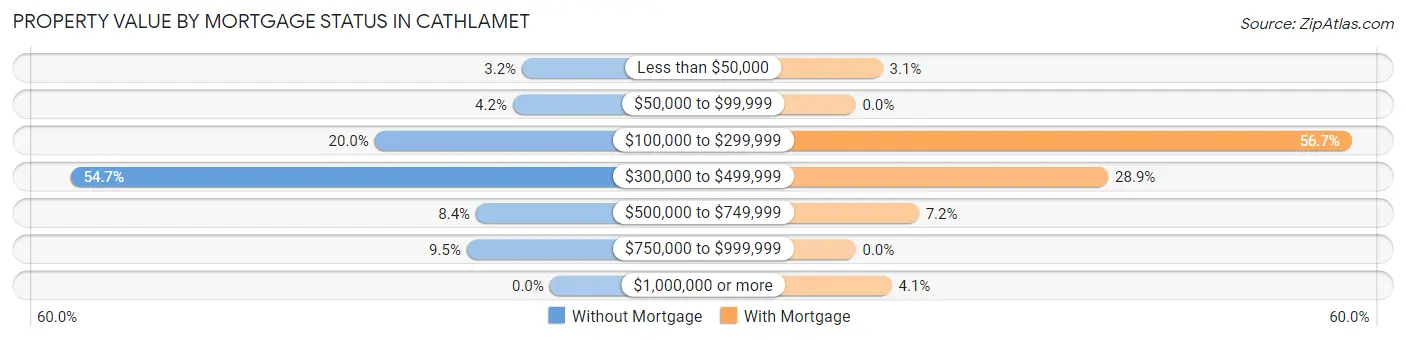
| Property Value | Without Mortgage | With Mortgage |
| Less than $50,000 | 3 (3.2%) | 3 (3.1%) |
| $50,000 to $99,999 | 4 (4.2%) | 0 (0.0%) |
| $100,000 to $299,999 | 19 (20.0%) | 55 (56.7%) |
| $300,000 to $499,999 | 52 (54.7%) | 28 (28.9%) |
| $500,000 to $749,999 | 8 (8.4%) | 7 (7.2%) |
| $750,000 to $999,999 | 9 (9.5%) | 0 (0.0%) |
| $1,000,000 or more | 0 (0.0%) | 4 (4.1%) |
| Total | 95 (100.0%) | 97 (100.0%) |
Household Income by Mortgage Status in Cathlamet
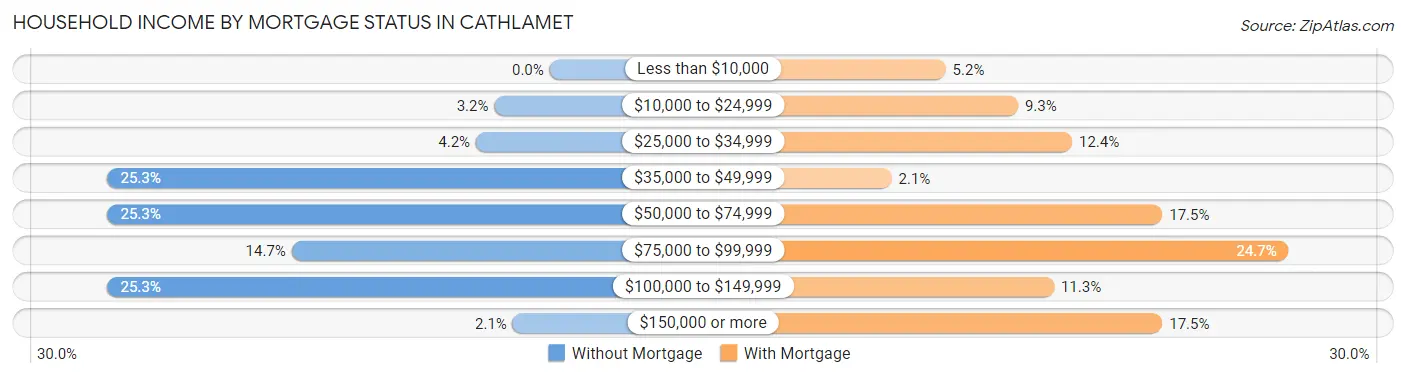
| Household Income | Without Mortgage | With Mortgage |
| Less than $10,000 | 0 (0.0%) | 5 (5.1%) |
| $10,000 to $24,999 | 3 (3.2%) | 9 (9.3%) |
| $25,000 to $34,999 | 4 (4.2%) | 12 (12.4%) |
| $35,000 to $49,999 | 24 (25.3%) | 2 (2.1%) |
| $50,000 to $74,999 | 24 (25.3%) | 17 (17.5%) |
| $75,000 to $99,999 | 14 (14.7%) | 24 (24.7%) |
| $100,000 to $149,999 | 24 (25.3%) | 11 (11.3%) |
| $150,000 or more | 2 (2.1%) | 17 (17.5%) |
| Total | 95 (100.0%) | 97 (100.0%) |
Property Value to Household Income Ratio in Cathlamet
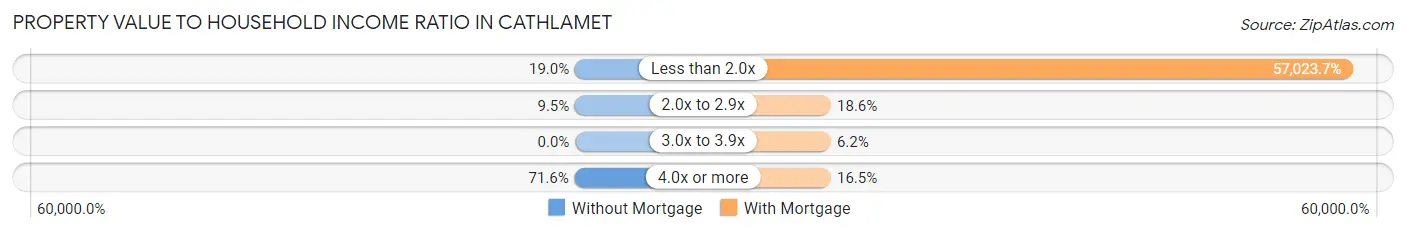
| Value-to-Income Ratio | Without Mortgage | With Mortgage |
| Less than 2.0x | 18 (19.0%) | 55,313 (57,023.7%) |
| 2.0x to 2.9x | 9 (9.5%) | 18 (18.6%) |
| 3.0x to 3.9x | 0 (0.0%) | 6 (6.2%) |
| 4.0x or more | 68 (71.6%) | 16 (16.5%) |
| Total | 95 (100.0%) | 97 (100.0%) |
Real Estate Taxes by Mortgage Status in Cathlamet
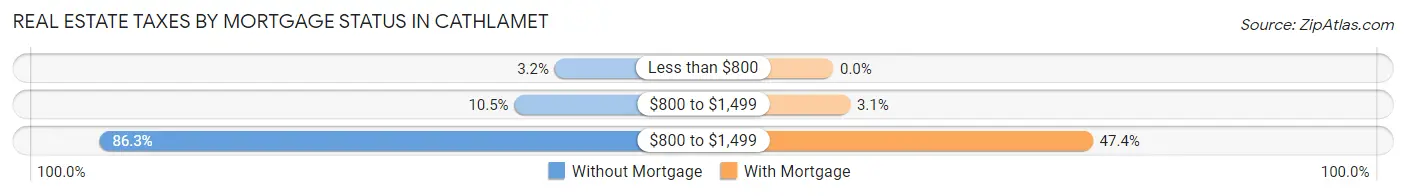
| Property Taxes | Without Mortgage | With Mortgage |
| Less than $800 | 3 (3.2%) | 0 (0.0%) |
| $800 to $1,499 | 10 (10.5%) | 3 (3.1%) |
| $800 to $1,499 | 82 (86.3%) | 46 (47.4%) |
| Total | 95 (100.0%) | 97 (100.0%) |
Health & Disability in Cathlamet
Health Insurance Coverage by Age in Cathlamet
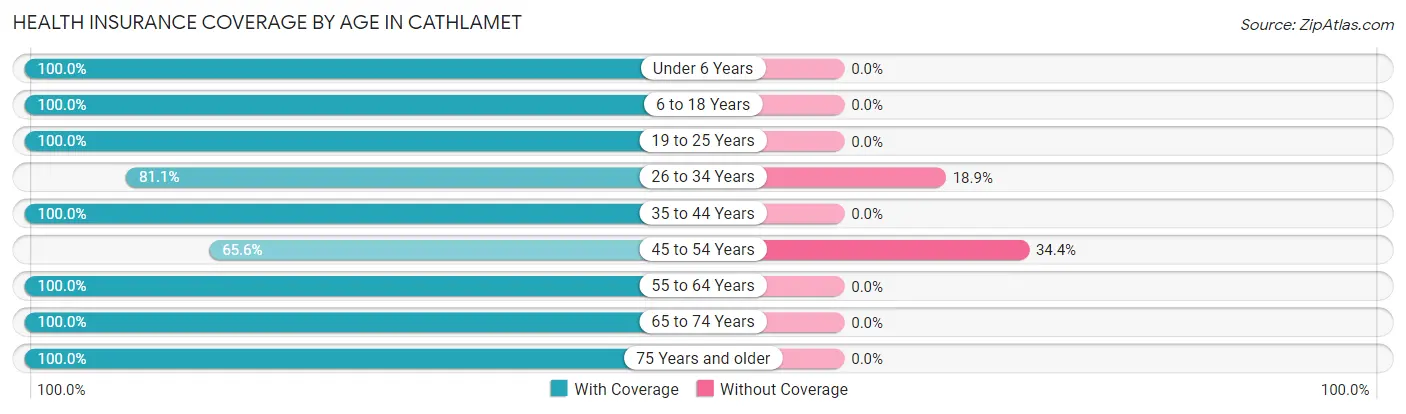
| Age Bracket | With Coverage | Without Coverage |
| Under 6 Years | 16 (100.0%) | 0 (0.0%) |
| 6 to 18 Years | 34 (100.0%) | 0 (0.0%) |
| 19 to 25 Years | 47 (100.0%) | 0 (0.0%) |
| 26 to 34 Years | 30 (81.1%) | 7 (18.9%) |
| 35 to 44 Years | 27 (100.0%) | 0 (0.0%) |
| 45 to 54 Years | 40 (65.6%) | 21 (34.4%) |
| 55 to 64 Years | 95 (100.0%) | 0 (0.0%) |
| 65 to 74 Years | 140 (100.0%) | 0 (0.0%) |
| 75 Years and older | 53 (100.0%) | 0 (0.0%) |
| Total | 482 (94.5%) | 28 (5.5%) |
Health Insurance Coverage by Citizenship Status in Cathlamet
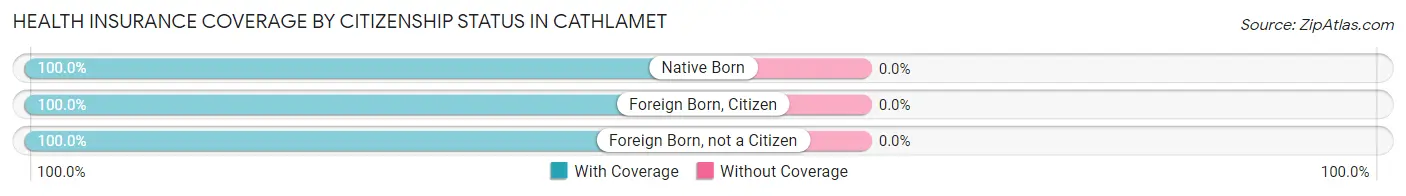
| Citizenship Status | With Coverage | Without Coverage |
| Native Born | 16 (100.0%) | 0 (0.0%) |
| Foreign Born, Citizen | 34 (100.0%) | 0 (0.0%) |
| Foreign Born, not a Citizen | 47 (100.0%) | 0 (0.0%) |
Health Insurance Coverage by Household Income in Cathlamet
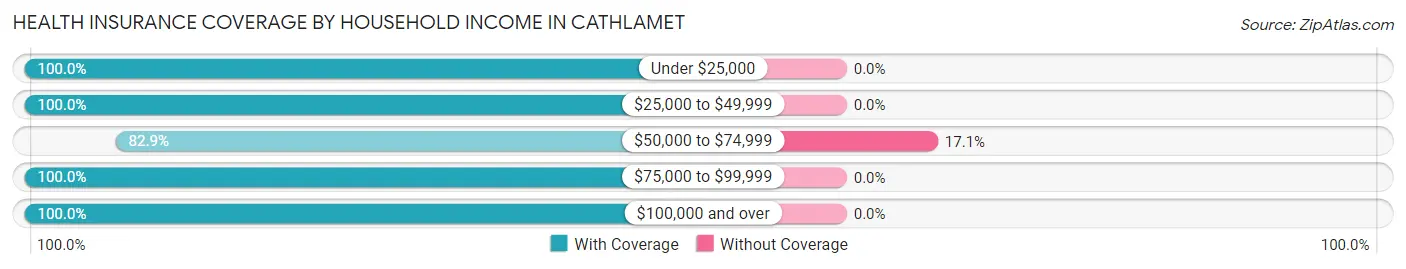
| Household Income | With Coverage | Without Coverage |
| Under $25,000 | 79 (100.0%) | 0 (0.0%) |
| $25,000 to $49,999 | 91 (100.0%) | 0 (0.0%) |
| $50,000 to $74,999 | 136 (82.9%) | 28 (17.1%) |
| $75,000 to $99,999 | 32 (100.0%) | 0 (0.0%) |
| $100,000 and over | 134 (100.0%) | 0 (0.0%) |
Public vs Private Health Insurance Coverage by Age in Cathlamet
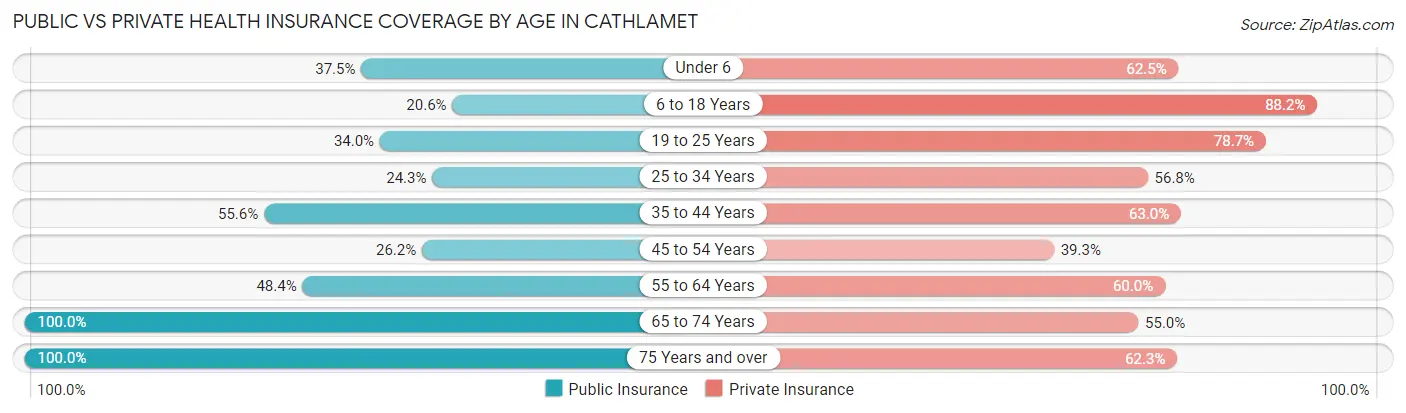
| Age Bracket | Public Insurance | Private Insurance |
| Under 6 | 6 (37.5%) | 10 (62.5%) |
| 6 to 18 Years | 7 (20.6%) | 30 (88.2%) |
| 19 to 25 Years | 16 (34.0%) | 37 (78.7%) |
| 25 to 34 Years | 9 (24.3%) | 21 (56.8%) |
| 35 to 44 Years | 15 (55.6%) | 17 (63.0%) |
| 45 to 54 Years | 16 (26.2%) | 24 (39.3%) |
| 55 to 64 Years | 46 (48.4%) | 57 (60.0%) |
| 65 to 74 Years | 140 (100.0%) | 77 (55.0%) |
| 75 Years and over | 53 (100.0%) | 33 (62.3%) |
| Total | 308 (60.4%) | 306 (60.0%) |
Disability Status by Sex by Age in Cathlamet
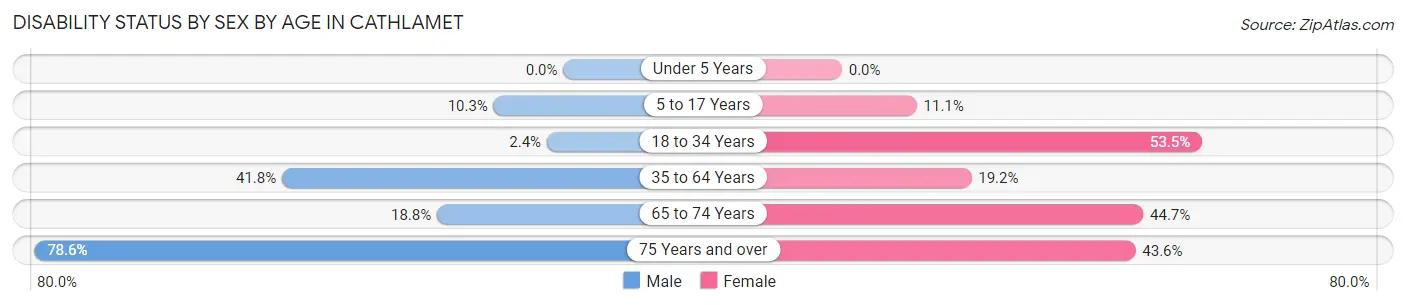
| Age Bracket | Male | Female |
| Under 5 Years | 0 (0.0%) | 0 (0.0%) |
| 5 to 17 Years | 3 (10.3%) | 1 (11.1%) |
| 18 to 34 Years | 1 (2.4%) | 23 (53.5%) |
| 35 to 64 Years | 33 (41.8%) | 20 (19.2%) |
| 65 to 74 Years | 12 (18.8%) | 34 (44.7%) |
| 75 Years and over | 11 (78.6%) | 17 (43.6%) |
Disability Class by Sex by Age in Cathlamet
Disability Class: Hearing Difficulty
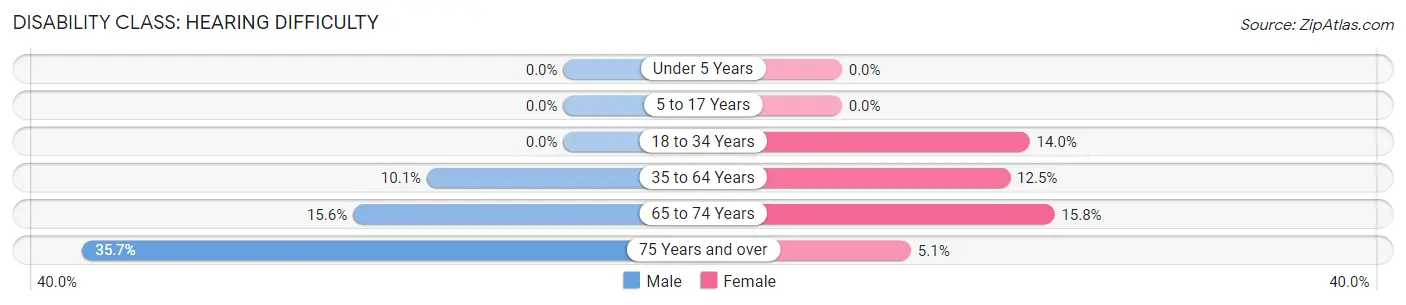
| Age Bracket | Male | Female |
| Under 5 Years | 0 (0.0%) | 0 (0.0%) |
| 5 to 17 Years | 0 (0.0%) | 0 (0.0%) |
| 18 to 34 Years | 0 (0.0%) | 6 (14.0%) |
| 35 to 64 Years | 8 (10.1%) | 13 (12.5%) |
| 65 to 74 Years | 10 (15.6%) | 12 (15.8%) |
| 75 Years and over | 5 (35.7%) | 2 (5.1%) |
Disability Class: Vision Difficulty
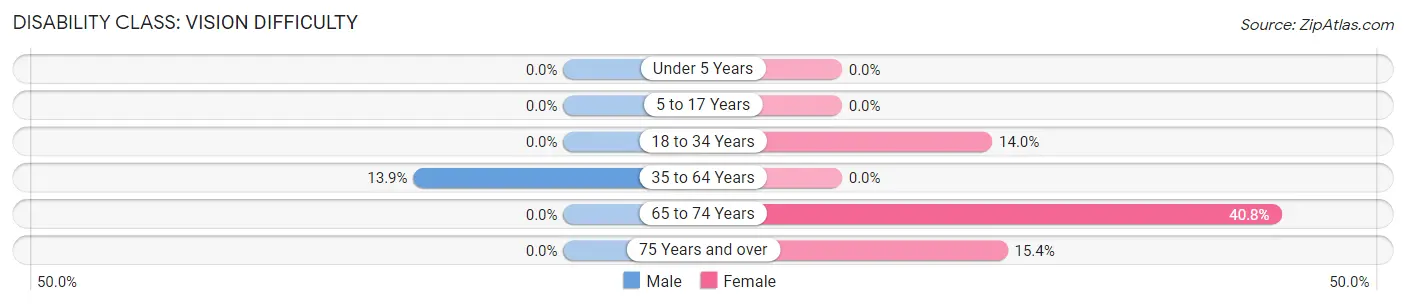
| Age Bracket | Male | Female |
| Under 5 Years | 0 (0.0%) | 0 (0.0%) |
| 5 to 17 Years | 0 (0.0%) | 0 (0.0%) |
| 18 to 34 Years | 0 (0.0%) | 6 (14.0%) |
| 35 to 64 Years | 11 (13.9%) | 0 (0.0%) |
| 65 to 74 Years | 0 (0.0%) | 31 (40.8%) |
| 75 Years and over | 0 (0.0%) | 6 (15.4%) |
Disability Class: Cognitive Difficulty
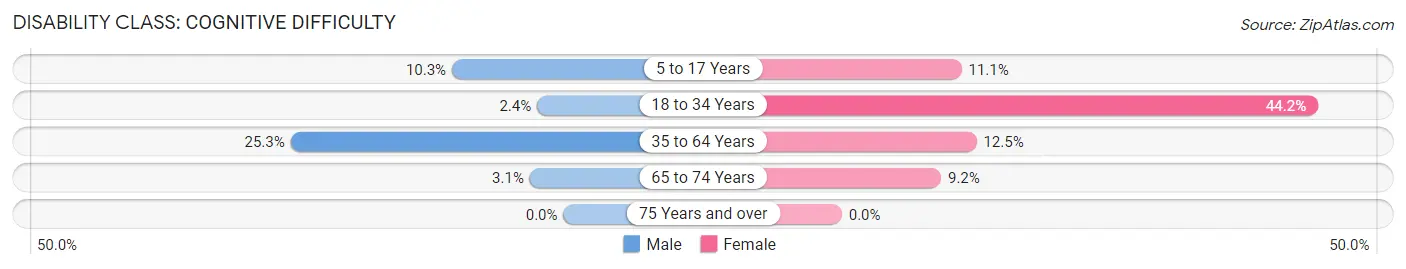
| Age Bracket | Male | Female |
| 5 to 17 Years | 3 (10.3%) | 1 (11.1%) |
| 18 to 34 Years | 1 (2.4%) | 19 (44.2%) |
| 35 to 64 Years | 20 (25.3%) | 13 (12.5%) |
| 65 to 74 Years | 2 (3.1%) | 7 (9.2%) |
| 75 Years and over | 0 (0.0%) | 0 (0.0%) |
Disability Class: Ambulatory Difficulty
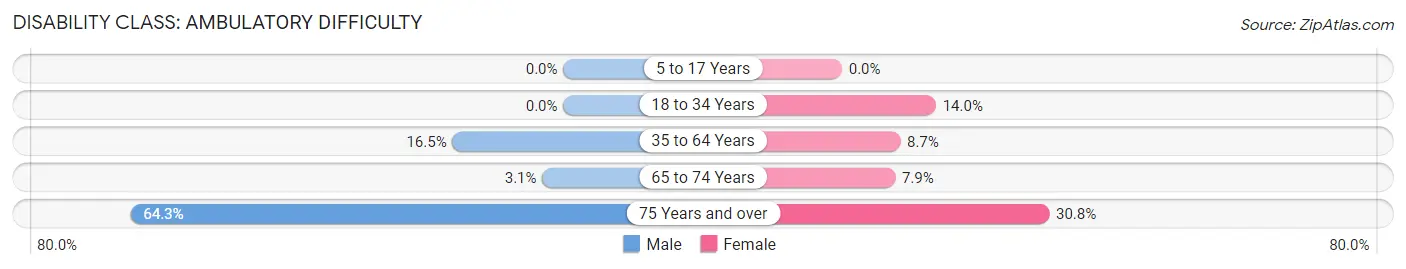
| Age Bracket | Male | Female |
| 5 to 17 Years | 0 (0.0%) | 0 (0.0%) |
| 18 to 34 Years | 0 (0.0%) | 6 (14.0%) |
| 35 to 64 Years | 13 (16.5%) | 9 (8.6%) |
| 65 to 74 Years | 2 (3.1%) | 6 (7.9%) |
| 75 Years and over | 9 (64.3%) | 12 (30.8%) |
Disability Class: Self-Care Difficulty
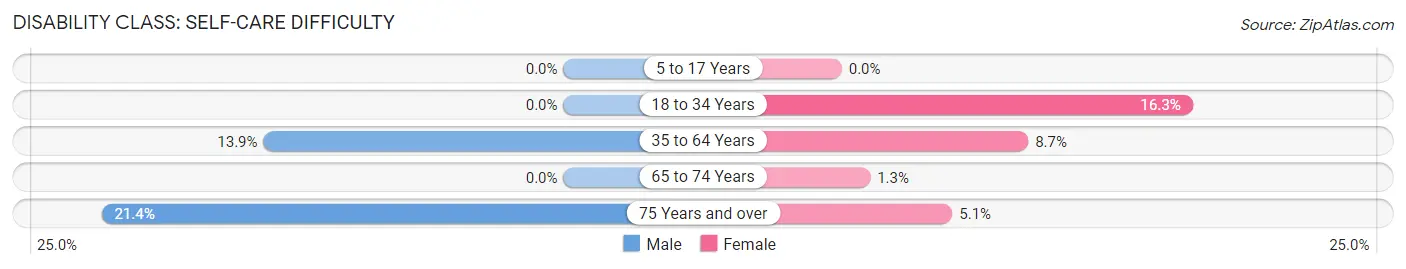
| Age Bracket | Male | Female |
| 5 to 17 Years | 0 (0.0%) | 0 (0.0%) |
| 18 to 34 Years | 0 (0.0%) | 7 (16.3%) |
| 35 to 64 Years | 11 (13.9%) | 9 (8.6%) |
| 65 to 74 Years | 0 (0.0%) | 1 (1.3%) |
| 75 Years and over | 3 (21.4%) | 2 (5.1%) |
Technology Access in Cathlamet
Computing Device Access in Cathlamet
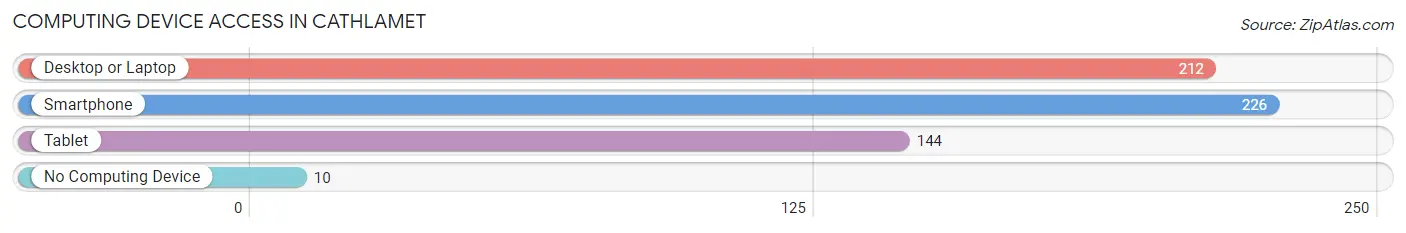
| Device Type | # Households | % Households |
| Desktop or Laptop | 212 | 78.8% |
| Smartphone | 226 | 84.0% |
| Tablet | 144 | 53.5% |
| No Computing Device | 10 | 3.7% |
| Total | 269 | 100.0% |
Internet Access in Cathlamet
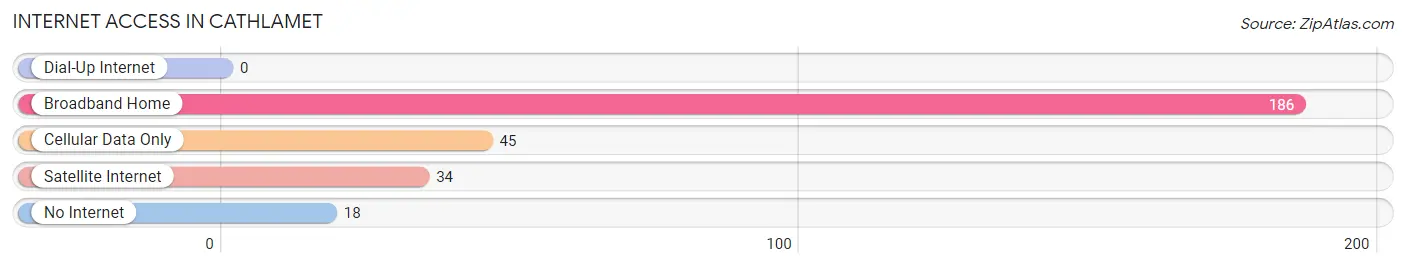
| Internet Type | # Households | % Households |
| Dial-Up Internet | 0 | 0.0% |
| Broadband Home | 186 | 69.1% |
| Cellular Data Only | 45 | 16.7% |
| Satellite Internet | 34 | 12.6% |
| No Internet | 18 | 6.7% |
| Total | 269 | 100.0% |
Cathlamet Summary
History
The area now known as Cathlamet, Washington was first inhabited by the Chinook people, who lived in the area for thousands of years before the arrival of Europeans. The Chinook people were a peaceful, fishing-based society that lived in longhouses along the Columbia River. They were known for their basket weaving and trading skills, and were an important part of the local economy.
The first Europeans to explore the area were the Spanish, who arrived in the late 1700s. They named the area “Cathlamet” after a local Chinook word meaning “place of many canoes.” The area was later explored by the British and Americans, who established a trading post in the area in 1811.
In 1851, the area was officially incorporated as the town of Cathlamet. The town quickly grew, and by the late 1800s it was a bustling port town with a population of over 1,000. The town was home to a variety of businesses, including a sawmill, a cannery, and a shipbuilding yard.
The town continued to grow throughout the early 1900s, and by the 1950s it had a population of over 2,000. The town was home to a variety of industries, including logging, fishing, and farming.
Geography
Cathlamet is located in Wahkiakum County, Washington, on the north bank of the Columbia River. The town is situated at the mouth of the Cathlamet River, which flows into the Columbia River. The town is surrounded by lush forests and rolling hills, and is home to a variety of wildlife, including deer, elk, and bald eagles.
The town is located approximately 50 miles north of Portland, Oregon, and is accessible by car via Highway 4. The nearest major airport is Portland International Airport, which is located approximately 90 miles away.
Economy
The economy of Cathlamet is largely based on tourism and fishing. The town is home to a variety of tourist attractions, including the Cathlamet Historical Museum, the Wahkiakum County Historical Society, and the Wahkiakum County Fairgrounds. The town is also home to a variety of fishing charters, which offer guided fishing trips on the Columbia River.
The town is also home to a variety of small businesses, including restaurants, shops, and galleries. The town is also home to a variety of manufacturing businesses, including a boat building company and a woodworking shop.
Demographics
As of the 2010 census, the population of Cathlamet was 1,876. The town is predominantly white, with approximately 90% of the population identifying as Caucasian. The town is also home to a small Hispanic population, with approximately 5% of the population identifying as Hispanic or Latino.
The median household income in Cathlamet is $41,250, and the median home value is $179,000. The town has a poverty rate of 16.3%, and the unemployment rate is 6.2%. The town is home to a variety of educational institutions, including Wahkiakum High School and Wahkiakum Middle School.
Common Questions
What is Per Capita Income in Cathlamet?
Per Capita income in Cathlamet is $34,059.
What is the Median Family Income in Cathlamet?
Median Family Income in Cathlamet is $56,429.
What is the Median Household income in Cathlamet?
Median Household Income in Cathlamet is $55,694.
What is Income or Wage Gap in Cathlamet?
Income or Wage Gap in Cathlamet is 11.5%.
Women in Cathlamet earn 88.5 cents for every dollar earned by a man.
What is Family Income Deficit in Cathlamet?
Family Income Deficit in Cathlamet is $8,573.
Families that are below poverty line in Cathlamet earn $8,573 less on average than the poverty threshold level.
What is Inequality or Gini Index in Cathlamet?
Inequality or Gini Index in Cathlamet is 0.39.
What is the Total Population of Cathlamet?
Total Population of Cathlamet is 546.
What is the Total Male Population of Cathlamet?
Total Male Population of Cathlamet is 246.
What is the Total Female Population of Cathlamet?
Total Female Population of Cathlamet is 300.
What is the Ratio of Males per 100 Females in Cathlamet?
There are 82.00 Males per 100 Females in Cathlamet.
What is the Ratio of Females per 100 Males in Cathlamet?
There are 121.95 Females per 100 Males in Cathlamet.
What is the Median Population Age in Cathlamet?
Median Population Age in Cathlamet is 59.4 Years.
What is the Average Family Size in Cathlamet
Average Family Size in Cathlamet is 2.3 People.
What is the Average Household Size in Cathlamet
Average Household Size in Cathlamet is 1.9 People.
How Large is the Labor Force in Cathlamet?
There are 182 People in the Labor Forcein in Cathlamet.
What is the Percentage of People in the Labor Force in Cathlamet?
35.8% of People are in the Labor Force in Cathlamet.
What is the Unemployment Rate in Cathlamet?
Unemployment Rate in Cathlamet is 2.2%.