Klickitat, WA Map & Demographics
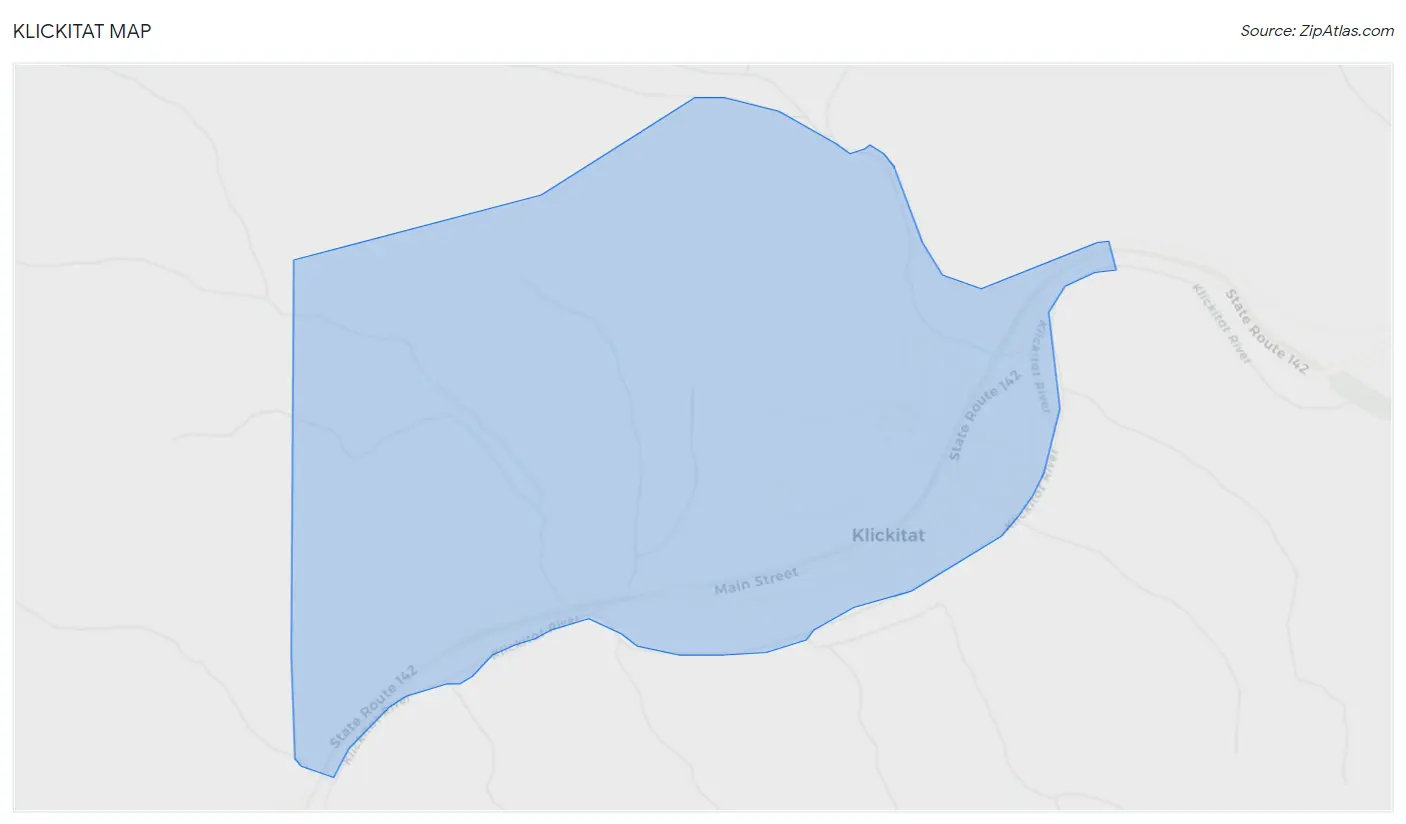
Klickitat Map
Klickitat Overview
$27,538
PER CAPITA INCOME
$61,964
AVG FAMILY INCOME
$60,893
AVG HOUSEHOLD INCOME
16.3%
WAGE / INCOME GAP [ % ]
83.7¢/ $1
WAGE / INCOME GAP [ $ ]
0.33
INEQUALITY / GINI INDEX
335
TOTAL POPULATION
143
MALE POPULATION
192
FEMALE POPULATION
74.48
MALES / 100 FEMALES
134.27
FEMALES / 100 MALES
50.7
MEDIAN AGE
2.8
AVG FAMILY SIZE
2.5
AVG HOUSEHOLD SIZE
144
LABOR FORCE [ PEOPLE ]
50.7%
PERCENT IN LABOR FORCE
12.5%
UNEMPLOYMENT RATE
Klickitat Zip Codes
Klickitat Area Codes
Income in Klickitat
Income Overview in Klickitat
Per Capita Income in Klickitat is $27,538, while median incomes of families and households are $61,964 and $60,893 respectively.
| Characteristic | Number | Measure |
| Per Capita Income | 335 | $27,538 |
| Median Family Income | 98 | $61,964 |
| Mean Family Income | 98 | $70,015 |
| Median Household Income | 132 | $60,893 |
| Mean Household Income | 132 | $62,991 |
| Income Deficit | 98 | $0 |
| Wage / Income Gap (%) | 335 | 16.29% |
| Wage / Income Gap ($) | 335 | 83.71¢ per $1 |
| Gini / Inequality Index | 335 | 0.33 |
Earnings by Sex in Klickitat
Average Earnings in Klickitat are $35,476, $37,083 for men and $31,042 for women, a difference of 16.3%.
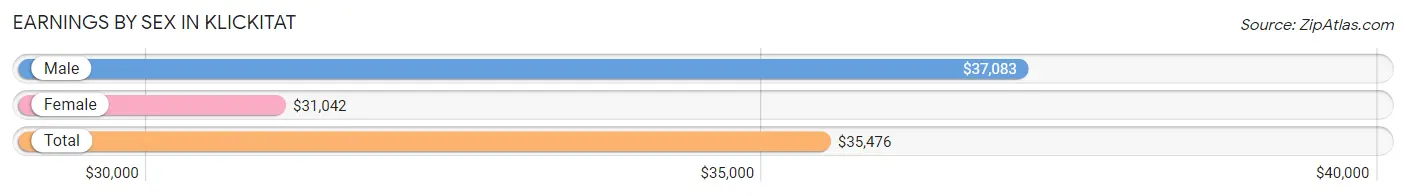
| Sex | Number | Average Earnings |
| Male | 63 (40.4%) | $37,083 |
| Female | 93 (59.6%) | $31,042 |
| Total | 156 (100.0%) | $35,476 |
Earnings by Sex by Income Bracket in Klickitat
The most common earnings brackets in Klickitat are $22,500 to $24,999 for men (18 | 28.6%) and $55,000 to $64,999 for women (13 | 14.0%).
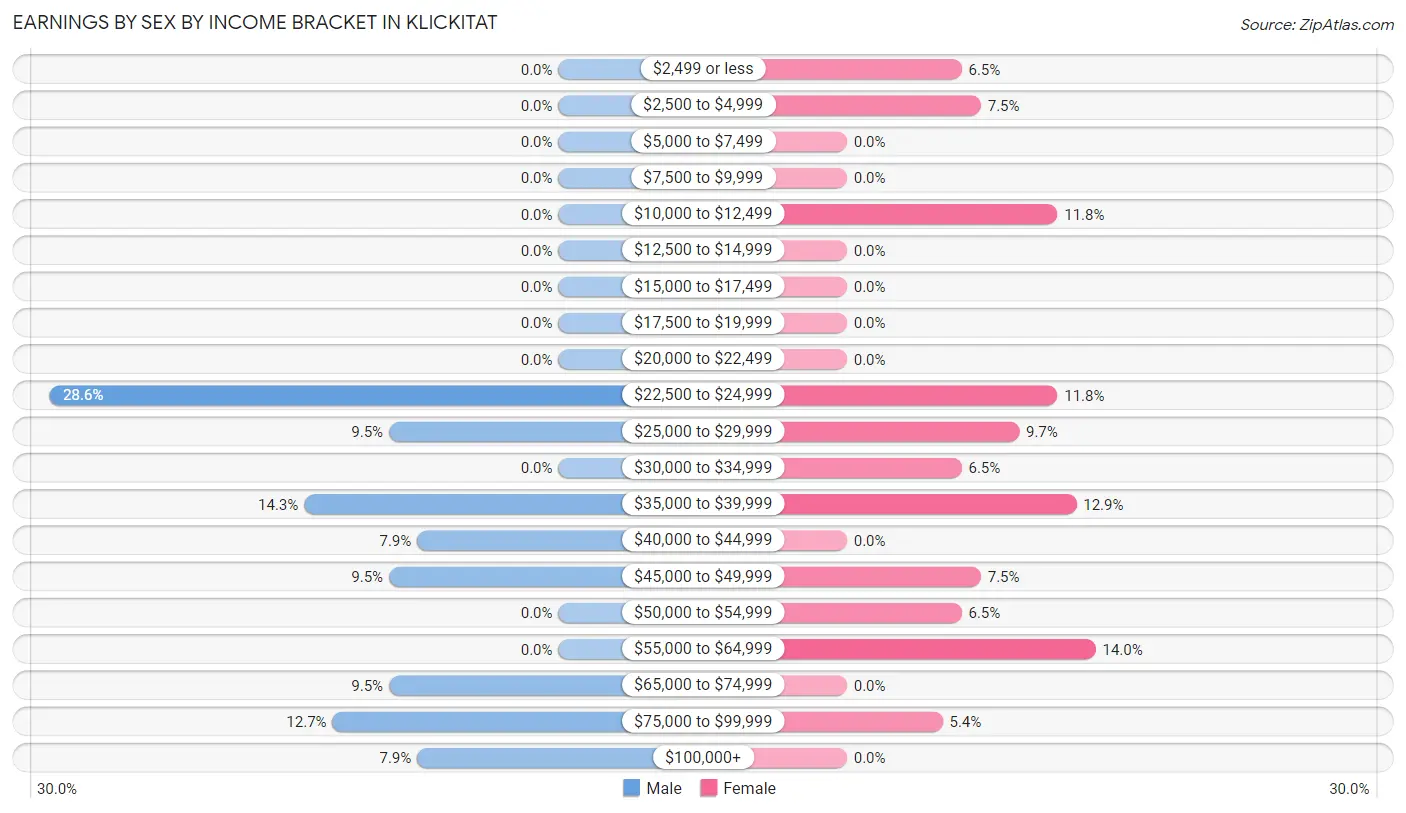
| Income | Male | Female |
| $2,499 or less | 0 (0.0%) | 6 (6.5%) |
| $2,500 to $4,999 | 0 (0.0%) | 7 (7.5%) |
| $5,000 to $7,499 | 0 (0.0%) | 0 (0.0%) |
| $7,500 to $9,999 | 0 (0.0%) | 0 (0.0%) |
| $10,000 to $12,499 | 0 (0.0%) | 11 (11.8%) |
| $12,500 to $14,999 | 0 (0.0%) | 0 (0.0%) |
| $15,000 to $17,499 | 0 (0.0%) | 0 (0.0%) |
| $17,500 to $19,999 | 0 (0.0%) | 0 (0.0%) |
| $20,000 to $22,499 | 0 (0.0%) | 0 (0.0%) |
| $22,500 to $24,999 | 18 (28.6%) | 11 (11.8%) |
| $25,000 to $29,999 | 6 (9.5%) | 9 (9.7%) |
| $30,000 to $34,999 | 0 (0.0%) | 6 (6.5%) |
| $35,000 to $39,999 | 9 (14.3%) | 12 (12.9%) |
| $40,000 to $44,999 | 5 (7.9%) | 0 (0.0%) |
| $45,000 to $49,999 | 6 (9.5%) | 7 (7.5%) |
| $50,000 to $54,999 | 0 (0.0%) | 6 (6.5%) |
| $55,000 to $64,999 | 0 (0.0%) | 13 (14.0%) |
| $65,000 to $74,999 | 6 (9.5%) | 0 (0.0%) |
| $75,000 to $99,999 | 8 (12.7%) | 5 (5.4%) |
| $100,000+ | 5 (7.9%) | 0 (0.0%) |
| Total | 63 (100.0%) | 93 (100.0%) |
Earnings by Sex by Educational Attainment in Klickitat
Average earnings in Klickitat are $37,083 for men and $31,042 for women, a difference of 16.3%. Men with an educational attainment of high school diploma enjoy the highest average annual earnings of $36,111, while those with high school diploma education earn the least with $36,111. Women with an educational attainment of college or associate's degree earn the most with the average annual earnings of $31,458, while those with high school diploma education have the smallest earnings of $27,813.
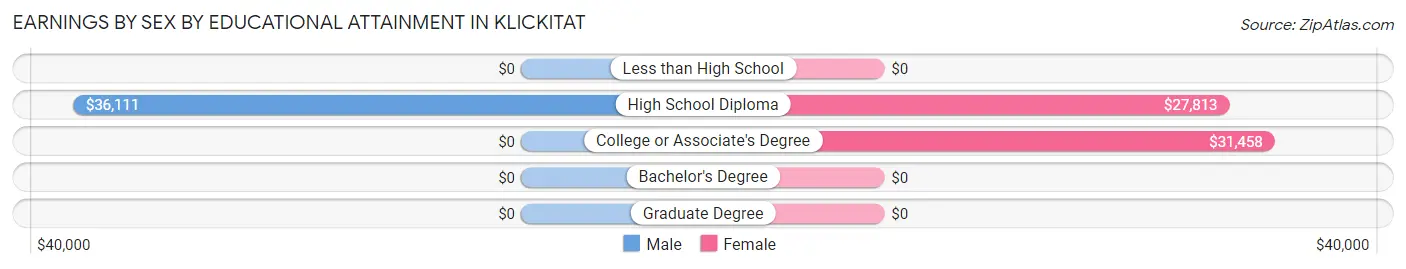
| Educational Attainment | Male Income | Female Income |
| Less than High School | - | - |
| High School Diploma | $36,111 | $27,813 |
| College or Associate's Degree | - | - |
| Bachelor's Degree | - | - |
| Graduate Degree | - | - |
| Total | $37,083 | $31,042 |
Family Income in Klickitat
Family Income Brackets in Klickitat
According to the Klickitat family income data, there are 36 families falling into the $100,000 to $149,999 income range, which is the most common income bracket and makes up 36.7% of all families.
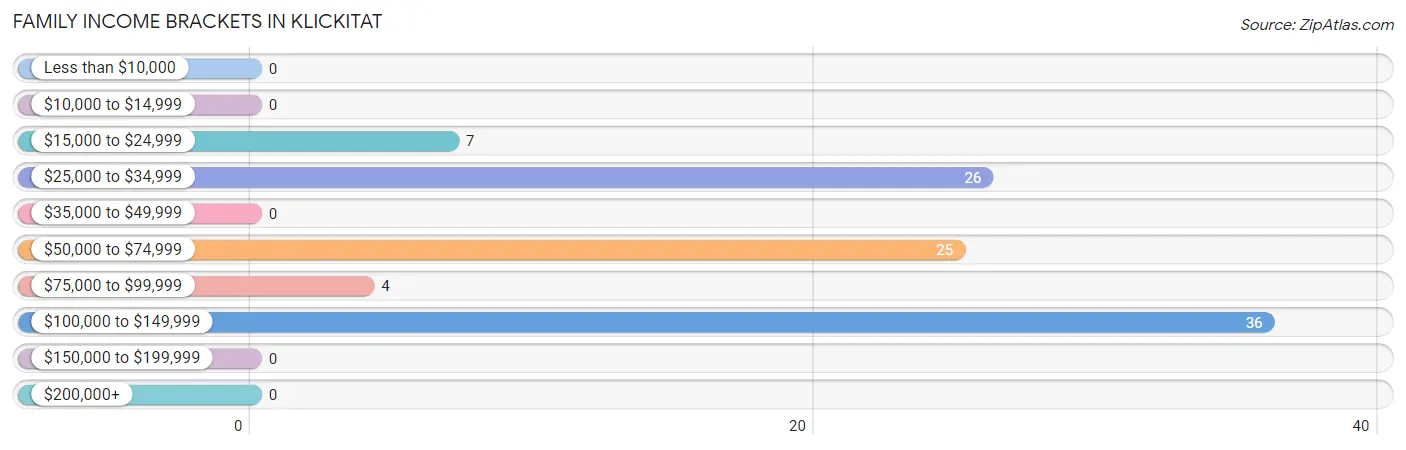
| Income Bracket | # Families | % Families |
| Less than $10,000 | 0 | 0.0% |
| $10,000 to $14,999 | 0 | 0.0% |
| $15,000 to $24,999 | 7 | 7.1% |
| $25,000 to $34,999 | 26 | 26.5% |
| $35,000 to $49,999 | 0 | 0.0% |
| $50,000 to $74,999 | 25 | 25.5% |
| $75,000 to $99,999 | 4 | 4.1% |
| $100,000 to $149,999 | 36 | 36.7% |
| $150,000 to $199,999 | 0 | 0.0% |
| $200,000+ | 0 | 0.0% |
Family Income by Famaliy Size in Klickitat
2-person families (77 | 78.6%) account for the highest median family income in Klickitat with $60,089 per family, while 2-person families (77 | 78.6%) have the highest median income of $30,044 per family member.
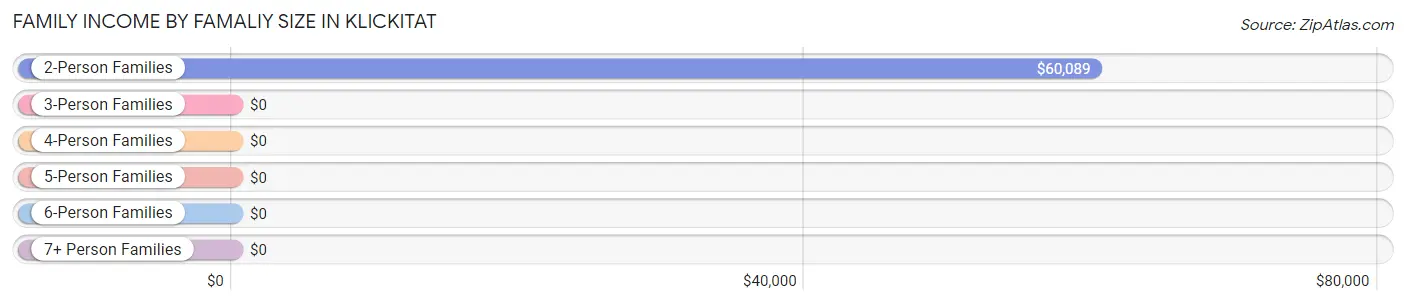
| Income Bracket | # Families | Median Income |
| 2-Person Families | 77 (78.6%) | $60,089 |
| 3-Person Families | 6 (6.1%) | $0 |
| 4-Person Families | 10 (10.2%) | $0 |
| 5-Person Families | 0 (0.0%) | $0 |
| 6-Person Families | 0 (0.0%) | $0 |
| 7+ Person Families | 5 (5.1%) | $0 |
| Total | 98 (100.0%) | $61,964 |
Family Income by Number of Earners in Klickitat
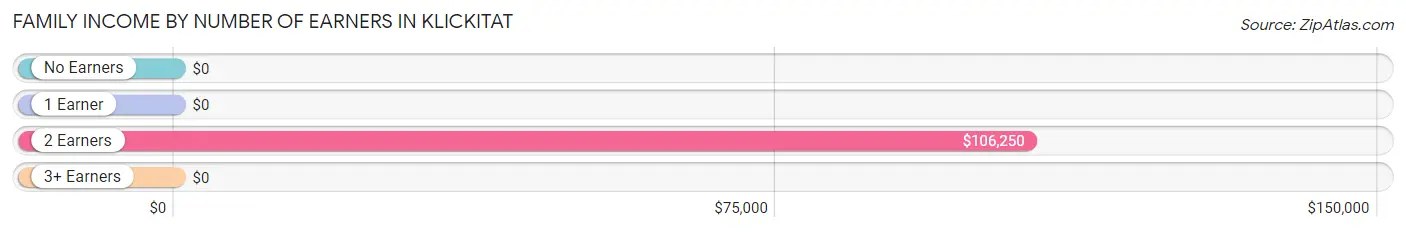
| Number of Earners | # Families | Median Income |
| No Earners | 26 (26.5%) | $0 |
| 1 Earner | 47 (48.0%) | $0 |
| 2 Earners | 25 (25.5%) | $106,250 |
| 3+ Earners | 0 (0.0%) | $0 |
| Total | 98 (100.0%) | $61,964 |
Household Income in Klickitat
Household Income Brackets in Klickitat
With 41 households falling in the category, the $50,000 to $74,999 income range is the most frequent in Klickitat, accounting for 31.1% of all households.
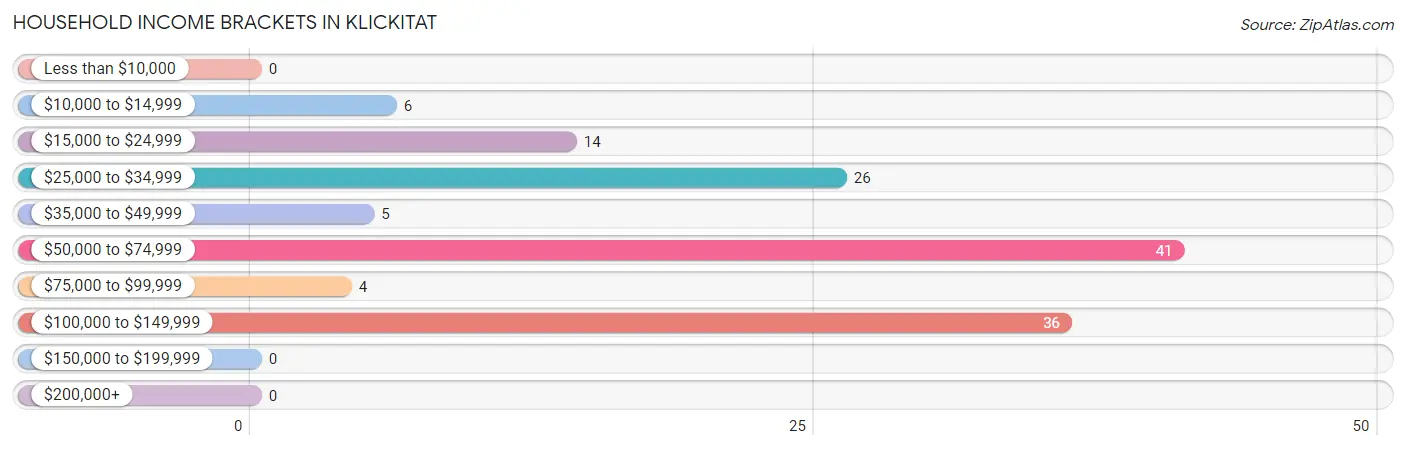
| Income Bracket | # Households | % Households |
| Less than $10,000 | 0 | 0.0% |
| $10,000 to $14,999 | 6 | 4.5% |
| $15,000 to $24,999 | 14 | 10.6% |
| $25,000 to $34,999 | 26 | 19.7% |
| $35,000 to $49,999 | 5 | 3.8% |
| $50,000 to $74,999 | 41 | 31.1% |
| $75,000 to $99,999 | 4 | 3.0% |
| $100,000 to $149,999 | 36 | 27.3% |
| $150,000 to $199,999 | 0 | 0.0% |
| $200,000+ | 0 | 0.0% |
Household Income by Householder Age in Klickitat
The median household income in Klickitat is $60,893, with the highest median household income of $67,212 found in the 25 to 44 years age bracket for the primary householder. A total of 33 households (25.0%) fall into this category.
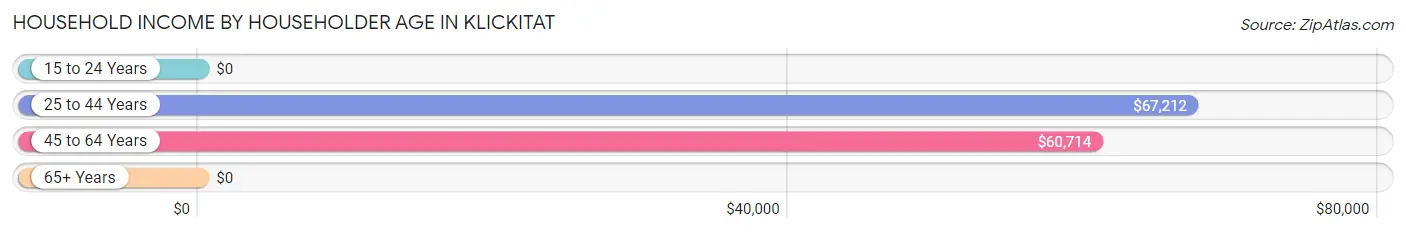
| Income Bracket | # Households | Median Income |
| 15 to 24 Years | 0 (0.0%) | $0 |
| 25 to 44 Years | 33 (25.0%) | $67,212 |
| 45 to 64 Years | 46 (34.8%) | $60,714 |
| 65+ Years | 53 (40.2%) | $0 |
| Total | 132 (100.0%) | $60,893 |
Poverty in Klickitat
Income Below Poverty by Sex and Age in Klickitat
With 4.9% poverty level for males and 6.2% for females among the residents of Klickitat, 55 to 64 year old males and 55 to 64 year old females are the most vulnerable to poverty, with 7 males (17.9%) and 6 females (21.4%) in their respective age groups living below the poverty level.
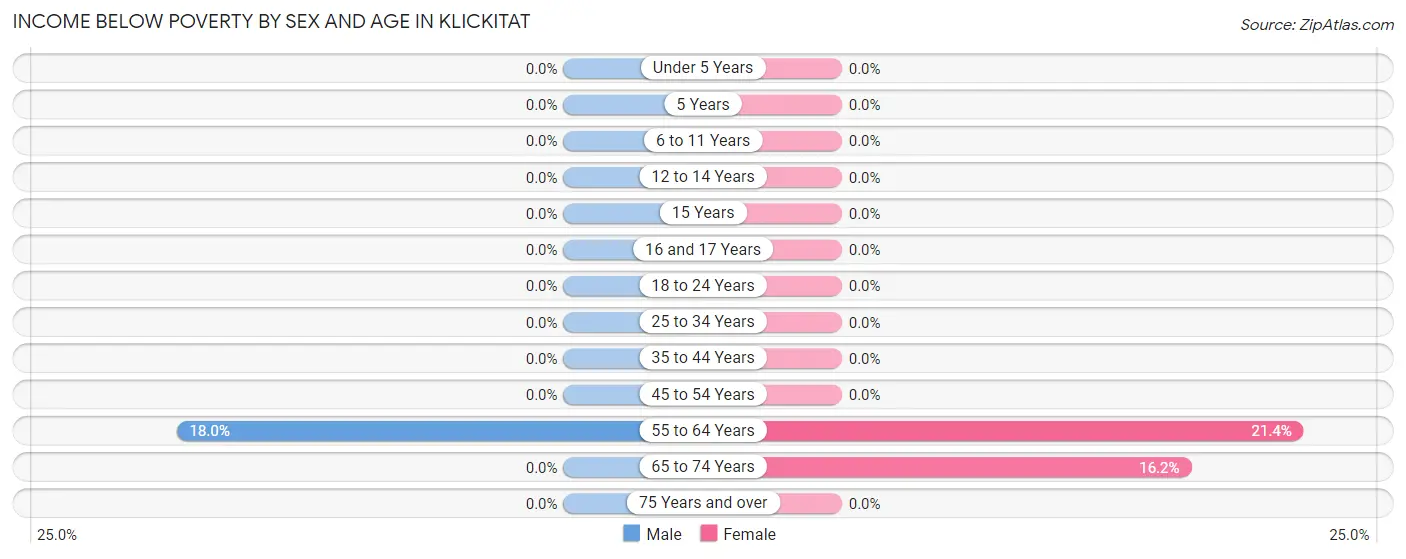
| Age Bracket | Male | Female |
| Under 5 Years | 0 (0.0%) | 0 (0.0%) |
| 5 Years | 0 (0.0%) | 0 (0.0%) |
| 6 to 11 Years | 0 (0.0%) | 0 (0.0%) |
| 12 to 14 Years | 0 (0.0%) | 0 (0.0%) |
| 15 Years | 0 (0.0%) | 0 (0.0%) |
| 16 and 17 Years | 0 (0.0%) | 0 (0.0%) |
| 18 to 24 Years | 0 (0.0%) | 0 (0.0%) |
| 25 to 34 Years | 0 (0.0%) | 0 (0.0%) |
| 35 to 44 Years | 0 (0.0%) | 0 (0.0%) |
| 45 to 54 Years | 0 (0.0%) | 0 (0.0%) |
| 55 to 64 Years | 7 (17.9%) | 6 (21.4%) |
| 65 to 74 Years | 0 (0.0%) | 6 (16.2%) |
| 75 Years and over | 0 (0.0%) | 0 (0.0%) |
| Total | 7 (4.9%) | 12 (6.2%) |
Income Above Poverty by Sex and Age in Klickitat
According to the poverty statistics in Klickitat, males aged under 5 years and females aged under 5 years are the age groups that are most secure financially, with 100.0% of males and 100.0% of females in these age groups living above the poverty line.
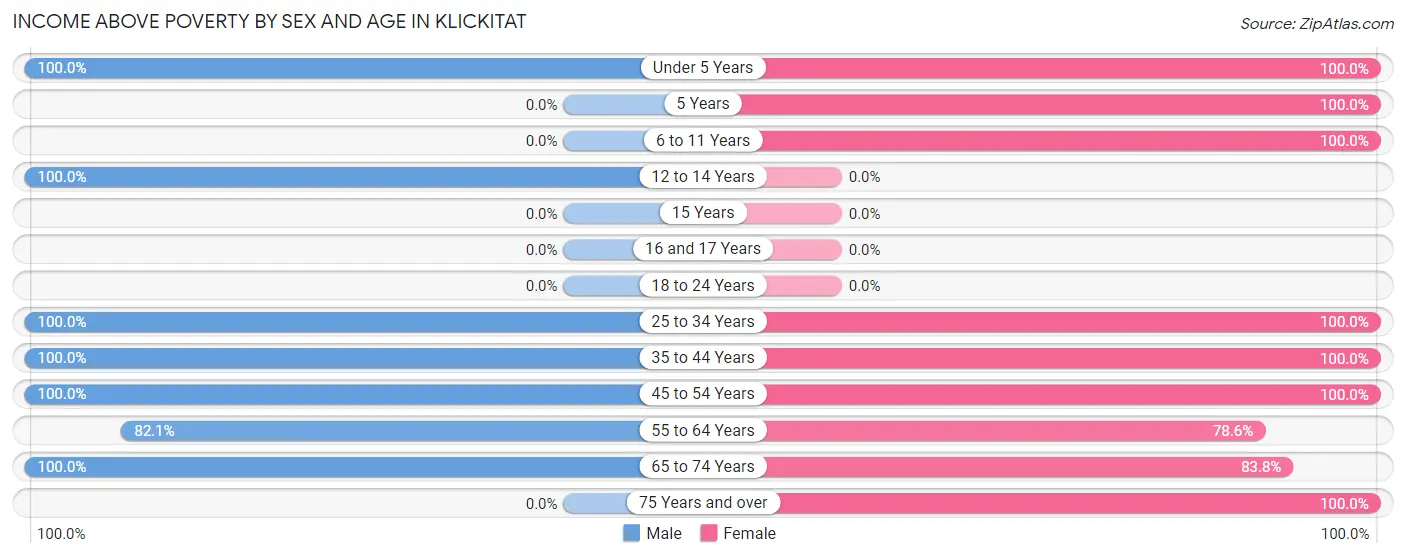
| Age Bracket | Male | Female |
| Under 5 Years | 5 (100.0%) | 8 (100.0%) |
| 5 Years | 0 (0.0%) | 5 (100.0%) |
| 6 to 11 Years | 0 (0.0%) | 22 (100.0%) |
| 12 to 14 Years | 11 (100.0%) | 0 (0.0%) |
| 15 Years | 0 (0.0%) | 0 (0.0%) |
| 16 and 17 Years | 0 (0.0%) | 0 (0.0%) |
| 18 to 24 Years | 0 (0.0%) | 0 (0.0%) |
| 25 to 34 Years | 19 (100.0%) | 44 (100.0%) |
| 35 to 44 Years | 26 (100.0%) | 11 (100.0%) |
| 45 to 54 Years | 27 (100.0%) | 11 (100.0%) |
| 55 to 64 Years | 32 (82.1%) | 22 (78.6%) |
| 65 to 74 Years | 16 (100.0%) | 31 (83.8%) |
| 75 Years and over | 0 (0.0%) | 26 (100.0%) |
| Total | 136 (95.1%) | 180 (93.8%) |
Income Below Poverty Among Married-Couple Families in Klickitat
The poverty statistics for married-couple families in Klickitat show that 9.6% or 7 of the total 73 families live below the poverty line. Families with no children have the highest poverty rate of 12.5%, comprising of 7 families. On the other hand, families with 1 or 2 children have the lowest poverty rate of 0.0%, which includes 0 families.
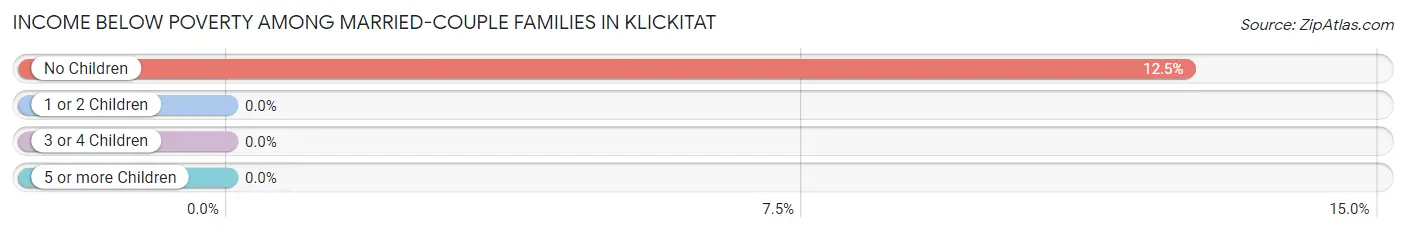
| Children | Above Poverty | Below Poverty |
| No Children | 49 (87.5%) | 7 (12.5%) |
| 1 or 2 Children | 12 (100.0%) | 0 (0.0%) |
| 3 or 4 Children | 0 (0.0%) | 0 (0.0%) |
| 5 or more Children | 5 (100.0%) | 0 (0.0%) |
| Total | 66 (90.4%) | 7 (9.6%) |
Income Below Poverty Among Single-Parent Households in Klickitat
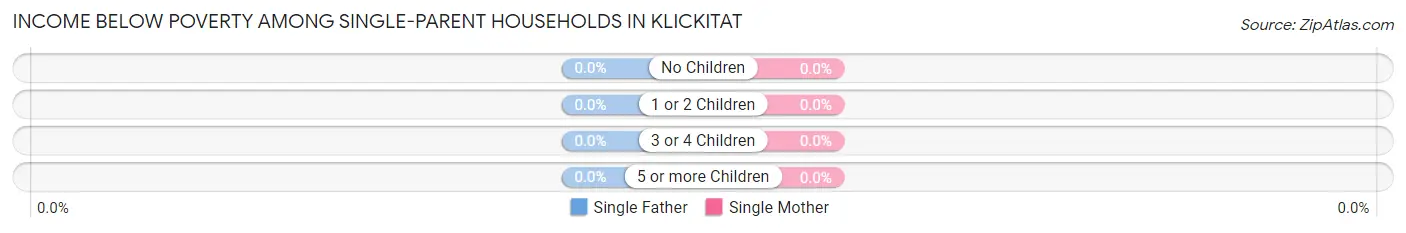
| Children | Single Father | Single Mother |
| No Children | 0 (0.0%) | 0 (0.0%) |
| 1 or 2 Children | 0 (0.0%) | 0 (0.0%) |
| 3 or 4 Children | 0 (0.0%) | 0 (0.0%) |
| 5 or more Children | 0 (0.0%) | 0 (0.0%) |
| Total | 0 (0.0%) | 0 (0.0%) |
Income Below Poverty Among Married-Couple vs Single-Parent Households in Klickitat
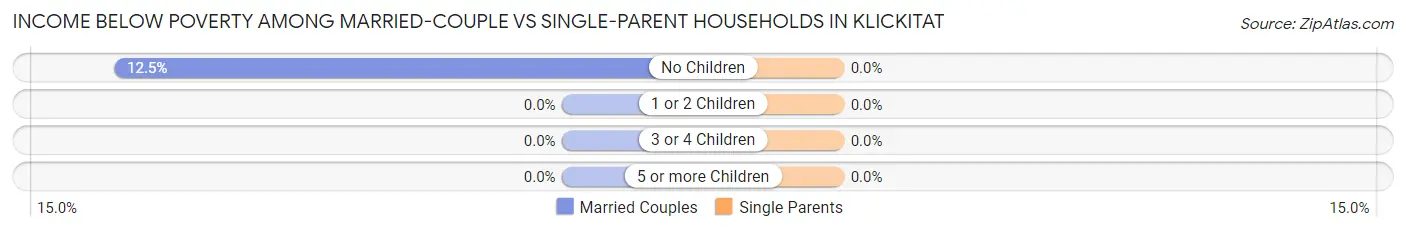
| Children | Married-Couple Families | Single-Parent Households |
| No Children | 7 (12.5%) | 0 (0.0%) |
| 1 or 2 Children | 0 (0.0%) | 0 (0.0%) |
| 3 or 4 Children | 0 (0.0%) | 0 (0.0%) |
| 5 or more Children | 0 (0.0%) | 0 (0.0%) |
| Total | 7 (9.6%) | 0 (0.0%) |
Race in Klickitat
The most populous races in Klickitat are White / Caucasian (331 | 98.8%), Hispanic or Latino (23 | 6.9%), and Two or more Races (4 | 1.2%).
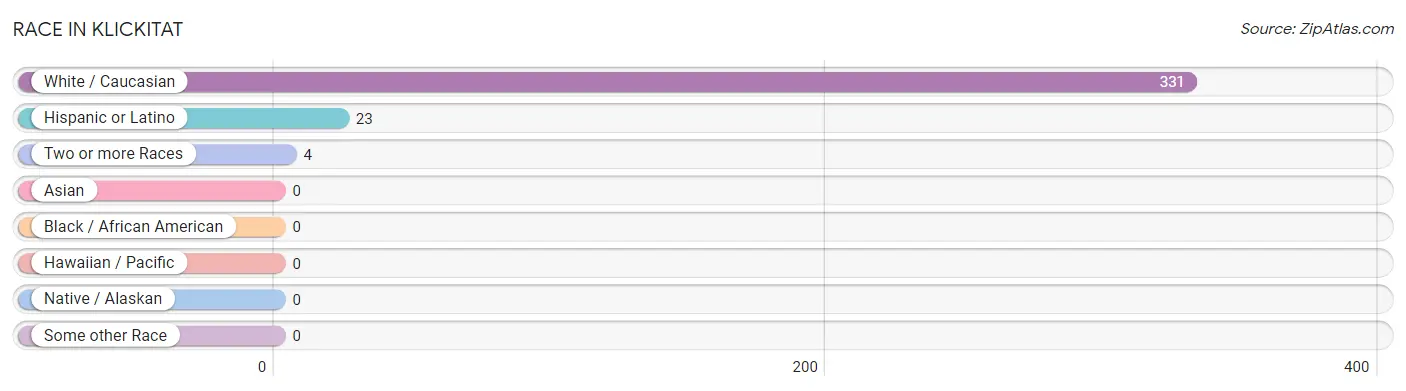
| Race | # Population | % Population |
| Asian | 0 | 0.0% |
| Black / African American | 0 | 0.0% |
| Hawaiian / Pacific | 0 | 0.0% |
| Hispanic or Latino | 23 | 6.9% |
| Native / Alaskan | 0 | 0.0% |
| White / Caucasian | 331 | 98.8% |
| Two or more Races | 4 | 1.2% |
| Some other Race | 0 | 0.0% |
| Total | 335 | 100.0% |
Ancestry in Klickitat
The most populous ancestries reported in Klickitat are English (96 | 28.7%), German (52 | 15.5%), Irish (46 | 13.7%), American (41 | 12.2%), and Scottish (41 | 12.2%), together accounting for 82.4% of all Klickitat residents.
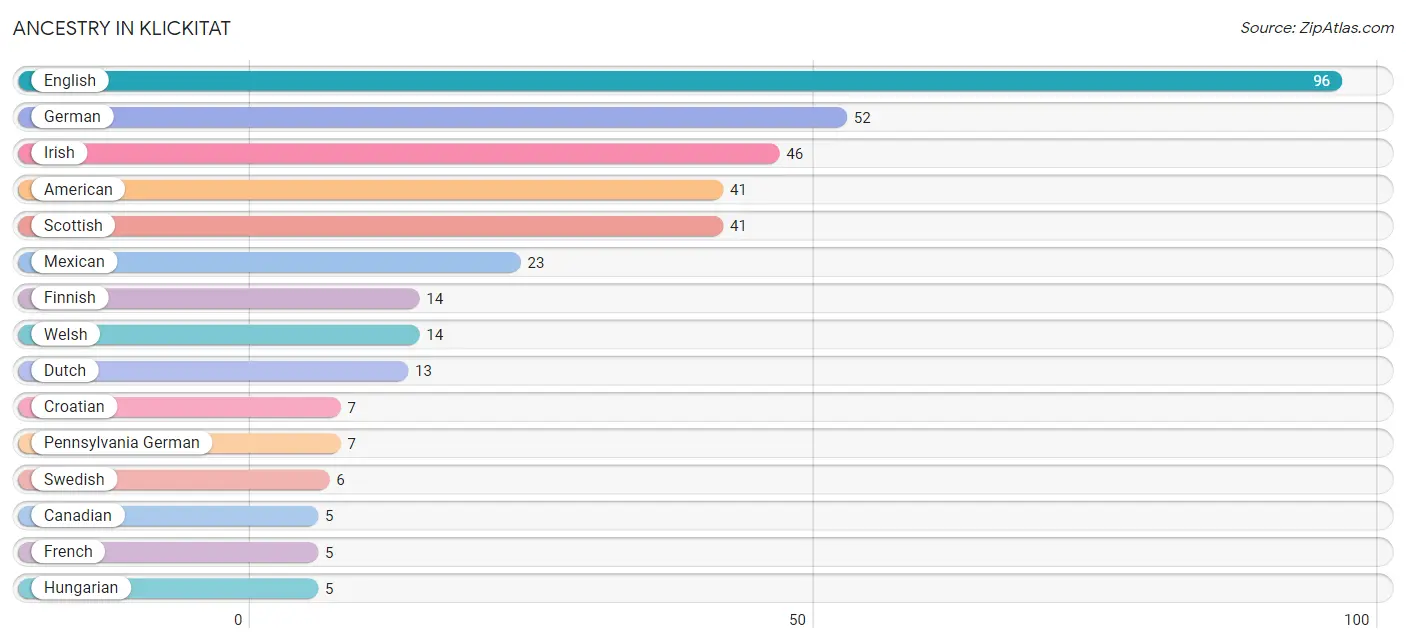
| Ancestry | # Population | % Population |
| American | 41 | 12.2% |
| Canadian | 5 | 1.5% |
| Croatian | 7 | 2.1% |
| Dutch | 13 | 3.9% |
| English | 96 | 28.7% |
| Finnish | 14 | 4.2% |
| French | 5 | 1.5% |
| German | 52 | 15.5% |
| Hungarian | 5 | 1.5% |
| Irish | 46 | 13.7% |
| Mexican | 23 | 6.9% |
| Pennsylvania German | 7 | 2.1% |
| Scottish | 41 | 12.2% |
| Swedish | 6 | 1.8% |
| Welsh | 14 | 4.2% | View All 15 Rows |
Immigrants in Klickitat

| Immigration Origin | # Population | % Population | View All 0 Rows |
Sex and Age in Klickitat
Sex and Age in Klickitat
The most populous age groups in Klickitat are 60 to 64 Years (21 | 14.7%) for men and 30 to 34 Years (44 | 22.9%) for women.
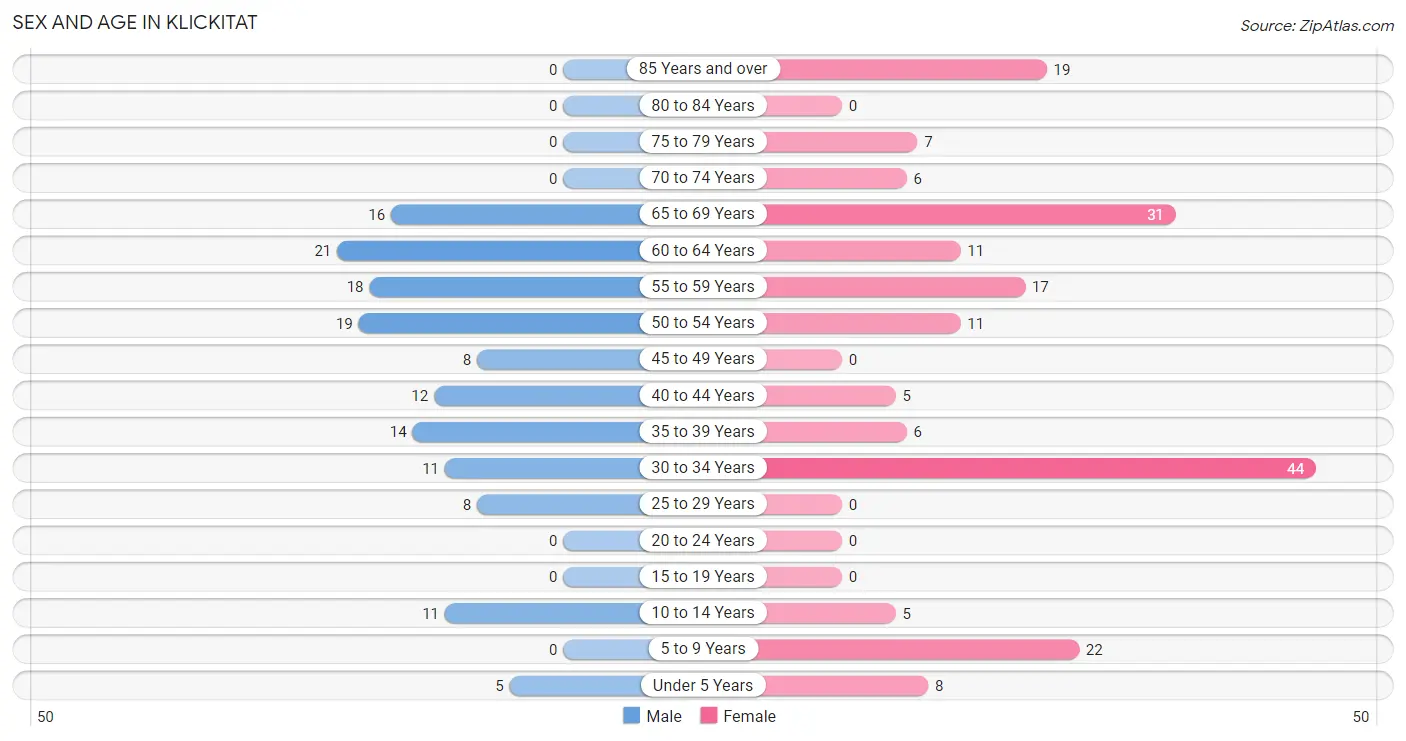
| Age Bracket | Male | Female |
| Under 5 Years | 5 (3.5%) | 8 (4.2%) |
| 5 to 9 Years | 0 (0.0%) | 22 (11.5%) |
| 10 to 14 Years | 11 (7.7%) | 5 (2.6%) |
| 15 to 19 Years | 0 (0.0%) | 0 (0.0%) |
| 20 to 24 Years | 0 (0.0%) | 0 (0.0%) |
| 25 to 29 Years | 8 (5.6%) | 0 (0.0%) |
| 30 to 34 Years | 11 (7.7%) | 44 (22.9%) |
| 35 to 39 Years | 14 (9.8%) | 6 (3.1%) |
| 40 to 44 Years | 12 (8.4%) | 5 (2.6%) |
| 45 to 49 Years | 8 (5.6%) | 0 (0.0%) |
| 50 to 54 Years | 19 (13.3%) | 11 (5.7%) |
| 55 to 59 Years | 18 (12.6%) | 17 (8.8%) |
| 60 to 64 Years | 21 (14.7%) | 11 (5.7%) |
| 65 to 69 Years | 16 (11.2%) | 31 (16.2%) |
| 70 to 74 Years | 0 (0.0%) | 6 (3.1%) |
| 75 to 79 Years | 0 (0.0%) | 7 (3.6%) |
| 80 to 84 Years | 0 (0.0%) | 0 (0.0%) |
| 85 Years and over | 0 (0.0%) | 19 (9.9%) |
| Total | 143 (100.0%) | 192 (100.0%) |
Families and Households in Klickitat
Median Family Size in Klickitat
The median family size in Klickitat is 2.82 persons per family, with married-couple families (73 | 74.5%) accounting for the largest median family size of 3.12 persons per family. On the other hand, single female/mother families (19 | 19.4%) represent the smallest median family size with 1.79 persons per family.
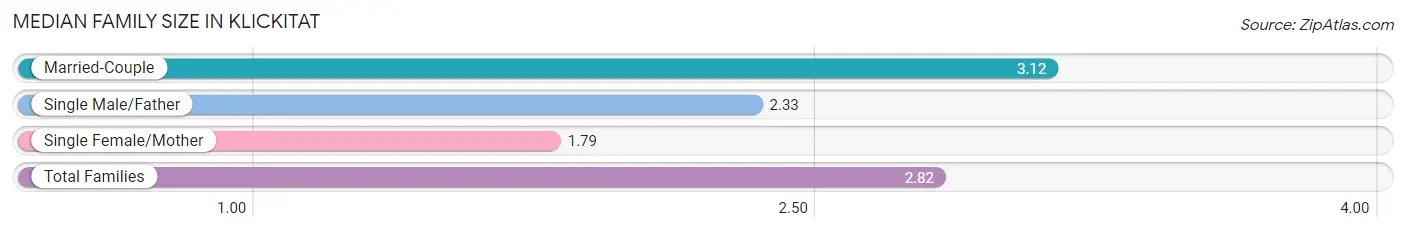
| Family Type | # Families | Family Size |
| Married-Couple | 73 (74.5%) | 3.12 |
| Single Male/Father | 6 (6.1%) | 2.33 |
| Single Female/Mother | 19 (19.4%) | 1.79 |
| Total Families | 98 (100.0%) | 2.82 |
Median Household Size in Klickitat
The median household size in Klickitat is 2.54 persons per household, with married-couple households (73 | 55.3%) accounting for the largest median household size of 3.12 persons per household. non-family households (34 | 25.8%) represent the smallest median household size with 1.74 persons per household.
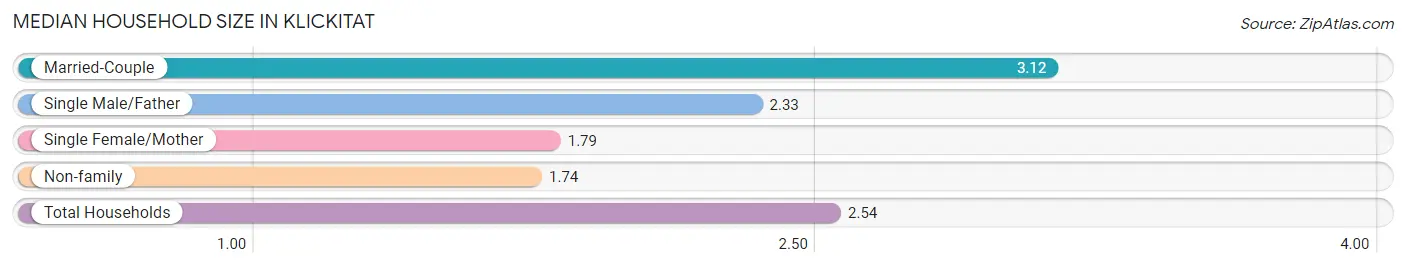
| Household Type | # Households | Household Size |
| Married-Couple | 73 (55.3%) | 3.12 |
| Single Male/Father | 6 (4.5%) | 2.33 |
| Single Female/Mother | 19 (14.4%) | 1.79 |
| Non-family | 34 (25.8%) | 1.74 |
| Total Households | 132 (100.0%) | 2.54 |
Household Size by Marriage Status in Klickitat
Out of a total of 132 households in Klickitat, 98 (74.2%) are family households, while 34 (25.8%) are nonfamily households. The most numerous type of family households are 2-person households, comprising 77, and the most common type of nonfamily households are 1-person households, comprising 18.
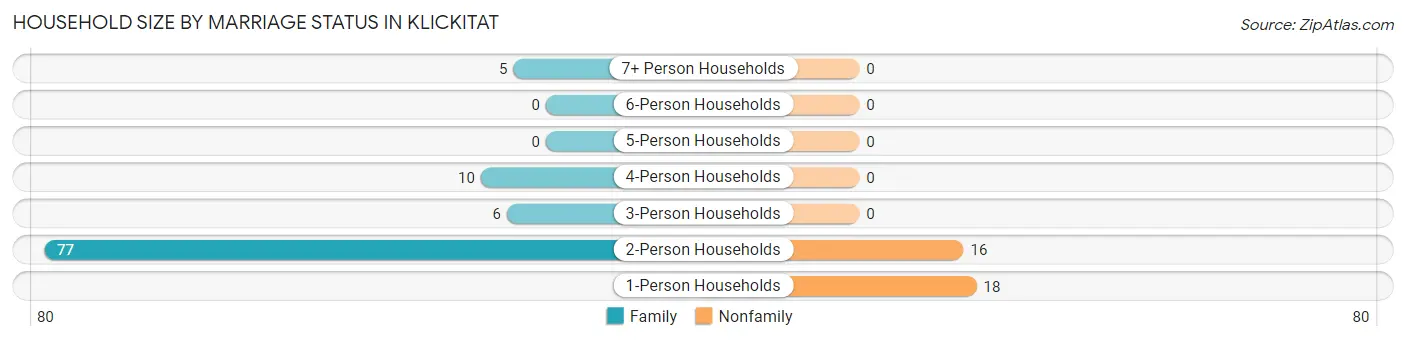
| Household Size | Family Households | Nonfamily Households |
| 1-Person Households | - | 18 (13.6%) |
| 2-Person Households | 77 (58.3%) | 16 (12.1%) |
| 3-Person Households | 6 (4.5%) | 0 (0.0%) |
| 4-Person Households | 10 (7.6%) | 0 (0.0%) |
| 5-Person Households | 0 (0.0%) | 0 (0.0%) |
| 6-Person Households | 0 (0.0%) | 0 (0.0%) |
| 7+ Person Households | 5 (3.8%) | 0 (0.0%) |
| Total | 98 (74.2%) | 34 (25.8%) |
Female Fertility in Klickitat
Fertility by Age in Klickitat
Average fertility rate in Klickitat is 109.0 births per 1,000 women. Women in the age bracket of 20 to 34 years have the highest fertility rate with 136.0 births per 1,000 women. Women in the age bracket of 20 to 34 years acount for 100.0% of all women with births.
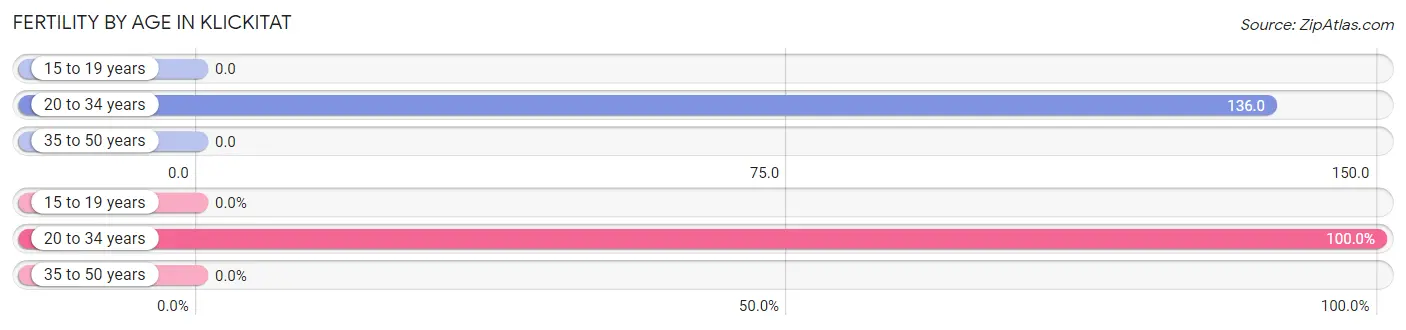
| Age Bracket | Women with Births | Births / 1,000 Women |
| 15 to 19 years | 0 (0.0%) | 0.0 |
| 20 to 34 years | 6 (100.0%) | 136.0 |
| 35 to 50 years | 0 (0.0%) | 0.0 |
| Total | 6 (100.0%) | 109.0 |
Fertility by Age by Marriage Status in Klickitat
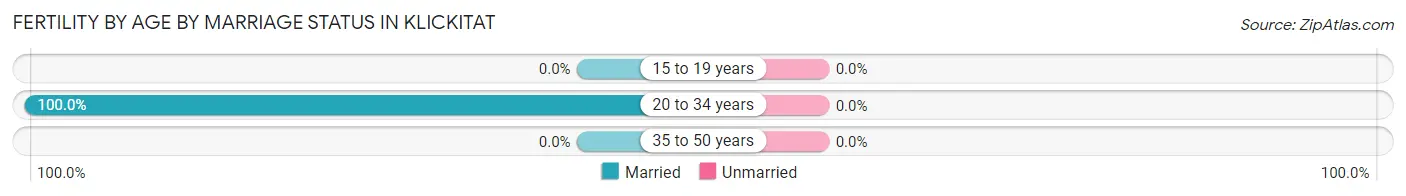
| Age Bracket | Married | Unmarried |
| 15 to 19 years | 0 (0.0%) | 0 (0.0%) |
| 20 to 34 years | 6 (100.0%) | 0 (0.0%) |
| 35 to 50 years | 0 (0.0%) | 0 (0.0%) |
| Total | 6 (100.0%) | 0 (0.0%) |
Fertility by Education in Klickitat
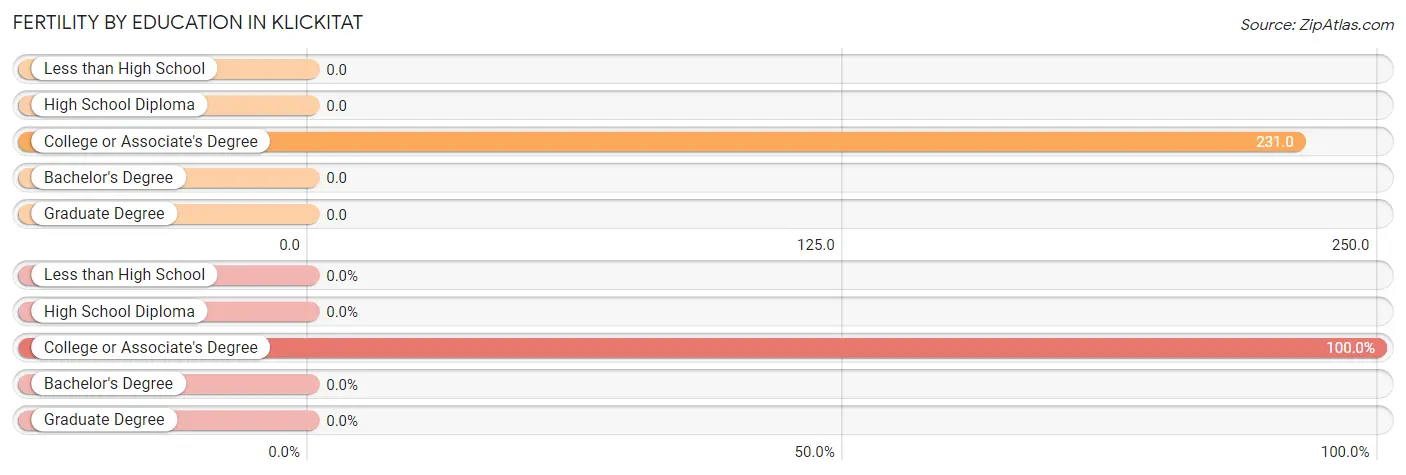
| Educational Attainment | Women with Births | Births / 1,000 Women |
| Less than High School | 0 (0.0%) | 0.0 |
| High School Diploma | 0 (0.0%) | 0.0 |
| College or Associate's Degree | 6 (100.0%) | 231.0 |
| Bachelor's Degree | 0 (0.0%) | 0.0 |
| Graduate Degree | 0 (0.0%) | 0.0 |
| Total | 6 (100.0%) | 109.0 |
Fertility by Education by Marriage Status in Klickitat
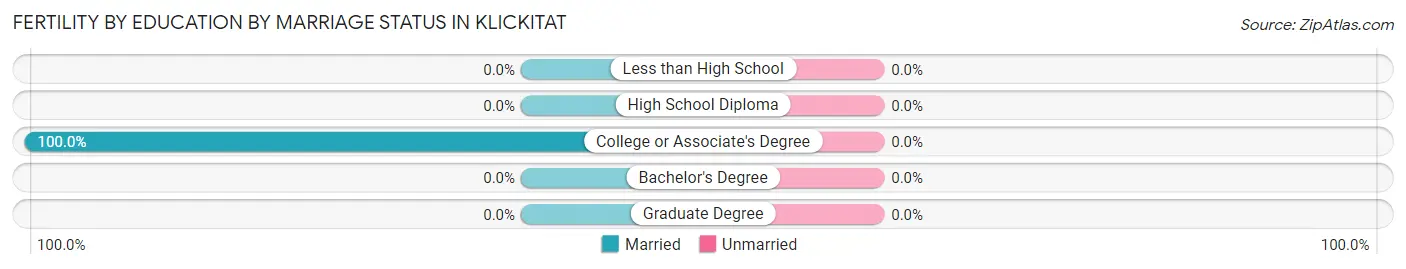
| Educational Attainment | Married | Unmarried |
| Less than High School | 0 (0.0%) | 0 (0.0%) |
| High School Diploma | 0 (0.0%) | 0 (0.0%) |
| College or Associate's Degree | 6 (100.0%) | 0 (0.0%) |
| Bachelor's Degree | 0 (0.0%) | 0 (0.0%) |
| Graduate Degree | 0 (0.0%) | 0 (0.0%) |
| Total | 6 (100.0%) | 0 (0.0%) |
Employment Characteristics in Klickitat
Employment by Class of Employer in Klickitat
Among the 126 employed individuals in Klickitat, private company employees (83 | 65.9%), local government employees (13 | 10.3%), and self-employed (incorporated) (12 | 9.5%) make up the most common classes of employment.
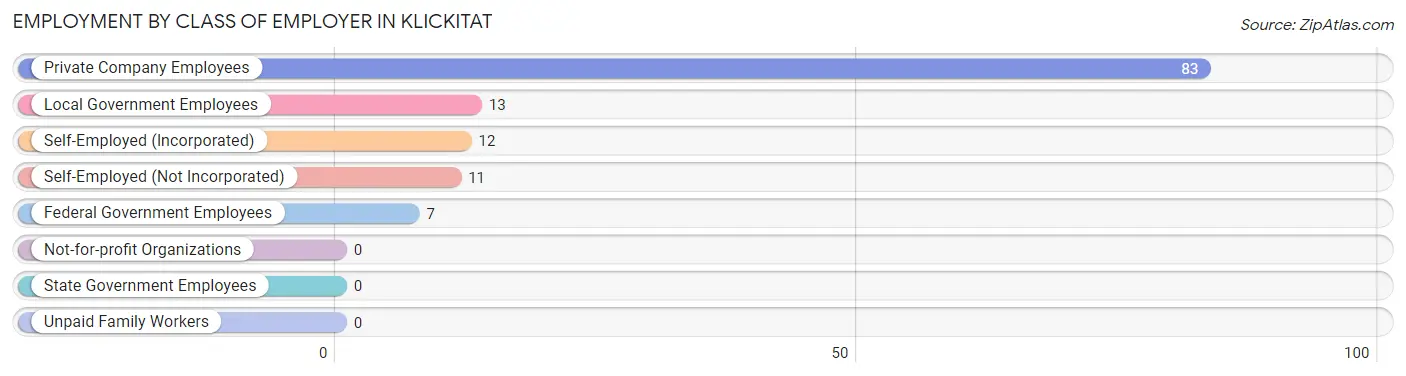
| Employer Class | # Employees | % Employees |
| Private Company Employees | 83 | 65.9% |
| Self-Employed (Incorporated) | 12 | 9.5% |
| Self-Employed (Not Incorporated) | 11 | 8.7% |
| Not-for-profit Organizations | 0 | 0.0% |
| Local Government Employees | 13 | 10.3% |
| State Government Employees | 0 | 0.0% |
| Federal Government Employees | 7 | 5.6% |
| Unpaid Family Workers | 0 | 0.0% |
| Total | 126 | 100.0% |
Employment Status by Age in Klickitat
According to the labor force statistics for Klickitat, out of the total population over 16 years of age (284), 50.7% or 144 individuals are in the labor force, with 12.5% or 18 of them unemployed. The age group with the highest labor force participation rate is 35 to 44 years, with 100.0% or 37 individuals in the labor force. Within the labor force, the 60 to 64 years age range has the highest percentage of unemployed individuals, with 100.0% or 11 of them being unemployed.
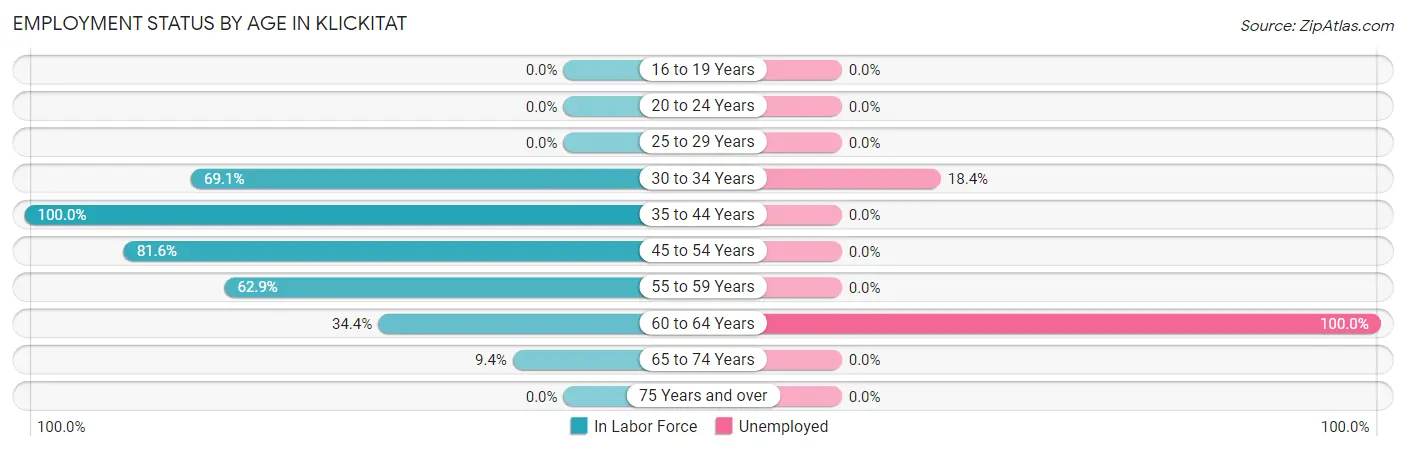
| Age Bracket | In Labor Force | Unemployed |
| 16 to 19 Years | 0 (0.0%) | 0 (0.0%) |
| 20 to 24 Years | 0 (0.0%) | 0 (0.0%) |
| 25 to 29 Years | 0 (0.0%) | 0 (0.0%) |
| 30 to 34 Years | 38 (69.1%) | 7 (18.4%) |
| 35 to 44 Years | 37 (100.0%) | 0 (0.0%) |
| 45 to 54 Years | 31 (81.6%) | 0 (0.0%) |
| 55 to 59 Years | 22 (62.9%) | 0 (0.0%) |
| 60 to 64 Years | 11 (34.4%) | 11 (100.0%) |
| 65 to 74 Years | 5 (9.4%) | 0 (0.0%) |
| 75 Years and over | 0 (0.0%) | 0 (0.0%) |
| Total | 144 (50.7%) | 18 (12.5%) |
Employment Status by Educational Attainment in Klickitat
According to labor force statistics for Klickitat, 67.8% of individuals (139) out of the total population between 25 and 64 years of age (205) are in the labor force, with 12.9% or 18 of them being unemployed. The group with the highest labor force participation rate are those with the educational attainment of high school diploma, with 78.6% or 77 individuals in the labor force. Within the labor force, individuals with high school diploma education have the highest percentage of unemployment, with 14.3% or 11 of them being unemployed.
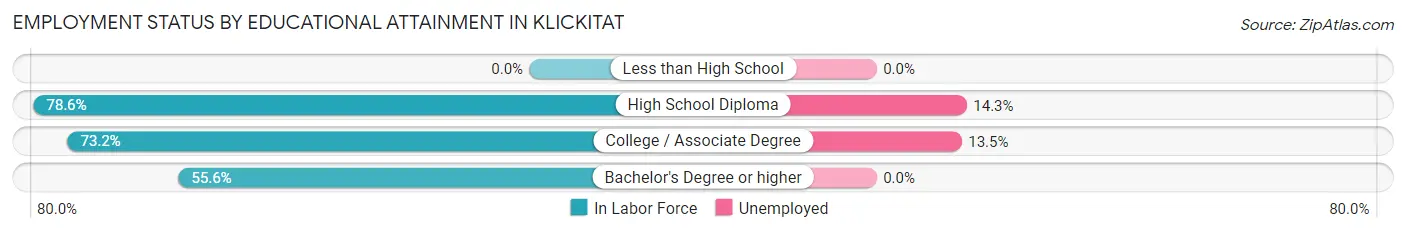
| Educational Attainment | In Labor Force | Unemployed |
| Less than High School | 0 (0.0%) | 0 (0.0%) |
| High School Diploma | 77 (78.6%) | 14 (14.3%) |
| College / Associate Degree | 52 (73.2%) | 10 (13.5%) |
| Bachelor's Degree or higher | 10 (55.6%) | 0 (0.0%) |
| Total | 139 (67.8%) | 26 (12.9%) |
Employment Occupations by Sex in Klickitat
Management, Business, Science and Arts Occupations
The most common Management, Business, Science and Arts occupations in Klickitat are Management (18 | 14.3%), Business & Financial (9 | 7.1%), and Health Diagnosing & Treating (6 | 4.8%).
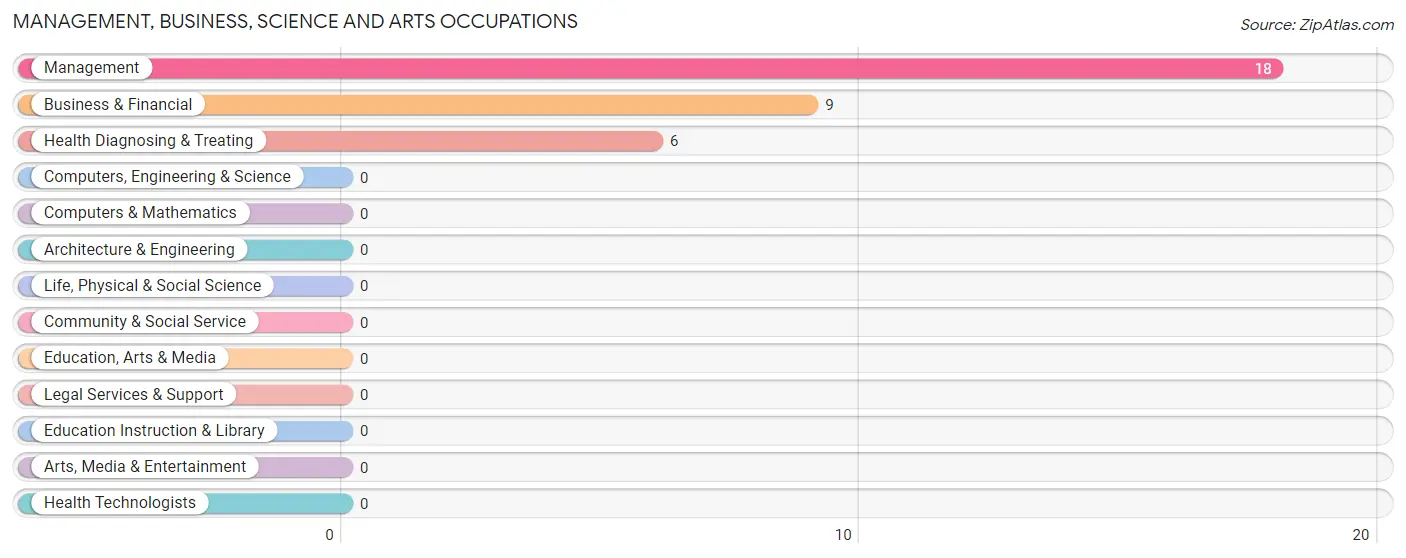
Management, Business, Science and Arts Occupations by Sex
Within the Management, Business, Science and Arts occupations in Klickitat, the most male-oriented occupations are Business & Financial (100.0%), and Management (72.2%), while the most female-oriented occupations are Health Diagnosing & Treating (100.0%), and Management (27.8%).
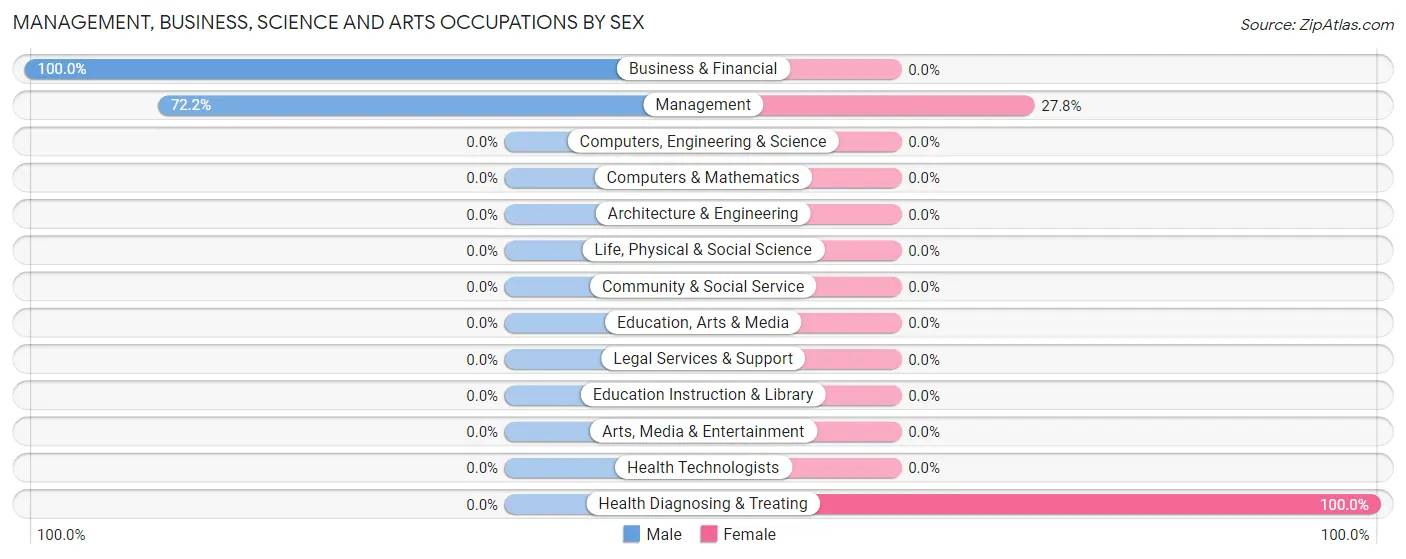
| Occupation | Male | Female |
| Management | 13 (72.2%) | 5 (27.8%) |
| Business & Financial | 9 (100.0%) | 0 (0.0%) |
| Computers, Engineering & Science | 0 (0.0%) | 0 (0.0%) |
| Computers & Mathematics | 0 (0.0%) | 0 (0.0%) |
| Architecture & Engineering | 0 (0.0%) | 0 (0.0%) |
| Life, Physical & Social Science | 0 (0.0%) | 0 (0.0%) |
| Community & Social Service | 0 (0.0%) | 0 (0.0%) |
| Education, Arts & Media | 0 (0.0%) | 0 (0.0%) |
| Legal Services & Support | 0 (0.0%) | 0 (0.0%) |
| Education Instruction & Library | 0 (0.0%) | 0 (0.0%) |
| Arts, Media & Entertainment | 0 (0.0%) | 0 (0.0%) |
| Health Diagnosing & Treating | 0 (0.0%) | 6 (100.0%) |
| Health Technologists | 0 (0.0%) | 0 (0.0%) |
| Total (Category) | 22 (66.7%) | 11 (33.3%) |
| Total (Overall) | 57 (45.2%) | 69 (54.8%) |
Services Occupations
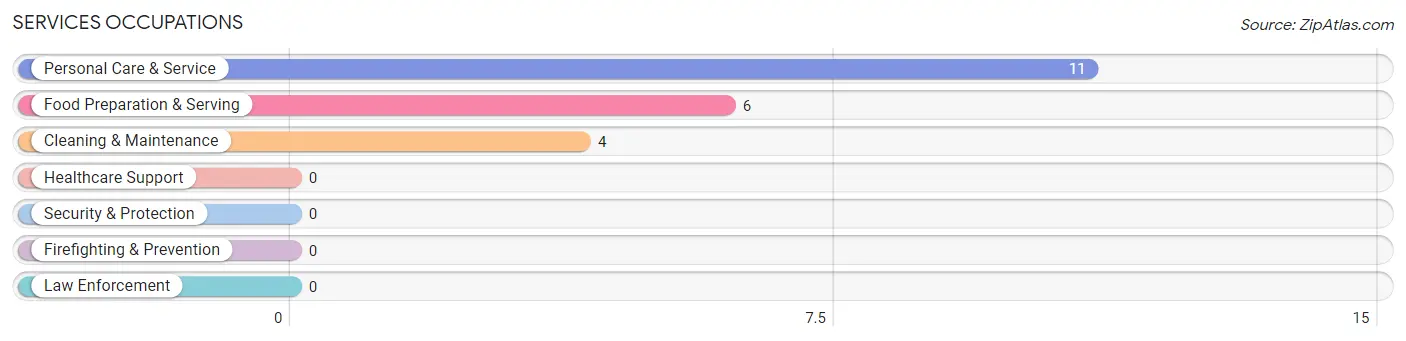
The most common Services occupations in Klickitat are Personal Care & Service (11 | 8.7%), Food Preparation & Serving (6 | 4.8%), and Cleaning & Maintenance (4 | 3.2%).
Services Occupations by Sex
| Occupation | Male | Female |
| Healthcare Support | 0 (0.0%) | 0 (0.0%) |
| Security & Protection | 0 (0.0%) | 0 (0.0%) |
| Firefighting & Prevention | 0 (0.0%) | 0 (0.0%) |
| Law Enforcement | 0 (0.0%) | 0 (0.0%) |
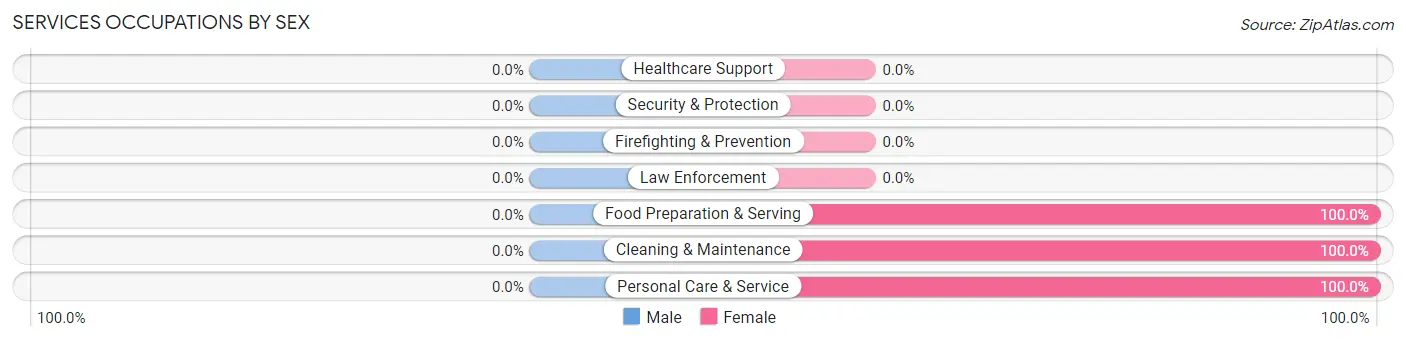
| Food Preparation & Serving | 0 (0.0%) | 6 (100.0%) |
| Cleaning & Maintenance | 0 (0.0%) | 4 (100.0%) |
| Personal Care & Service | 0 (0.0%) | 11 (100.0%) |
| Total (Category) | 0 (0.0%) | 21 (100.0%) |
| Total (Overall) | 57 (45.2%) | 69 (54.8%) |
Sales and Office Occupations
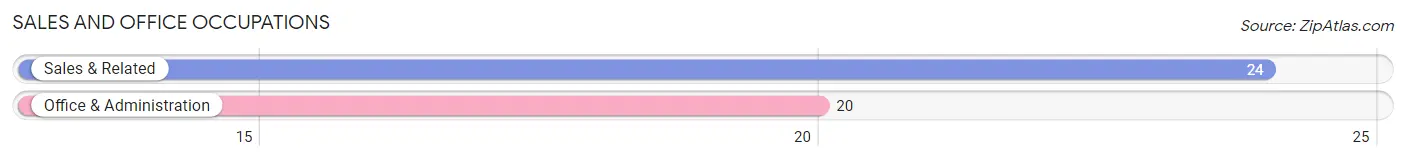
The most common Sales and Office occupations in Klickitat are Sales & Related (24 | 19.1%), and Office & Administration (20 | 15.9%).
Sales and Office Occupations by Sex
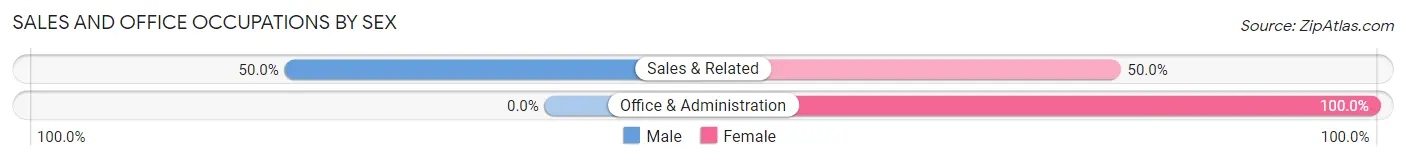
| Occupation | Male | Female |
| Sales & Related | 12 (50.0%) | 12 (50.0%) |
| Office & Administration | 0 (0.0%) | 20 (100.0%) |
| Total (Category) | 12 (27.3%) | 32 (72.7%) |
| Total (Overall) | 57 (45.2%) | 69 (54.8%) |
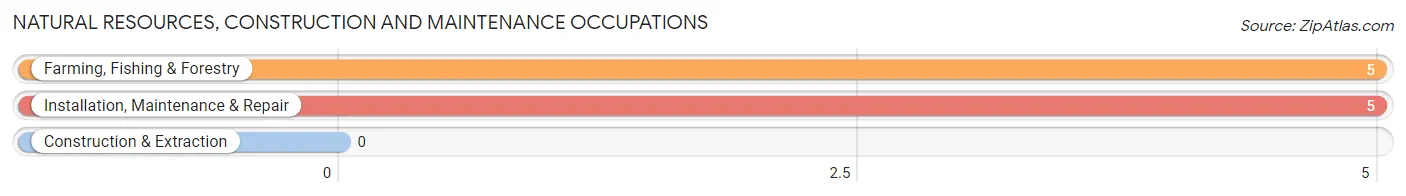
Natural Resources, Construction and Maintenance Occupations
The most common Natural Resources, Construction and Maintenance occupations in Klickitat are Farming, Fishing & Forestry (5 | 4.0%), and Installation, Maintenance & Repair (5 | 4.0%).
Natural Resources, Construction and Maintenance Occupations by Sex
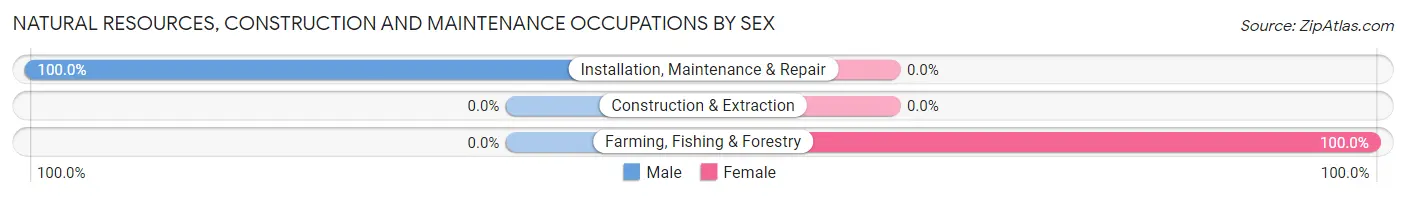
| Occupation | Male | Female |
| Farming, Fishing & Forestry | 0 (0.0%) | 5 (100.0%) |
| Construction & Extraction | 0 (0.0%) | 0 (0.0%) |
| Installation, Maintenance & Repair | 5 (100.0%) | 0 (0.0%) |
| Total (Category) | 5 (50.0%) | 5 (50.0%) |
| Total (Overall) | 57 (45.2%) | 69 (54.8%) |
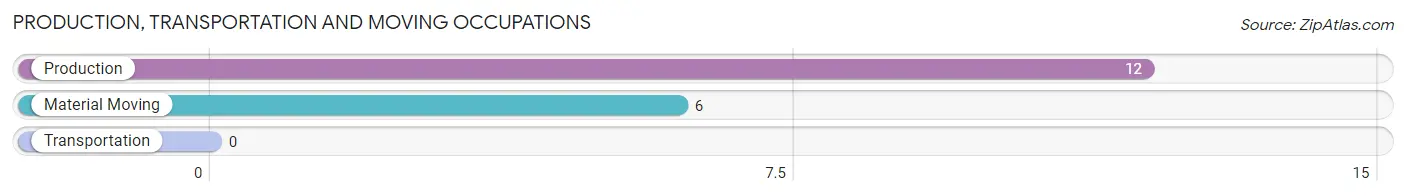
Production, Transportation and Moving Occupations
The most common Production, Transportation and Moving occupations in Klickitat are Production (12 | 9.5%), and Material Moving (6 | 4.8%).
Production, Transportation and Moving Occupations by Sex
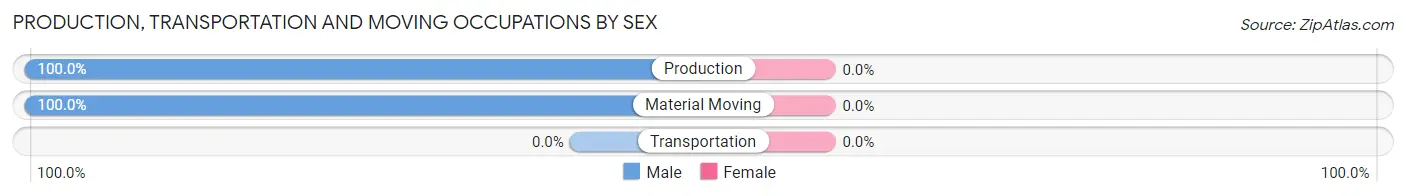
| Occupation | Male | Female |
| Production | 12 (100.0%) | 0 (0.0%) |
| Transportation | 0 (0.0%) | 0 (0.0%) |
| Material Moving | 6 (100.0%) | 0 (0.0%) |
| Total (Category) | 18 (100.0%) | 0 (0.0%) |
| Total (Overall) | 57 (45.2%) | 69 (54.8%) |
Employment Industries by Sex in Klickitat
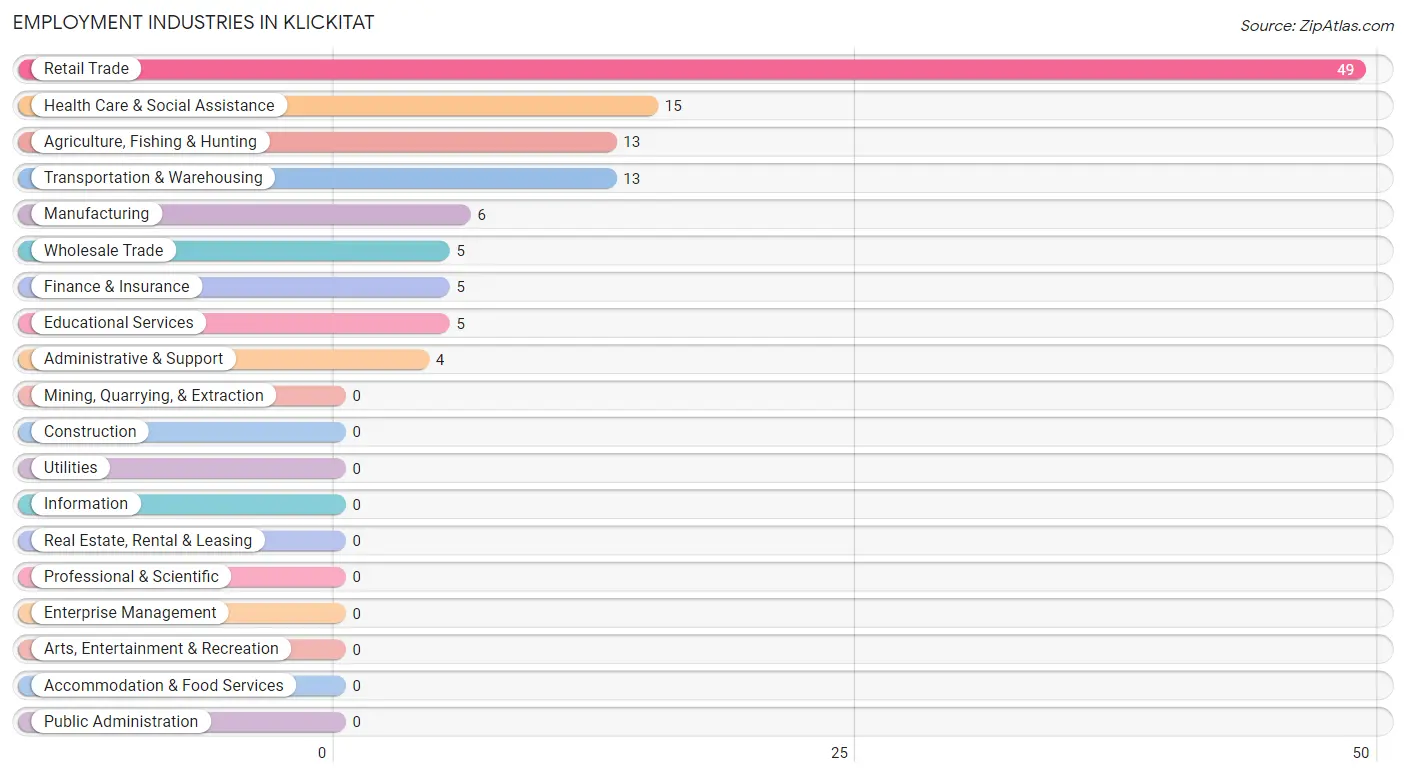
Employment Industries in Klickitat
The major employment industries in Klickitat include Retail Trade (49 | 38.9%), Health Care & Social Assistance (15 | 11.9%), Agriculture, Fishing & Hunting (13 | 10.3%), Transportation & Warehousing (13 | 10.3%), and Manufacturing (6 | 4.8%).
Employment Industries by Sex in Klickitat
The Klickitat industries that see more men than women are Manufacturing (100.0%), Wholesale Trade (100.0%), and Educational Services (100.0%), whereas the industries that tend to have a higher number of women are Finance & Insurance (100.0%), Administrative & Support (100.0%), and Retail Trade (63.3%).
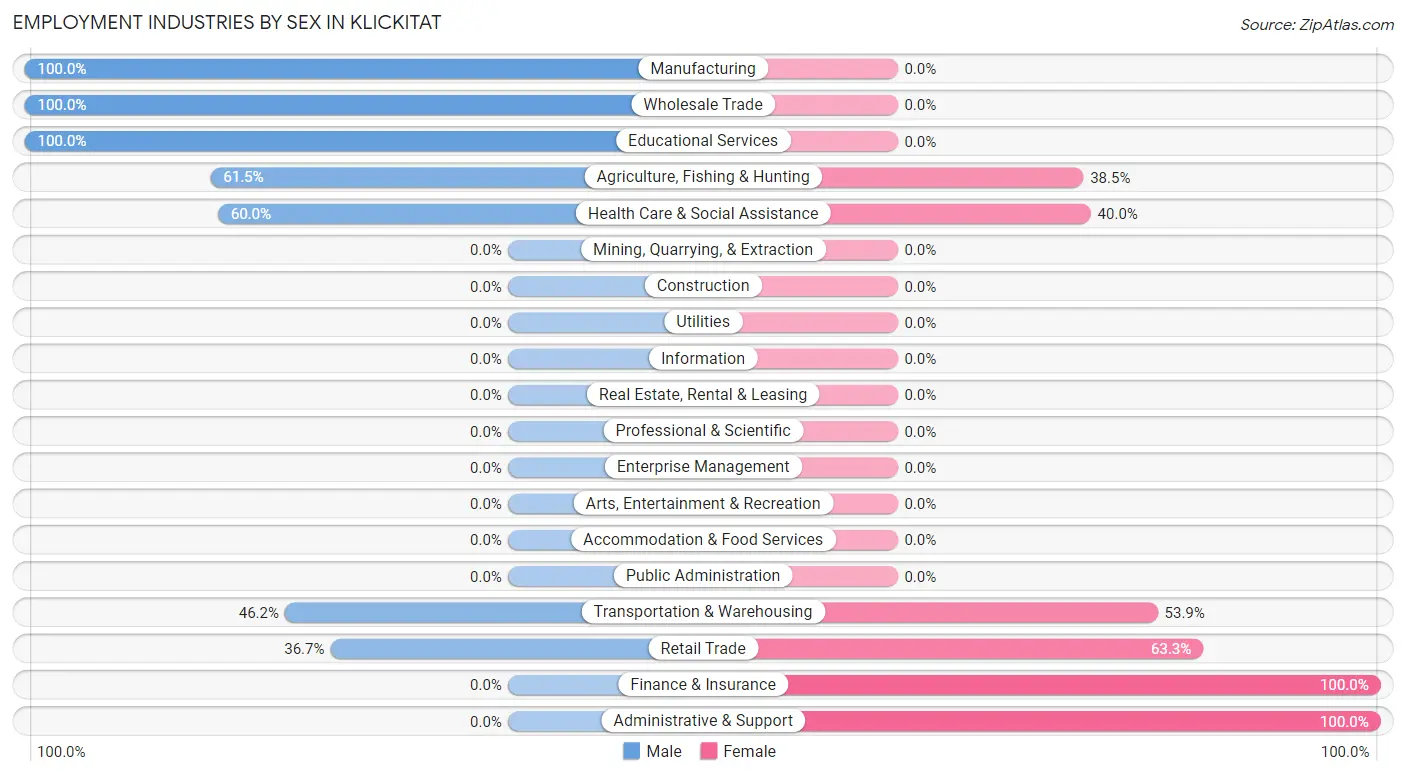
| Industry | Male | Female |
| Agriculture, Fishing & Hunting | 8 (61.5%) | 5 (38.5%) |
| Mining, Quarrying, & Extraction | 0 (0.0%) | 0 (0.0%) |
| Construction | 0 (0.0%) | 0 (0.0%) |
| Manufacturing | 6 (100.0%) | 0 (0.0%) |
| Wholesale Trade | 5 (100.0%) | 0 (0.0%) |
| Retail Trade | 18 (36.7%) | 31 (63.3%) |
| Transportation & Warehousing | 6 (46.2%) | 7 (53.8%) |
| Utilities | 0 (0.0%) | 0 (0.0%) |
| Information | 0 (0.0%) | 0 (0.0%) |
| Finance & Insurance | 0 (0.0%) | 5 (100.0%) |
| Real Estate, Rental & Leasing | 0 (0.0%) | 0 (0.0%) |
| Professional & Scientific | 0 (0.0%) | 0 (0.0%) |
| Enterprise Management | 0 (0.0%) | 0 (0.0%) |
| Administrative & Support | 0 (0.0%) | 4 (100.0%) |
| Educational Services | 5 (100.0%) | 0 (0.0%) |
| Health Care & Social Assistance | 9 (60.0%) | 6 (40.0%) |
| Arts, Entertainment & Recreation | 0 (0.0%) | 0 (0.0%) |
| Accommodation & Food Services | 0 (0.0%) | 0 (0.0%) |
| Public Administration | 0 (0.0%) | 0 (0.0%) |
| Total | 57 (45.2%) | 69 (54.8%) |
Education in Klickitat
School Enrollment in Klickitat
The most common levels of schooling among the 47 students in Klickitat are elementary school (17 | 36.2%), middle school (16 | 34.0%), and college / undergraduate (6 | 12.8%).
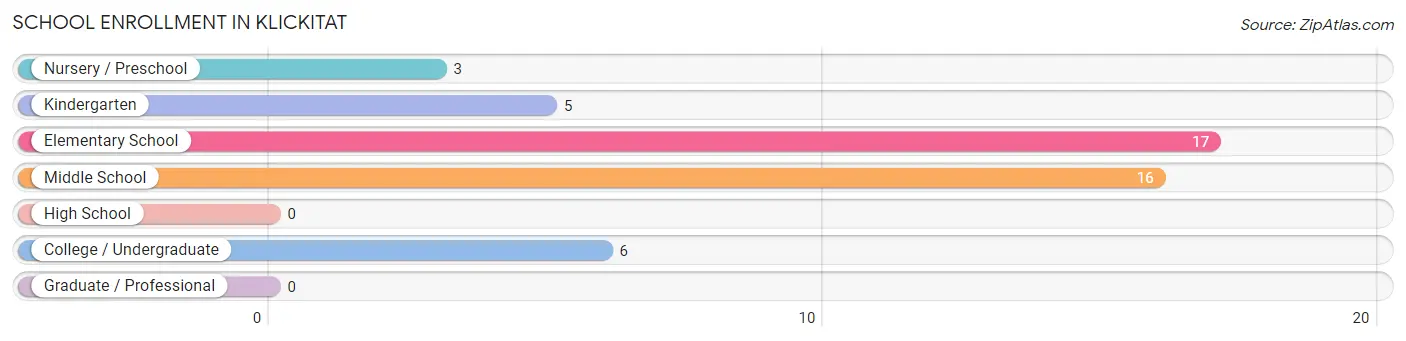
| School Level | # Students | % Students |
| Nursery / Preschool | 3 | 6.4% |
| Kindergarten | 5 | 10.6% |
| Elementary School | 17 | 36.2% |
| Middle School | 16 | 34.0% |
| High School | 0 | 0.0% |
| College / Undergraduate | 6 | 12.8% |
| Graduate / Professional | 0 | 0.0% |
| Total | 47 | 100.0% |
School Enrollment by Age by Funding Source in Klickitat
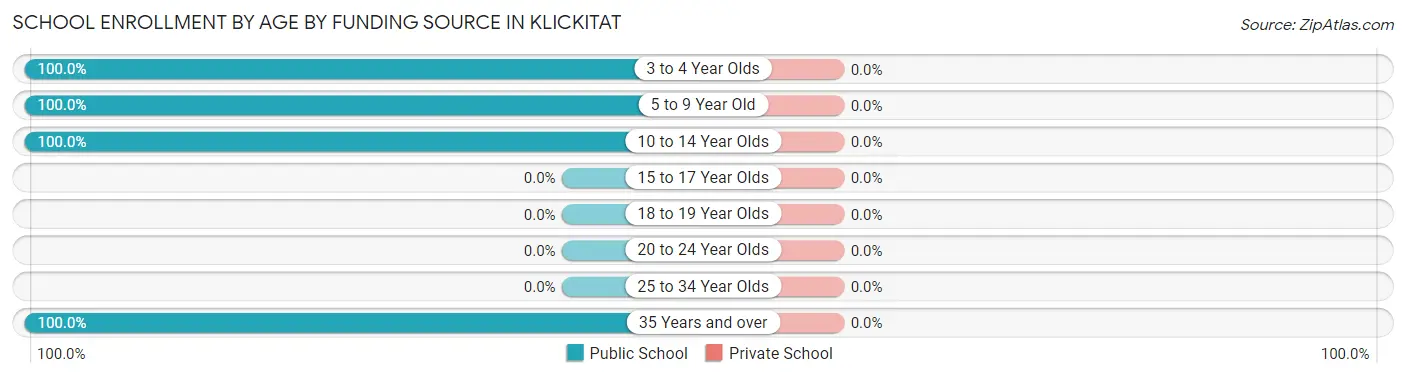
| Age Bracket | Public School | Private School |
| 3 to 4 Year Olds | 3 (100.0%) | 0 (0.0%) |
| 5 to 9 Year Old | 22 (100.0%) | 0 (0.0%) |
| 10 to 14 Year Olds | 16 (100.0%) | 0 (0.0%) |
| 15 to 17 Year Olds | 0 (0.0%) | 0 (0.0%) |
| 18 to 19 Year Olds | 0 (0.0%) | 0 (0.0%) |
| 20 to 24 Year Olds | 0 (0.0%) | 0 (0.0%) |
| 25 to 34 Year Olds | 0 (0.0%) | 0 (0.0%) |
| 35 Years and over | 6 (100.0%) | 0 (0.0%) |
| Total | 47 (100.0%) | 0 (0.0%) |
Educational Attainment by Field of Study in Klickitat
Literature & languages (8 | 33.3%), bio, nature & agricultural (6 | 25.0%), science & technology (5 | 20.8%), and business (5 | 20.8%) are the most common fields of study among 24 individuals in Klickitat who have obtained a bachelor's degree or higher.
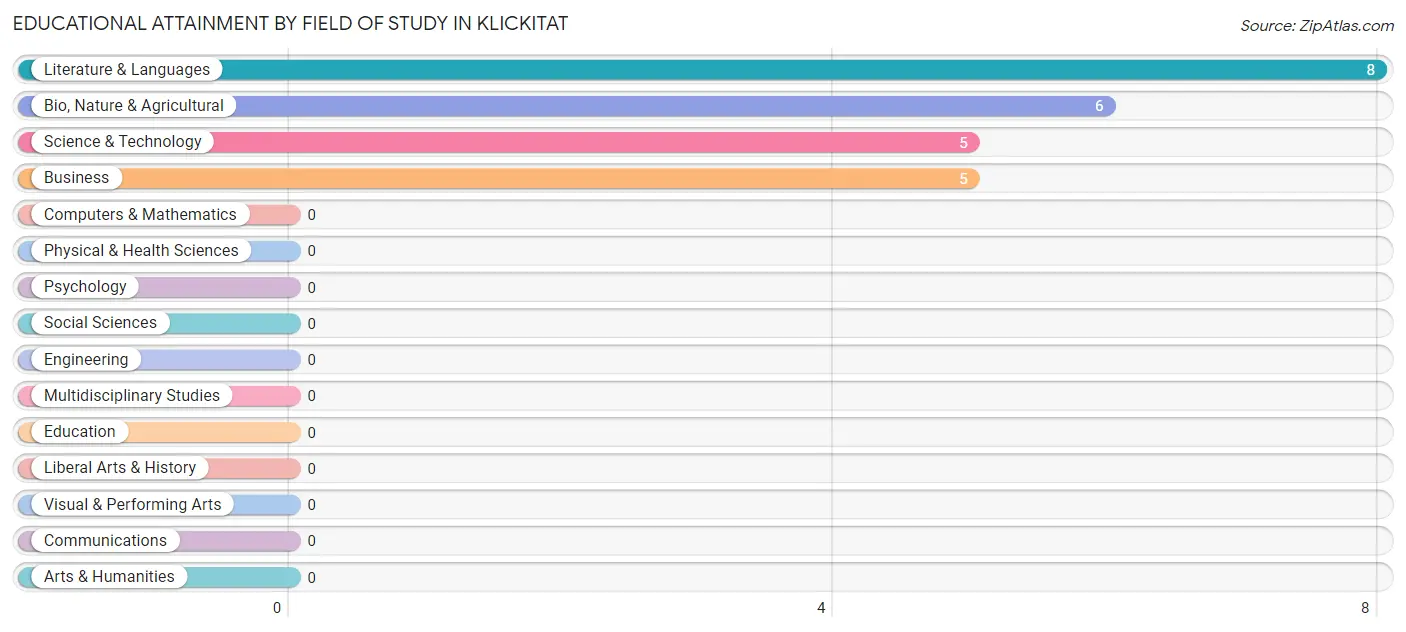
| Field of Study | # Graduates | % Graduates |
| Computers & Mathematics | 0 | 0.0% |
| Bio, Nature & Agricultural | 6 | 25.0% |
| Physical & Health Sciences | 0 | 0.0% |
| Psychology | 0 | 0.0% |
| Social Sciences | 0 | 0.0% |
| Engineering | 0 | 0.0% |
| Multidisciplinary Studies | 0 | 0.0% |
| Science & Technology | 5 | 20.8% |
| Business | 5 | 20.8% |
| Education | 0 | 0.0% |
| Literature & Languages | 8 | 33.3% |
| Liberal Arts & History | 0 | 0.0% |
| Visual & Performing Arts | 0 | 0.0% |
| Communications | 0 | 0.0% |
| Arts & Humanities | 0 | 0.0% |
| Total | 24 | 100.0% |
Transportation & Commute in Klickitat
Vehicle Availability by Sex in Klickitat
The most prevalent vehicle ownership categories in Klickitat are males with 2 vehicles (38, accounting for 66.7%) and females with 2 vehicles (28, making up 55.1%).
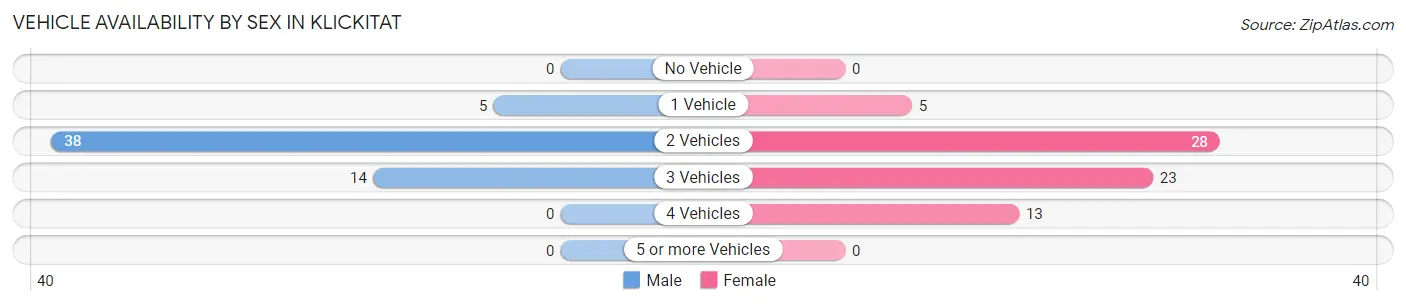
| Vehicles Available | Male | Female |
| No Vehicle | 0 (0.0%) | 0 (0.0%) |
| 1 Vehicle | 5 (8.8%) | 5 (7.2%) |
| 2 Vehicles | 38 (66.7%) | 28 (40.6%) |
| 3 Vehicles | 14 (24.6%) | 23 (33.3%) |
| 4 Vehicles | 0 (0.0%) | 13 (18.8%) |
| 5 or more Vehicles | 0 (0.0%) | 0 (0.0%) |
| Total | 57 (100.0%) | 69 (100.0%) |
Commute Time in Klickitat
The most frequently occuring commute durations in Klickitat are 45 to 59 minutes (40 commuters, 31.8%), 40 to 44 minutes (20 commuters, 15.9%), and 30 to 34 minutes (16 commuters, 12.7%).
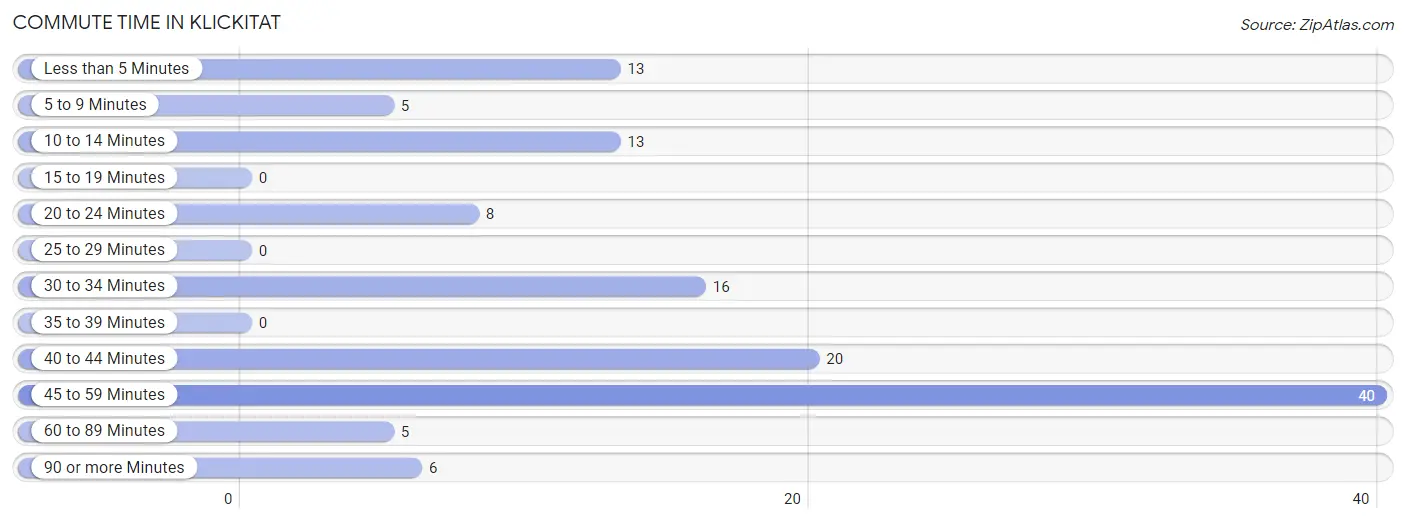
| Commute Time | # Commuters | % Commuters |
| Less than 5 Minutes | 13 | 10.3% |
| 5 to 9 Minutes | 5 | 4.0% |
| 10 to 14 Minutes | 13 | 10.3% |
| 15 to 19 Minutes | 0 | 0.0% |
| 20 to 24 Minutes | 8 | 6.4% |
| 25 to 29 Minutes | 0 | 0.0% |
| 30 to 34 Minutes | 16 | 12.7% |
| 35 to 39 Minutes | 0 | 0.0% |
| 40 to 44 Minutes | 20 | 15.9% |
| 45 to 59 Minutes | 40 | 31.8% |
| 60 to 89 Minutes | 5 | 4.0% |
| 90 or more Minutes | 6 | 4.8% |
Commute Time by Sex in Klickitat
The most common commute times in Klickitat are 45 to 59 minutes (17 commuters, 29.8%) for males and 45 to 59 minutes (23 commuters, 33.3%) for females.
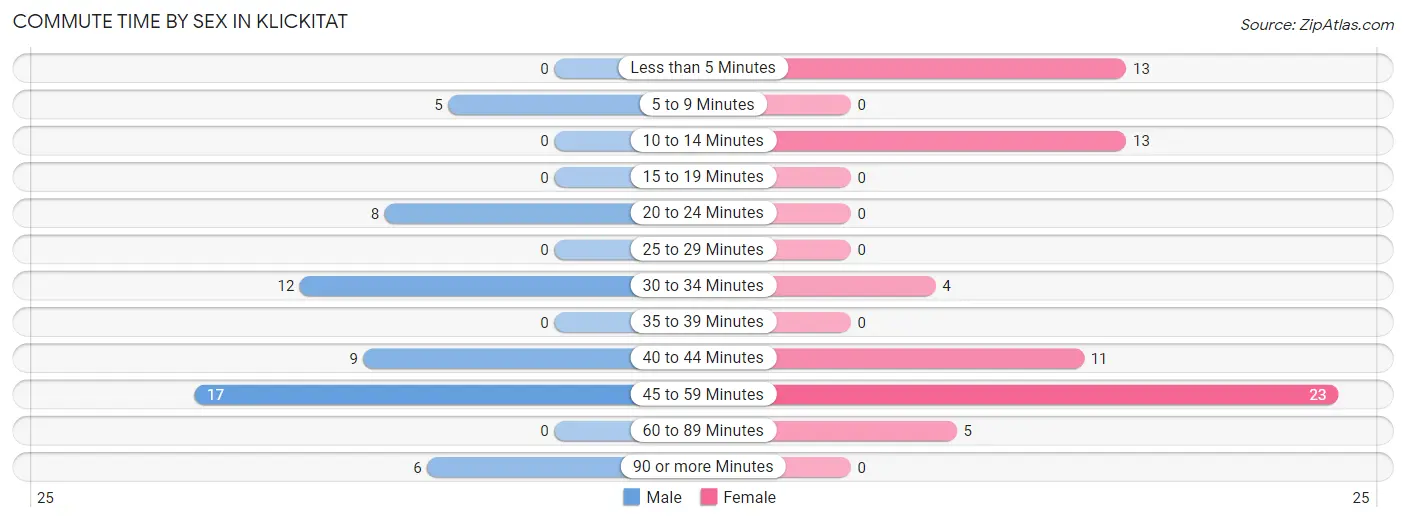
| Commute Time | Male | Female |
| Less than 5 Minutes | 0 (0.0%) | 13 (18.8%) |
| 5 to 9 Minutes | 5 (8.8%) | 0 (0.0%) |
| 10 to 14 Minutes | 0 (0.0%) | 13 (18.8%) |
| 15 to 19 Minutes | 0 (0.0%) | 0 (0.0%) |
| 20 to 24 Minutes | 8 (14.0%) | 0 (0.0%) |
| 25 to 29 Minutes | 0 (0.0%) | 0 (0.0%) |
| 30 to 34 Minutes | 12 (21.0%) | 4 (5.8%) |
| 35 to 39 Minutes | 0 (0.0%) | 0 (0.0%) |
| 40 to 44 Minutes | 9 (15.8%) | 11 (15.9%) |
| 45 to 59 Minutes | 17 (29.8%) | 23 (33.3%) |
| 60 to 89 Minutes | 0 (0.0%) | 5 (7.2%) |
| 90 or more Minutes | 6 (10.5%) | 0 (0.0%) |
Time of Departure to Work by Sex in Klickitat
The most frequent times of departure to work in Klickitat are 9:00 AM to 9:59 AM (12, 21.0%) for males and 7:30 AM to 7:59 AM (23, 33.3%) for females.
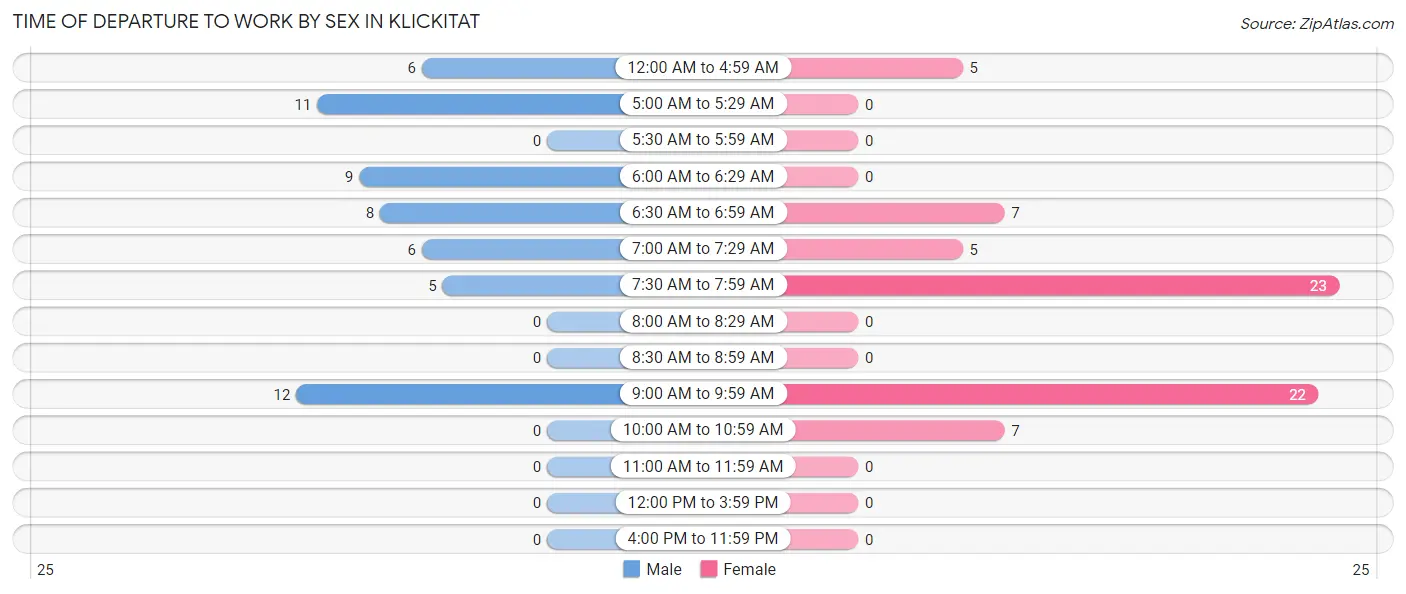
| Time of Departure | Male | Female |
| 12:00 AM to 4:59 AM | 6 (10.5%) | 5 (7.2%) |
| 5:00 AM to 5:29 AM | 11 (19.3%) | 0 (0.0%) |
| 5:30 AM to 5:59 AM | 0 (0.0%) | 0 (0.0%) |
| 6:00 AM to 6:29 AM | 9 (15.8%) | 0 (0.0%) |
| 6:30 AM to 6:59 AM | 8 (14.0%) | 7 (10.1%) |
| 7:00 AM to 7:29 AM | 6 (10.5%) | 5 (7.2%) |
| 7:30 AM to 7:59 AM | 5 (8.8%) | 23 (33.3%) |
| 8:00 AM to 8:29 AM | 0 (0.0%) | 0 (0.0%) |
| 8:30 AM to 8:59 AM | 0 (0.0%) | 0 (0.0%) |
| 9:00 AM to 9:59 AM | 12 (21.0%) | 22 (31.9%) |
| 10:00 AM to 10:59 AM | 0 (0.0%) | 7 (10.1%) |
| 11:00 AM to 11:59 AM | 0 (0.0%) | 0 (0.0%) |
| 12:00 PM to 3:59 PM | 0 (0.0%) | 0 (0.0%) |
| 4:00 PM to 11:59 PM | 0 (0.0%) | 0 (0.0%) |
| Total | 57 (100.0%) | 69 (100.0%) |
Housing Occupancy in Klickitat
Occupancy by Ownership in Klickitat
Of the total 132 dwellings in Klickitat, owner-occupied units account for 91 (68.9%), while renter-occupied units make up 41 (31.1%).
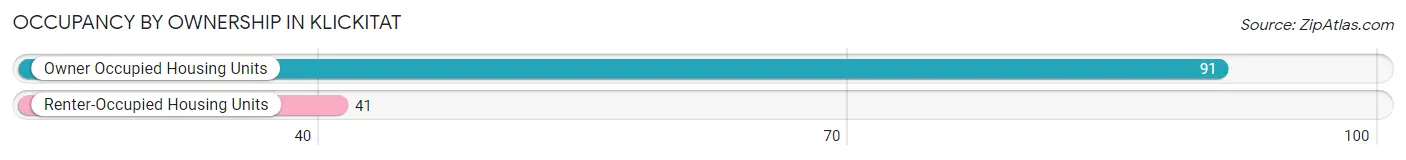
| Occupancy | # Housing Units | % Housing Units |
| Owner Occupied Housing Units | 91 | 68.9% |
| Renter-Occupied Housing Units | 41 | 31.1% |
| Total Occupied Housing Units | 132 | 100.0% |
Occupancy by Household Size in Klickitat
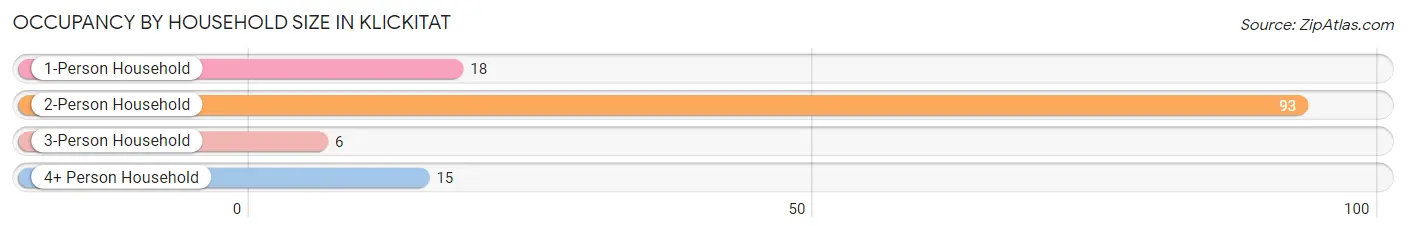
| Household Size | # Housing Units | % Housing Units |
| 1-Person Household | 18 | 13.6% |
| 2-Person Household | 93 | 70.5% |
| 3-Person Household | 6 | 4.5% |
| 4+ Person Household | 15 | 11.4% |
| Total Housing Units | 132 | 100.0% |
Occupancy by Ownership by Household Size in Klickitat
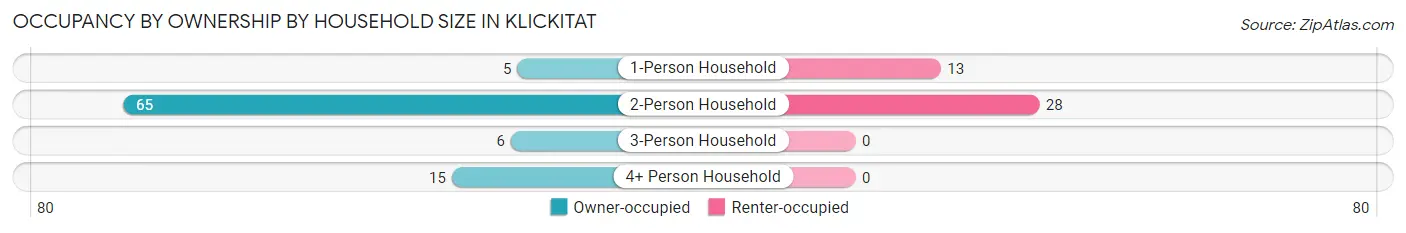
| Household Size | Owner-occupied | Renter-occupied |
| 1-Person Household | 5 (27.8%) | 13 (72.2%) |
| 2-Person Household | 65 (69.9%) | 28 (30.1%) |
| 3-Person Household | 6 (100.0%) | 0 (0.0%) |
| 4+ Person Household | 15 (100.0%) | 0 (0.0%) |
| Total Housing Units | 91 (68.9%) | 41 (31.1%) |
Occupancy by Educational Attainment in Klickitat
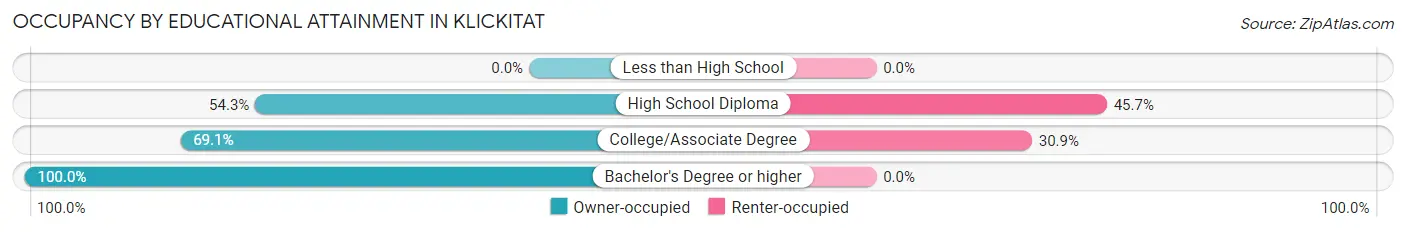
| Household Size | Owner-occupied | Renter-occupied |
| Less than High School | 0 (0.0%) | 0 (0.0%) |
| High School Diploma | 19 (54.3%) | 16 (45.7%) |
| College/Associate Degree | 56 (69.1%) | 25 (30.9%) |
| Bachelor's Degree or higher | 16 (100.0%) | 0 (0.0%) |
Occupancy by Age of Householder in Klickitat
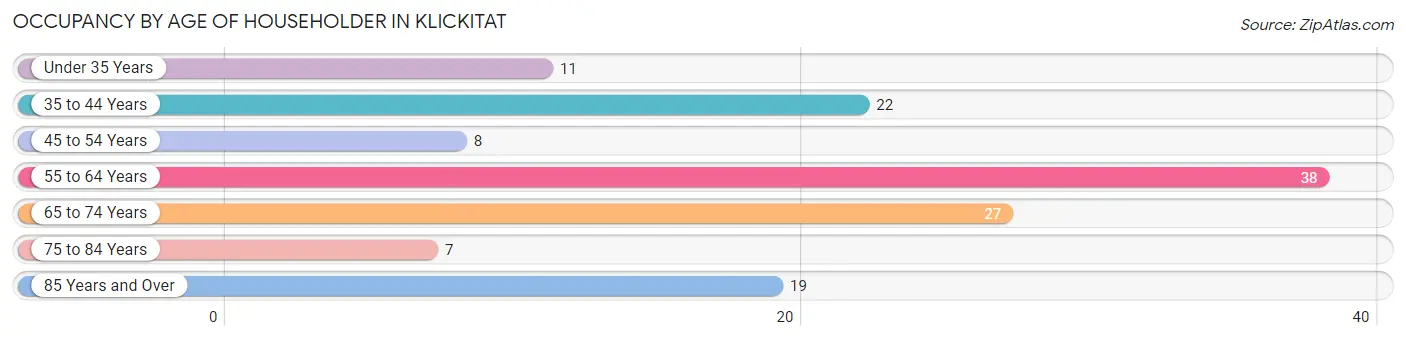
| Age Bracket | # Households | % Households |
| Under 35 Years | 11 | 8.3% |
| 35 to 44 Years | 22 | 16.7% |
| 45 to 54 Years | 8 | 6.1% |
| 55 to 64 Years | 38 | 28.8% |
| 65 to 74 Years | 27 | 20.4% |
| 75 to 84 Years | 7 | 5.3% |
| 85 Years and Over | 19 | 14.4% |
| Total | 132 | 100.0% |
Housing Finances in Klickitat
Median Income by Occupancy in Klickitat
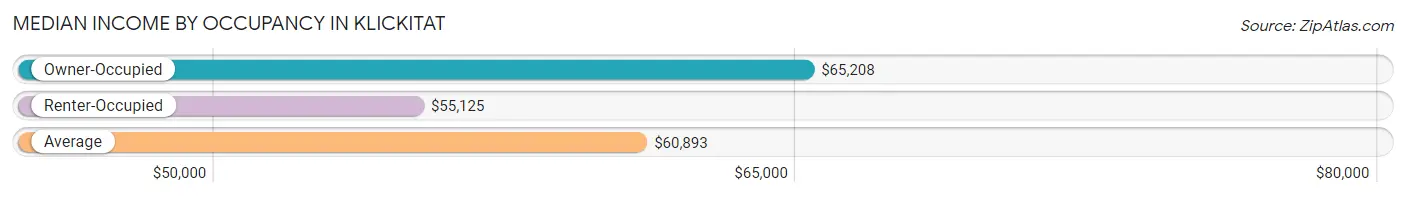
| Occupancy Type | # Households | Median Income |
| Owner-Occupied | 91 (68.9%) | $65,208 |
| Renter-Occupied | 41 (31.1%) | $55,125 |
| Average | 132 (100.0%) | $60,893 |
Occupancy by Householder Income Bracket in Klickitat
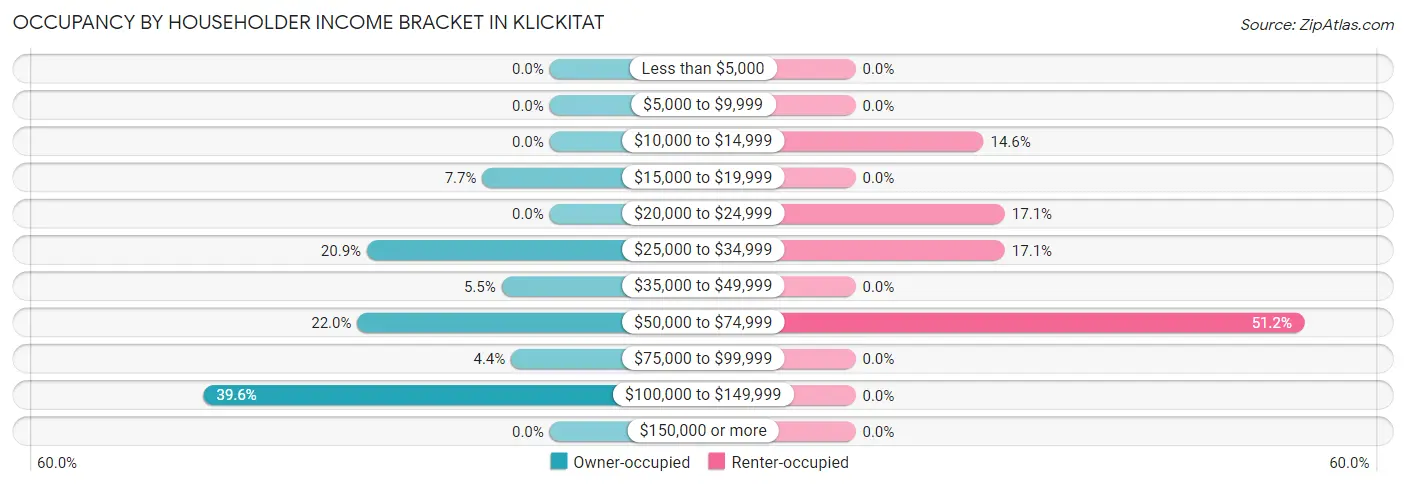
| Income Bracket | Owner-occupied | Renter-occupied |
| Less than $5,000 | 0 (0.0%) | 0 (0.0%) |
| $5,000 to $9,999 | 0 (0.0%) | 0 (0.0%) |
| $10,000 to $14,999 | 0 (0.0%) | 6 (14.6%) |
| $15,000 to $19,999 | 7 (7.7%) | 0 (0.0%) |
| $20,000 to $24,999 | 0 (0.0%) | 7 (17.1%) |
| $25,000 to $34,999 | 19 (20.9%) | 7 (17.1%) |
| $35,000 to $49,999 | 5 (5.5%) | 0 (0.0%) |
| $50,000 to $74,999 | 20 (22.0%) | 21 (51.2%) |
| $75,000 to $99,999 | 4 (4.4%) | 0 (0.0%) |
| $100,000 to $149,999 | 36 (39.6%) | 0 (0.0%) |
| $150,000 or more | 0 (0.0%) | 0 (0.0%) |
| Total | 91 (100.0%) | 41 (100.0%) |
Monthly Housing Cost Tiers in Klickitat
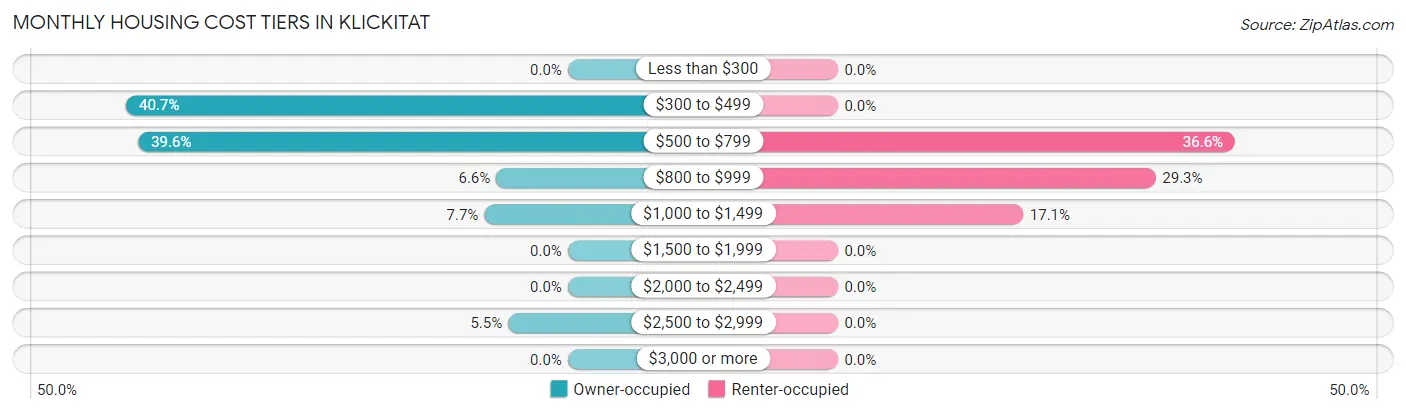
| Monthly Cost | Owner-occupied | Renter-occupied |
| Less than $300 | 0 (0.0%) | 0 (0.0%) |
| $300 to $499 | 37 (40.7%) | 0 (0.0%) |
| $500 to $799 | 36 (39.6%) | 15 (36.6%) |
| $800 to $999 | 6 (6.6%) | 12 (29.3%) |
| $1,000 to $1,499 | 7 (7.7%) | 7 (17.1%) |
| $1,500 to $1,999 | 0 (0.0%) | 0 (0.0%) |
| $2,000 to $2,499 | 0 (0.0%) | 0 (0.0%) |
| $2,500 to $2,999 | 5 (5.5%) | 0 (0.0%) |
| $3,000 or more | 0 (0.0%) | 0 (0.0%) |
| Total | 91 (100.0%) | 41 (100.0%) |
Physical Housing Characteristics in Klickitat
Housing Structures in Klickitat
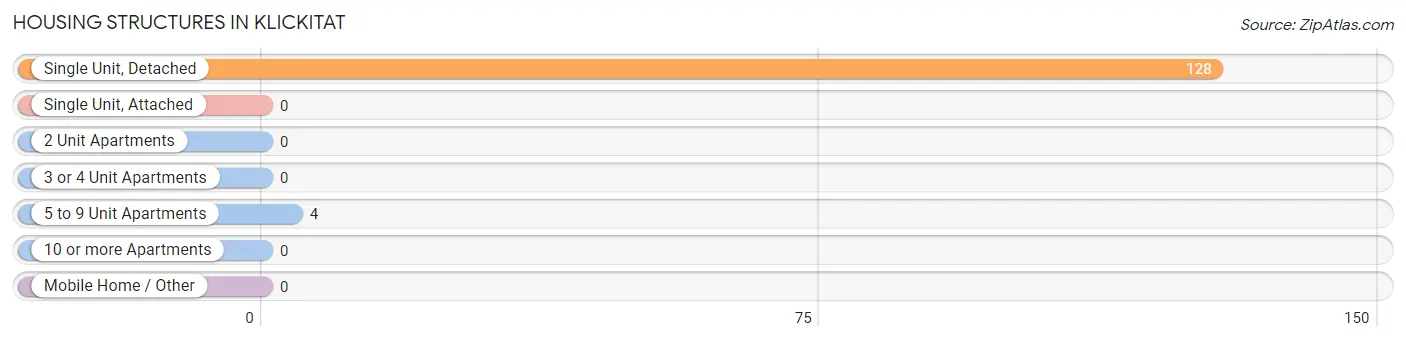
| Structure Type | # Housing Units | % Housing Units |
| Single Unit, Detached | 128 | 97.0% |
| Single Unit, Attached | 0 | 0.0% |
| 2 Unit Apartments | 0 | 0.0% |
| 3 or 4 Unit Apartments | 0 | 0.0% |
| 5 to 9 Unit Apartments | 4 | 3.0% |
| 10 or more Apartments | 0 | 0.0% |
| Mobile Home / Other | 0 | 0.0% |
| Total | 132 | 100.0% |
Housing Structures by Occupancy in Klickitat
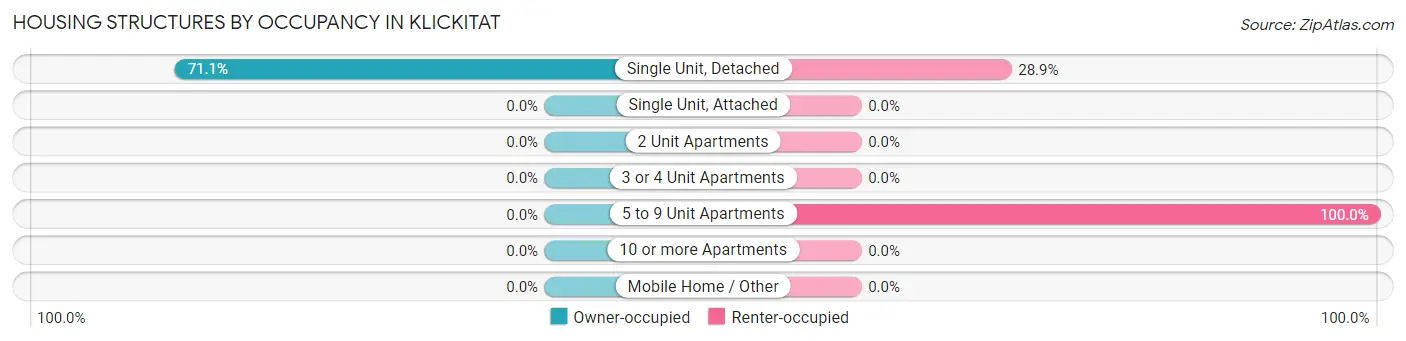
| Structure Type | Owner-occupied | Renter-occupied |
| Single Unit, Detached | 91 (71.1%) | 37 (28.9%) |
| Single Unit, Attached | 0 (0.0%) | 0 (0.0%) |
| 2 Unit Apartments | 0 (0.0%) | 0 (0.0%) |
| 3 or 4 Unit Apartments | 0 (0.0%) | 0 (0.0%) |
| 5 to 9 Unit Apartments | 0 (0.0%) | 4 (100.0%) |
| 10 or more Apartments | 0 (0.0%) | 0 (0.0%) |
| Mobile Home / Other | 0 (0.0%) | 0 (0.0%) |
| Total | 91 (68.9%) | 41 (31.1%) |
Housing Structures by Number of Rooms in Klickitat
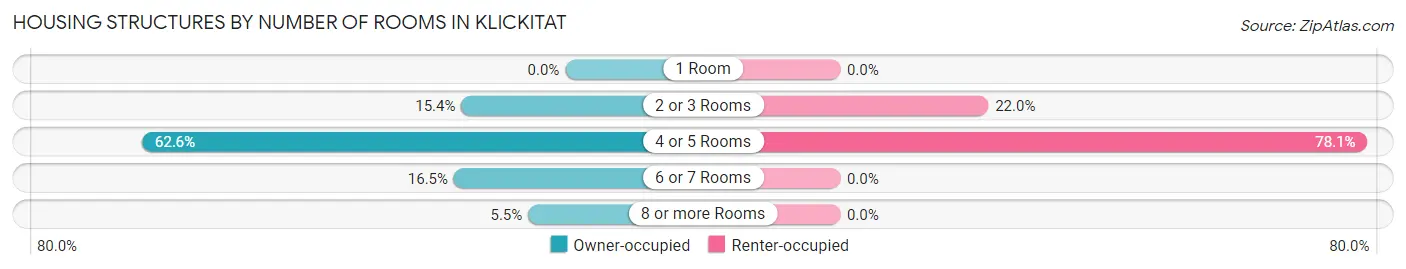
| Number of Rooms | Owner-occupied | Renter-occupied |
| 1 Room | 0 (0.0%) | 0 (0.0%) |
| 2 or 3 Rooms | 14 (15.4%) | 9 (22.0%) |
| 4 or 5 Rooms | 57 (62.6%) | 32 (78.0%) |
| 6 or 7 Rooms | 15 (16.5%) | 0 (0.0%) |
| 8 or more Rooms | 5 (5.5%) | 0 (0.0%) |
| Total | 91 (100.0%) | 41 (100.0%) |
Housing Structure by Heating Type in Klickitat
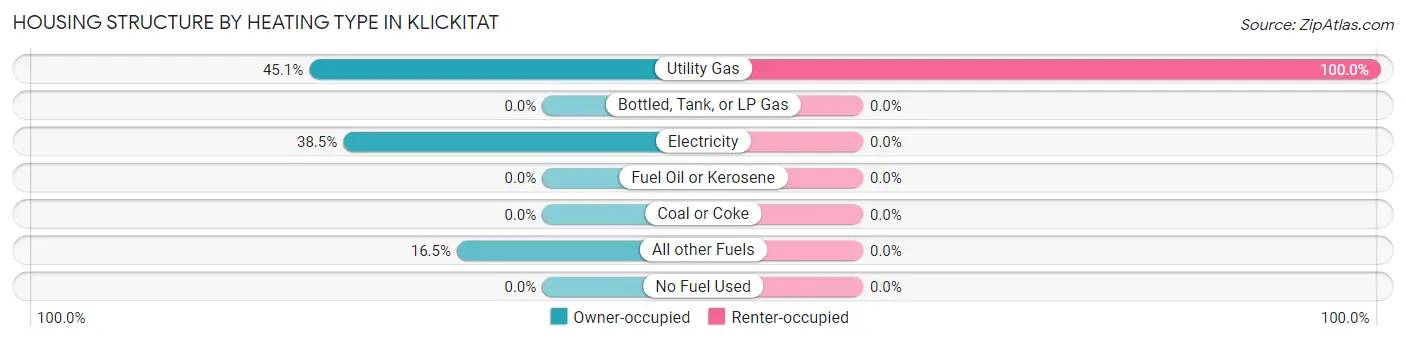
| Heating Type | Owner-occupied | Renter-occupied |
| Utility Gas | 41 (45.1%) | 41 (100.0%) |
| Bottled, Tank, or LP Gas | 0 (0.0%) | 0 (0.0%) |
| Electricity | 35 (38.5%) | 0 (0.0%) |
| Fuel Oil or Kerosene | 0 (0.0%) | 0 (0.0%) |
| Coal or Coke | 0 (0.0%) | 0 (0.0%) |
| All other Fuels | 15 (16.5%) | 0 (0.0%) |
| No Fuel Used | 0 (0.0%) | 0 (0.0%) |
| Total | 91 (100.0%) | 41 (100.0%) |
Household Vehicle Usage in Klickitat
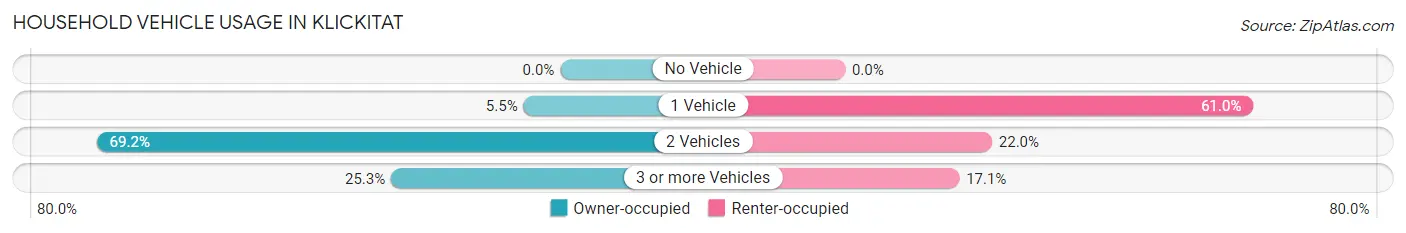
| Vehicles per Household | Owner-occupied | Renter-occupied |
| No Vehicle | 0 (0.0%) | 0 (0.0%) |
| 1 Vehicle | 5 (5.5%) | 25 (61.0%) |
| 2 Vehicles | 63 (69.2%) | 9 (22.0%) |
| 3 or more Vehicles | 23 (25.3%) | 7 (17.1%) |
| Total | 91 (100.0%) | 41 (100.0%) |
Real Estate & Mortgages in Klickitat
Real Estate and Mortgage Overview in Klickitat
| Characteristic | Without Mortgage | With Mortgage |
| Housing Units | 57 | 34 |
| Median Property Value | $171,400 | $138,500 |
| Median Household Income | - | - |
| Monthly Housing Costs | $439 | $0 |
| Real Estate Taxes | $1,098 | $7 |
Property Value by Mortgage Status in Klickitat
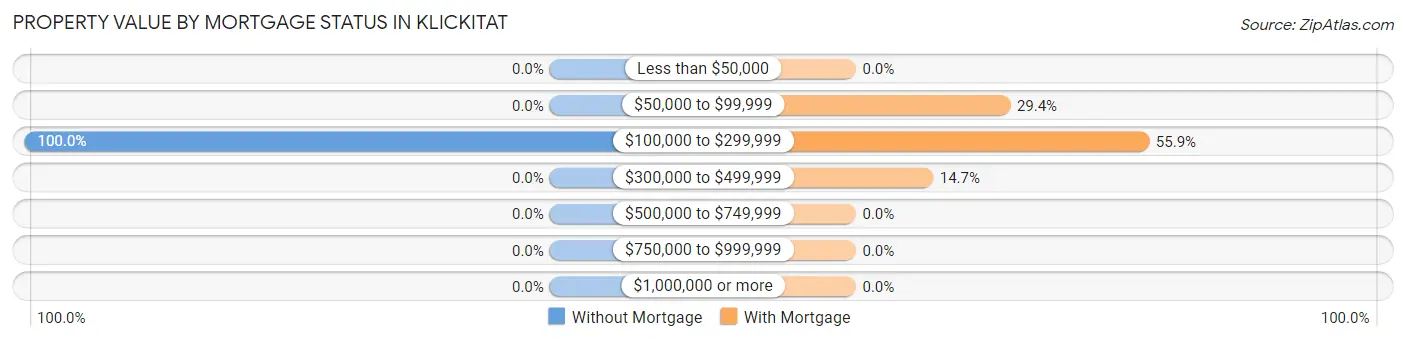
| Property Value | Without Mortgage | With Mortgage |
| Less than $50,000 | 0 (0.0%) | 0 (0.0%) |
| $50,000 to $99,999 | 0 (0.0%) | 10 (29.4%) |
| $100,000 to $299,999 | 57 (100.0%) | 19 (55.9%) |
| $300,000 to $499,999 | 0 (0.0%) | 5 (14.7%) |
| $500,000 to $749,999 | 0 (0.0%) | 0 (0.0%) |
| $750,000 to $999,999 | 0 (0.0%) | 0 (0.0%) |
| $1,000,000 or more | 0 (0.0%) | 0 (0.0%) |
| Total | 57 (100.0%) | 34 (100.0%) |
Household Income by Mortgage Status in Klickitat
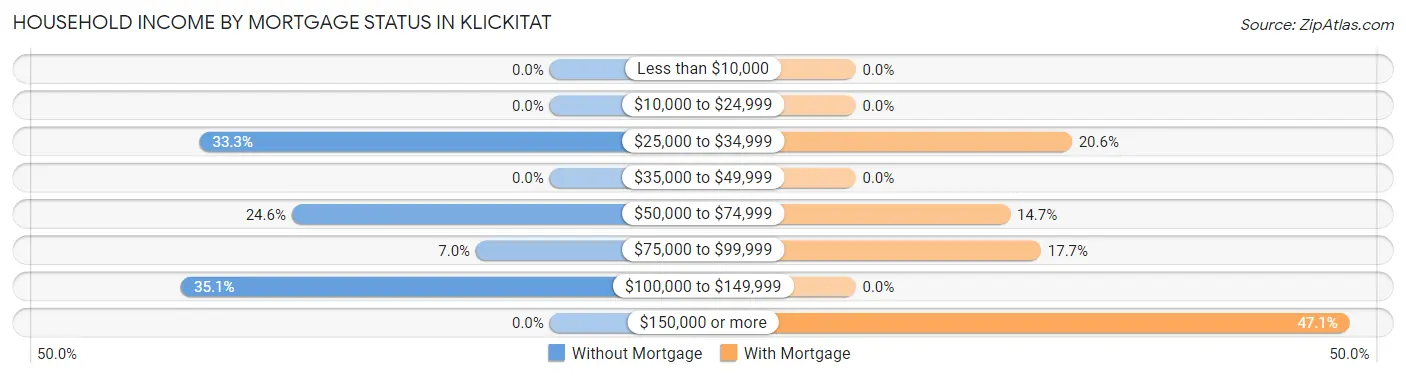
| Household Income | Without Mortgage | With Mortgage |
| Less than $10,000 | 0 (0.0%) | 0 (0.0%) |
| $10,000 to $24,999 | 0 (0.0%) | 0 (0.0%) |
| $25,000 to $34,999 | 19 (33.3%) | 7 (20.6%) |
| $35,000 to $49,999 | 0 (0.0%) | 0 (0.0%) |
| $50,000 to $74,999 | 14 (24.6%) | 5 (14.7%) |
| $75,000 to $99,999 | 4 (7.0%) | 6 (17.6%) |
| $100,000 to $149,999 | 20 (35.1%) | 0 (0.0%) |
| $150,000 or more | 0 (0.0%) | 16 (47.1%) |
| Total | 57 (100.0%) | 34 (100.0%) |
Property Value to Household Income Ratio in Klickitat
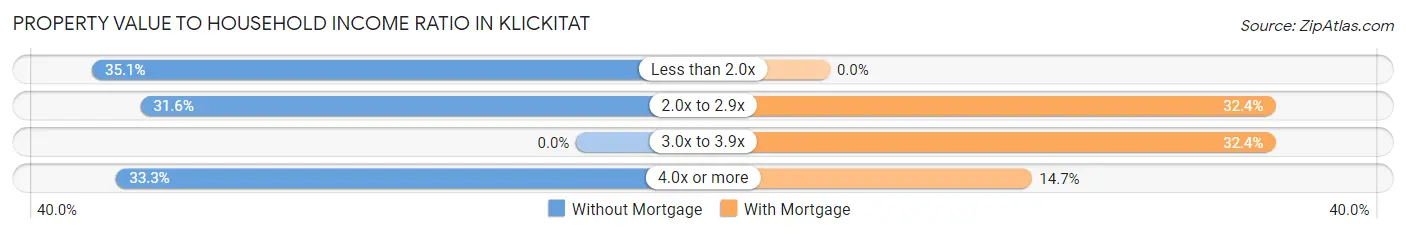
| Value-to-Income Ratio | Without Mortgage | With Mortgage |
| Less than 2.0x | 20 (35.1%) | 0 (0.0%) |
| 2.0x to 2.9x | 18 (31.6%) | 11 (32.4%) |
| 3.0x to 3.9x | 0 (0.0%) | 11 (32.4%) |
| 4.0x or more | 19 (33.3%) | 5 (14.7%) |
| Total | 57 (100.0%) | 34 (100.0%) |
Real Estate Taxes by Mortgage Status in Klickitat
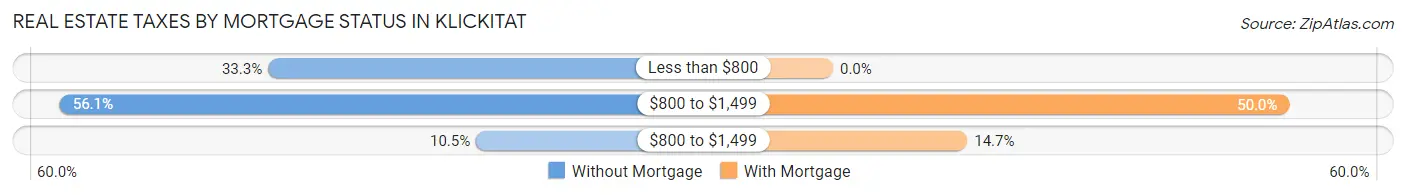
| Property Taxes | Without Mortgage | With Mortgage |
| Less than $800 | 19 (33.3%) | 0 (0.0%) |
| $800 to $1,499 | 32 (56.1%) | 17 (50.0%) |
| $800 to $1,499 | 6 (10.5%) | 5 (14.7%) |
| Total | 57 (100.0%) | 34 (100.0%) |
Health & Disability in Klickitat
Health Insurance Coverage by Age in Klickitat
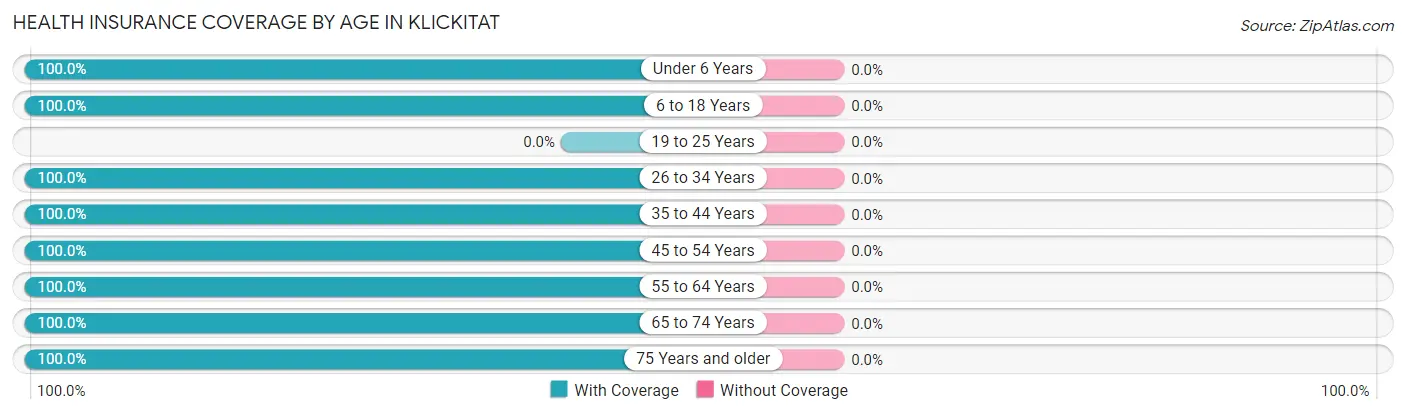
| Age Bracket | With Coverage | Without Coverage |
| Under 6 Years | 18 (100.0%) | 0 (0.0%) |
| 6 to 18 Years | 33 (100.0%) | 0 (0.0%) |
| 19 to 25 Years | 0 (0.0%) | 0 (0.0%) |
| 26 to 34 Years | 63 (100.0%) | 0 (0.0%) |
| 35 to 44 Years | 37 (100.0%) | 0 (0.0%) |
| 45 to 54 Years | 38 (100.0%) | 0 (0.0%) |
| 55 to 64 Years | 67 (100.0%) | 0 (0.0%) |
| 65 to 74 Years | 53 (100.0%) | 0 (0.0%) |
| 75 Years and older | 26 (100.0%) | 0 (0.0%) |
| Total | 335 (100.0%) | 0 (0.0%) |
Health Insurance Coverage by Citizenship Status in Klickitat
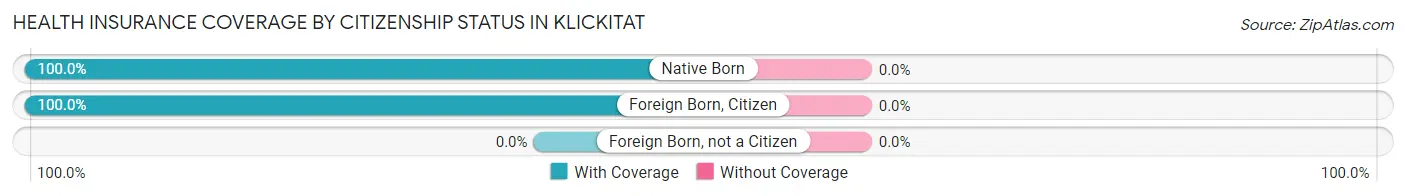
| Citizenship Status | With Coverage | Without Coverage |
| Native Born | 18 (100.0%) | 0 (0.0%) |
| Foreign Born, Citizen | 33 (100.0%) | 0 (0.0%) |
| Foreign Born, not a Citizen | 0 (0.0%) | 0 (0.0%) |
Health Insurance Coverage by Household Income in Klickitat
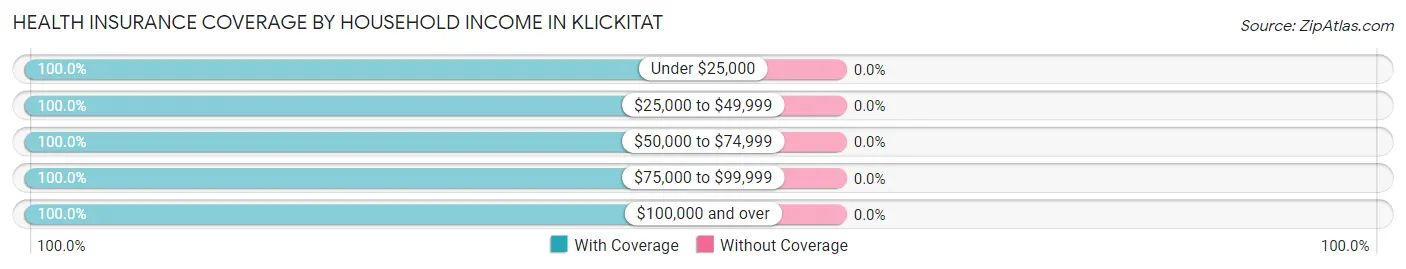
| Household Income | With Coverage | Without Coverage |
| Under $25,000 | 26 (100.0%) | 0 (0.0%) |
| $25,000 to $49,999 | 52 (100.0%) | 0 (0.0%) |
| $50,000 to $74,999 | 106 (100.0%) | 0 (0.0%) |
| $75,000 to $99,999 | 33 (100.0%) | 0 (0.0%) |
| $100,000 and over | 118 (100.0%) | 0 (0.0%) |
Public vs Private Health Insurance Coverage by Age in Klickitat
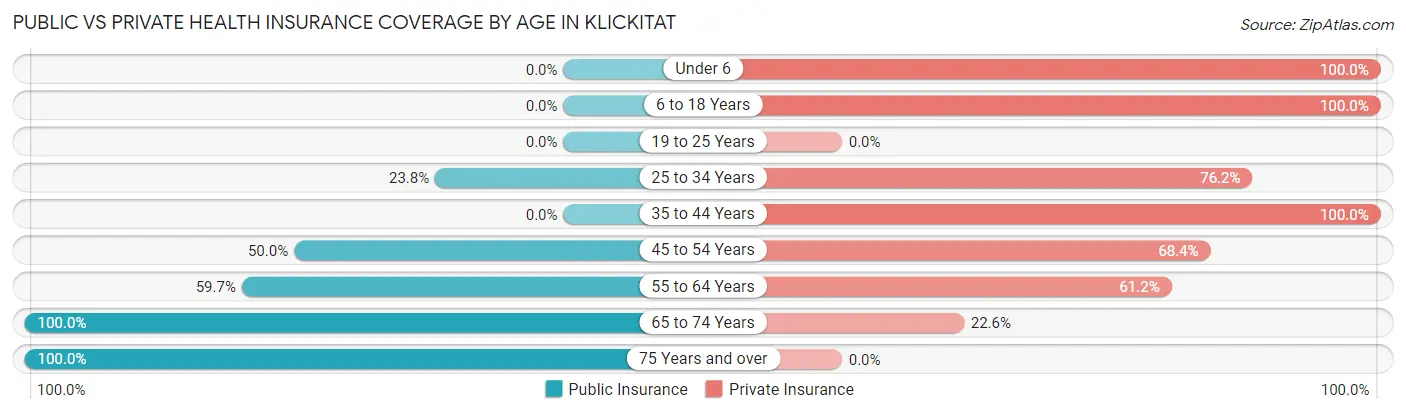
| Age Bracket | Public Insurance | Private Insurance |
| Under 6 | 0 (0.0%) | 18 (100.0%) |
| 6 to 18 Years | 0 (0.0%) | 33 (100.0%) |
| 19 to 25 Years | 0 (0.0%) | 0 (0.0%) |
| 25 to 34 Years | 15 (23.8%) | 48 (76.2%) |
| 35 to 44 Years | 0 (0.0%) | 37 (100.0%) |
| 45 to 54 Years | 19 (50.0%) | 26 (68.4%) |
| 55 to 64 Years | 40 (59.7%) | 41 (61.2%) |
| 65 to 74 Years | 53 (100.0%) | 12 (22.6%) |
| 75 Years and over | 26 (100.0%) | 0 (0.0%) |
| Total | 153 (45.7%) | 215 (64.2%) |
Disability Status by Sex by Age in Klickitat
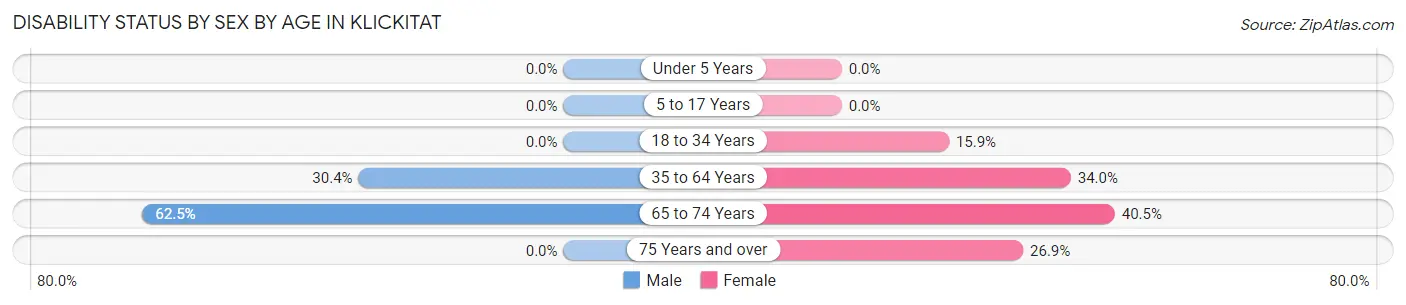
| Age Bracket | Male | Female |
| Under 5 Years | 0 (0.0%) | 0 (0.0%) |
| 5 to 17 Years | 0 (0.0%) | 0 (0.0%) |
| 18 to 34 Years | 0 (0.0%) | 7 (15.9%) |
| 35 to 64 Years | 28 (30.4%) | 17 (34.0%) |
| 65 to 74 Years | 10 (62.5%) | 15 (40.5%) |
| 75 Years and over | 0 (0.0%) | 7 (26.9%) |
Disability Class by Sex by Age in Klickitat
Disability Class: Hearing Difficulty
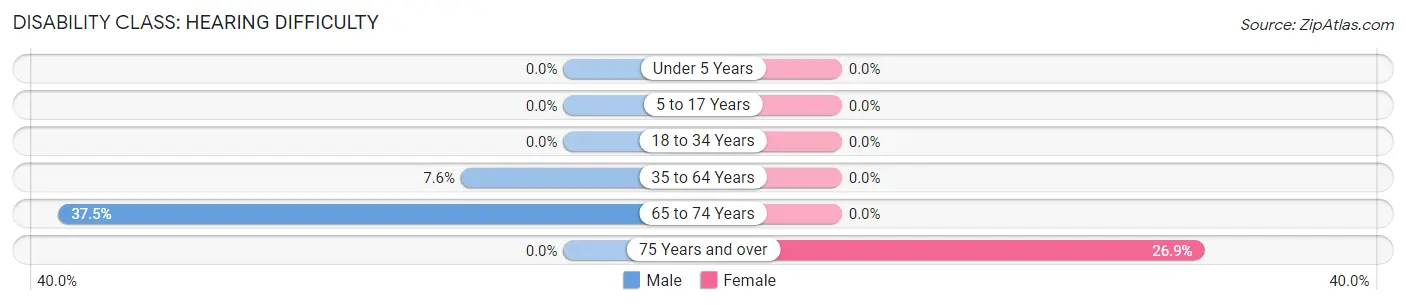
| Age Bracket | Male | Female |
| Under 5 Years | 0 (0.0%) | 0 (0.0%) |
| 5 to 17 Years | 0 (0.0%) | 0 (0.0%) |
| 18 to 34 Years | 0 (0.0%) | 0 (0.0%) |
| 35 to 64 Years | 7 (7.6%) | 0 (0.0%) |
| 65 to 74 Years | 6 (37.5%) | 0 (0.0%) |
| 75 Years and over | 0 (0.0%) | 7 (26.9%) |
Disability Class: Vision Difficulty
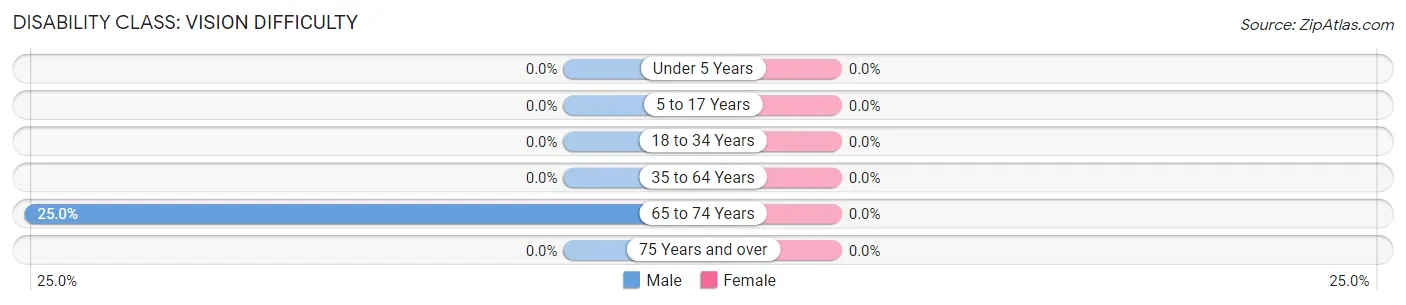
| Age Bracket | Male | Female |
| Under 5 Years | 0 (0.0%) | 0 (0.0%) |
| 5 to 17 Years | 0 (0.0%) | 0 (0.0%) |
| 18 to 34 Years | 0 (0.0%) | 0 (0.0%) |
| 35 to 64 Years | 0 (0.0%) | 0 (0.0%) |
| 65 to 74 Years | 4 (25.0%) | 0 (0.0%) |
| 75 Years and over | 0 (0.0%) | 0 (0.0%) |
Disability Class: Cognitive Difficulty
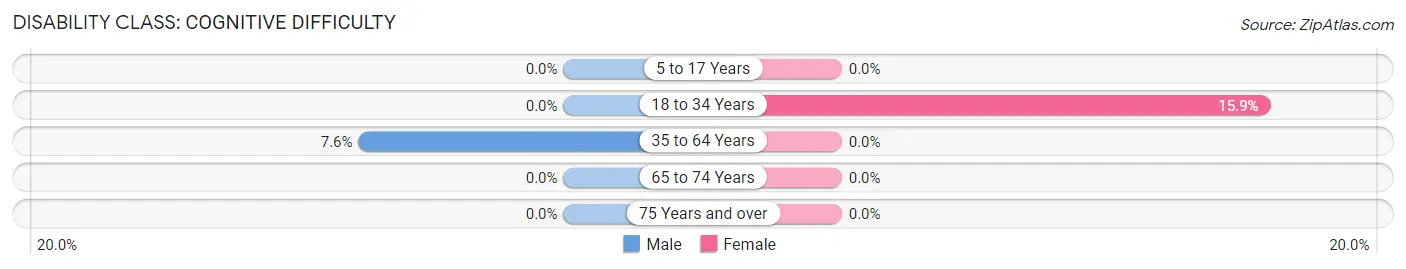
| Age Bracket | Male | Female |
| 5 to 17 Years | 0 (0.0%) | 0 (0.0%) |
| 18 to 34 Years | 0 (0.0%) | 7 (15.9%) |
| 35 to 64 Years | 7 (7.6%) | 0 (0.0%) |
| 65 to 74 Years | 0 (0.0%) | 0 (0.0%) |
| 75 Years and over | 0 (0.0%) | 0 (0.0%) |
Disability Class: Ambulatory Difficulty
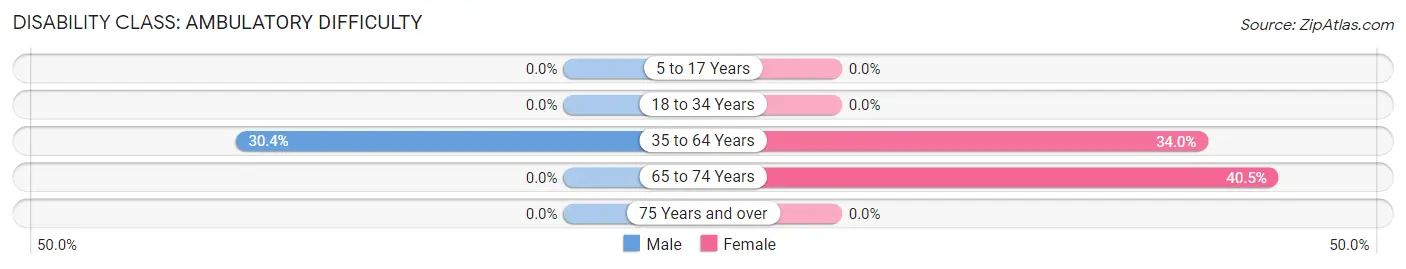
| Age Bracket | Male | Female |
| 5 to 17 Years | 0 (0.0%) | 0 (0.0%) |
| 18 to 34 Years | 0 (0.0%) | 0 (0.0%) |
| 35 to 64 Years | 28 (30.4%) | 17 (34.0%) |
| 65 to 74 Years | 0 (0.0%) | 15 (40.5%) |
| 75 Years and over | 0 (0.0%) | 0 (0.0%) |
Disability Class: Self-Care Difficulty
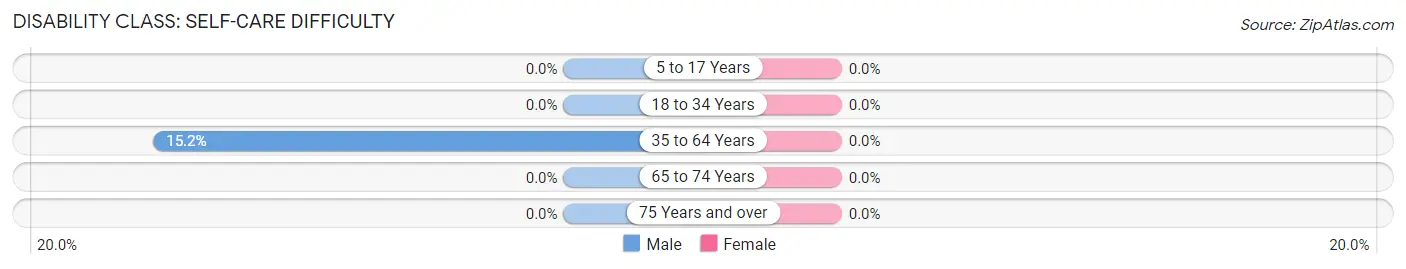
| Age Bracket | Male | Female |
| 5 to 17 Years | 0 (0.0%) | 0 (0.0%) |
| 18 to 34 Years | 0 (0.0%) | 0 (0.0%) |
| 35 to 64 Years | 14 (15.2%) | 0 (0.0%) |
| 65 to 74 Years | 0 (0.0%) | 0 (0.0%) |
| 75 Years and over | 0 (0.0%) | 0 (0.0%) |
Technology Access in Klickitat
Computing Device Access in Klickitat
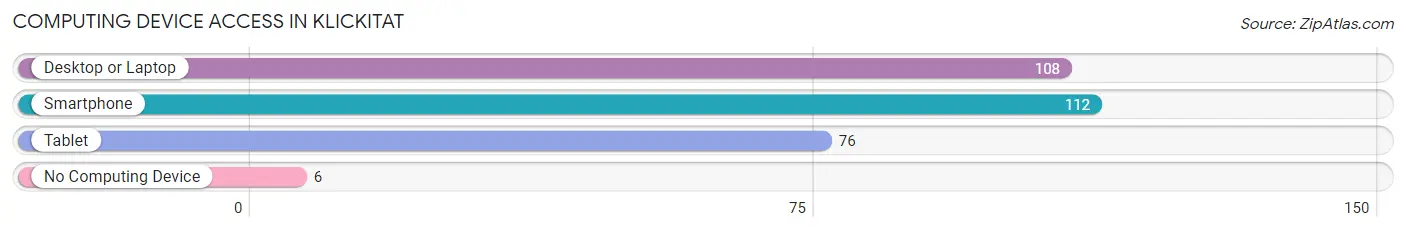
| Device Type | # Households | % Households |
| Desktop or Laptop | 108 | 81.8% |
| Smartphone | 112 | 84.9% |
| Tablet | 76 | 57.6% |
| No Computing Device | 6 | 4.5% |
| Total | 132 | 100.0% |
Internet Access in Klickitat
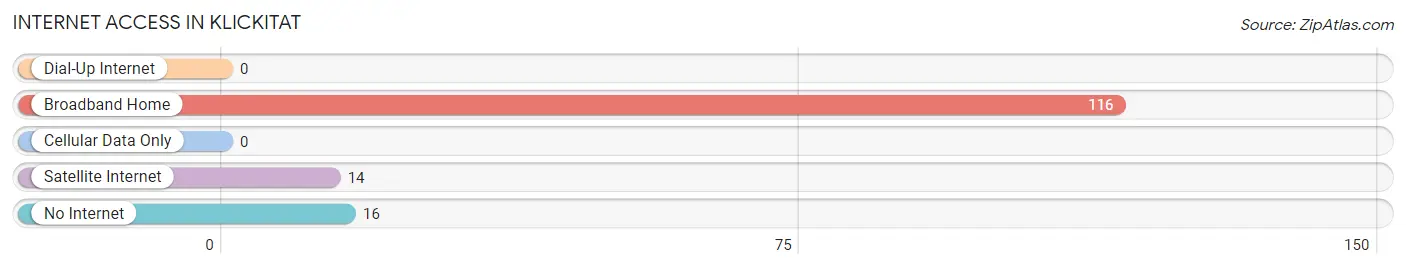
| Internet Type | # Households | % Households |
| Dial-Up Internet | 0 | 0.0% |
| Broadband Home | 116 | 87.9% |
| Cellular Data Only | 0 | 0.0% |
| Satellite Internet | 14 | 10.6% |
| No Internet | 16 | 12.1% |
| Total | 132 | 100.0% |
Klickitat Summary
Klickitat is a county located in the U.S. state of Washington. It is located in the south-central part of the state, and is bordered by the Columbia River to the north, the Yakima River to the east, and the Klickitat River to the south. The county seat is Goldendale, and the largest city is White Salmon. The county was created in 1859 and named after the Klickitat tribe of Native Americans.
History
The Klickitat County area has been inhabited by Native Americans for thousands of years. The Klickitat tribe, a subgroup of the Yakama Nation, lived in the area for centuries before the arrival of European settlers. The first Europeans to explore the area were members of the Lewis and Clark Expedition, who passed through in 1805.
The first permanent settlers arrived in the area in the early 1860s. The county was officially established in 1859, and the county seat was established in Goldendale in 1864. The county was named after the Klickitat tribe, which had been living in the area for centuries.
The county experienced rapid growth in the late 19th and early 20th centuries, as settlers moved into the area to take advantage of the fertile soil and abundant natural resources. The county was home to several small towns, including White Salmon, Lyle, and Trout Lake.
Geography
Klickitat County is located in the south-central part of Washington state. It is bordered by the Columbia River to the north, the Yakima River to the east, and the Klickitat River to the south. The county covers an area of 1,890 square miles, and is home to several mountain ranges, including the Cascade Range, the Columbia River Gorge, and the Klickitat Mountains.
The county is home to several lakes, including Lake Cle Elum, Lake Chelan, and Lake Wenatchee. The county also contains several rivers, including the Klickitat River, the White Salmon River, and the Yakima River.
Economy
Klickitat County has a diverse economy, with a mix of agriculture, manufacturing, and tourism. The county is home to several large agricultural operations, including apple orchards, vineyards, and livestock farms. The county is also home to several manufacturing companies, including a paper mill in White Salmon and a lumber mill in Goldendale.
Tourism is an important part of the county’s economy, with visitors coming to the area to enjoy the natural beauty of the Columbia River Gorge and the Cascade Mountains. The county is also home to several popular outdoor recreation areas, including the Columbia River Gorge National Scenic Area, the Gifford Pinchot National Forest, and the Yakima River Canyon.
Demographics
As of the 2010 census, Klickitat County had a population of 20,318. The population was spread out, with 48.3% male and 51.7% female. The median age was 43.2 years.
The racial makeup of the county was 92.2% White, 0.7% African American, 1.2% Native American, 0.5% Asian, 0.1% Pacific Islander, 3.2% from other races, and 2.1% from two or more races. Hispanic or Latino of any race were 6.2% of the population.
The median household income was $41,945, and the median family income was $50,945. The per capita income was $21,945. About 11.2% of families and 15.2% of the population were below the poverty line, including 22.2% of those under age 18 and 8.2% of those age 65 or over.
Klickitat County is a rural county with a diverse economy and a rich history. The county is home to several small towns, and is a popular destination for outdoor recreation. The county is also home to several large agricultural operations, manufacturing companies, and tourist attractions. The county has a population of over 20,000 people, and is a great place to live and work.
Common Questions
What is Per Capita Income in Klickitat?
Per Capita income in Klickitat is $27,538.
What is the Median Family Income in Klickitat?
Median Family Income in Klickitat is $61,964.
What is the Median Household income in Klickitat?
Median Household Income in Klickitat is $60,893.
What is Income or Wage Gap in Klickitat?
Income or Wage Gap in Klickitat is 16.3%.
Women in Klickitat earn 83.7 cents for every dollar earned by a man.
What is Inequality or Gini Index in Klickitat?
Inequality or Gini Index in Klickitat is 0.33.
What is the Total Population of Klickitat?
Total Population of Klickitat is 335.
What is the Total Male Population of Klickitat?
Total Male Population of Klickitat is 143.
What is the Total Female Population of Klickitat?
Total Female Population of Klickitat is 192.
What is the Ratio of Males per 100 Females in Klickitat?
There are 74.48 Males per 100 Females in Klickitat.
What is the Ratio of Females per 100 Males in Klickitat?
There are 134.27 Females per 100 Males in Klickitat.
What is the Median Population Age in Klickitat?
Median Population Age in Klickitat is 50.7 Years.
What is the Average Family Size in Klickitat
Average Family Size in Klickitat is 2.8 People.
What is the Average Household Size in Klickitat
Average Household Size in Klickitat is 2.5 People.
How Large is the Labor Force in Klickitat?
There are 144 People in the Labor Forcein in Klickitat.
What is the Percentage of People in the Labor Force in Klickitat?
50.7% of People are in the Labor Force in Klickitat.
What is the Unemployment Rate in Klickitat?
Unemployment Rate in Klickitat is 12.5%.