Indianola, WA Map & Demographics
Indianola Map
Indianola Overview
$46,291
PER CAPITA INCOME
$110,625
AVG FAMILY INCOME
$91,759
AVG HOUSEHOLD INCOME
29.7%
WAGE / INCOME GAP [ % ]
70.3¢/ $1
WAGE / INCOME GAP [ $ ]
$14,974
FAMILY INCOME DEFICIT
0.40
INEQUALITY / GINI INDEX
3,553
TOTAL POPULATION
1,777
MALE POPULATION
1,776
FEMALE POPULATION
100.06
MALES / 100 FEMALES
99.94
FEMALES / 100 MALES
44.1
MEDIAN AGE
2.9
AVG FAMILY SIZE
2.4
AVG HOUSEHOLD SIZE
1,839
LABOR FORCE [ PEOPLE ]
62.0%
PERCENT IN LABOR FORCE
4.8%
UNEMPLOYMENT RATE
Indianola Zip Codes
Income in Indianola
Income Overview in Indianola
Per Capita Income in Indianola is $46,291, while median incomes of families and households are $110,625 and $91,759 respectively.
| Characteristic | Number | Measure |
| Per Capita Income | 3,553 | $46,291 |
| Median Family Income | 1,001 | $110,625 |
| Mean Family Income | 1,001 | $125,675 |
| Median Household Income | 1,474 | $91,759 |
| Mean Household Income | 1,474 | $108,301 |
| Income Deficit | 1,001 | $14,974 |
| Wage / Income Gap (%) | 3,553 | 29.66% |
| Wage / Income Gap ($) | 3,553 | 70.34¢ per $1 |
| Gini / Inequality Index | 3,553 | 0.40 |
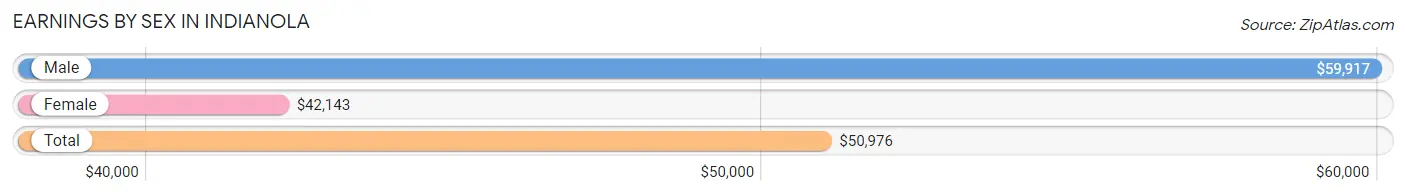
Earnings by Sex in Indianola
Average Earnings in Indianola are $50,976, $59,917 for men and $42,143 for women, a difference of 29.7%.
| Sex | Number | Average Earnings |
| Male | 1,028 (53.4%) | $59,917 |
| Female | 898 (46.6%) | $42,143 |
| Total | 1,926 (100.0%) | $50,976 |
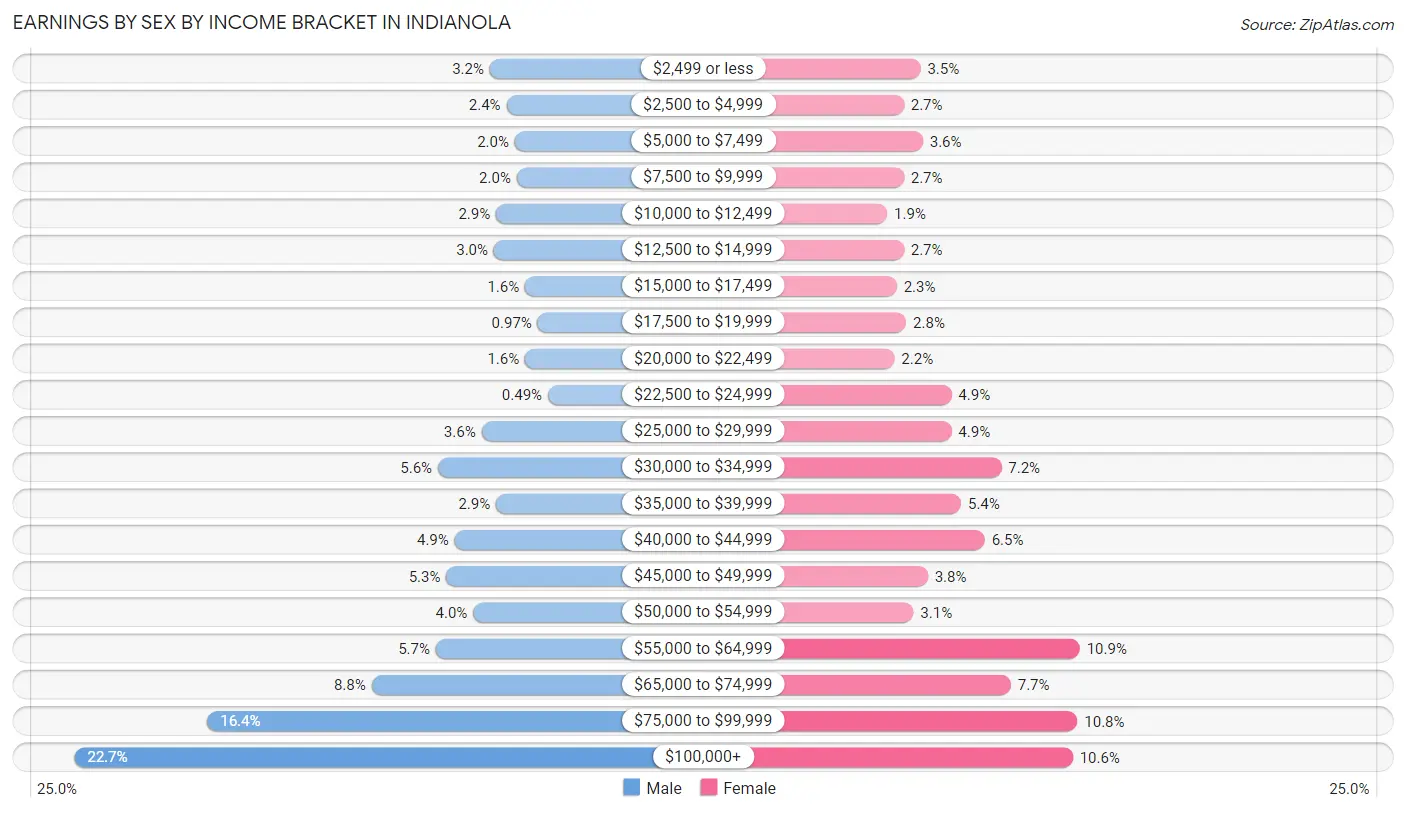
Earnings by Sex by Income Bracket in Indianola
The most common earnings brackets in Indianola are $100,000+ for men (233 | 22.7%) and $55,000 to $64,999 for women (98 | 10.9%).
| Income | Male | Female |
| $2,499 or less | 33 (3.2%) | 31 (3.5%) |
| $2,500 to $4,999 | 25 (2.4%) | 24 (2.7%) |
| $5,000 to $7,499 | 21 (2.0%) | 32 (3.6%) |
| $7,500 to $9,999 | 20 (1.9%) | 24 (2.7%) |
| $10,000 to $12,499 | 30 (2.9%) | 17 (1.9%) |
| $12,500 to $14,999 | 31 (3.0%) | 24 (2.7%) |
| $15,000 to $17,499 | 16 (1.6%) | 21 (2.3%) |
| $17,500 to $19,999 | 10 (1.0%) | 25 (2.8%) |
| $20,000 to $22,499 | 16 (1.6%) | 20 (2.2%) |
| $22,500 to $24,999 | 5 (0.5%) | 44 (4.9%) |
| $25,000 to $29,999 | 37 (3.6%) | 44 (4.9%) |
| $30,000 to $34,999 | 58 (5.6%) | 65 (7.2%) |
| $35,000 to $39,999 | 30 (2.9%) | 48 (5.3%) |
| $40,000 to $44,999 | 50 (4.9%) | 58 (6.5%) |
| $45,000 to $49,999 | 54 (5.2%) | 34 (3.8%) |
| $50,000 to $54,999 | 41 (4.0%) | 28 (3.1%) |
| $55,000 to $64,999 | 59 (5.7%) | 98 (10.9%) |
| $65,000 to $74,999 | 90 (8.7%) | 69 (7.7%) |
| $75,000 to $99,999 | 169 (16.4%) | 97 (10.8%) |
| $100,000+ | 233 (22.7%) | 95 (10.6%) |
| Total | 1,028 (100.0%) | 898 (100.0%) |
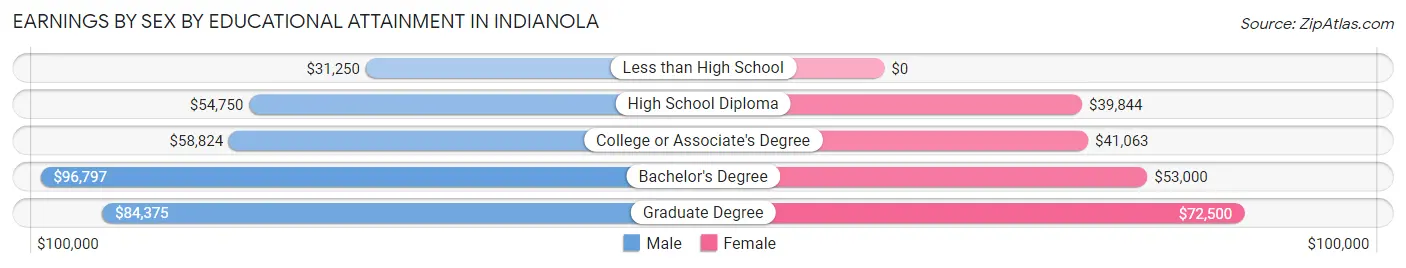
Earnings by Sex by Educational Attainment in Indianola
Average earnings in Indianola are $69,471 for men and $47,500 for women, a difference of 31.6%. Men with an educational attainment of bachelor's degree enjoy the highest average annual earnings of $96,797, while those with less than high school education earn the least with $31,250. Women with an educational attainment of graduate degree earn the most with the average annual earnings of $72,500, while those with high school diploma education have the smallest earnings of $39,844.
| Educational Attainment | Male Income | Female Income |
| Less than High School | $31,250 | $0 |
| High School Diploma | $54,750 | $39,844 |
| College or Associate's Degree | $58,824 | $41,063 |
| Bachelor's Degree | $96,797 | $53,000 |
| Graduate Degree | $84,375 | $72,500 |
| Total | $69,471 | $47,500 |
Family Income in Indianola
Family Income Brackets in Indianola
According to the Indianola family income data, there are 264 families falling into the $100,000 to $149,999 income range, which is the most common income bracket and makes up 26.4% of all families. Conversely, the $15,000 to $24,999 income bracket is the least frequent group with only 12 families (1.2%) belonging to this category.
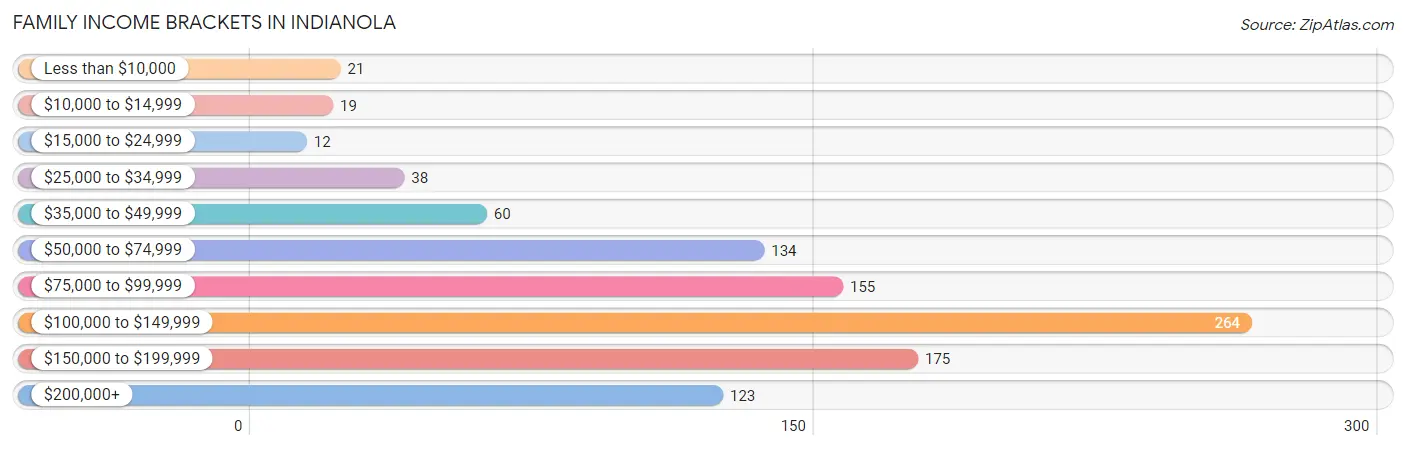
| Income Bracket | # Families | % Families |
| Less than $10,000 | 21 | 2.1% |
| $10,000 to $14,999 | 19 | 1.9% |
| $15,000 to $24,999 | 12 | 1.2% |
| $25,000 to $34,999 | 38 | 3.8% |
| $35,000 to $49,999 | 60 | 6.0% |
| $50,000 to $74,999 | 134 | 13.4% |
| $75,000 to $99,999 | 155 | 15.5% |
| $100,000 to $149,999 | 264 | 26.4% |
| $150,000 to $199,999 | 175 | 17.5% |
| $200,000+ | 123 | 12.3% |
Family Income by Famaliy Size in Indianola
7+ person families (12 | 1.2%) account for the highest median family income in Indianola with $166,250 per family, while 2-person families (542 | 54.1%) have the highest median income of $53,125 per family member.
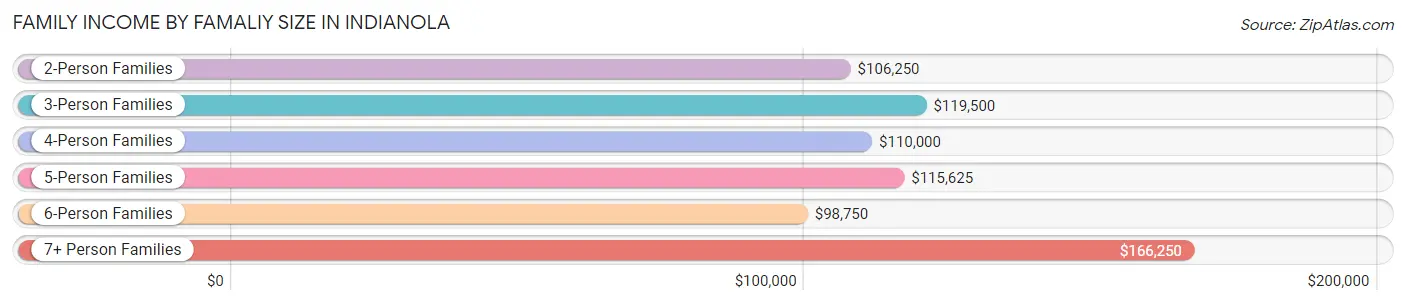
| Income Bracket | # Families | Median Income |
| 2-Person Families | 542 (54.1%) | $106,250 |
| 3-Person Families | 202 (20.2%) | $119,500 |
| 4-Person Families | 162 (16.2%) | $110,000 |
| 5-Person Families | 66 (6.6%) | $115,625 |
| 6-Person Families | 17 (1.7%) | $98,750 |
| 7+ Person Families | 12 (1.2%) | $166,250 |
| Total | 1,001 (100.0%) | $110,625 |
Family Income by Number of Earners in Indianola
The median family income in Indianola is $110,625, with families comprising 3+ earners (94) having the highest median family income of $147,500, while families with no earners (180) have the lowest median family income of $75,000, accounting for 9.4% and 18.0% of families, respectively.
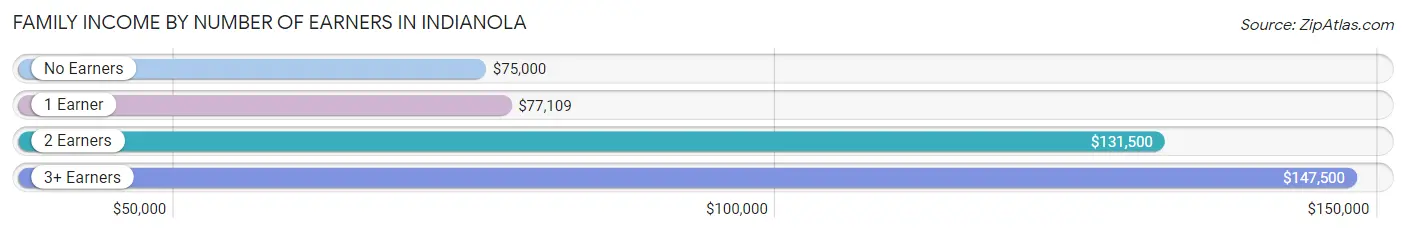
| Number of Earners | # Families | Median Income |
| No Earners | 180 (18.0%) | $75,000 |
| 1 Earner | 265 (26.5%) | $77,109 |
| 2 Earners | 462 (46.2%) | $131,500 |
| 3+ Earners | 94 (9.4%) | $147,500 |
| Total | 1,001 (100.0%) | $110,625 |
Household Income in Indianola
Household Income Brackets in Indianola
With 321 households falling in the category, the $100,000 to $149,999 income range is the most frequent in Indianola, accounting for 21.8% of all households. In contrast, only 52 households (3.5%) fall into the $15,000 to $24,999 income bracket, making it the least populous group.
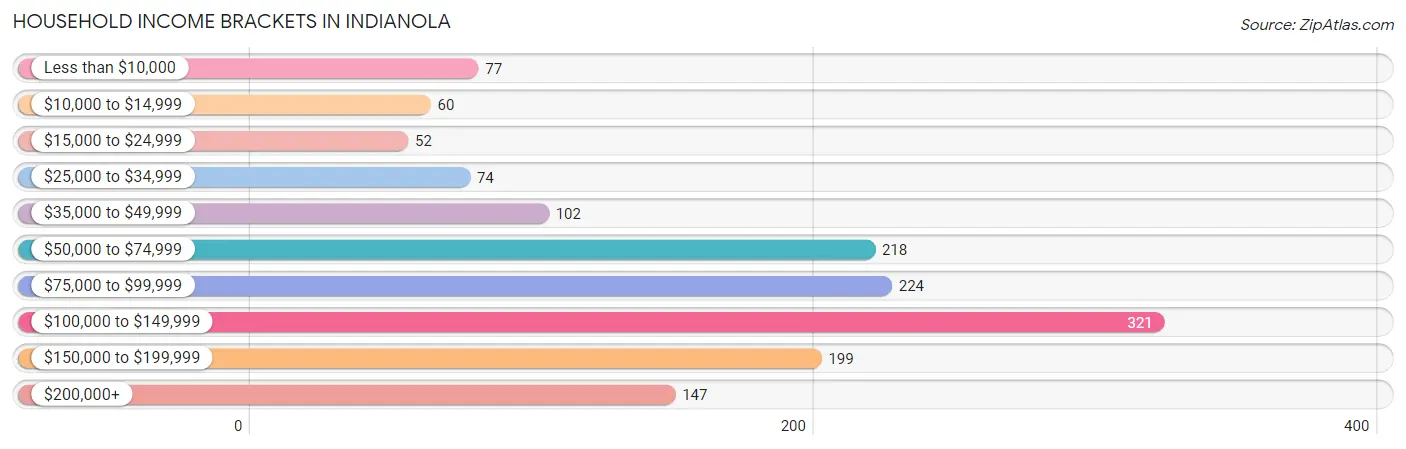
| Income Bracket | # Households | % Households |
| Less than $10,000 | 77 | 5.2% |
| $10,000 to $14,999 | 60 | 4.1% |
| $15,000 to $24,999 | 52 | 3.5% |
| $25,000 to $34,999 | 74 | 5.0% |
| $35,000 to $49,999 | 102 | 6.9% |
| $50,000 to $74,999 | 218 | 14.8% |
| $75,000 to $99,999 | 224 | 15.2% |
| $100,000 to $149,999 | 321 | 21.8% |
| $150,000 to $199,999 | 199 | 13.5% |
| $200,000+ | 147 | 10.0% |
Household Income by Householder Age in Indianola
The median household income in Indianola is $91,759, with the highest median household income of $117,632 found in the 45 to 64 years age bracket for the primary householder. A total of 578 households (39.2%) fall into this category. Meanwhile, the 65+ years age bracket for the primary householder has the lowest median household income of $71,250, with 460 households (31.2%) in this group.
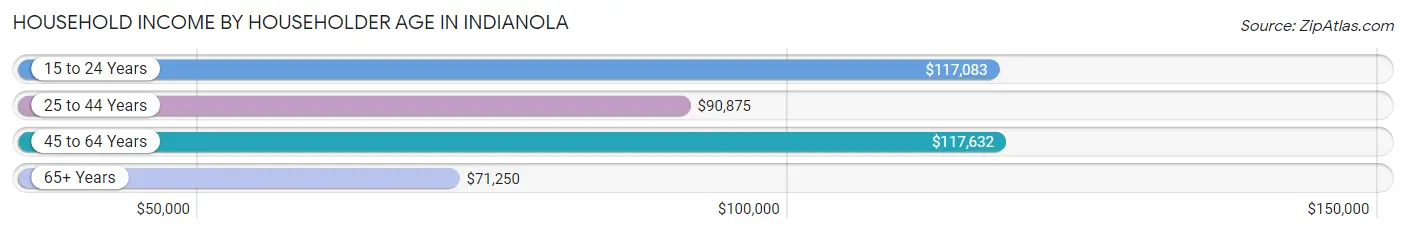
| Income Bracket | # Households | Median Income |
| 15 to 24 Years | 13 (0.9%) | $117,083 |
| 25 to 44 Years | 423 (28.7%) | $90,875 |
| 45 to 64 Years | 578 (39.2%) | $117,632 |
| 65+ Years | 460 (31.2%) | $71,250 |
| Total | 1,474 (100.0%) | $91,759 |
Poverty in Indianola
Income Below Poverty by Sex and Age in Indianola
With 6.6% poverty level for males and 11.1% for females among the residents of Indianola, 18 to 24 year old males and 5 year old females are the most vulnerable to poverty, with 14 males (13.3%) and 5 females (100.0%) in their respective age groups living below the poverty level.
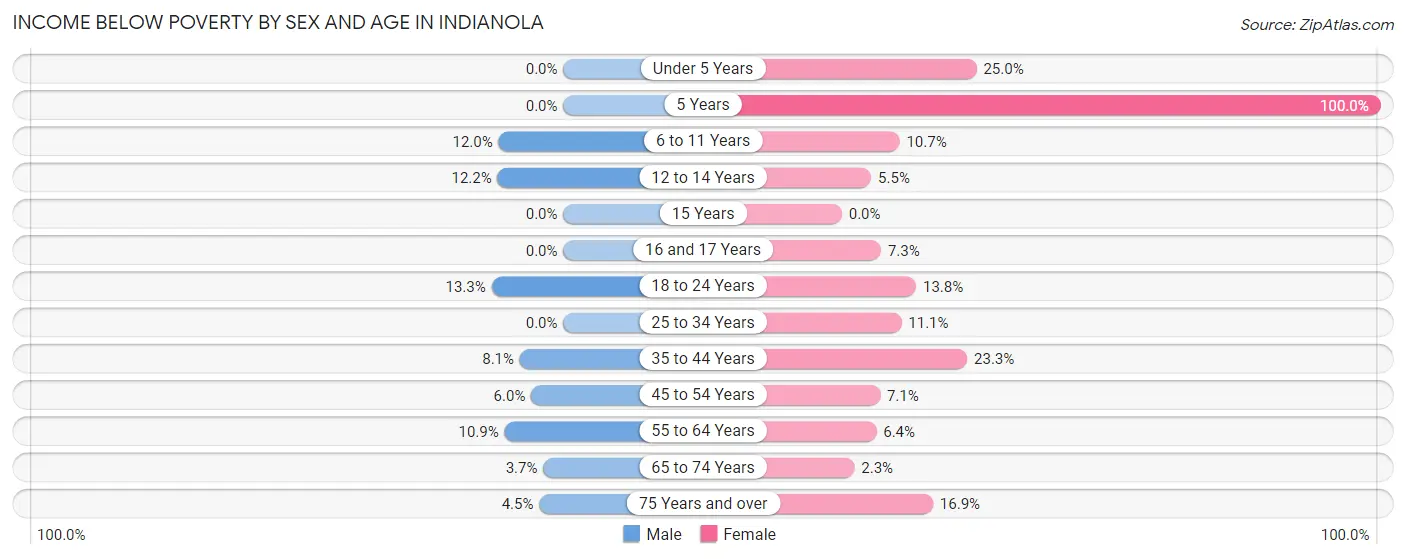
| Age Bracket | Male | Female |
| Under 5 Years | 0 (0.0%) | 12 (25.0%) |
| 5 Years | 0 (0.0%) | 5 (100.0%) |
| 6 to 11 Years | 16 (12.0%) | 12 (10.7%) |
| 12 to 14 Years | 11 (12.2%) | 3 (5.4%) |
| 15 Years | 0 (0.0%) | 0 (0.0%) |
| 16 and 17 Years | 0 (0.0%) | 4 (7.3%) |
| 18 to 24 Years | 14 (13.3%) | 16 (13.8%) |
| 25 to 34 Years | 0 (0.0%) | 22 (11.1%) |
| 35 to 44 Years | 18 (8.1%) | 60 (23.3%) |
| 45 to 54 Years | 14 (6.0%) | 15 (7.1%) |
| 55 to 64 Years | 31 (10.9%) | 19 (6.4%) |
| 65 to 74 Years | 8 (3.7%) | 6 (2.3%) |
| 75 Years and over | 5 (4.5%) | 23 (16.9%) |
| Total | 117 (6.6%) | 197 (11.1%) |
Income Above Poverty by Sex and Age in Indianola
According to the poverty statistics in Indianola, males aged under 5 years and females aged 15 years are the age groups that are most secure financially, with 100.0% of males and 100.0% of females in these age groups living above the poverty line.
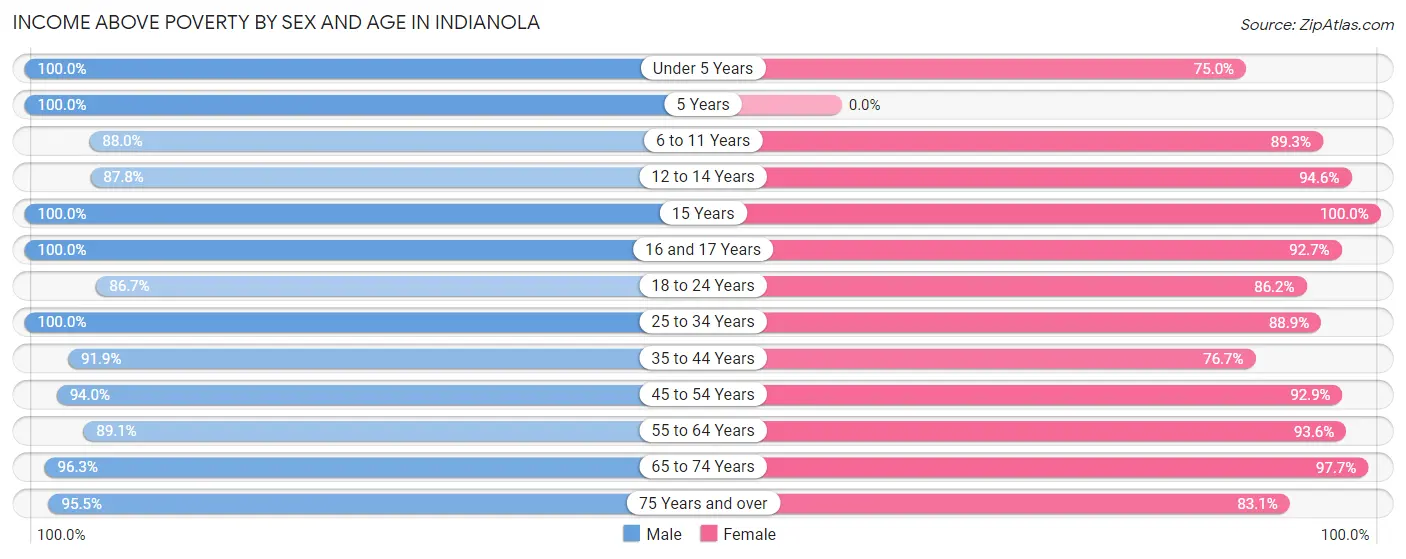
| Age Bracket | Male | Female |
| Under 5 Years | 81 (100.0%) | 36 (75.0%) |
| 5 Years | 15 (100.0%) | 0 (0.0%) |
| 6 to 11 Years | 117 (88.0%) | 100 (89.3%) |
| 12 to 14 Years | 79 (87.8%) | 52 (94.6%) |
| 15 Years | 11 (100.0%) | 20 (100.0%) |
| 16 and 17 Years | 43 (100.0%) | 51 (92.7%) |
| 18 to 24 Years | 91 (86.7%) | 100 (86.2%) |
| 25 to 34 Years | 218 (100.0%) | 177 (88.9%) |
| 35 to 44 Years | 205 (91.9%) | 198 (76.7%) |
| 45 to 54 Years | 221 (94.0%) | 197 (92.9%) |
| 55 to 64 Years | 253 (89.1%) | 278 (93.6%) |
| 65 to 74 Years | 207 (96.3%) | 252 (97.7%) |
| 75 Years and over | 107 (95.5%) | 113 (83.1%) |
| Total | 1,648 (93.4%) | 1,574 (88.9%) |
Income Below Poverty Among Married-Couple Families in Indianola
The poverty statistics for married-couple families in Indianola show that 3.2% or 26 of the total 806 families live below the poverty line. Families with 3 or 4 children have the highest poverty rate of 13.2%, comprising of 7 families. On the other hand, families with 5 or more children have the lowest poverty rate of 0.0%, which includes 0 families.
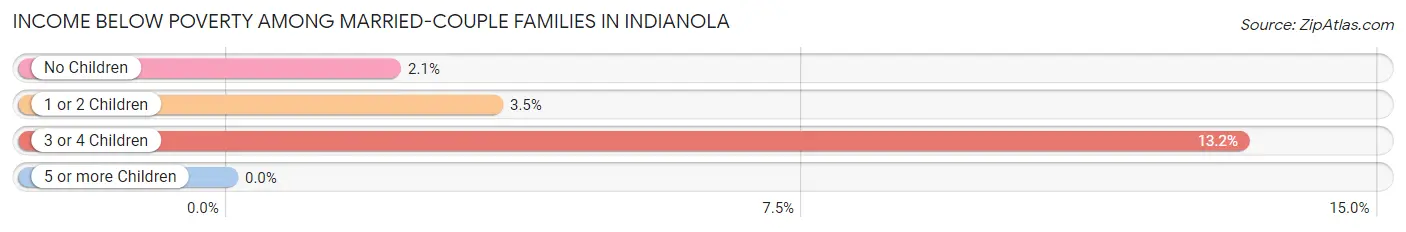
| Children | Above Poverty | Below Poverty |
| No Children | 505 (97.9%) | 11 (2.1%) |
| 1 or 2 Children | 223 (96.5%) | 8 (3.5%) |
| 3 or 4 Children | 46 (86.8%) | 7 (13.2%) |
| 5 or more Children | 6 (100.0%) | 0 (0.0%) |
| Total | 780 (96.8%) | 26 (3.2%) |
Income Below Poverty Among Single-Parent Households in Indianola
According to the poverty data in Indianola, 14.9% or 11 single-father households and 8.3% or 10 single-mother households are living below the poverty line. Among single-father households, those with no children have the highest poverty rate, with 8 households (22.9%) experiencing poverty. Likewise, among single-mother households, those with 3 or 4 children have the highest poverty rate, with 3 households (30.0%) falling below the poverty line.
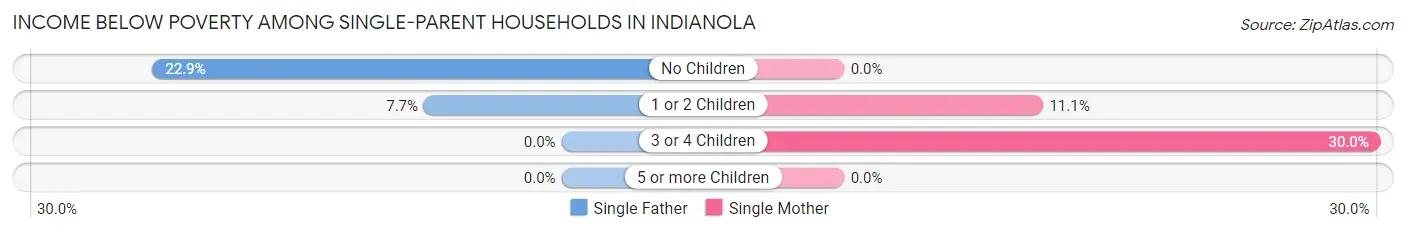
| Children | Single Father | Single Mother |
| No Children | 8 (22.9%) | 0 (0.0%) |
| 1 or 2 Children | 3 (7.7%) | 7 (11.1%) |
| 3 or 4 Children | 0 (0.0%) | 3 (30.0%) |
| 5 or more Children | 0 (0.0%) | 0 (0.0%) |
| Total | 11 (14.9%) | 10 (8.3%) |
Income Below Poverty Among Married-Couple vs Single-Parent Households in Indianola
The poverty data for Indianola shows that 26 of the married-couple family households (3.2%) and 21 of the single-parent households (10.8%) are living below the poverty level. Within the married-couple family households, those with 3 or 4 children have the highest poverty rate, with 7 households (13.2%) falling below the poverty line. Among the single-parent households, those with 3 or 4 children have the highest poverty rate, with 3 household (30.0%) living below poverty.
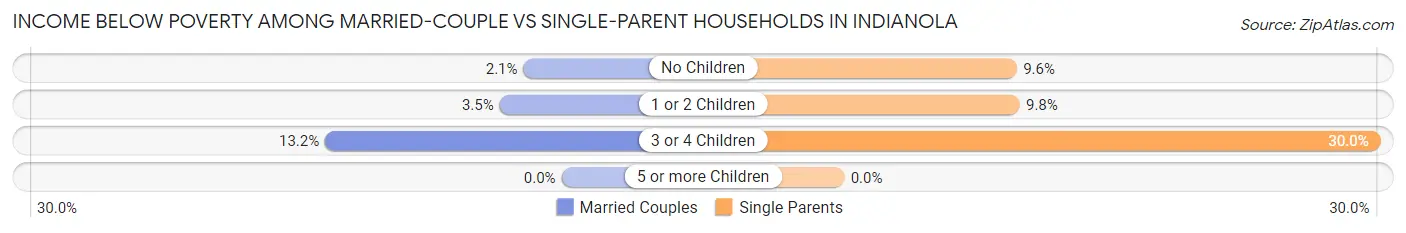
| Children | Married-Couple Families | Single-Parent Households |
| No Children | 11 (2.1%) | 8 (9.6%) |
| 1 or 2 Children | 8 (3.5%) | 10 (9.8%) |
| 3 or 4 Children | 7 (13.2%) | 3 (30.0%) |
| 5 or more Children | 0 (0.0%) | 0 (0.0%) |
| Total | 26 (3.2%) | 21 (10.8%) |
Race in Indianola
The most populous races in Indianola are White / Caucasian (2,947 | 82.9%), Two or more Races (343 | 9.7%), and Hispanic or Latino (206 | 5.8%).
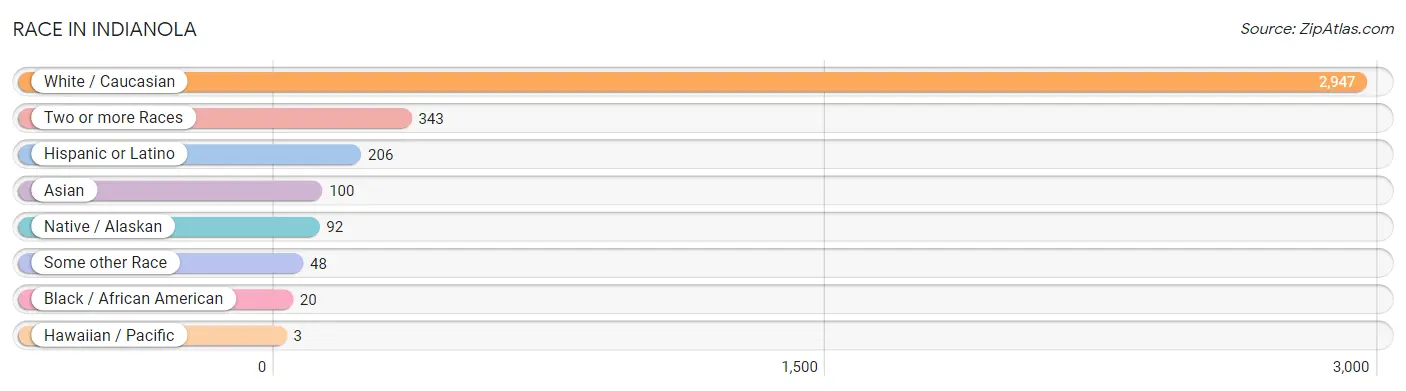
| Race | # Population | % Population |
| Asian | 100 | 2.8% |
| Black / African American | 20 | 0.6% |
| Hawaiian / Pacific | 3 | 0.1% |
| Hispanic or Latino | 206 | 5.8% |
| Native / Alaskan | 92 | 2.6% |
| White / Caucasian | 2,947 | 82.9% |
| Two or more Races | 343 | 9.7% |
| Some other Race | 48 | 1.3% |
| Total | 3,553 | 100.0% |
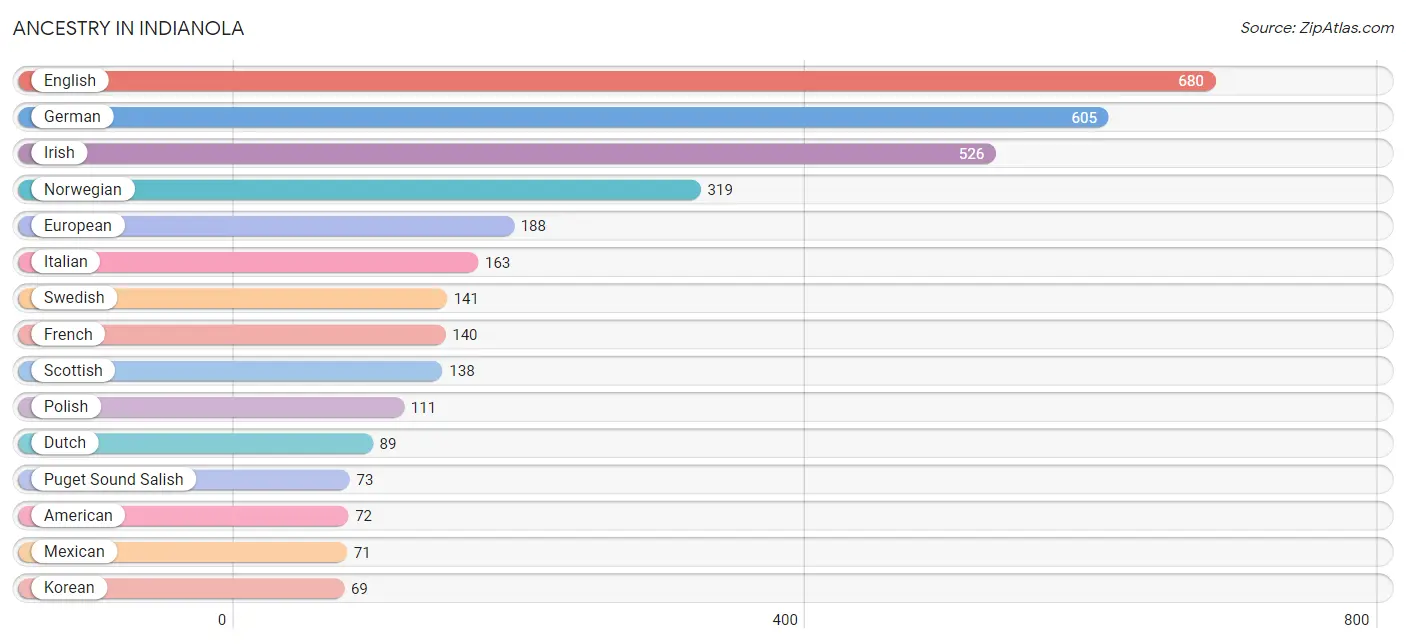
Ancestry in Indianola
The most populous ancestries reported in Indianola are English (680 | 19.1%), German (605 | 17.0%), Irish (526 | 14.8%), Norwegian (319 | 9.0%), and European (188 | 5.3%), together accounting for 65.2% of all Indianola residents.
| Ancestry | # Population | % Population |
| Alaskan Athabascan | 1 | 0.0% |
| Aleut | 10 | 0.3% |
| American | 72 | 2.0% |
| Apache | 2 | 0.1% |
| Arab | 2 | 0.1% |
| Armenian | 5 | 0.1% |
| Austrian | 4 | 0.1% |
| Belgian | 8 | 0.2% |
| Bhutanese | 28 | 0.8% |
| Blackfeet | 1 | 0.0% |
| Bolivian | 3 | 0.1% |
| Brazilian | 2 | 0.1% |
| British | 34 | 1.0% |
| Burmese | 25 | 0.7% |
| Canadian | 14 | 0.4% |
| Central American | 38 | 1.1% |
| Cherokee | 25 | 0.7% |
| Cheyenne | 3 | 0.1% |
| Chilean | 4 | 0.1% |
| Chinese | 2 | 0.1% |
| Choctaw | 9 | 0.3% |
| Colombian | 5 | 0.1% |
| Croatian | 19 | 0.5% |
| Czech | 21 | 0.6% |
| Danish | 35 | 1.0% |
| Dutch | 89 | 2.5% |
| Eastern European | 6 | 0.2% |
| English | 680 | 19.1% |
| European | 188 | 5.3% |
| Filipino | 3 | 0.1% |
| Finnish | 58 | 1.6% |
| French | 140 | 3.9% |
| French American Indian | 3 | 0.1% |
| French Canadian | 24 | 0.7% |
| German | 605 | 17.0% |
| Greek | 24 | 0.7% |
| Guatemalan | 6 | 0.2% |
| Guyanese | 3 | 0.1% |
| Honduran | 7 | 0.2% |
| Hungarian | 28 | 0.8% |
| Icelander | 15 | 0.4% |
| Indian (Asian) | 39 | 1.1% |
| Inupiat | 4 | 0.1% |
| Iranian | 5 | 0.1% |
| Irish | 526 | 14.8% |
| Italian | 163 | 4.6% |
| Jamaican | 5 | 0.1% |
| Korean | 69 | 1.9% |
| Latvian | 2 | 0.1% |
| Lithuanian | 9 | 0.3% |
| Maltese | 1 | 0.0% |
| Mexican | 71 | 2.0% |
| Moroccan | 2 | 0.1% |
| Native Hawaiian | 11 | 0.3% |
| Navajo | 5 | 0.1% |
| Northern European | 52 | 1.5% |
| Norwegian | 319 | 9.0% |
| Osage | 3 | 0.1% |
| Pakistani | 5 | 0.1% |
| Peruvian | 1 | 0.0% |
| Polish | 111 | 3.1% |
| Portuguese | 28 | 0.8% |
| Puerto Rican | 29 | 0.8% |
| Puget Sound Salish | 73 | 2.1% |
| Romanian | 5 | 0.1% |
| Russian | 23 | 0.6% |
| Salvadoran | 25 | 0.7% |
| Samoan | 3 | 0.1% |
| Scandinavian | 32 | 0.9% |
| Scotch-Irish | 65 | 1.8% |
| Scottish | 138 | 3.9% |
| Shoshone | 2 | 0.1% |
| Slavic | 2 | 0.1% |
| Slovak | 4 | 0.1% |
| South American | 13 | 0.4% |
| Spaniard | 5 | 0.1% |
| Spanish | 50 | 1.4% |
| Sri Lankan | 11 | 0.3% |
| Swedish | 141 | 4.0% |
| Swiss | 13 | 0.4% |
| Thai | 34 | 1.0% |
| Tlingit-Haida | 3 | 0.1% |
| Turkish | 9 | 0.3% |
| Ukrainian | 6 | 0.2% |
| Welsh | 54 | 1.5% |
| Yugoslavian | 3 | 0.1% | View All 86 Rows |
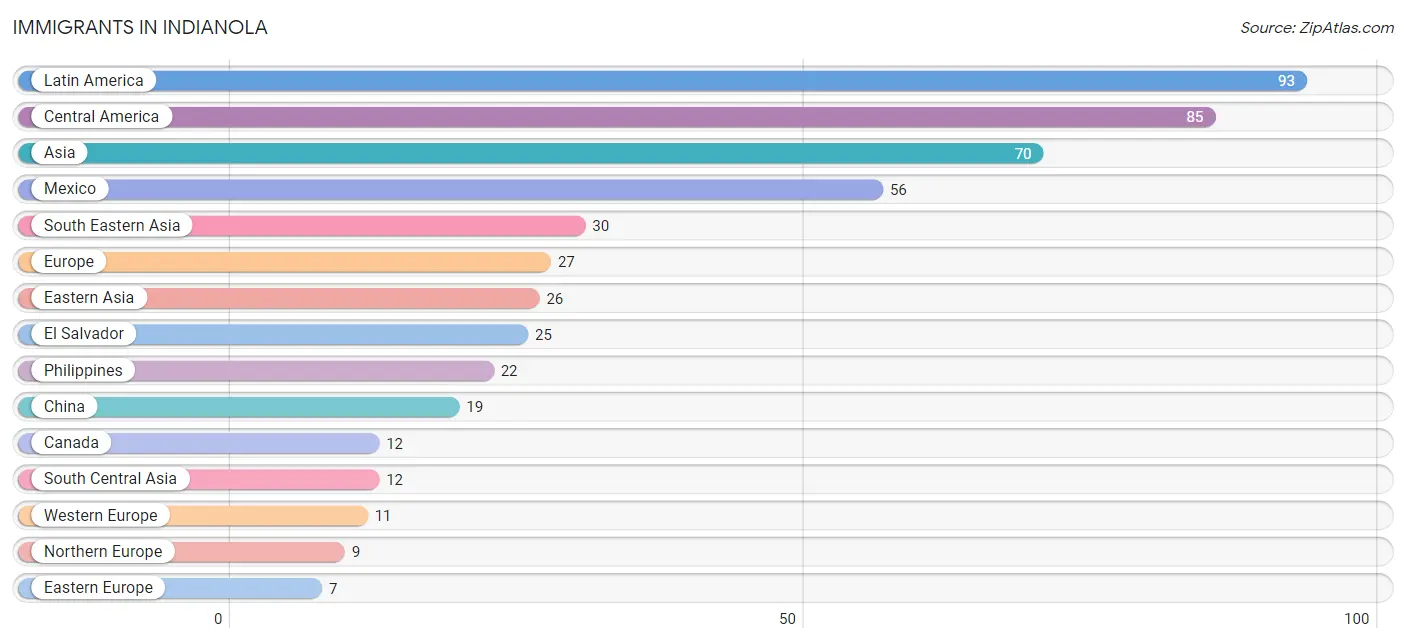
Immigrants in Indianola
The most numerous immigrant groups reported in Indianola came from Latin America (93 | 2.6%), Central America (85 | 2.4%), Asia (70 | 2.0%), Mexico (56 | 1.6%), and South Eastern Asia (30 | 0.8%), together accounting for 9.4% of all Indianola residents.
| Immigration Origin | # Population | % Population |
| Africa | 6 | 0.2% |
| Asia | 70 | 2.0% |
| Australia | 2 | 0.1% |
| Bolivia | 3 | 0.1% |
| Canada | 12 | 0.3% |
| Caribbean | 2 | 0.1% |
| Central America | 85 | 2.4% |
| China | 19 | 0.5% |
| Colombia | 2 | 0.1% |
| Czechoslovakia | 3 | 0.1% |
| Eastern Asia | 26 | 0.7% |
| Eastern Europe | 7 | 0.2% |
| El Salvador | 25 | 0.7% |
| England | 2 | 0.1% |
| Europe | 27 | 0.8% |
| Fiji | 3 | 0.1% |
| Germany | 2 | 0.1% |
| Guatemala | 4 | 0.1% |
| Hong Kong | 2 | 0.1% |
| Hungary | 2 | 0.1% |
| India | 2 | 0.1% |
| Iran | 3 | 0.1% |
| Ireland | 3 | 0.1% |
| Jamaica | 2 | 0.1% |
| Japan | 3 | 0.1% |
| Korea | 4 | 0.1% |
| Latin America | 93 | 2.6% |
| Mexico | 56 | 1.6% |
| Nepal | 7 | 0.2% |
| Netherlands | 6 | 0.2% |
| Northern Europe | 9 | 0.3% |
| Norway | 1 | 0.0% |
| Oceania | 5 | 0.1% |
| Peru | 1 | 0.0% |
| Philippines | 22 | 0.6% |
| South Africa | 3 | 0.1% |
| South America | 6 | 0.2% |
| South Central Asia | 12 | 0.3% |
| South Eastern Asia | 30 | 0.8% |
| Switzerland | 3 | 0.1% |
| Taiwan | 2 | 0.1% |
| Thailand | 1 | 0.0% |
| Turkey | 2 | 0.1% |
| Ukraine | 2 | 0.1% |
| Vietnam | 7 | 0.2% |
| Western Asia | 2 | 0.1% |
| Western Europe | 11 | 0.3% | View All 47 Rows |
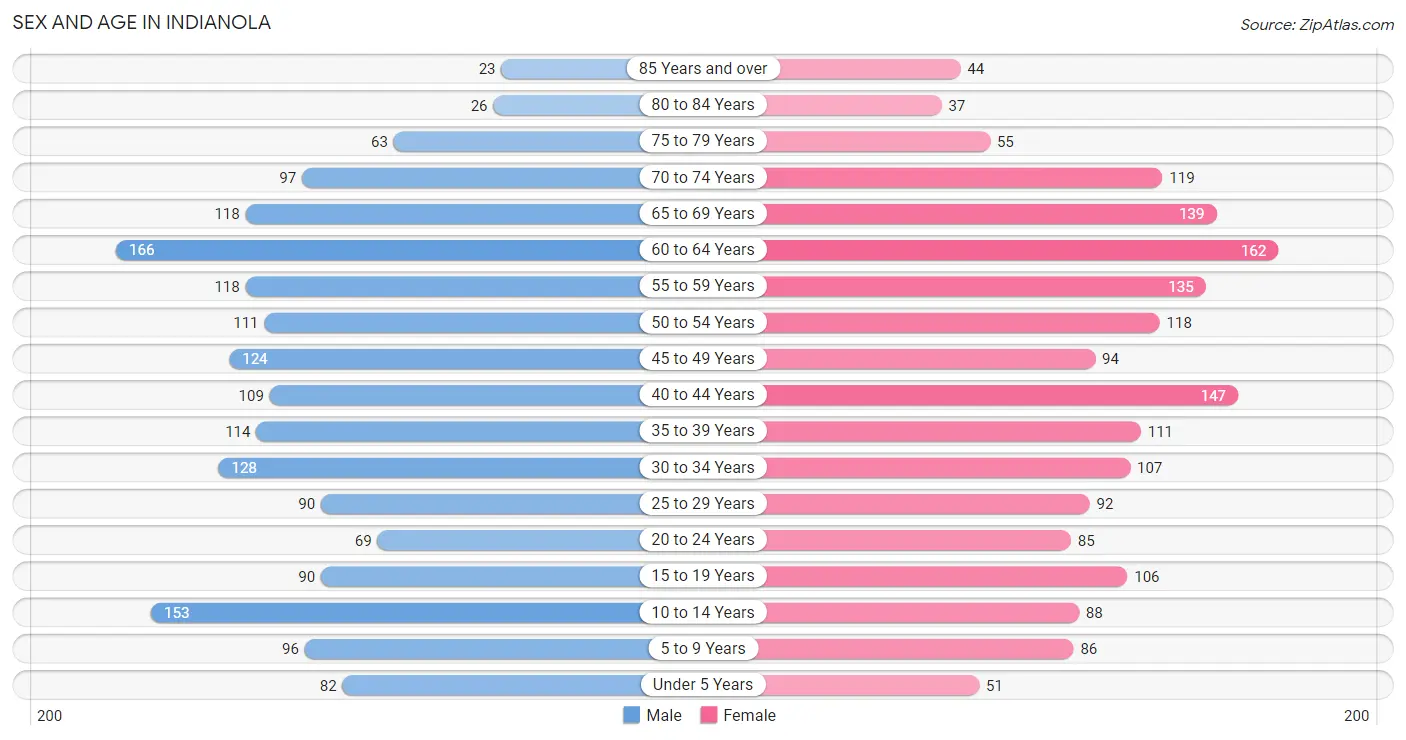
Sex and Age in Indianola
Sex and Age in Indianola
The most populous age groups in Indianola are 60 to 64 Years (166 | 9.3%) for men and 60 to 64 Years (162 | 9.1%) for women.
| Age Bracket | Male | Female |
| Under 5 Years | 82 (4.6%) | 51 (2.9%) |
| 5 to 9 Years | 96 (5.4%) | 86 (4.8%) |
| 10 to 14 Years | 153 (8.6%) | 88 (5.0%) |
| 15 to 19 Years | 90 (5.1%) | 106 (6.0%) |
| 20 to 24 Years | 69 (3.9%) | 85 (4.8%) |
| 25 to 29 Years | 90 (5.1%) | 92 (5.2%) |
| 30 to 34 Years | 128 (7.2%) | 107 (6.0%) |
| 35 to 39 Years | 114 (6.4%) | 111 (6.2%) |
| 40 to 44 Years | 109 (6.1%) | 147 (8.3%) |
| 45 to 49 Years | 124 (7.0%) | 94 (5.3%) |
| 50 to 54 Years | 111 (6.2%) | 118 (6.6%) |
| 55 to 59 Years | 118 (6.6%) | 135 (7.6%) |
| 60 to 64 Years | 166 (9.3%) | 162 (9.1%) |
| 65 to 69 Years | 118 (6.6%) | 139 (7.8%) |
| 70 to 74 Years | 97 (5.5%) | 119 (6.7%) |
| 75 to 79 Years | 63 (3.5%) | 55 (3.1%) |
| 80 to 84 Years | 26 (1.5%) | 37 (2.1%) |
| 85 Years and over | 23 (1.3%) | 44 (2.5%) |
| Total | 1,777 (100.0%) | 1,776 (100.0%) |
Families and Households in Indianola
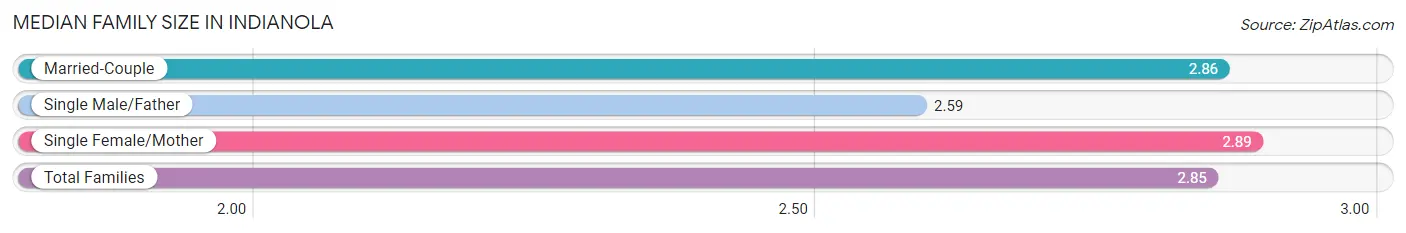
Median Family Size in Indianola
The median family size in Indianola is 2.85 persons per family, with single female/mother families (121 | 12.1%) accounting for the largest median family size of 2.89 persons per family. On the other hand, single male/father families (74 | 7.4%) represent the smallest median family size with 2.59 persons per family.
| Family Type | # Families | Family Size |
| Married-Couple | 806 (80.5%) | 2.86 |
| Single Male/Father | 74 (7.4%) | 2.59 |
| Single Female/Mother | 121 (12.1%) | 2.89 |
| Total Families | 1,001 (100.0%) | 2.85 |
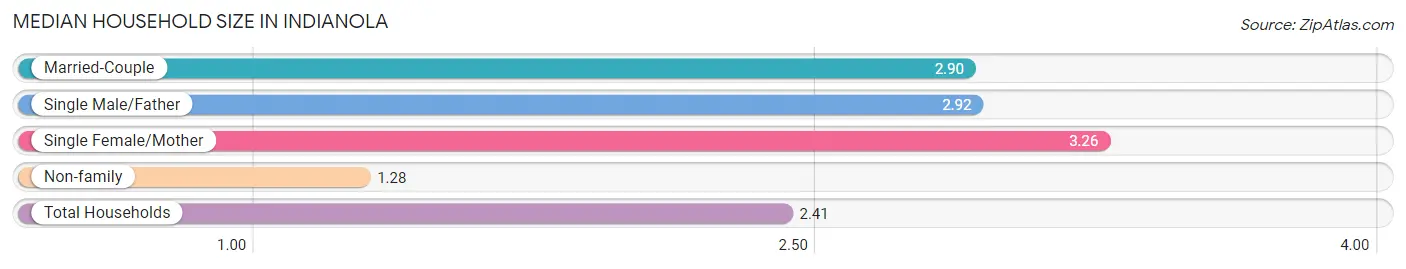
Median Household Size in Indianola
The median household size in Indianola is 2.41 persons per household, with single female/mother households (121 | 8.2%) accounting for the largest median household size of 3.26 persons per household. non-family households (473 | 32.1%) represent the smallest median household size with 1.28 persons per household.
| Household Type | # Households | Household Size |
| Married-Couple | 806 (54.7%) | 2.90 |
| Single Male/Father | 74 (5.0%) | 2.92 |
| Single Female/Mother | 121 (8.2%) | 3.26 |
| Non-family | 473 (32.1%) | 1.28 |
| Total Households | 1,474 (100.0%) | 2.41 |
Household Size by Marriage Status in Indianola
Out of a total of 1,474 households in Indianola, 1,001 (67.9%) are family households, while 473 (32.1%) are nonfamily households. The most numerous type of family households are 2-person households, comprising 522, and the most common type of nonfamily households are 1-person households, comprising 377.
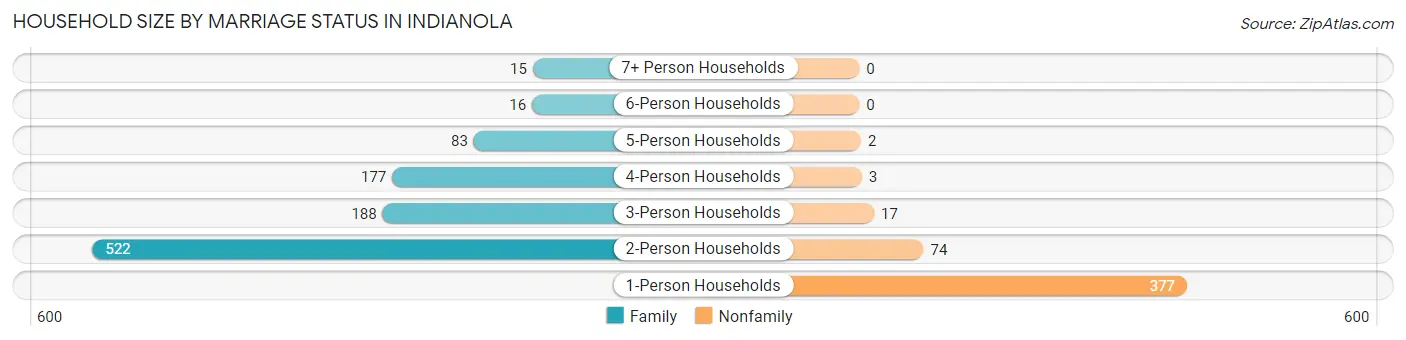
| Household Size | Family Households | Nonfamily Households |
| 1-Person Households | - | 377 (25.6%) |
| 2-Person Households | 522 (35.4%) | 74 (5.0%) |
| 3-Person Households | 188 (12.8%) | 17 (1.1%) |
| 4-Person Households | 177 (12.0%) | 3 (0.2%) |
| 5-Person Households | 83 (5.6%) | 2 (0.1%) |
| 6-Person Households | 16 (1.1%) | 0 (0.0%) |
| 7+ Person Households | 15 (1.0%) | 0 (0.0%) |
| Total | 1,001 (67.9%) | 473 (32.1%) |
Female Fertility in Indianola
Fertility by Age in Indianola
Average fertility rate in Indianola is 30.0 births per 1,000 women. Women in the age bracket of 20 to 34 years have the highest fertility rate with 35.0 births per 1,000 women. Women in the age bracket of 35 to 50 years acount for 47.8% of all women with births.
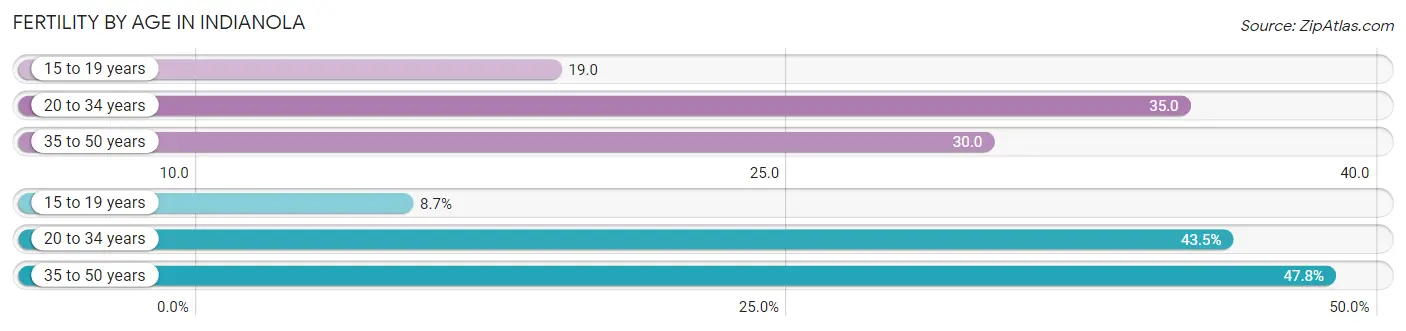
| Age Bracket | Women with Births | Births / 1,000 Women |
| 15 to 19 years | 2 (8.7%) | 19.0 |
| 20 to 34 years | 10 (43.5%) | 35.0 |
| 35 to 50 years | 11 (47.8%) | 30.0 |
| Total | 23 (100.0%) | 30.0 |
Fertility by Age by Marriage Status in Indianola
87.0% of women with births (23) in Indianola are married. The highest percentage of unmarried women with births falls into 15 to 19 years age bracket with 100.0% of them unmarried at the time of birth, while the lowest percentage of unmarried women with births belong to 35 to 50 years age bracket with 0.0% of them unmarried.
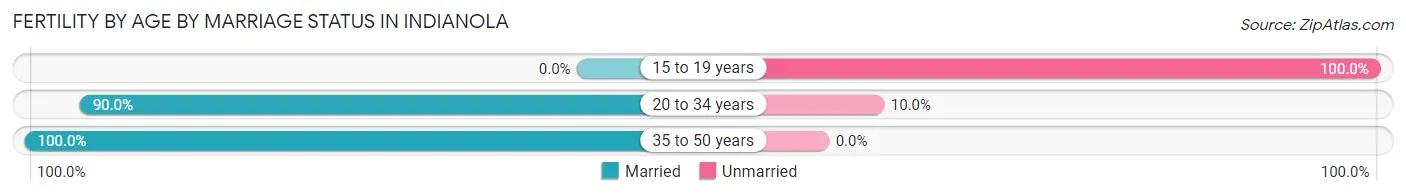
| Age Bracket | Married | Unmarried |
| 15 to 19 years | 0 (0.0%) | 2 (100.0%) |
| 20 to 34 years | 9 (90.0%) | 1 (10.0%) |
| 35 to 50 years | 11 (100.0%) | 0 (0.0%) |
| Total | 20 (87.0%) | 3 (13.0%) |
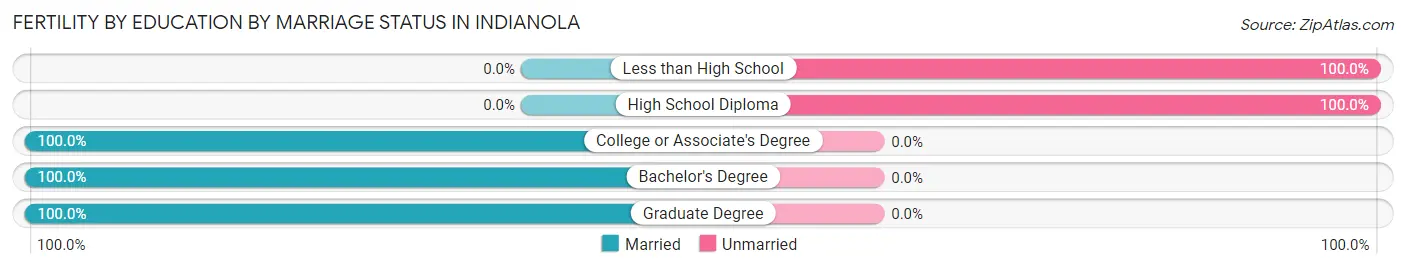
Fertility by Education in Indianola
Average fertility rate in Indianola is 30.0 births per 1,000 women. Women with the education attainment of graduate degree have the highest fertility rate of 119.0 births per 1,000 women, while women with the education attainment of less than high school have the lowest fertility at 6.0 births per 1,000 women. Women with the education attainment of bachelor's degree represent 34.8% of all women with births.
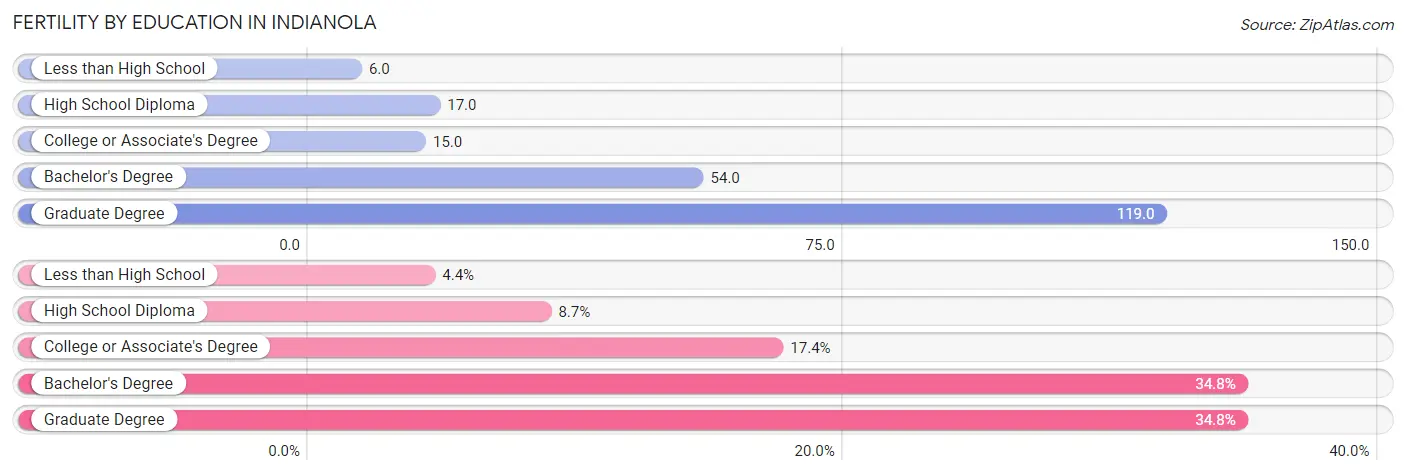
| Educational Attainment | Women with Births | Births / 1,000 Women |
| Less than High School | 1 (4.3%) | 6.0 |
| High School Diploma | 2 (8.7%) | 17.0 |
| College or Associate's Degree | 4 (17.4%) | 15.0 |
| Bachelor's Degree | 8 (34.8%) | 54.0 |
| Graduate Degree | 8 (34.8%) | 119.0 |
| Total | 23 (100.0%) | 30.0 |
Fertility by Education by Marriage Status in Indianola
13.0% of women with births in Indianola are unmarried. Women with the educational attainment of college or associate's degree are most likely to be married with 100.0% of them married at childbirth, while women with the educational attainment of less than high school are least likely to be married with 100.0% of them unmarried at childbirth.
| Educational Attainment | Married | Unmarried |
| Less than High School | 0 (0.0%) | 1 (100.0%) |
| High School Diploma | 0 (0.0%) | 2 (100.0%) |
| College or Associate's Degree | 4 (100.0%) | 0 (0.0%) |
| Bachelor's Degree | 8 (100.0%) | 0 (0.0%) |
| Graduate Degree | 8 (100.0%) | 0 (0.0%) |
| Total | 20 (87.0%) | 3 (13.0%) |
Employment Characteristics in Indianola
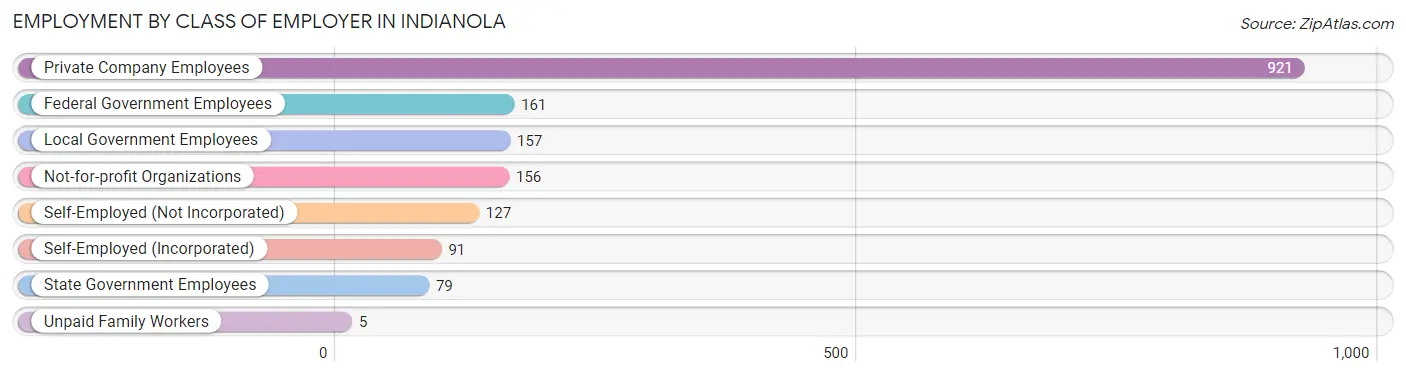
Employment by Class of Employer in Indianola
Among the 1,697 employed individuals in Indianola, private company employees (921 | 54.3%), federal government employees (161 | 9.5%), and local government employees (157 | 9.2%) make up the most common classes of employment.
| Employer Class | # Employees | % Employees |
| Private Company Employees | 921 | 54.3% |
| Self-Employed (Incorporated) | 91 | 5.4% |
| Self-Employed (Not Incorporated) | 127 | 7.5% |
| Not-for-profit Organizations | 156 | 9.2% |
| Local Government Employees | 157 | 9.2% |
| State Government Employees | 79 | 4.7% |
| Federal Government Employees | 161 | 9.5% |
| Unpaid Family Workers | 5 | 0.3% |
| Total | 1,697 | 100.0% |
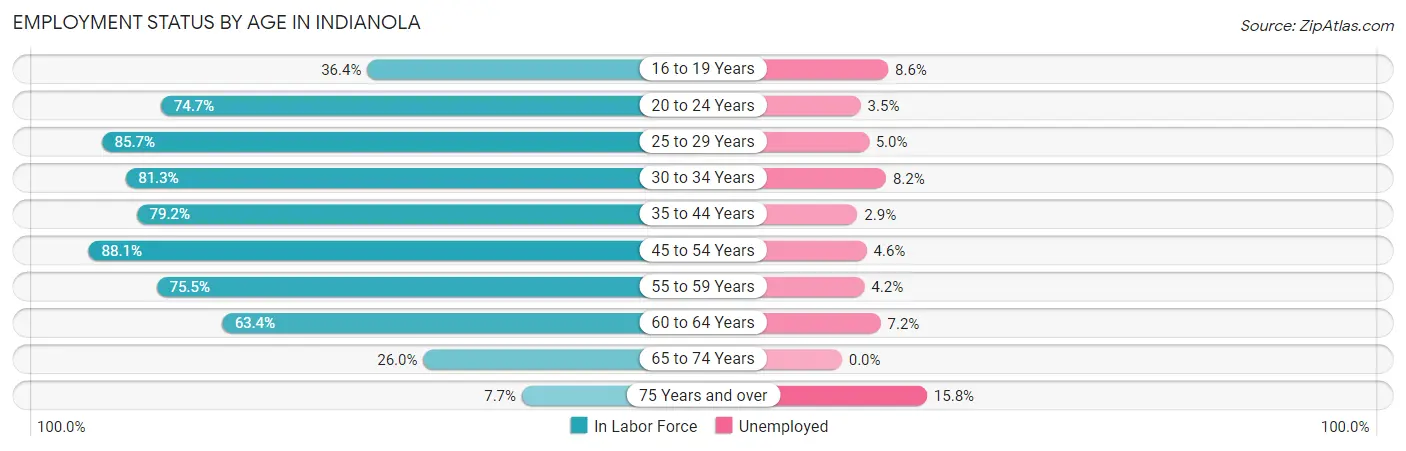
Employment Status by Age in Indianola
According to the labor force statistics for Indianola, out of the total population over 16 years of age (2,966), 62.0% or 1,839 individuals are in the labor force, with 4.8% or 88 of them unemployed. The age group with the highest labor force participation rate is 45 to 54 years, with 88.1% or 394 individuals in the labor force. Within the labor force, the 75 years and over age range has the highest percentage of unemployed individuals, with 15.8% or 3 of them being unemployed.
| Age Bracket | In Labor Force | Unemployed |
| 16 to 19 Years | 60 (36.4%) | 5 (8.6%) |
| 20 to 24 Years | 115 (74.7%) | 4 (3.5%) |
| 25 to 29 Years | 156 (85.7%) | 8 (5.0%) |
| 30 to 34 Years | 191 (81.3%) | 16 (8.2%) |
| 35 to 44 Years | 381 (79.2%) | 11 (2.9%) |
| 45 to 54 Years | 394 (88.1%) | 18 (4.6%) |
| 55 to 59 Years | 191 (75.5%) | 8 (4.2%) |
| 60 to 64 Years | 208 (63.4%) | 15 (7.2%) |
| 65 to 74 Years | 123 (26.0%) | 0 (0.0%) |
| 75 Years and over | 19 (7.7%) | 3 (15.8%) |
| Total | 1,839 (62.0%) | 88 (4.8%) |
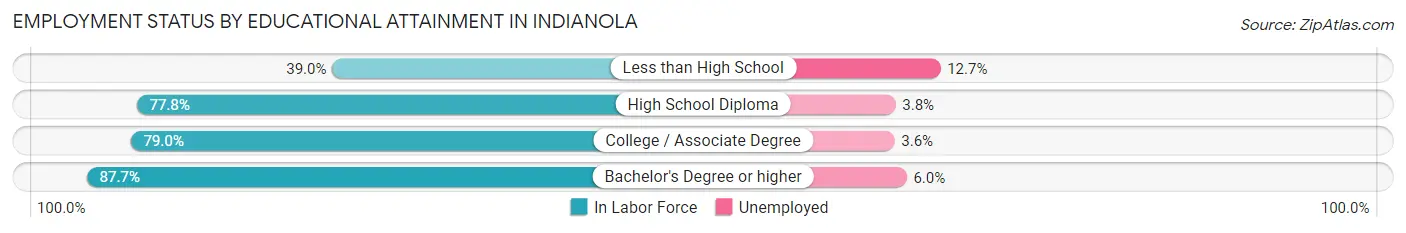
Employment Status by Educational Attainment in Indianola
According to labor force statistics for Indianola, 79.0% of individuals (1,522) out of the total population between 25 and 64 years of age (1,926) are in the labor force, with 4.9% or 75 of them being unemployed. The group with the highest labor force participation rate are those with the educational attainment of bachelor's degree or higher, with 87.7% or 607 individuals in the labor force. Within the labor force, individuals with less than high school education have the highest percentage of unemployment, with 12.7% or 7 of them being unemployed.
| Educational Attainment | In Labor Force | Unemployed |
| Less than High School | 55 (39.0%) | 18 (12.7%) |
| High School Diploma | 294 (77.8%) | 14 (3.8%) |
| College / Associate Degree | 565 (79.0%) | 26 (3.6%) |
| Bachelor's Degree or higher | 607 (87.7%) | 42 (6.0%) |
| Total | 1,522 (79.0%) | 94 (4.9%) |
Employment Occupations by Sex in Indianola
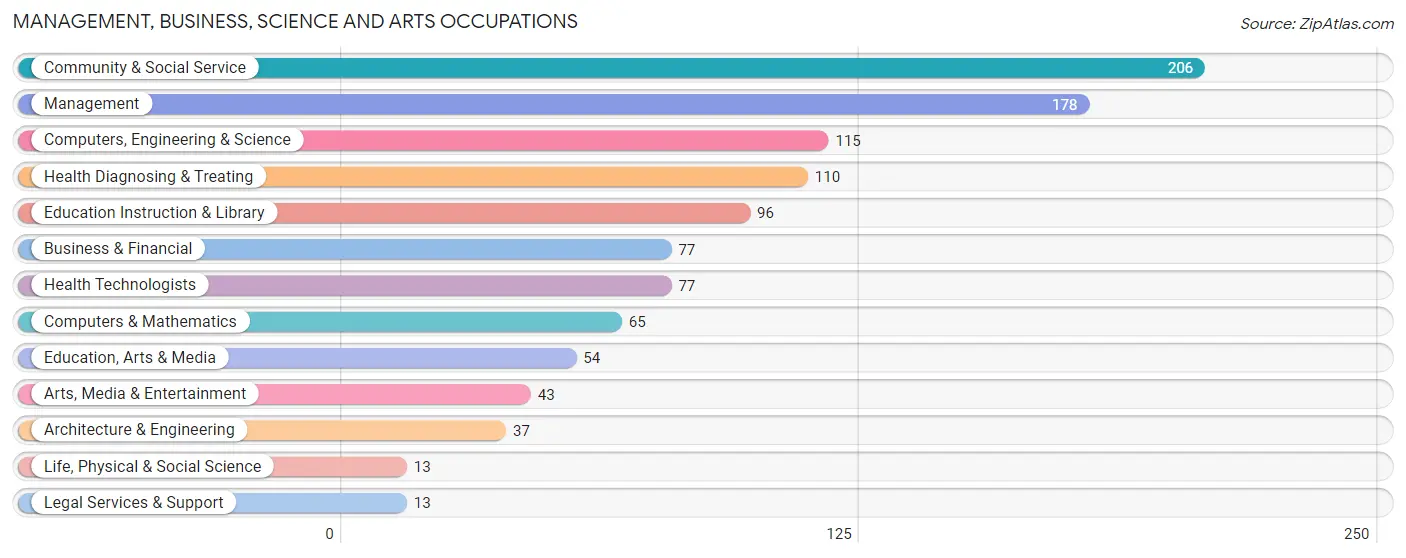
Management, Business, Science and Arts Occupations
The most common Management, Business, Science and Arts occupations in Indianola are Community & Social Service (206 | 11.9%), Management (178 | 10.3%), Computers, Engineering & Science (115 | 6.7%), Health Diagnosing & Treating (110 | 6.4%), and Education Instruction & Library (96 | 5.6%).
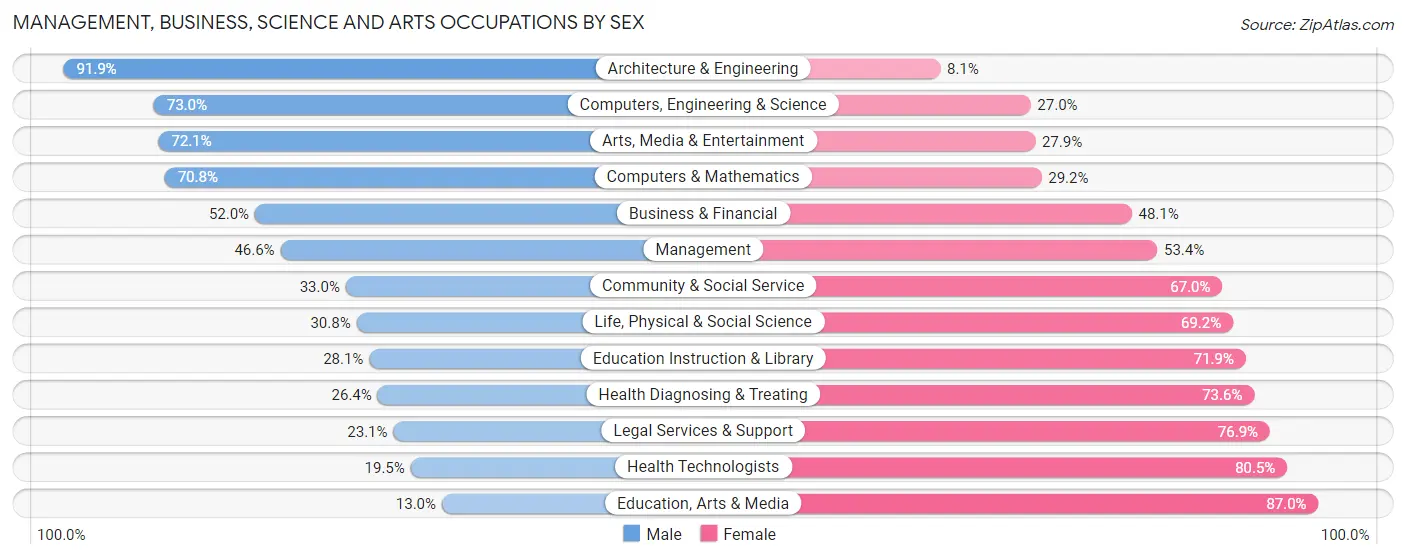
Management, Business, Science and Arts Occupations by Sex
Within the Management, Business, Science and Arts occupations in Indianola, the most male-oriented occupations are Architecture & Engineering (91.9%), Computers, Engineering & Science (73.0%), and Arts, Media & Entertainment (72.1%), while the most female-oriented occupations are Education, Arts & Media (87.0%), Health Technologists (80.5%), and Legal Services & Support (76.9%).
| Occupation | Male | Female |
| Management | 83 (46.6%) | 95 (53.4%) |
| Business & Financial | 40 (51.9%) | 37 (48.0%) |
| Computers, Engineering & Science | 84 (73.0%) | 31 (27.0%) |
| Computers & Mathematics | 46 (70.8%) | 19 (29.2%) |
| Architecture & Engineering | 34 (91.9%) | 3 (8.1%) |
| Life, Physical & Social Science | 4 (30.8%) | 9 (69.2%) |
| Community & Social Service | 68 (33.0%) | 138 (67.0%) |
| Education, Arts & Media | 7 (13.0%) | 47 (87.0%) |
| Legal Services & Support | 3 (23.1%) | 10 (76.9%) |
| Education Instruction & Library | 27 (28.1%) | 69 (71.9%) |
| Arts, Media & Entertainment | 31 (72.1%) | 12 (27.9%) |
| Health Diagnosing & Treating | 29 (26.4%) | 81 (73.6%) |
| Health Technologists | 15 (19.5%) | 62 (80.5%) |
| Total (Category) | 304 (44.3%) | 382 (55.7%) |
| Total (Overall) | 896 (52.0%) | 828 (48.0%) |
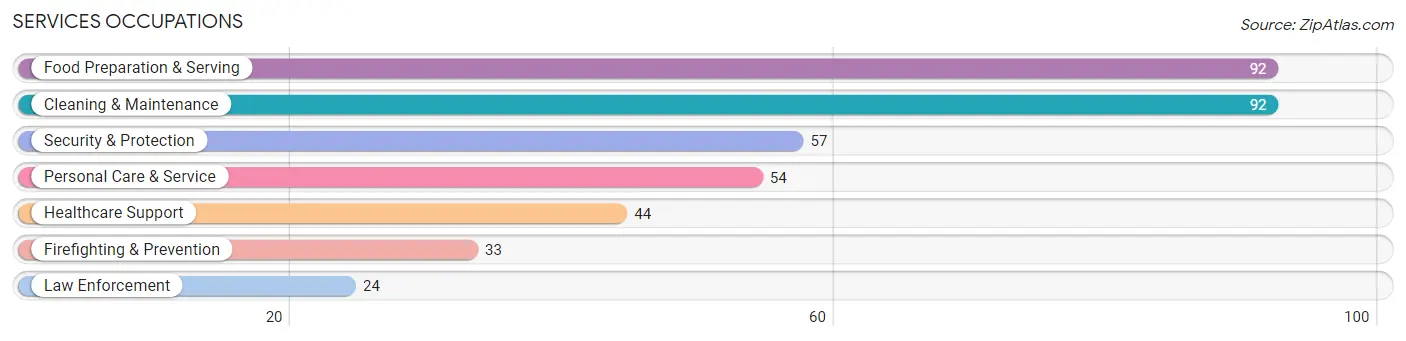
Services Occupations
The most common Services occupations in Indianola are Food Preparation & Serving (92 | 5.3%), Cleaning & Maintenance (92 | 5.3%), Security & Protection (57 | 3.3%), Personal Care & Service (54 | 3.1%), and Healthcare Support (44 | 2.5%).
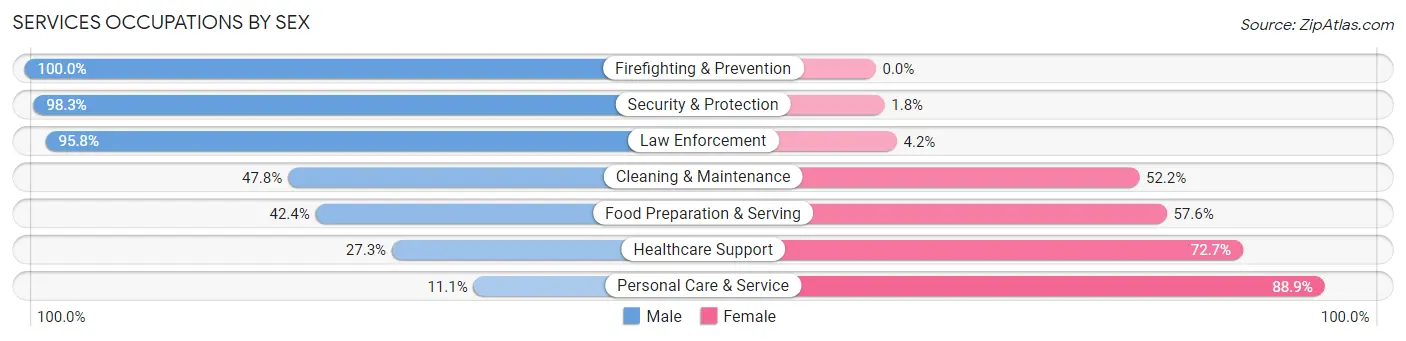
Services Occupations by Sex
Within the Services occupations in Indianola, the most male-oriented occupations are Firefighting & Prevention (100.0%), Security & Protection (98.3%), and Law Enforcement (95.8%), while the most female-oriented occupations are Personal Care & Service (88.9%), Healthcare Support (72.7%), and Food Preparation & Serving (57.6%).
| Occupation | Male | Female |
| Healthcare Support | 12 (27.3%) | 32 (72.7%) |
| Security & Protection | 56 (98.3%) | 1 (1.8%) |
| Firefighting & Prevention | 33 (100.0%) | 0 (0.0%) |
| Law Enforcement | 23 (95.8%) | 1 (4.2%) |
| Food Preparation & Serving | 39 (42.4%) | 53 (57.6%) |
| Cleaning & Maintenance | 44 (47.8%) | 48 (52.2%) |
| Personal Care & Service | 6 (11.1%) | 48 (88.9%) |
| Total (Category) | 157 (46.3%) | 182 (53.7%) |
| Total (Overall) | 896 (52.0%) | 828 (48.0%) |
Sales and Office Occupations
The most common Sales and Office occupations in Indianola are Sales & Related (165 | 9.6%), and Office & Administration (155 | 9.0%).
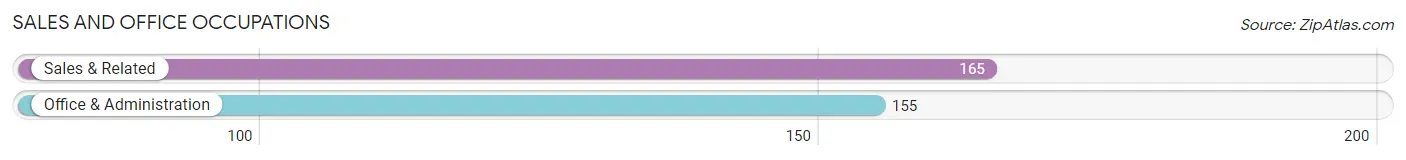
Sales and Office Occupations by Sex
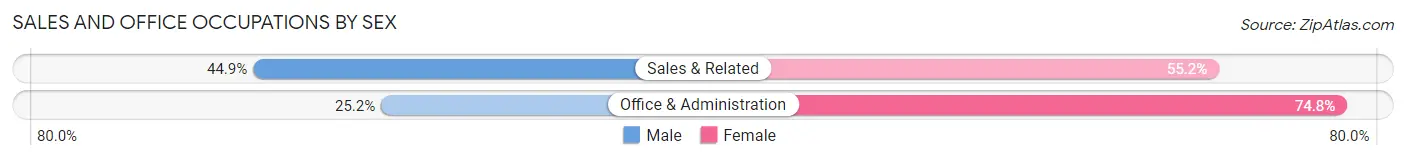
| Occupation | Male | Female |
| Sales & Related | 74 (44.9%) | 91 (55.1%) |
| Office & Administration | 39 (25.2%) | 116 (74.8%) |
| Total (Category) | 113 (35.3%) | 207 (64.7%) |
| Total (Overall) | 896 (52.0%) | 828 (48.0%) |
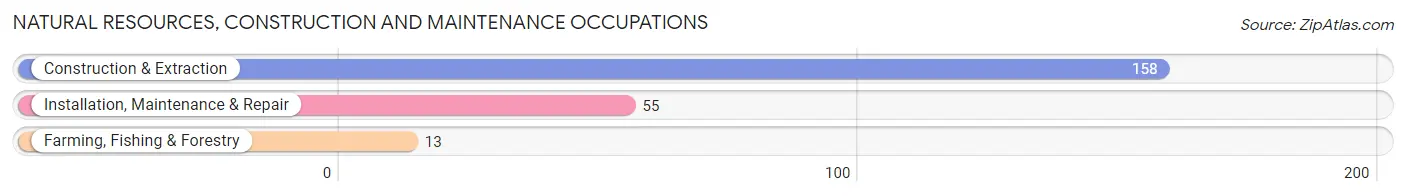
Natural Resources, Construction and Maintenance Occupations
The most common Natural Resources, Construction and Maintenance occupations in Indianola are Construction & Extraction (158 | 9.2%), Installation, Maintenance & Repair (55 | 3.2%), and Farming, Fishing & Forestry (13 | 0.7%).
Natural Resources, Construction and Maintenance Occupations by Sex
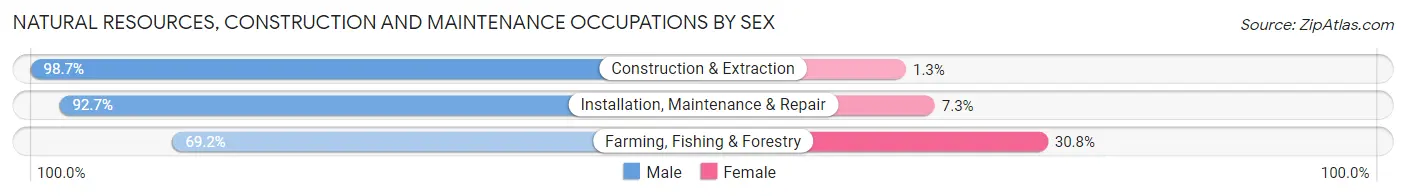
| Occupation | Male | Female |
| Farming, Fishing & Forestry | 9 (69.2%) | 4 (30.8%) |
| Construction & Extraction | 156 (98.7%) | 2 (1.3%) |
| Installation, Maintenance & Repair | 51 (92.7%) | 4 (7.3%) |
| Total (Category) | 216 (95.6%) | 10 (4.4%) |
| Total (Overall) | 896 (52.0%) | 828 (48.0%) |
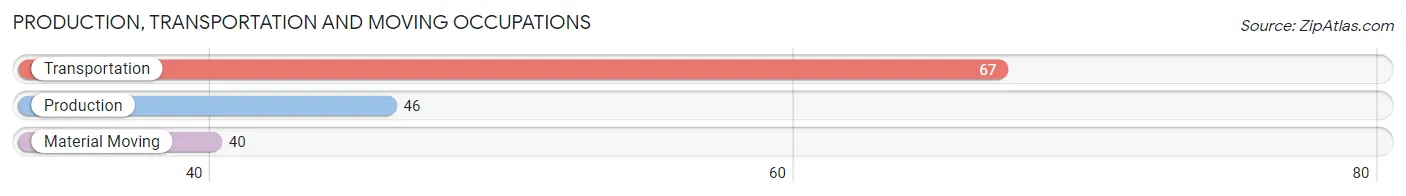
Production, Transportation and Moving Occupations
The most common Production, Transportation and Moving occupations in Indianola are Transportation (67 | 3.9%), Production (46 | 2.7%), and Material Moving (40 | 2.3%).
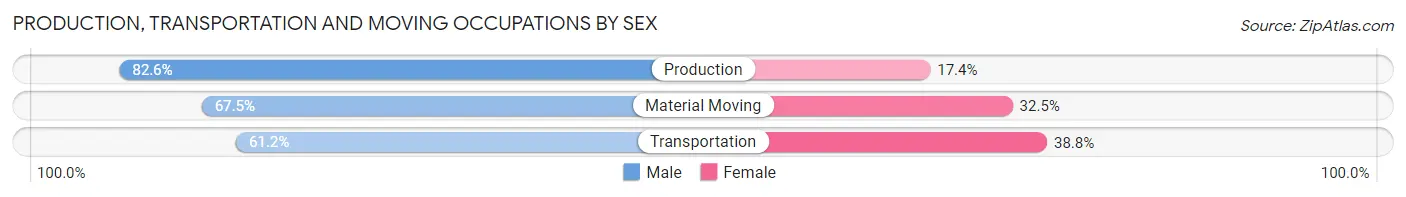
Production, Transportation and Moving Occupations by Sex
| Occupation | Male | Female |
| Production | 38 (82.6%) | 8 (17.4%) |
| Transportation | 41 (61.2%) | 26 (38.8%) |
| Material Moving | 27 (67.5%) | 13 (32.5%) |
| Total (Category) | 106 (69.3%) | 47 (30.7%) |
| Total (Overall) | 896 (52.0%) | 828 (48.0%) |
Employment Industries by Sex in Indianola
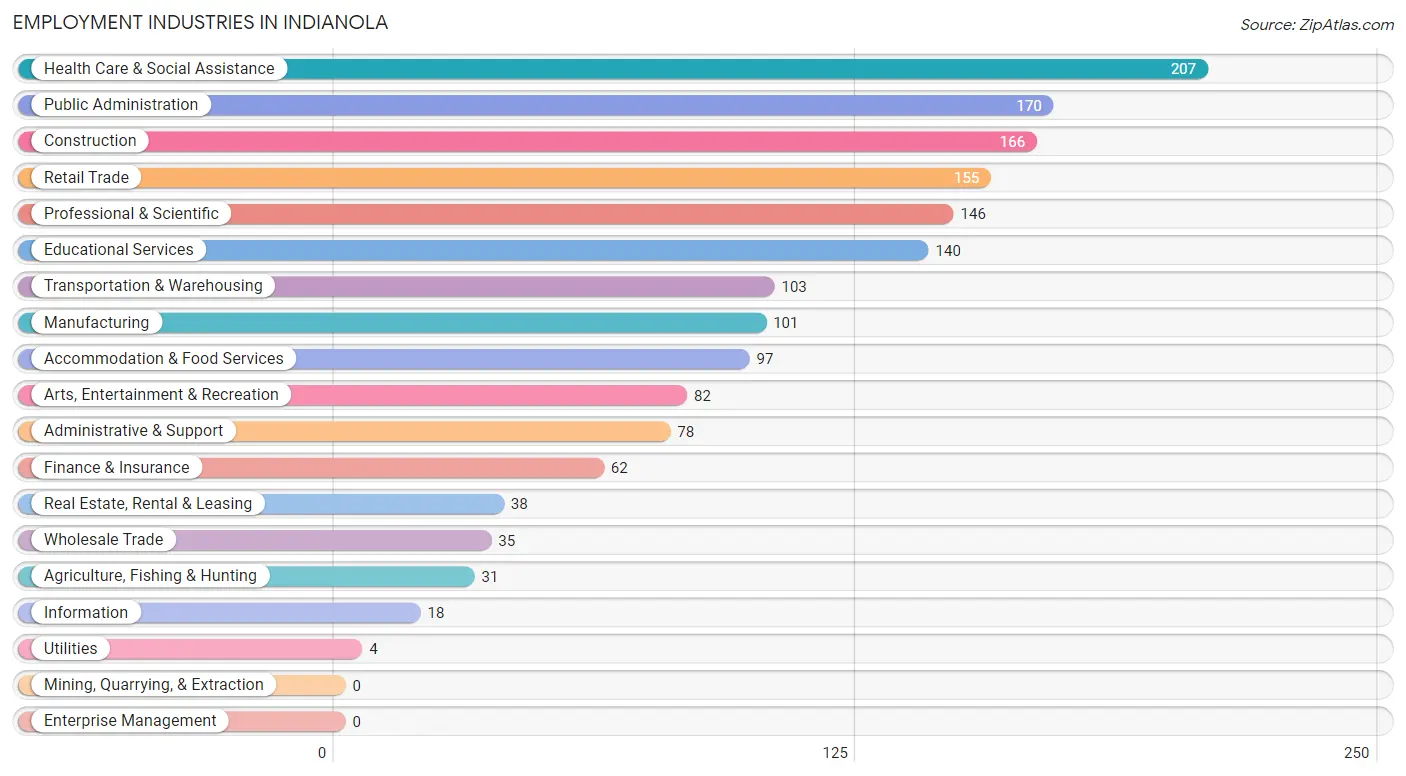
Employment Industries in Indianola
The major employment industries in Indianola include Health Care & Social Assistance (207 | 12.0%), Public Administration (170 | 9.9%), Construction (166 | 9.6%), Retail Trade (155 | 9.0%), and Professional & Scientific (146 | 8.5%).
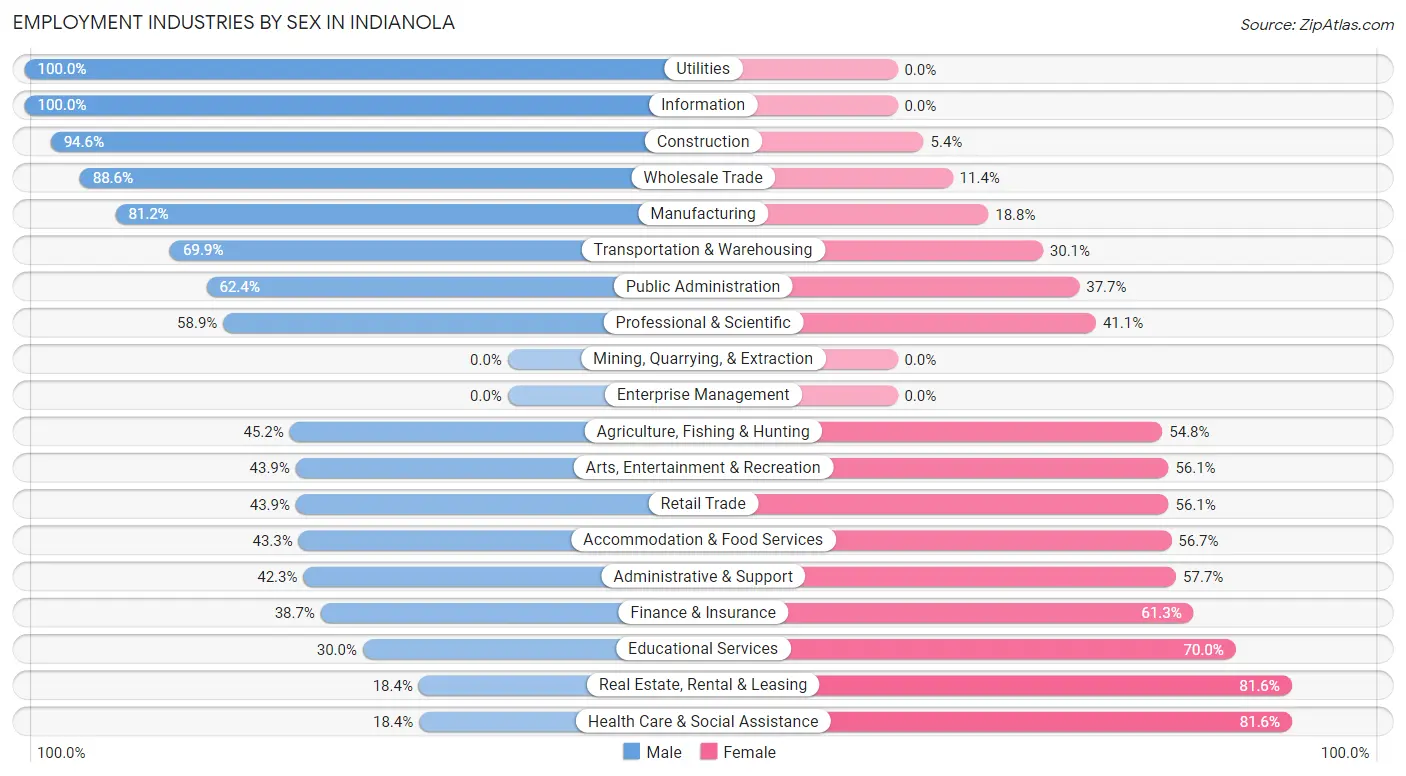
Employment Industries by Sex in Indianola
The Indianola industries that see more men than women are Utilities (100.0%), Information (100.0%), and Construction (94.6%), whereas the industries that tend to have a higher number of women are Health Care & Social Assistance (81.6%), Real Estate, Rental & Leasing (81.6%), and Educational Services (70.0%).
| Industry | Male | Female |
| Agriculture, Fishing & Hunting | 14 (45.2%) | 17 (54.8%) |
| Mining, Quarrying, & Extraction | 0 (0.0%) | 0 (0.0%) |
| Construction | 157 (94.6%) | 9 (5.4%) |
| Manufacturing | 82 (81.2%) | 19 (18.8%) |
| Wholesale Trade | 31 (88.6%) | 4 (11.4%) |
| Retail Trade | 68 (43.9%) | 87 (56.1%) |
| Transportation & Warehousing | 72 (69.9%) | 31 (30.1%) |
| Utilities | 4 (100.0%) | 0 (0.0%) |
| Information | 18 (100.0%) | 0 (0.0%) |
| Finance & Insurance | 24 (38.7%) | 38 (61.3%) |
| Real Estate, Rental & Leasing | 7 (18.4%) | 31 (81.6%) |
| Professional & Scientific | 86 (58.9%) | 60 (41.1%) |
| Enterprise Management | 0 (0.0%) | 0 (0.0%) |
| Administrative & Support | 33 (42.3%) | 45 (57.7%) |
| Educational Services | 42 (30.0%) | 98 (70.0%) |
| Health Care & Social Assistance | 38 (18.4%) | 169 (81.6%) |
| Arts, Entertainment & Recreation | 36 (43.9%) | 46 (56.1%) |
| Accommodation & Food Services | 42 (43.3%) | 55 (56.7%) |
| Public Administration | 106 (62.4%) | 64 (37.7%) |
| Total | 896 (52.0%) | 828 (48.0%) |
Education in Indianola
School Enrollment in Indianola
The most common levels of schooling among the 708 students in Indianola are middle school (173 | 24.4%), high school (171 | 24.1%), and elementary school (169 | 23.9%).
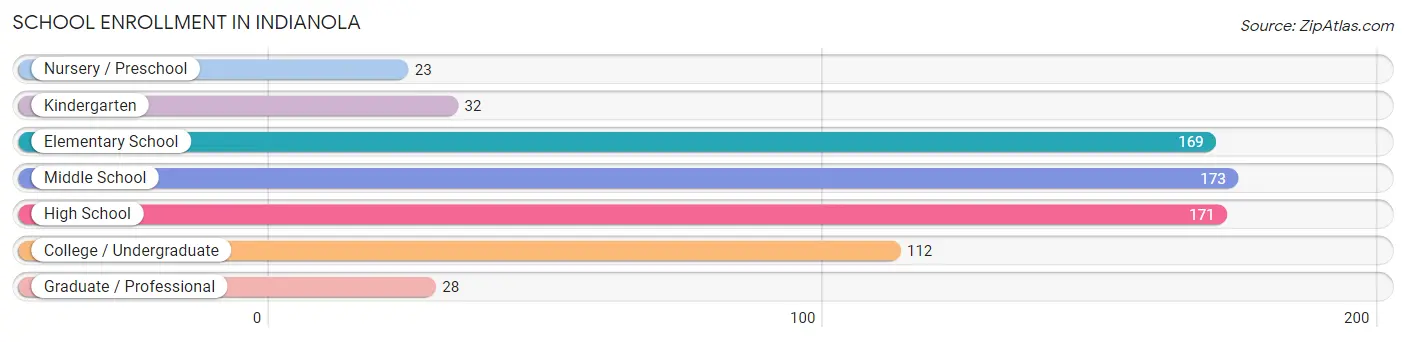
| School Level | # Students | % Students |
| Nursery / Preschool | 23 | 3.3% |
| Kindergarten | 32 | 4.5% |
| Elementary School | 169 | 23.9% |
| Middle School | 173 | 24.4% |
| High School | 171 | 24.1% |
| College / Undergraduate | 112 | 15.8% |
| Graduate / Professional | 28 | 4.0% |
| Total | 708 | 100.0% |
School Enrollment by Age by Funding Source in Indianola
Out of a total of 708 students who are enrolled in schools in Indianola, 108 (15.3%) attend a private institution, while the remaining 600 (84.7%) are enrolled in public schools. The age group of 3 to 4 year olds has the highest likelihood of being enrolled in private schools, with 11 (52.4% in the age bracket) enrolled. Conversely, the age group of 18 to 19 year olds has the lowest likelihood of being enrolled in a private school, with 44 (100.0% in the age bracket) attending a public institution.
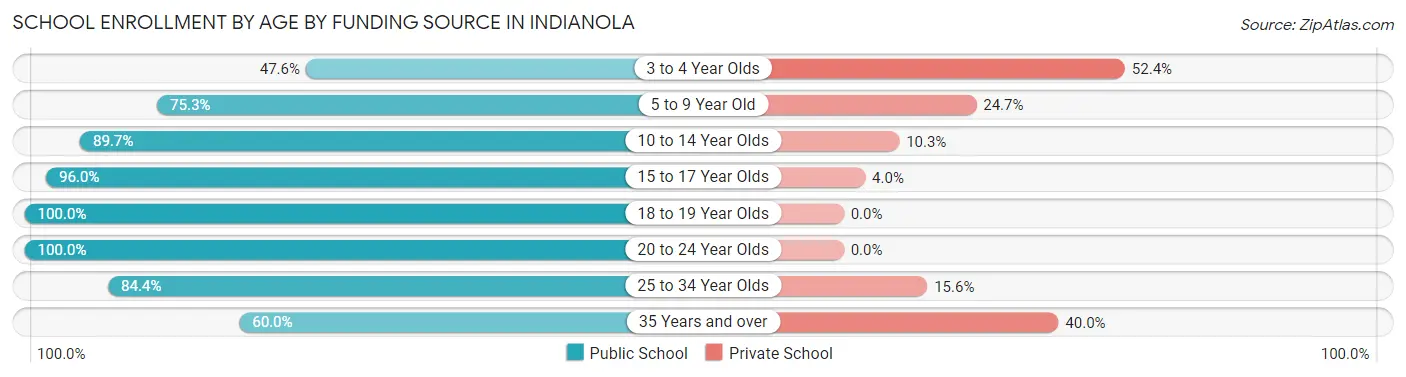
| Age Bracket | Public School | Private School |
| 3 to 4 Year Olds | 10 (47.6%) | 11 (52.4%) |
| 5 to 9 Year Old | 125 (75.3%) | 41 (24.7%) |
| 10 to 14 Year Olds | 208 (89.7%) | 24 (10.3%) |
| 15 to 17 Year Olds | 120 (96.0%) | 5 (4.0%) |
| 18 to 19 Year Olds | 44 (100.0%) | 0 (0.0%) |
| 20 to 24 Year Olds | 25 (100.0%) | 0 (0.0%) |
| 25 to 34 Year Olds | 38 (84.4%) | 7 (15.6%) |
| 35 Years and over | 30 (60.0%) | 20 (40.0%) |
| Total | 600 (84.7%) | 108 (15.3%) |
Educational Attainment by Field of Study in Indianola
Science & technology (105 | 9.6%), education (103 | 9.4%), business (102 | 9.3%), bio, nature & agricultural (98 | 8.9%), and arts & humanities (89 | 8.1%) are the most common fields of study among 1,100 individuals in Indianola who have obtained a bachelor's degree or higher.
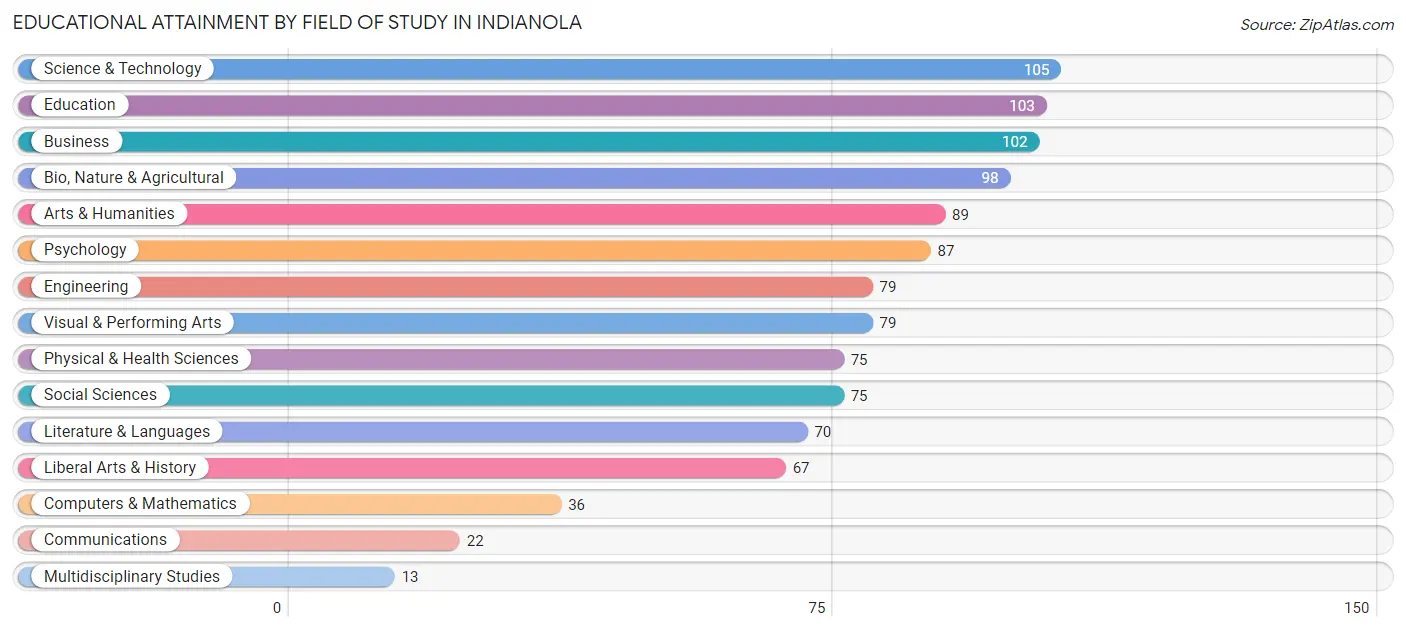
| Field of Study | # Graduates | % Graduates |
| Computers & Mathematics | 36 | 3.3% |
| Bio, Nature & Agricultural | 98 | 8.9% |
| Physical & Health Sciences | 75 | 6.8% |
| Psychology | 87 | 7.9% |
| Social Sciences | 75 | 6.8% |
| Engineering | 79 | 7.2% |
| Multidisciplinary Studies | 13 | 1.2% |
| Science & Technology | 105 | 9.6% |
| Business | 102 | 9.3% |
| Education | 103 | 9.4% |
| Literature & Languages | 70 | 6.4% |
| Liberal Arts & History | 67 | 6.1% |
| Visual & Performing Arts | 79 | 7.2% |
| Communications | 22 | 2.0% |
| Arts & Humanities | 89 | 8.1% |
| Total | 1,100 | 100.0% |
Transportation & Commute in Indianola
Vehicle Availability by Sex in Indianola
The most prevalent vehicle ownership categories in Indianola are males with 2 vehicles (375, accounting for 41.9%) and females with 2 vehicles (314, making up 46.7%).
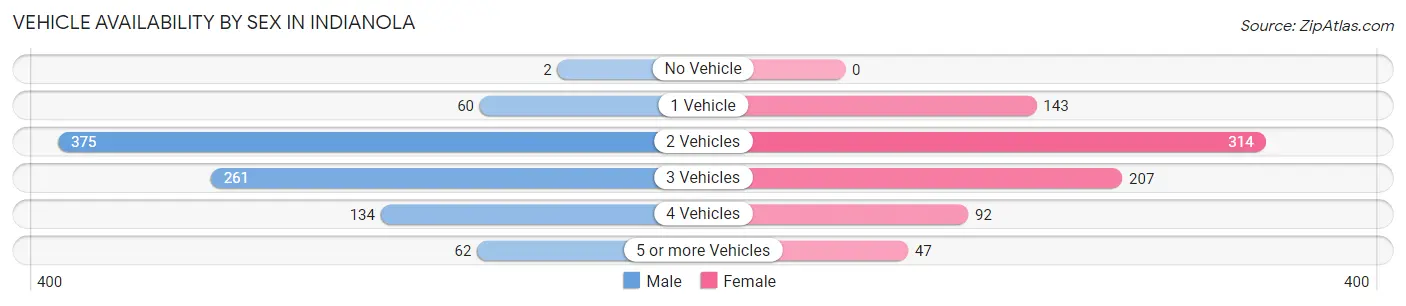
| Vehicles Available | Male | Female |
| No Vehicle | 2 (0.2%) | 0 (0.0%) |
| 1 Vehicle | 60 (6.7%) | 143 (17.8%) |
| 2 Vehicles | 375 (41.9%) | 314 (39.1%) |
| 3 Vehicles | 261 (29.2%) | 207 (25.8%) |
| 4 Vehicles | 134 (15.0%) | 92 (11.5%) |
| 5 or more Vehicles | 62 (6.9%) | 47 (5.9%) |
| Total | 894 (100.0%) | 803 (100.0%) |
Commute Time in Indianola
The most frequently occuring commute durations in Indianola are 20 to 24 minutes (236 commuters, 16.7%), 30 to 34 minutes (234 commuters, 16.5%), and 15 to 19 minutes (183 commuters, 12.9%).
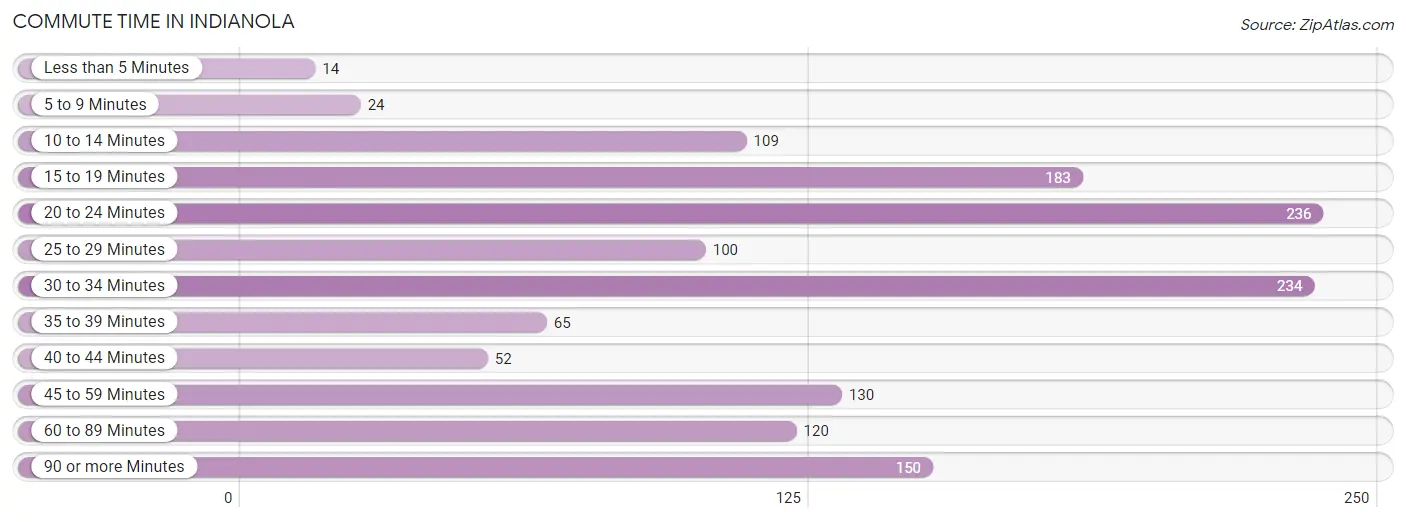
| Commute Time | # Commuters | % Commuters |
| Less than 5 Minutes | 14 | 1.0% |
| 5 to 9 Minutes | 24 | 1.7% |
| 10 to 14 Minutes | 109 | 7.7% |
| 15 to 19 Minutes | 183 | 12.9% |
| 20 to 24 Minutes | 236 | 16.7% |
| 25 to 29 Minutes | 100 | 7.1% |
| 30 to 34 Minutes | 234 | 16.5% |
| 35 to 39 Minutes | 65 | 4.6% |
| 40 to 44 Minutes | 52 | 3.7% |
| 45 to 59 Minutes | 130 | 9.2% |
| 60 to 89 Minutes | 120 | 8.5% |
| 90 or more Minutes | 150 | 10.6% |
Commute Time by Sex in Indianola
The most common commute times in Indianola are 30 to 34 minutes (132 commuters, 17.1%) for males and 20 to 24 minutes (119 commuters, 18.5%) for females.
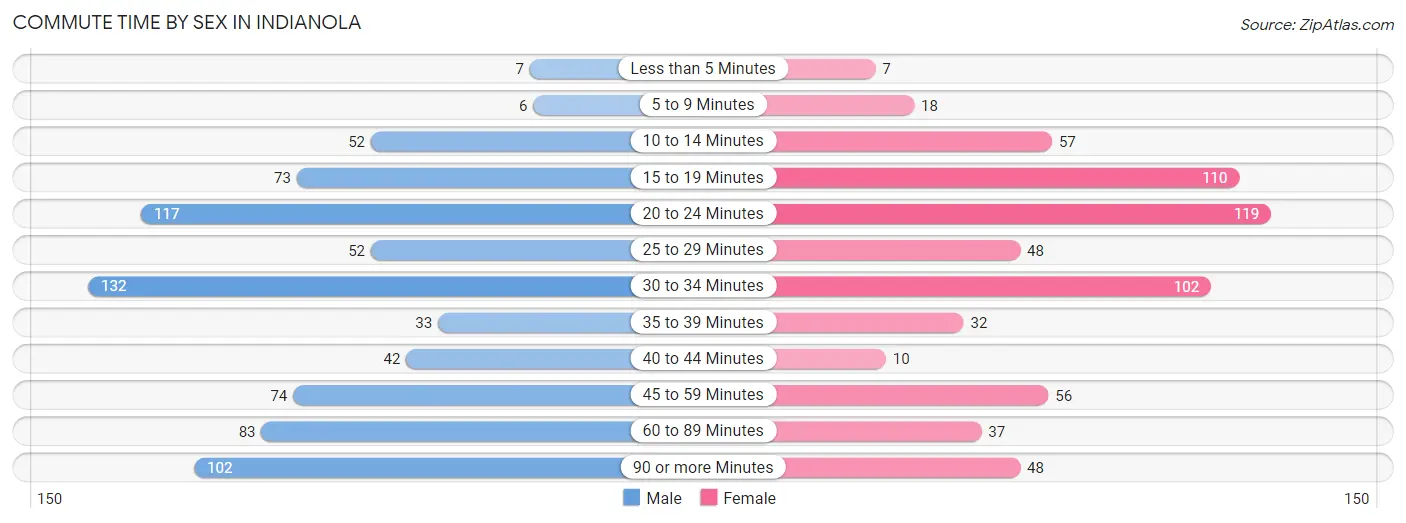
| Commute Time | Male | Female |
| Less than 5 Minutes | 7 (0.9%) | 7 (1.1%) |
| 5 to 9 Minutes | 6 (0.8%) | 18 (2.8%) |
| 10 to 14 Minutes | 52 (6.7%) | 57 (8.8%) |
| 15 to 19 Minutes | 73 (9.4%) | 110 (17.1%) |
| 20 to 24 Minutes | 117 (15.1%) | 119 (18.5%) |
| 25 to 29 Minutes | 52 (6.7%) | 48 (7.4%) |
| 30 to 34 Minutes | 132 (17.1%) | 102 (15.8%) |
| 35 to 39 Minutes | 33 (4.3%) | 32 (5.0%) |
| 40 to 44 Minutes | 42 (5.4%) | 10 (1.5%) |
| 45 to 59 Minutes | 74 (9.6%) | 56 (8.7%) |
| 60 to 89 Minutes | 83 (10.7%) | 37 (5.8%) |
| 90 or more Minutes | 102 (13.2%) | 48 (7.4%) |
Time of Departure to Work by Sex in Indianola
The most frequent times of departure to work in Indianola are 7:00 AM to 7:29 AM (123, 15.9%) for males and 7:30 AM to 7:59 AM (98, 15.2%) for females.
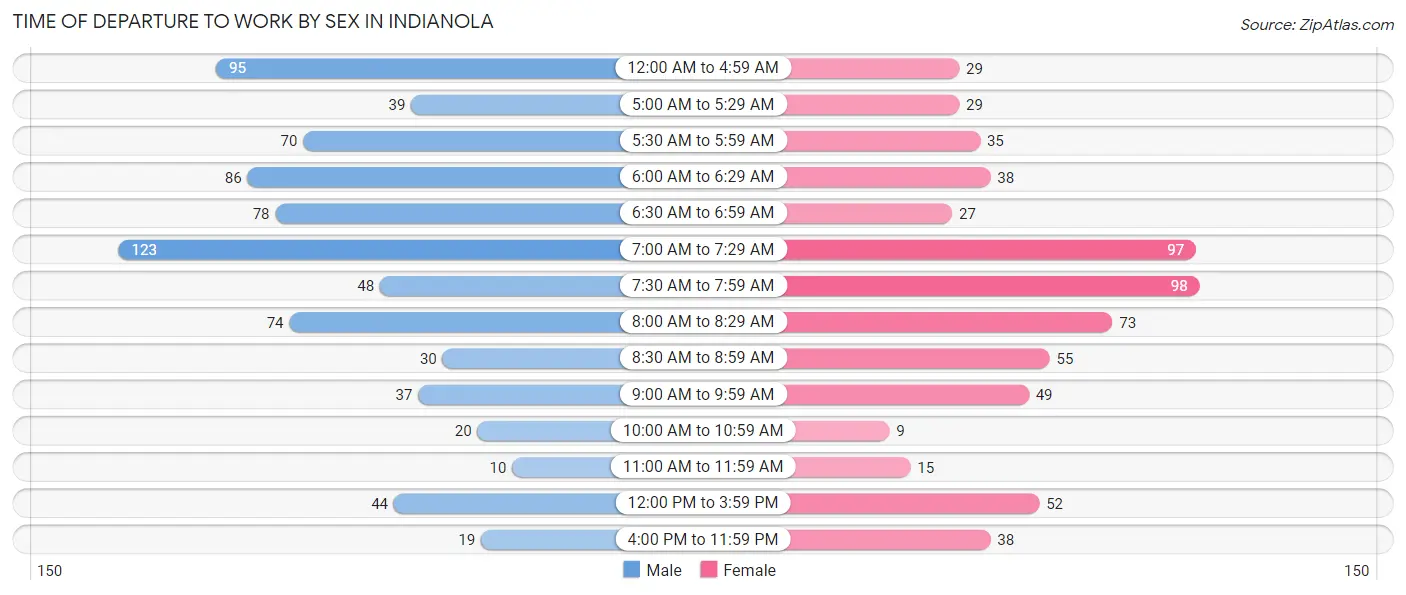
| Time of Departure | Male | Female |
| 12:00 AM to 4:59 AM | 95 (12.3%) | 29 (4.5%) |
| 5:00 AM to 5:29 AM | 39 (5.1%) | 29 (4.5%) |
| 5:30 AM to 5:59 AM | 70 (9.1%) | 35 (5.4%) |
| 6:00 AM to 6:29 AM | 86 (11.1%) | 38 (5.9%) |
| 6:30 AM to 6:59 AM | 78 (10.1%) | 27 (4.2%) |
| 7:00 AM to 7:29 AM | 123 (15.9%) | 97 (15.1%) |
| 7:30 AM to 7:59 AM | 48 (6.2%) | 98 (15.2%) |
| 8:00 AM to 8:29 AM | 74 (9.6%) | 73 (11.3%) |
| 8:30 AM to 8:59 AM | 30 (3.9%) | 55 (8.5%) |
| 9:00 AM to 9:59 AM | 37 (4.8%) | 49 (7.6%) |
| 10:00 AM to 10:59 AM | 20 (2.6%) | 9 (1.4%) |
| 11:00 AM to 11:59 AM | 10 (1.3%) | 15 (2.3%) |
| 12:00 PM to 3:59 PM | 44 (5.7%) | 52 (8.1%) |
| 4:00 PM to 11:59 PM | 19 (2.5%) | 38 (5.9%) |
| Total | 773 (100.0%) | 644 (100.0%) |
Housing Occupancy in Indianola
Occupancy by Ownership in Indianola
Of the total 1,474 dwellings in Indianola, owner-occupied units account for 1,215 (82.4%), while renter-occupied units make up 259 (17.6%).
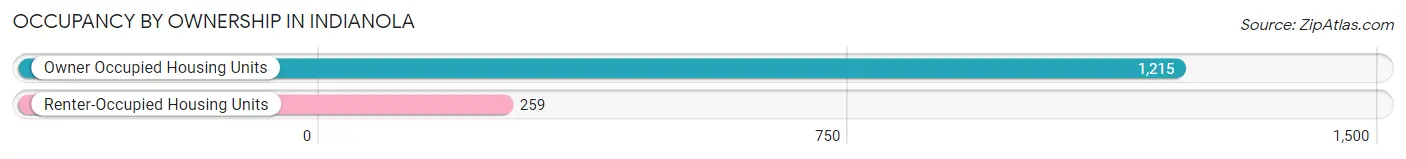
| Occupancy | # Housing Units | % Housing Units |
| Owner Occupied Housing Units | 1,215 | 82.4% |
| Renter-Occupied Housing Units | 259 | 17.6% |
| Total Occupied Housing Units | 1,474 | 100.0% |
Occupancy by Household Size in Indianola
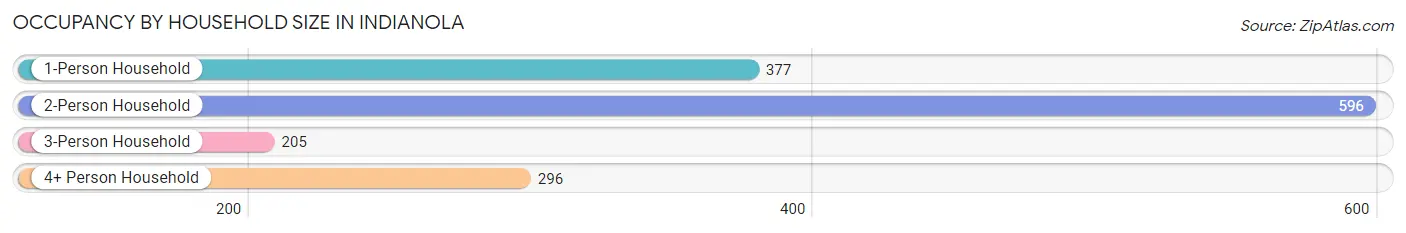
| Household Size | # Housing Units | % Housing Units |
| 1-Person Household | 377 | 25.6% |
| 2-Person Household | 596 | 40.4% |
| 3-Person Household | 205 | 13.9% |
| 4+ Person Household | 296 | 20.1% |
| Total Housing Units | 1,474 | 100.0% |
Occupancy by Ownership by Household Size in Indianola
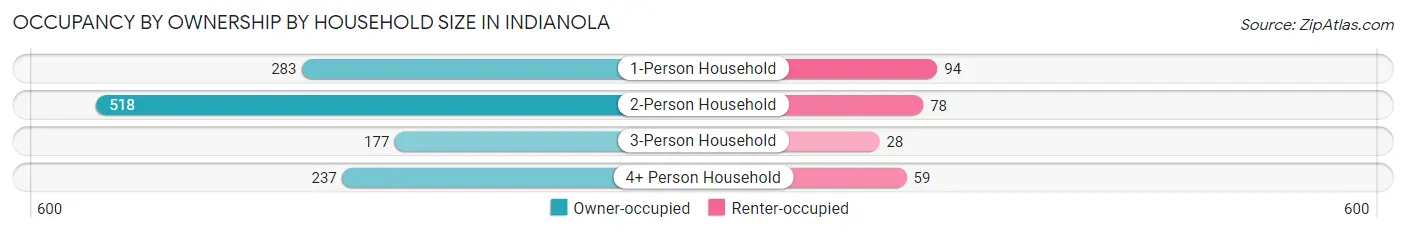
| Household Size | Owner-occupied | Renter-occupied |
| 1-Person Household | 283 (75.1%) | 94 (24.9%) |
| 2-Person Household | 518 (86.9%) | 78 (13.1%) |
| 3-Person Household | 177 (86.3%) | 28 (13.7%) |
| 4+ Person Household | 237 (80.1%) | 59 (19.9%) |
| Total Housing Units | 1,215 (82.4%) | 259 (17.6%) |
Occupancy by Educational Attainment in Indianola
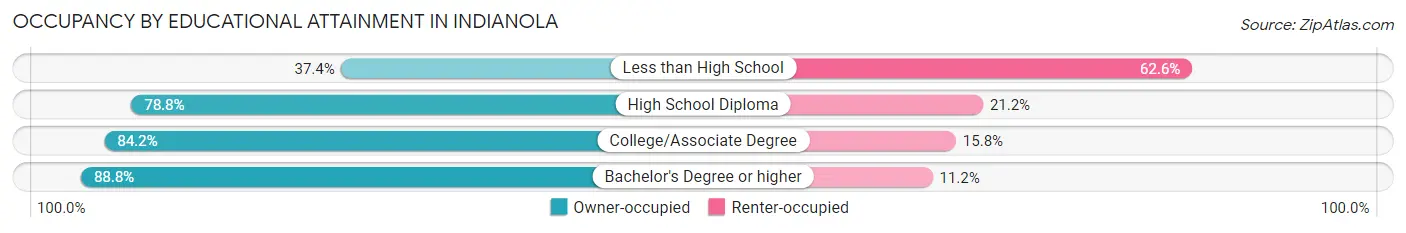
| Household Size | Owner-occupied | Renter-occupied |
| Less than High School | 34 (37.4%) | 57 (62.6%) |
| High School Diploma | 175 (78.8%) | 47 (21.2%) |
| College/Associate Degree | 458 (84.2%) | 86 (15.8%) |
| Bachelor's Degree or higher | 548 (88.8%) | 69 (11.2%) |
Occupancy by Age of Householder in Indianola
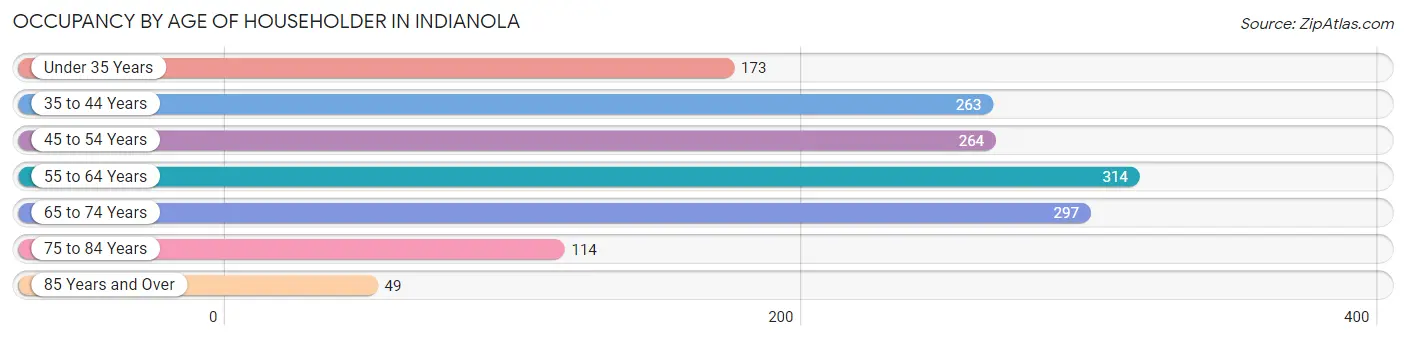
| Age Bracket | # Households | % Households |
| Under 35 Years | 173 | 11.7% |
| 35 to 44 Years | 263 | 17.8% |
| 45 to 54 Years | 264 | 17.9% |
| 55 to 64 Years | 314 | 21.3% |
| 65 to 74 Years | 297 | 20.2% |
| 75 to 84 Years | 114 | 7.7% |
| 85 Years and Over | 49 | 3.3% |
| Total | 1,474 | 100.0% |
Housing Finances in Indianola
Median Income by Occupancy in Indianola
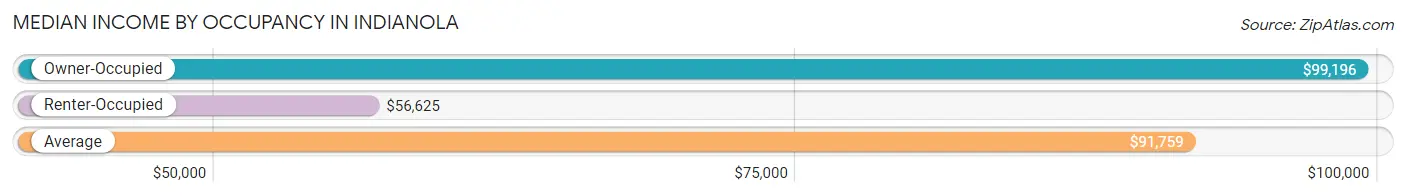
| Occupancy Type | # Households | Median Income |
| Owner-Occupied | 1,215 (82.4%) | $99,196 |
| Renter-Occupied | 259 (17.6%) | $56,625 |
| Average | 1,474 (100.0%) | $91,759 |
Occupancy by Householder Income Bracket in Indianola
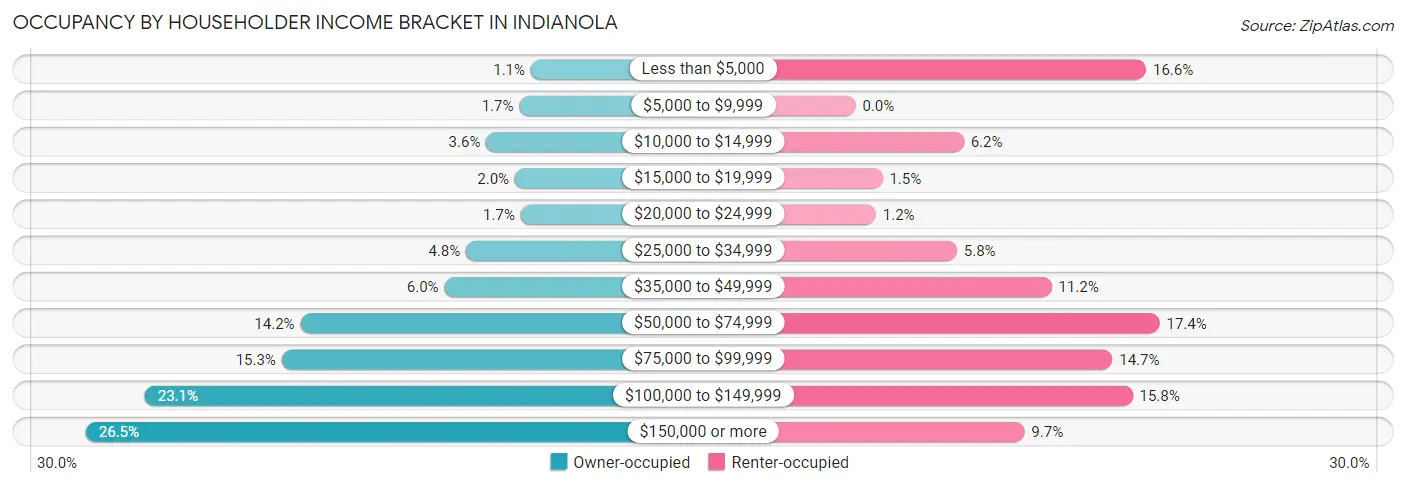
| Income Bracket | Owner-occupied | Renter-occupied |
| Less than $5,000 | 13 (1.1%) | 43 (16.6%) |
| $5,000 to $9,999 | 21 (1.7%) | 0 (0.0%) |
| $10,000 to $14,999 | 44 (3.6%) | 16 (6.2%) |
| $15,000 to $19,999 | 24 (2.0%) | 4 (1.5%) |
| $20,000 to $24,999 | 20 (1.7%) | 3 (1.2%) |
| $25,000 to $34,999 | 58 (4.8%) | 15 (5.8%) |
| $35,000 to $49,999 | 73 (6.0%) | 29 (11.2%) |
| $50,000 to $74,999 | 173 (14.2%) | 45 (17.4%) |
| $75,000 to $99,999 | 186 (15.3%) | 38 (14.7%) |
| $100,000 to $149,999 | 281 (23.1%) | 41 (15.8%) |
| $150,000 or more | 322 (26.5%) | 25 (9.7%) |
| Total | 1,215 (100.0%) | 259 (100.0%) |
Monthly Housing Cost Tiers in Indianola
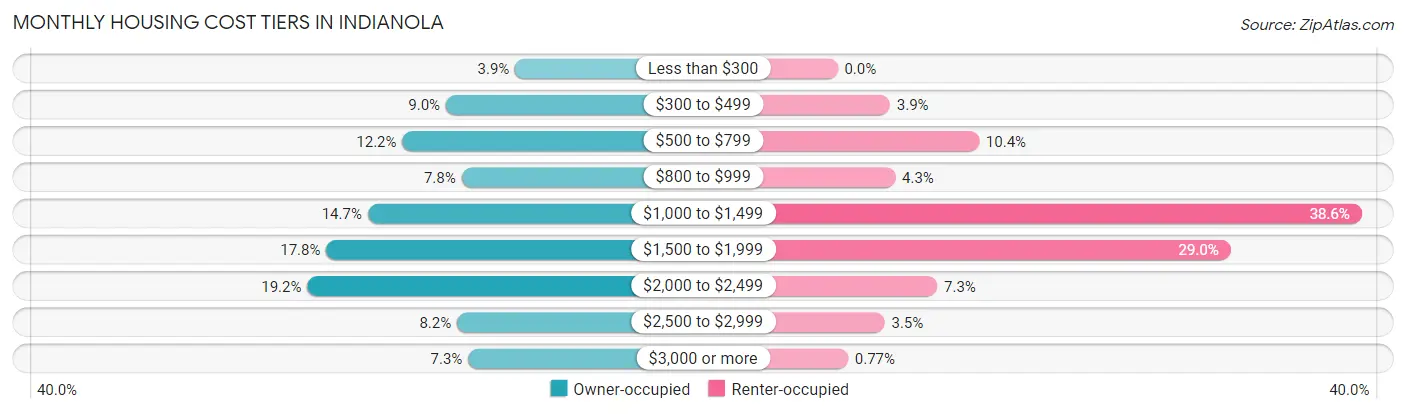
| Monthly Cost | Owner-occupied | Renter-occupied |
| Less than $300 | 47 (3.9%) | 0 (0.0%) |
| $300 to $499 | 109 (9.0%) | 10 (3.9%) |
| $500 to $799 | 148 (12.2%) | 27 (10.4%) |
| $800 to $999 | 95 (7.8%) | 11 (4.3%) |
| $1,000 to $1,499 | 179 (14.7%) | 100 (38.6%) |
| $1,500 to $1,999 | 216 (17.8%) | 75 (29.0%) |
| $2,000 to $2,499 | 233 (19.2%) | 19 (7.3%) |
| $2,500 to $2,999 | 99 (8.2%) | 9 (3.5%) |
| $3,000 or more | 89 (7.3%) | 2 (0.8%) |
| Total | 1,215 (100.0%) | 259 (100.0%) |
Physical Housing Characteristics in Indianola
Housing Structures in Indianola
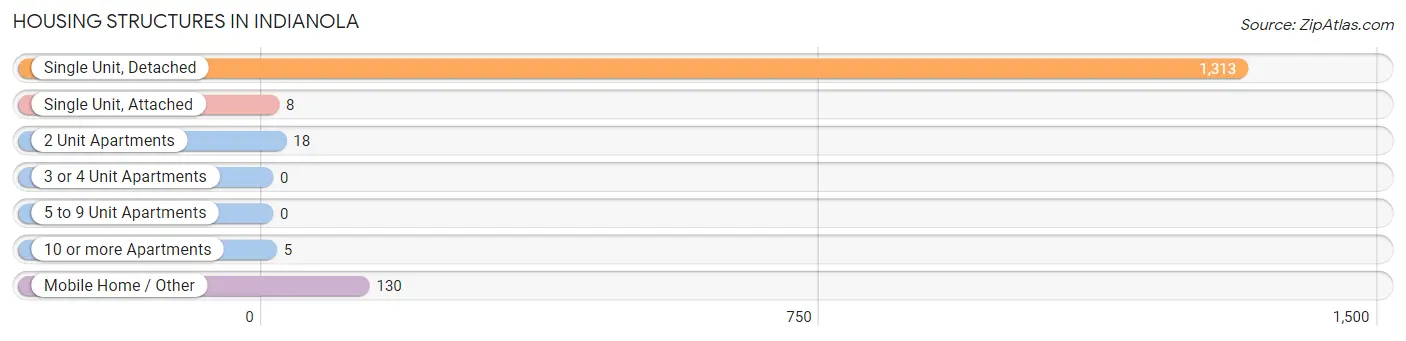
| Structure Type | # Housing Units | % Housing Units |
| Single Unit, Detached | 1,313 | 89.1% |
| Single Unit, Attached | 8 | 0.5% |
| 2 Unit Apartments | 18 | 1.2% |
| 3 or 4 Unit Apartments | 0 | 0.0% |
| 5 to 9 Unit Apartments | 0 | 0.0% |
| 10 or more Apartments | 5 | 0.3% |
| Mobile Home / Other | 130 | 8.8% |
| Total | 1,474 | 100.0% |
Housing Structures by Occupancy in Indianola
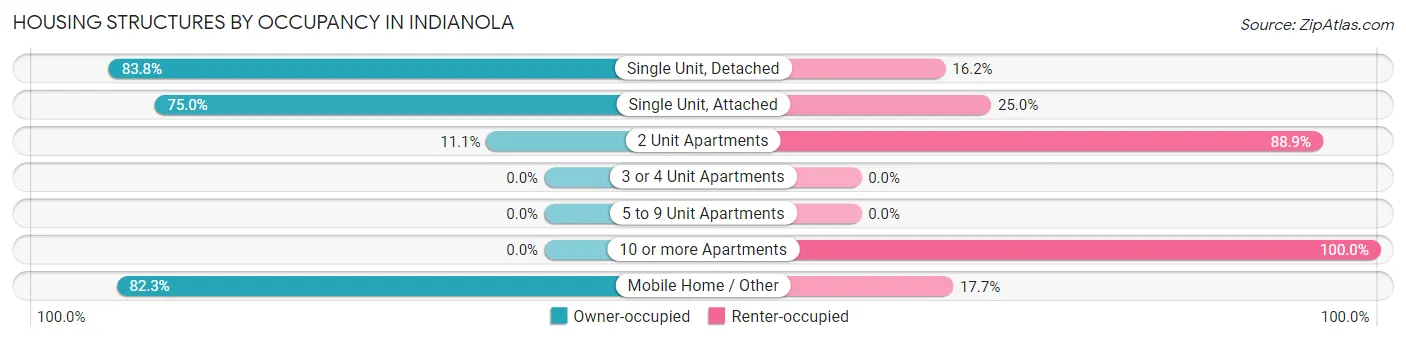
| Structure Type | Owner-occupied | Renter-occupied |
| Single Unit, Detached | 1,100 (83.8%) | 213 (16.2%) |
| Single Unit, Attached | 6 (75.0%) | 2 (25.0%) |
| 2 Unit Apartments | 2 (11.1%) | 16 (88.9%) |
| 3 or 4 Unit Apartments | 0 (0.0%) | 0 (0.0%) |
| 5 to 9 Unit Apartments | 0 (0.0%) | 0 (0.0%) |
| 10 or more Apartments | 0 (0.0%) | 5 (100.0%) |
| Mobile Home / Other | 107 (82.3%) | 23 (17.7%) |
| Total | 1,215 (82.4%) | 259 (17.6%) |
Housing Structures by Number of Rooms in Indianola
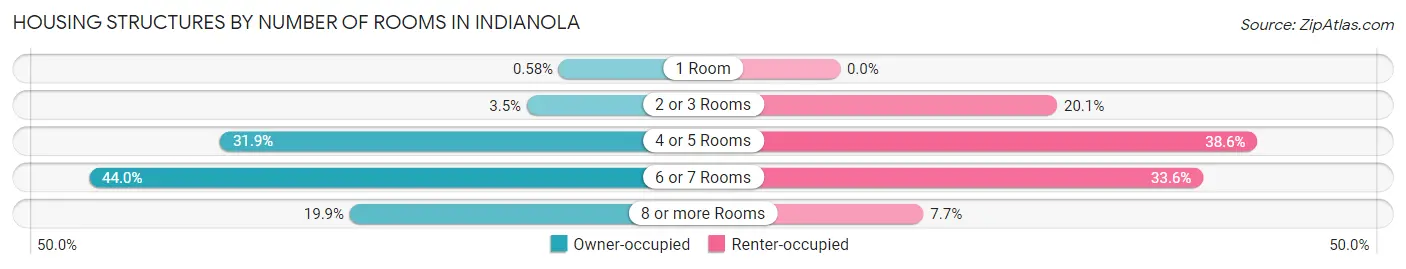
| Number of Rooms | Owner-occupied | Renter-occupied |
| 1 Room | 7 (0.6%) | 0 (0.0%) |
| 2 or 3 Rooms | 43 (3.5%) | 52 (20.1%) |
| 4 or 5 Rooms | 388 (31.9%) | 100 (38.6%) |
| 6 or 7 Rooms | 535 (44.0%) | 87 (33.6%) |
| 8 or more Rooms | 242 (19.9%) | 20 (7.7%) |
| Total | 1,215 (100.0%) | 259 (100.0%) |
Housing Structure by Heating Type in Indianola
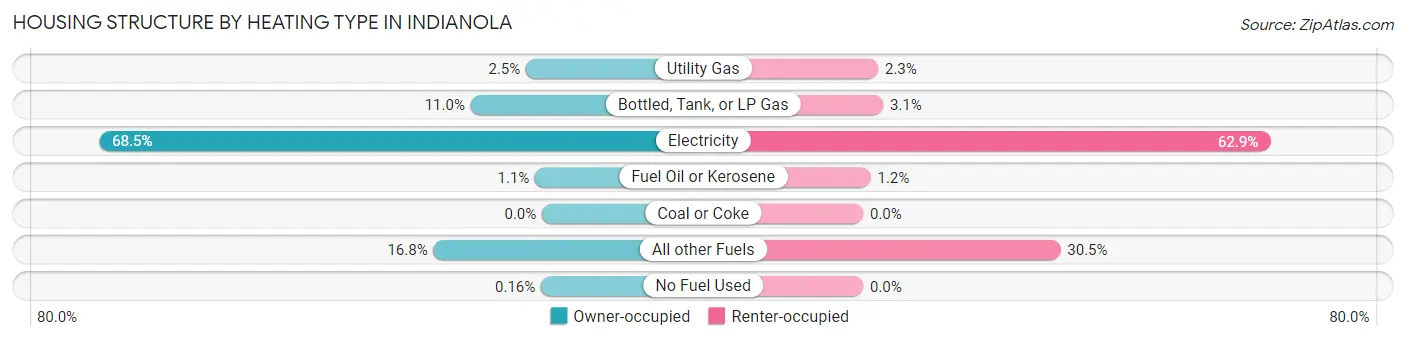
| Heating Type | Owner-occupied | Renter-occupied |
| Utility Gas | 30 (2.5%) | 6 (2.3%) |
| Bottled, Tank, or LP Gas | 134 (11.0%) | 8 (3.1%) |
| Electricity | 832 (68.5%) | 163 (62.9%) |
| Fuel Oil or Kerosene | 13 (1.1%) | 3 (1.2%) |
| Coal or Coke | 0 (0.0%) | 0 (0.0%) |
| All other Fuels | 204 (16.8%) | 79 (30.5%) |
| No Fuel Used | 2 (0.2%) | 0 (0.0%) |
| Total | 1,215 (100.0%) | 259 (100.0%) |
Household Vehicle Usage in Indianola
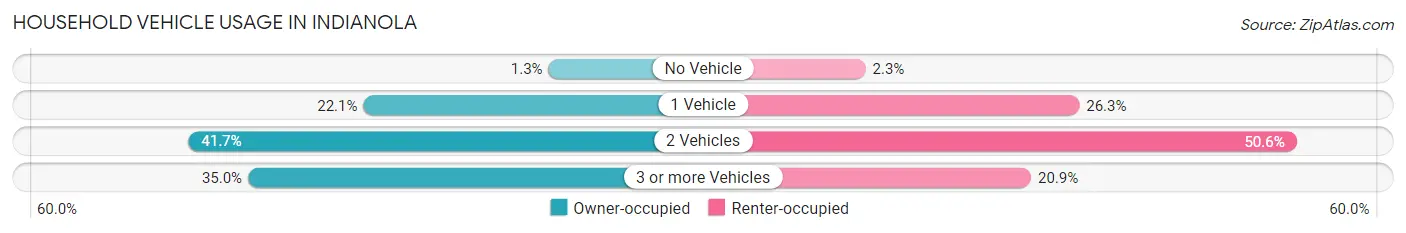
| Vehicles per Household | Owner-occupied | Renter-occupied |
| No Vehicle | 16 (1.3%) | 6 (2.3%) |
| 1 Vehicle | 268 (22.1%) | 68 (26.3%) |
| 2 Vehicles | 506 (41.6%) | 131 (50.6%) |
| 3 or more Vehicles | 425 (35.0%) | 54 (20.8%) |
| Total | 1,215 (100.0%) | 259 (100.0%) |
Real Estate & Mortgages in Indianola
Real Estate and Mortgage Overview in Indianola
| Characteristic | Without Mortgage | With Mortgage |
| Housing Units | 420 | 795 |
| Median Property Value | $487,700 | $432,700 |
| Median Household Income | $71,875 | $255 |
| Monthly Housing Costs | $604 | $87 |
| Real Estate Taxes | $3,735 | $11 |
Property Value by Mortgage Status in Indianola
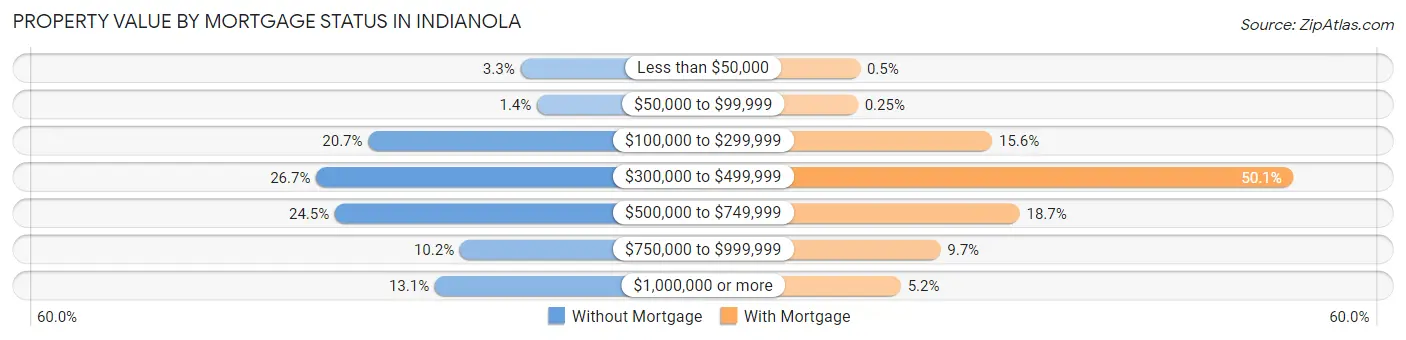
| Property Value | Without Mortgage | With Mortgage |
| Less than $50,000 | 14 (3.3%) | 4 (0.5%) |
| $50,000 to $99,999 | 6 (1.4%) | 2 (0.3%) |
| $100,000 to $299,999 | 87 (20.7%) | 124 (15.6%) |
| $300,000 to $499,999 | 112 (26.7%) | 398 (50.1%) |
| $500,000 to $749,999 | 103 (24.5%) | 149 (18.7%) |
| $750,000 to $999,999 | 43 (10.2%) | 77 (9.7%) |
| $1,000,000 or more | 55 (13.1%) | 41 (5.2%) |
| Total | 420 (100.0%) | 795 (100.0%) |
Household Income by Mortgage Status in Indianola
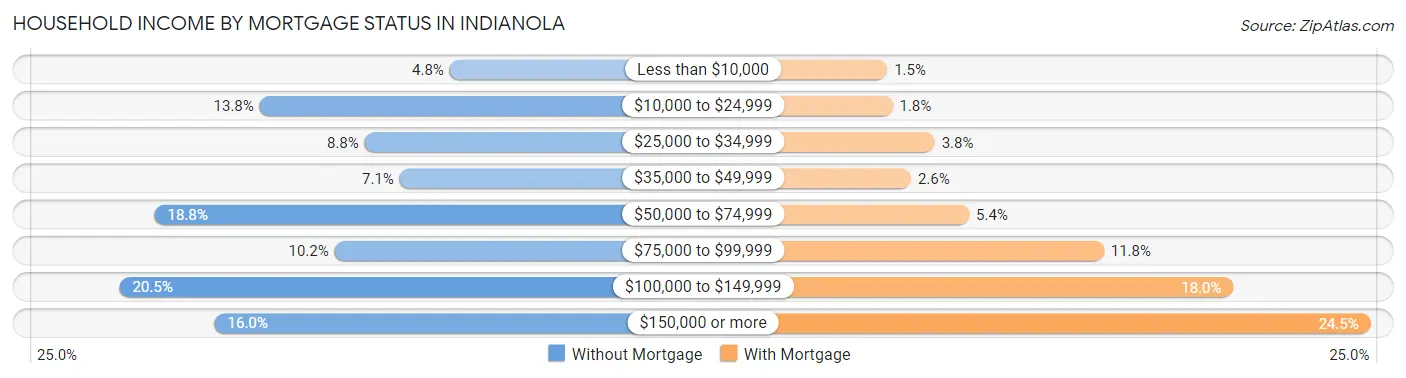
| Household Income | Without Mortgage | With Mortgage |
| Less than $10,000 | 20 (4.8%) | 12 (1.5%) |
| $10,000 to $24,999 | 58 (13.8%) | 14 (1.8%) |
| $25,000 to $34,999 | 37 (8.8%) | 30 (3.8%) |
| $35,000 to $49,999 | 30 (7.1%) | 21 (2.6%) |
| $50,000 to $74,999 | 79 (18.8%) | 43 (5.4%) |
| $75,000 to $99,999 | 43 (10.2%) | 94 (11.8%) |
| $100,000 to $149,999 | 86 (20.5%) | 143 (18.0%) |
| $150,000 or more | 67 (16.0%) | 195 (24.5%) |
| Total | 420 (100.0%) | 795 (100.0%) |
Property Value to Household Income Ratio in Indianola
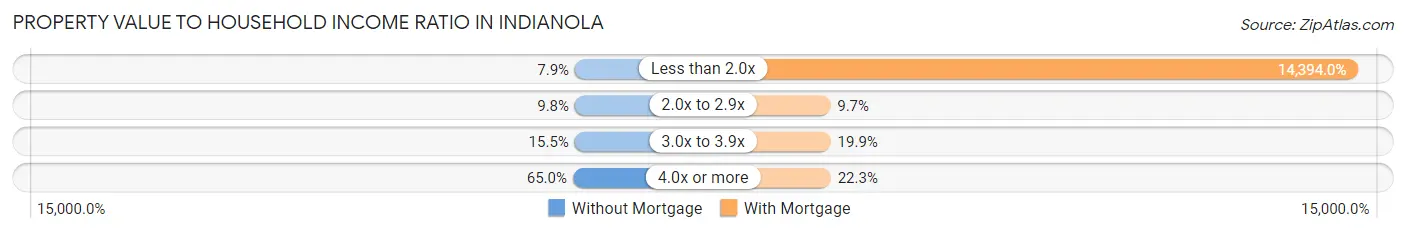
| Value-to-Income Ratio | Without Mortgage | With Mortgage |
| Less than 2.0x | 33 (7.9%) | 114,432 (14,394.0%) |
| 2.0x to 2.9x | 41 (9.8%) | 77 (9.7%) |
| 3.0x to 3.9x | 65 (15.5%) | 158 (19.9%) |
| 4.0x or more | 273 (65.0%) | 177 (22.3%) |
| Total | 420 (100.0%) | 795 (100.0%) |
Real Estate Taxes by Mortgage Status in Indianola
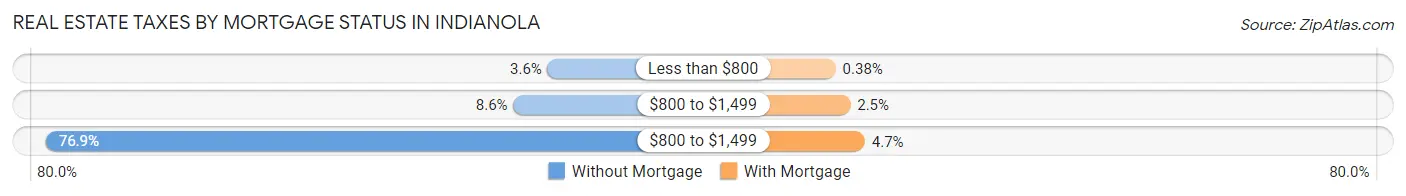
| Property Taxes | Without Mortgage | With Mortgage |
| Less than $800 | 15 (3.6%) | 3 (0.4%) |
| $800 to $1,499 | 36 (8.6%) | 20 (2.5%) |
| $800 to $1,499 | 323 (76.9%) | 37 (4.6%) |
| Total | 420 (100.0%) | 795 (100.0%) |
Health & Disability in Indianola
Health Insurance Coverage by Age in Indianola
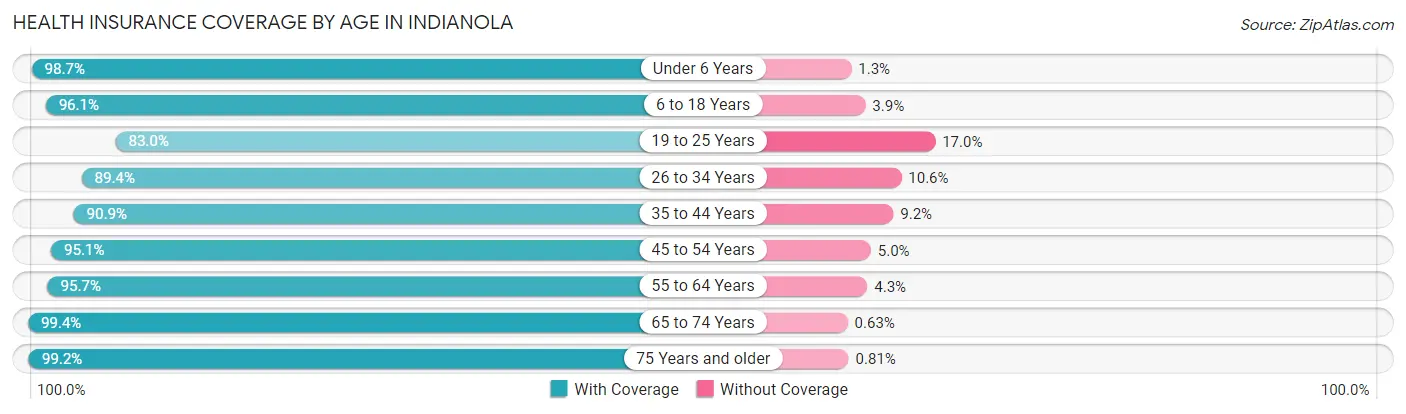
| Age Bracket | With Coverage | Without Coverage |
| Under 6 Years | 151 (98.7%) | 2 (1.3%) |
| 6 to 18 Years | 536 (96.1%) | 22 (3.9%) |
| 19 to 25 Years | 191 (83.0%) | 39 (17.0%) |
| 26 to 34 Years | 319 (89.4%) | 38 (10.6%) |
| 35 to 44 Years | 437 (90.8%) | 44 (9.1%) |
| 45 to 54 Years | 422 (95.1%) | 22 (5.0%) |
| 55 to 64 Years | 556 (95.7%) | 25 (4.3%) |
| 65 to 74 Years | 470 (99.4%) | 3 (0.6%) |
| 75 Years and older | 246 (99.2%) | 2 (0.8%) |
| Total | 3,328 (94.4%) | 197 (5.6%) |
Health Insurance Coverage by Citizenship Status in Indianola
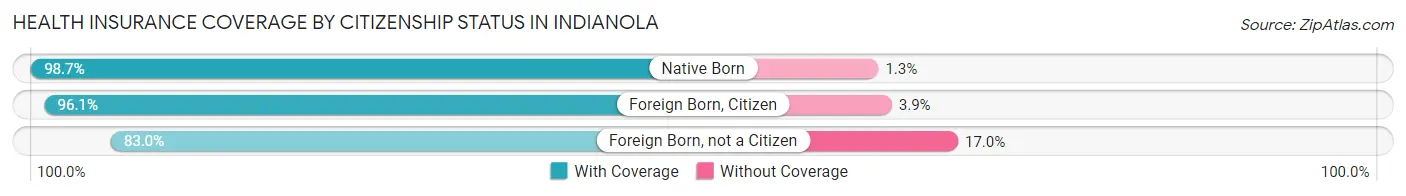
| Citizenship Status | With Coverage | Without Coverage |
| Native Born | 151 (98.7%) | 2 (1.3%) |
| Foreign Born, Citizen | 536 (96.1%) | 22 (3.9%) |
| Foreign Born, not a Citizen | 191 (83.0%) | 39 (17.0%) |
Health Insurance Coverage by Household Income in Indianola
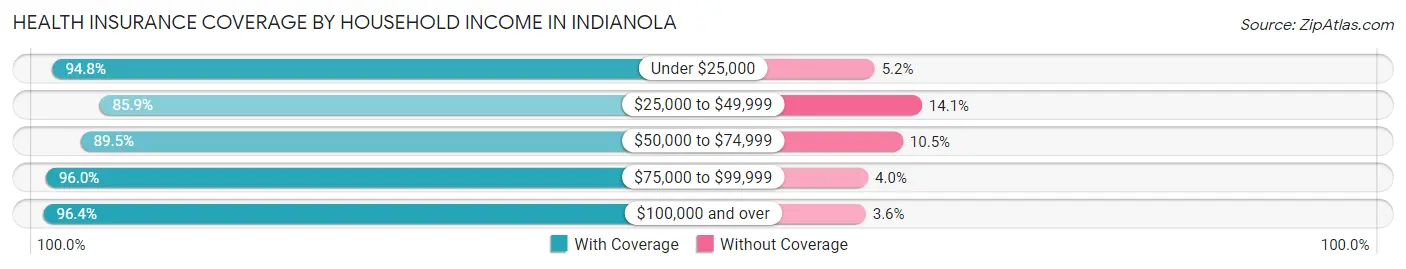
| Household Income | With Coverage | Without Coverage |
| Under $25,000 | 272 (94.8%) | 15 (5.2%) |
| $25,000 to $49,999 | 281 (85.9%) | 46 (14.1%) |
| $50,000 to $74,999 | 383 (89.5%) | 45 (10.5%) |
| $75,000 to $99,999 | 576 (96.0%) | 24 (4.0%) |
| $100,000 and over | 1,816 (96.4%) | 67 (3.6%) |
Public vs Private Health Insurance Coverage by Age in Indianola
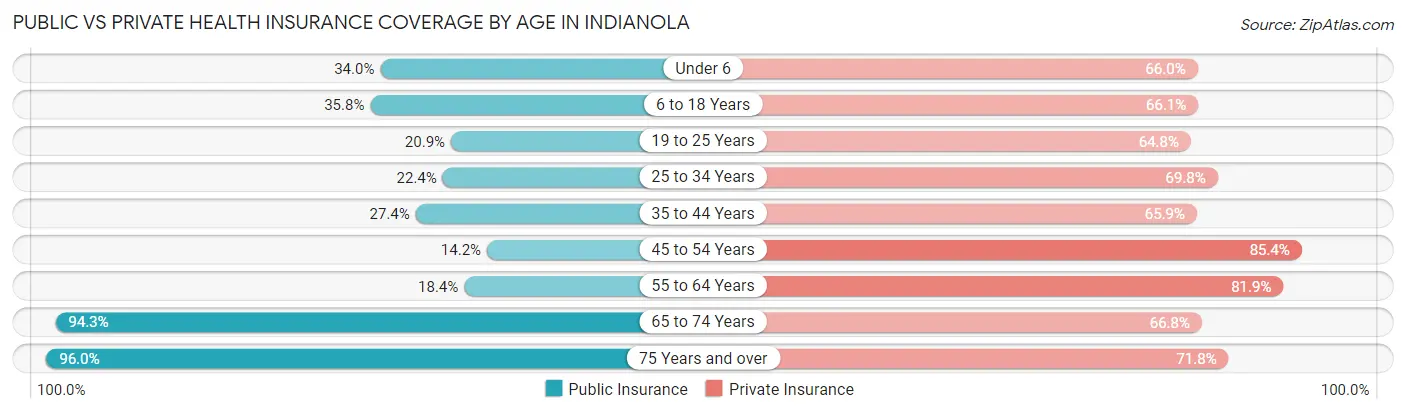
| Age Bracket | Public Insurance | Private Insurance |
| Under 6 | 52 (34.0%) | 101 (66.0%) |
| 6 to 18 Years | 200 (35.8%) | 369 (66.1%) |
| 19 to 25 Years | 48 (20.9%) | 149 (64.8%) |
| 25 to 34 Years | 80 (22.4%) | 249 (69.8%) |
| 35 to 44 Years | 132 (27.4%) | 317 (65.9%) |
| 45 to 54 Years | 63 (14.2%) | 379 (85.4%) |
| 55 to 64 Years | 107 (18.4%) | 476 (81.9%) |
| 65 to 74 Years | 446 (94.3%) | 316 (66.8%) |
| 75 Years and over | 238 (96.0%) | 178 (71.8%) |
| Total | 1,366 (38.8%) | 2,534 (71.9%) |
Disability Status by Sex by Age in Indianola
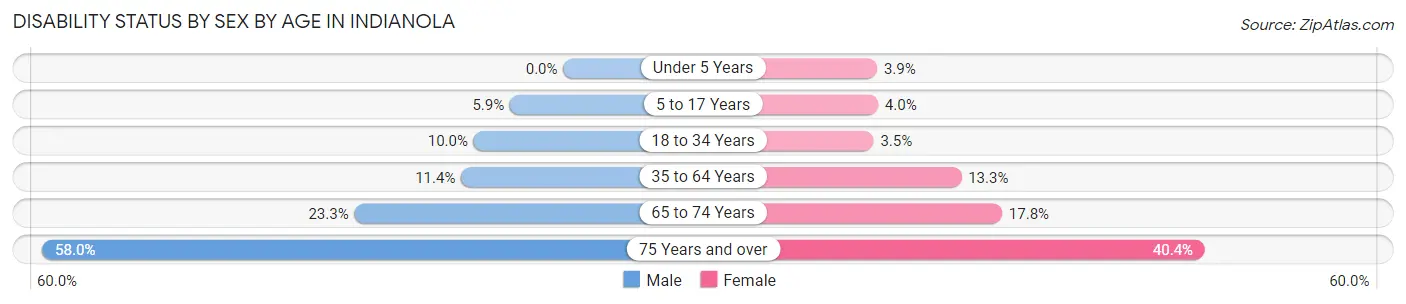
| Age Bracket | Male | Female |
| Under 5 Years | 0 (0.0%) | 2 (3.9%) |
| 5 to 17 Years | 18 (5.9%) | 10 (4.0%) |
| 18 to 34 Years | 30 (10.0%) | 11 (3.5%) |
| 35 to 64 Years | 84 (11.4%) | 102 (13.3%) |
| 65 to 74 Years | 50 (23.3%) | 46 (17.8%) |
| 75 Years and over | 65 (58.0%) | 55 (40.4%) |
Disability Class by Sex by Age in Indianola
Disability Class: Hearing Difficulty
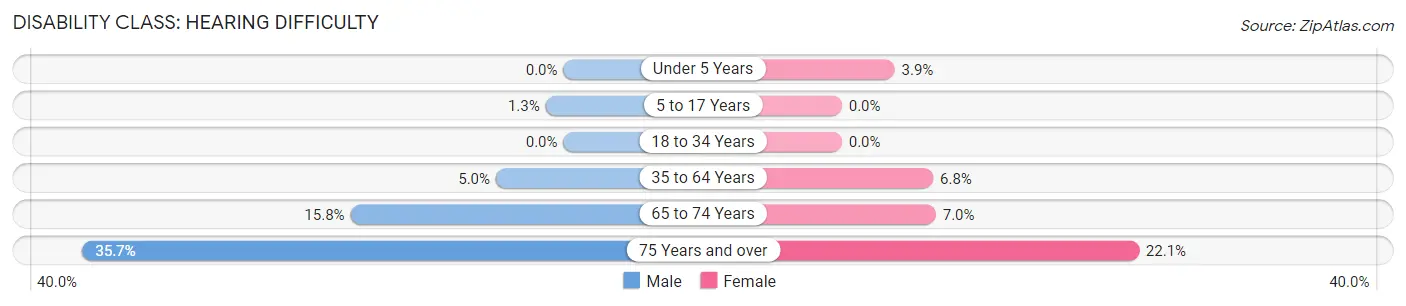
| Age Bracket | Male | Female |
| Under 5 Years | 0 (0.0%) | 2 (3.9%) |
| 5 to 17 Years | 4 (1.3%) | 0 (0.0%) |
| 18 to 34 Years | 0 (0.0%) | 0 (0.0%) |
| 35 to 64 Years | 37 (5.0%) | 52 (6.8%) |
| 65 to 74 Years | 34 (15.8%) | 18 (7.0%) |
| 75 Years and over | 40 (35.7%) | 30 (22.1%) |
Disability Class: Vision Difficulty
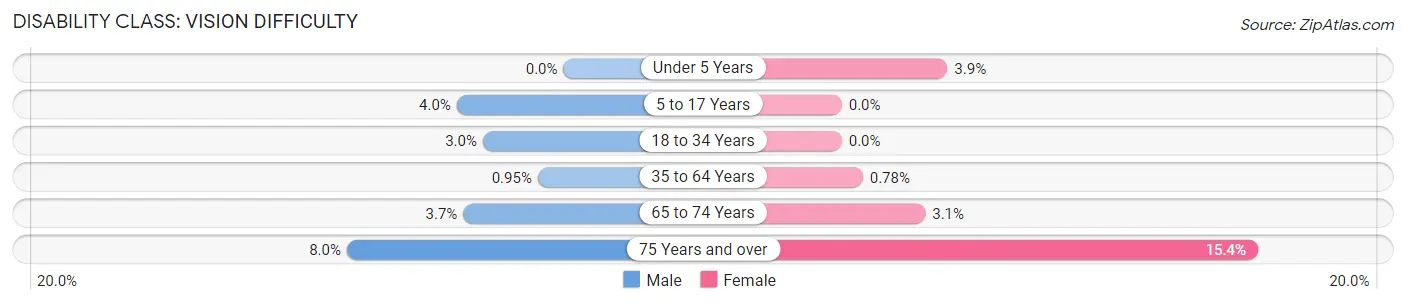
| Age Bracket | Male | Female |
| Under 5 Years | 0 (0.0%) | 2 (3.9%) |
| 5 to 17 Years | 12 (4.0%) | 0 (0.0%) |
| 18 to 34 Years | 9 (3.0%) | 0 (0.0%) |
| 35 to 64 Years | 7 (0.9%) | 6 (0.8%) |
| 65 to 74 Years | 8 (3.7%) | 8 (3.1%) |
| 75 Years and over | 9 (8.0%) | 21 (15.4%) |
Disability Class: Cognitive Difficulty
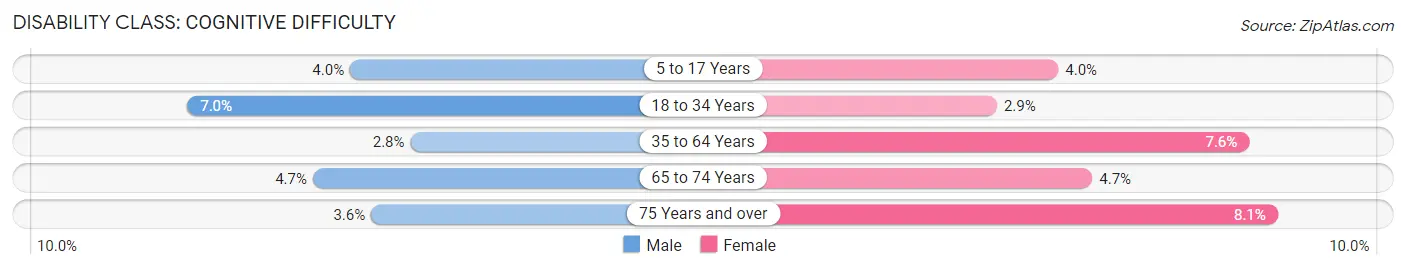
| Age Bracket | Male | Female |
| 5 to 17 Years | 12 (4.0%) | 10 (4.0%) |
| 18 to 34 Years | 21 (7.0%) | 9 (2.9%) |
| 35 to 64 Years | 21 (2.8%) | 58 (7.6%) |
| 65 to 74 Years | 10 (4.6%) | 12 (4.6%) |
| 75 Years and over | 4 (3.6%) | 11 (8.1%) |
Disability Class: Ambulatory Difficulty
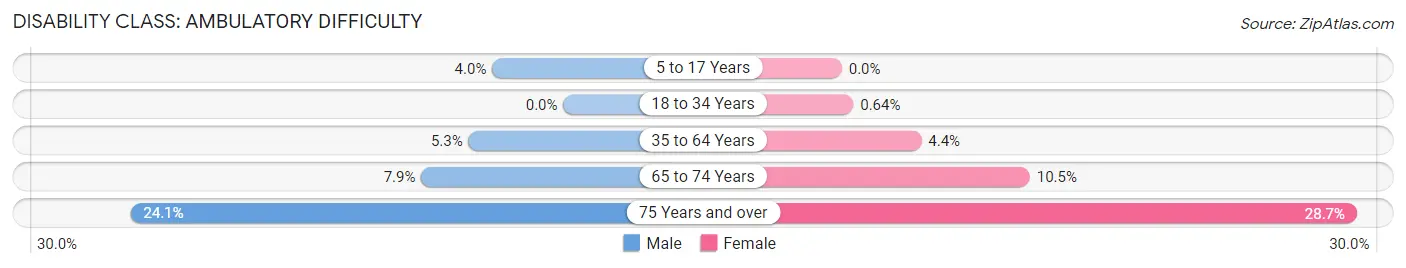
| Age Bracket | Male | Female |
| 5 to 17 Years | 12 (4.0%) | 0 (0.0%) |
| 18 to 34 Years | 0 (0.0%) | 2 (0.6%) |
| 35 to 64 Years | 39 (5.3%) | 34 (4.4%) |
| 65 to 74 Years | 17 (7.9%) | 27 (10.5%) |
| 75 Years and over | 27 (24.1%) | 39 (28.7%) |
Disability Class: Self-Care Difficulty
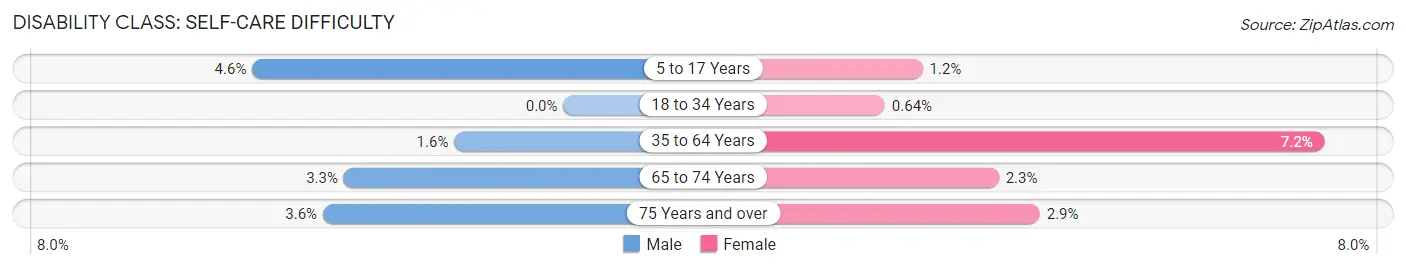
| Age Bracket | Male | Female |
| 5 to 17 Years | 14 (4.6%) | 3 (1.2%) |
| 18 to 34 Years | 0 (0.0%) | 2 (0.6%) |
| 35 to 64 Years | 12 (1.6%) | 55 (7.2%) |
| 65 to 74 Years | 7 (3.3%) | 6 (2.3%) |
| 75 Years and over | 4 (3.6%) | 4 (2.9%) |
Technology Access in Indianola
Computing Device Access in Indianola
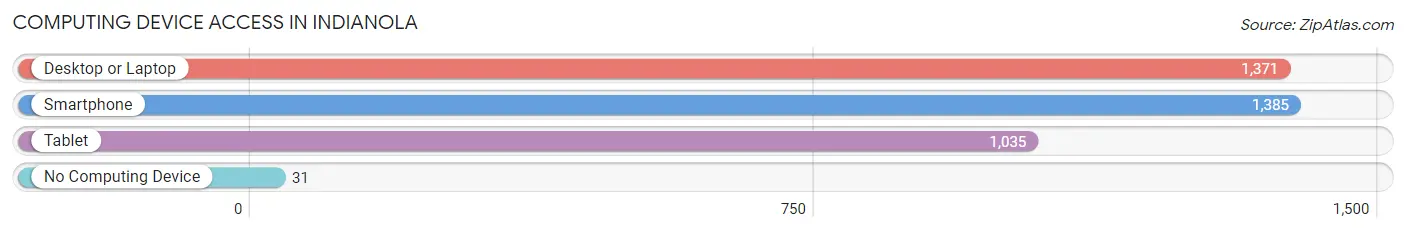
| Device Type | # Households | % Households |
| Desktop or Laptop | 1,371 | 93.0% |
| Smartphone | 1,385 | 94.0% |
| Tablet | 1,035 | 70.2% |
| No Computing Device | 31 | 2.1% |
| Total | 1,474 | 100.0% |
Internet Access in Indianola
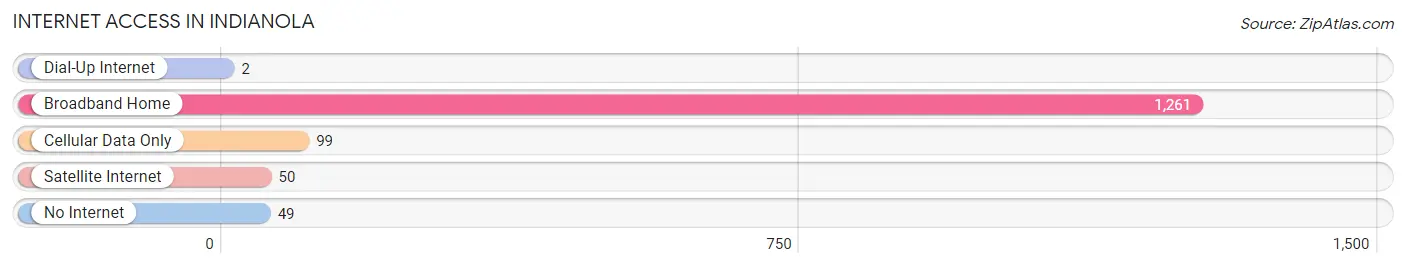
| Internet Type | # Households | % Households |
| Dial-Up Internet | 2 | 0.1% |
| Broadband Home | 1,261 | 85.6% |
| Cellular Data Only | 99 | 6.7% |
| Satellite Internet | 50 | 3.4% |
| No Internet | 49 | 3.3% |
| Total | 1,474 | 100.0% |
Indianola Summary
Introduction
Indianola is a small unincorporated community located in Kitsap County, Washington, United States. It is situated on the Kitsap Peninsula, approximately 25 miles west of Seattle. The community is located on the shores of Puget Sound, and is home to a population of approximately 1,000 people. Indianola is a popular destination for tourists and locals alike, offering a variety of recreational activities, including fishing, boating, and beachcombing.
History
The area now known as Indianola was first inhabited by the Suquamish Tribe, who lived in the area for thousands of years before the arrival of European settlers. The first European settlers arrived in the area in the late 1800s, and the community was officially established in 1891. The town was named after the Indianola post office, which was established in 1891.
The town grew slowly over the next few decades, and by the early 1900s, it had become a popular destination for tourists and locals alike. The town was home to a variety of businesses, including a hotel, a general store, and a sawmill. In the 1920s, the town was connected to the rest of the Kitsap Peninsula by a ferry service, which allowed for easier access to the area.
In the 1950s, the town began to experience a decline in population, as many of the businesses in the area closed down. However, in the late 1970s, the town experienced a resurgence in popularity, as it became a popular destination for tourists and locals alike.
Geography
Indianola is located on the Kitsap Peninsula, approximately 25 miles west of Seattle. The town is situated on the shores of Puget Sound, and is surrounded by the Olympic Mountains to the west and the Cascade Mountains to the east. The town is located in a temperate rainforest climate, with mild temperatures and abundant rainfall throughout the year.
The town is home to a variety of natural features, including beaches, forests, and wetlands. The town is also home to a variety of wildlife, including bald eagles, ospreys, and seals.
Economy
The economy of Indianola is largely based on tourism and recreation. The town is home to a variety of businesses, including restaurants, hotels, and retail stores. The town is also home to a variety of recreational activities, including fishing, boating, and beachcombing.
The town is also home to a variety of industries, including boatbuilding, fishing, and logging. The town is also home to a variety of small businesses, including art galleries, antique stores, and gift shops.
Demographics
As of the 2010 census, the population of Indianola was 1,000 people. The town is predominantly white, with approximately 95% of the population identifying as white. The town is also home to a variety of other ethnicities, including Native American, Asian, and Hispanic.
Conclusion
Indianola is a small unincorporated community located in Kitsap County, Washington, United States. It is situated on the shores of Puget Sound, and is home to a population of approximately 1,000 people. The town is a popular destination for tourists and locals alike, offering a variety of recreational activities, including fishing, boating, and beachcombing. The economy of Indianola is largely based on tourism and recreation, and the town is home to a variety of businesses, industries, and small businesses. The town is predominantly white, with approximately 95% of the population identifying as white.
Common Questions
What is Per Capita Income in Indianola?
Per Capita income in Indianola is $46,291.
What is the Median Family Income in Indianola?
Median Family Income in Indianola is $110,625.
What is the Median Household income in Indianola?
Median Household Income in Indianola is $91,759.
What is Income or Wage Gap in Indianola?
Income or Wage Gap in Indianola is 29.7%.
Women in Indianola earn 70.3 cents for every dollar earned by a man.
What is Family Income Deficit in Indianola?
Family Income Deficit in Indianola is $14,974.
Families that are below poverty line in Indianola earn $14,974 less on average than the poverty threshold level.
What is Inequality or Gini Index in Indianola?
Inequality or Gini Index in Indianola is 0.40.
What is the Total Population of Indianola?
Total Population of Indianola is 3,553.
What is the Total Male Population of Indianola?
Total Male Population of Indianola is 1,777.
What is the Total Female Population of Indianola?
Total Female Population of Indianola is 1,776.
What is the Ratio of Males per 100 Females in Indianola?
There are 100.06 Males per 100 Females in Indianola.
What is the Ratio of Females per 100 Males in Indianola?
There are 99.94 Females per 100 Males in Indianola.
What is the Median Population Age in Indianola?
Median Population Age in Indianola is 44.1 Years.
What is the Average Family Size in Indianola
Average Family Size in Indianola is 2.9 People.
What is the Average Household Size in Indianola
Average Household Size in Indianola is 2.4 People.
How Large is the Labor Force in Indianola?
There are 1,839 People in the Labor Forcein in Indianola.
What is the Percentage of People in the Labor Force in Indianola?
62.0% of People are in the Labor Force in Indianola.
What is the Unemployment Rate in Indianola?
Unemployment Rate in Indianola is 4.8%.