Felida, WA Map & Demographics
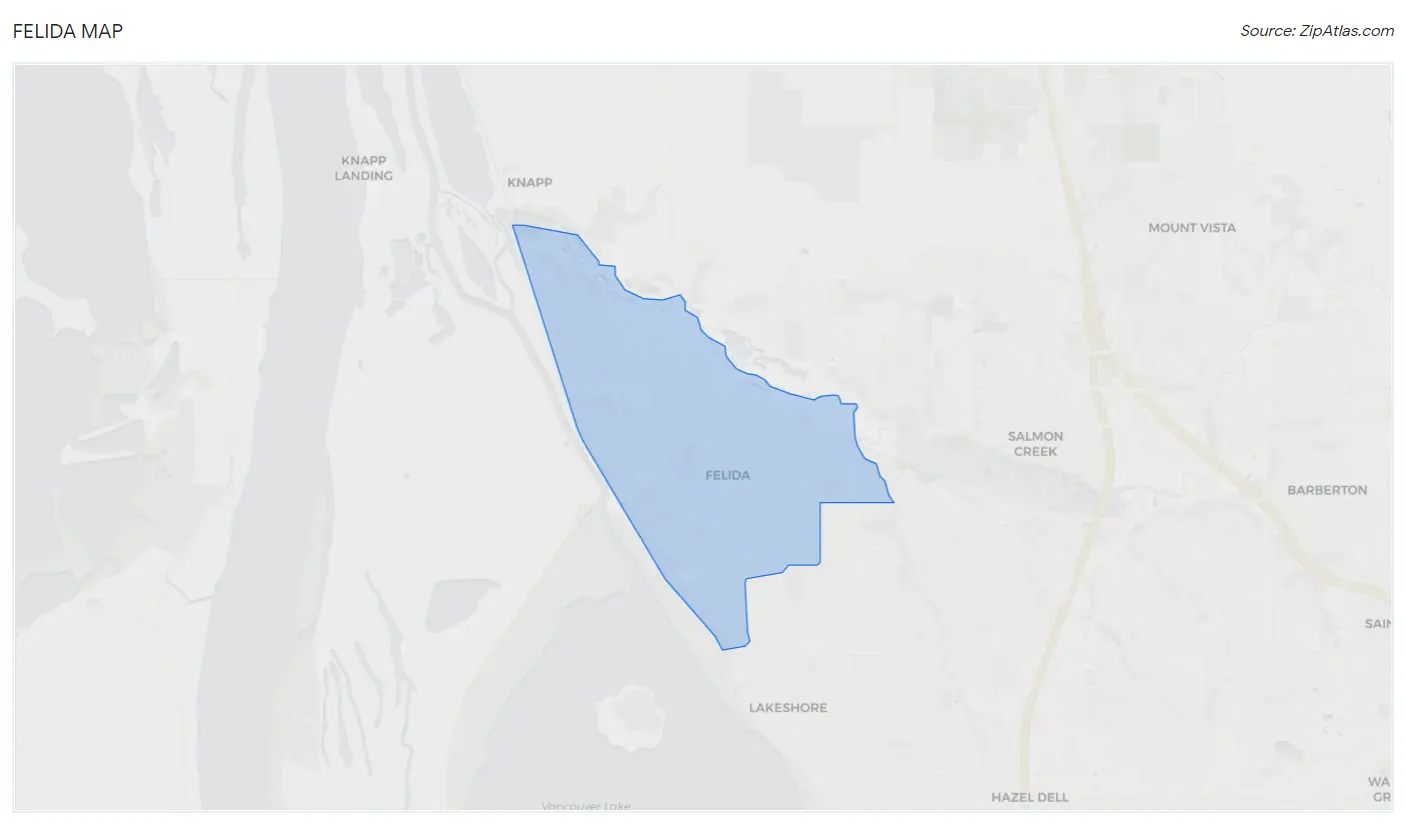
Felida Map
Felida Overview
$72,889
PER CAPITA INCOME
$145,682
AVG FAMILY INCOME
$148,625
AVG HOUSEHOLD INCOME
52.2%
WAGE / INCOME GAP [ % ]
47.8¢/ $1
WAGE / INCOME GAP [ $ ]
0.45
INEQUALITY / GINI INDEX
10,520
TOTAL POPULATION
5,412
MALE POPULATION
5,108
FEMALE POPULATION
105.95
MALES / 100 FEMALES
94.38
FEMALES / 100 MALES
45.9
MEDIAN AGE
3.0
AVG FAMILY SIZE
2.7
AVG HOUSEHOLD SIZE
5,665
LABOR FORCE [ PEOPLE ]
68.6%
PERCENT IN LABOR FORCE
5.3%
UNEMPLOYMENT RATE
Income in Felida
Income Overview in Felida
Per Capita Income in Felida is $72,889, while median incomes of families and households are $145,682 and $148,625 respectively.
| Characteristic | Number | Measure |
| Per Capita Income | 10,520 | $72,889 |
| Median Family Income | 3,094 | $145,682 |
| Mean Family Income | 3,094 | $205,081 |
| Median Household Income | 3,887 | $148,625 |
| Mean Household Income | 3,887 | $198,604 |
| Income Deficit | 3,094 | $0 |
| Wage / Income Gap (%) | 10,520 | 52.22% |
| Wage / Income Gap ($) | 10,520 | 47.78¢ per $1 |
| Gini / Inequality Index | 10,520 | 0.45 |
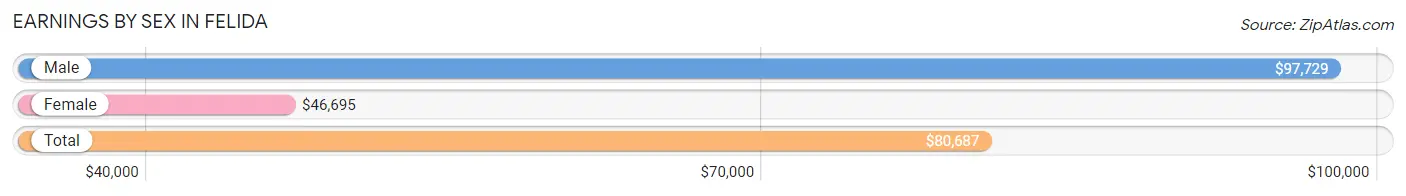
Earnings by Sex in Felida
Average Earnings in Felida are $80,687, $97,729 for men and $46,695 for women, a difference of 52.2%.
| Sex | Number | Average Earnings |
| Male | 3,116 (54.8%) | $97,729 |
| Female | 2,568 (45.2%) | $46,695 |
| Total | 5,684 (100.0%) | $80,687 |
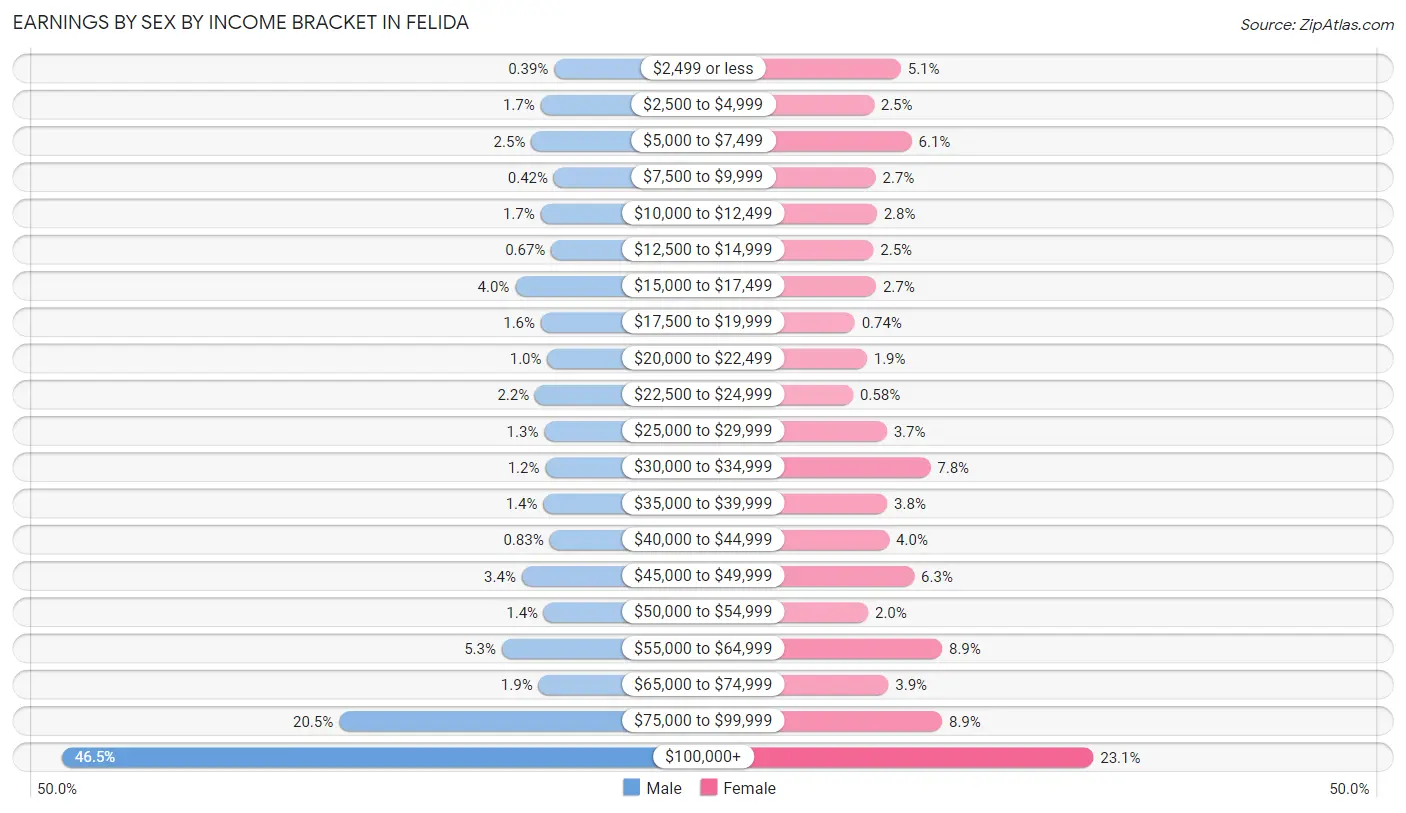
Earnings by Sex by Income Bracket in Felida
The most common earnings brackets in Felida are $100,000+ for men (1,449 | 46.5%) and $100,000+ for women (593 | 23.1%).
| Income | Male | Female |
| $2,499 or less | 12 (0.4%) | 130 (5.1%) |
| $2,500 to $4,999 | 52 (1.7%) | 65 (2.5%) |
| $5,000 to $7,499 | 79 (2.5%) | 156 (6.1%) |
| $7,500 to $9,999 | 13 (0.4%) | 69 (2.7%) |
| $10,000 to $12,499 | 52 (1.7%) | 72 (2.8%) |
| $12,500 to $14,999 | 21 (0.7%) | 64 (2.5%) |
| $15,000 to $17,499 | 126 (4.0%) | 70 (2.7%) |
| $17,500 to $19,999 | 51 (1.6%) | 19 (0.7%) |
| $20,000 to $22,499 | 32 (1.0%) | 48 (1.9%) |
| $22,500 to $24,999 | 68 (2.2%) | 15 (0.6%) |
| $25,000 to $29,999 | 41 (1.3%) | 96 (3.7%) |
| $30,000 to $34,999 | 38 (1.2%) | 201 (7.8%) |
| $35,000 to $39,999 | 44 (1.4%) | 97 (3.8%) |
| $40,000 to $44,999 | 26 (0.8%) | 102 (4.0%) |
| $45,000 to $49,999 | 107 (3.4%) | 162 (6.3%) |
| $50,000 to $54,999 | 42 (1.3%) | 51 (2.0%) |
| $55,000 to $64,999 | 165 (5.3%) | 229 (8.9%) |
| $65,000 to $74,999 | 58 (1.9%) | 100 (3.9%) |
| $75,000 to $99,999 | 640 (20.5%) | 229 (8.9%) |
| $100,000+ | 1,449 (46.5%) | 593 (23.1%) |
| Total | 3,116 (100.0%) | 2,568 (100.0%) |
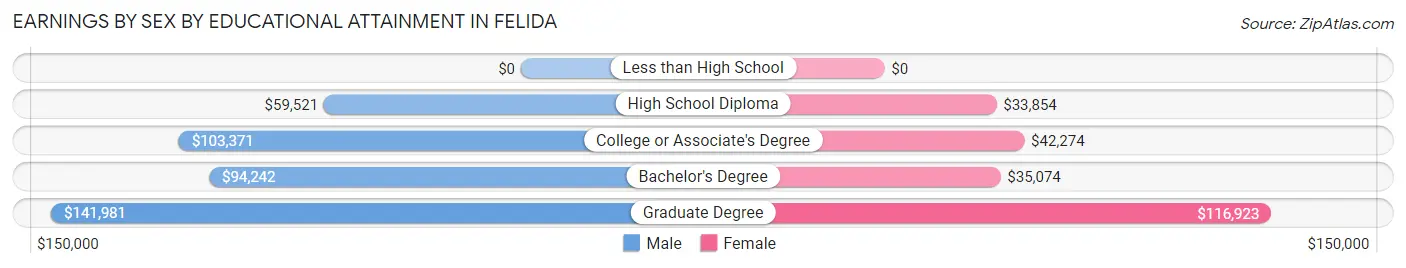
Earnings by Sex by Educational Attainment in Felida
Average earnings in Felida are $99,969 for men and $50,208 for women, a difference of 49.8%. Men with an educational attainment of graduate degree enjoy the highest average annual earnings of $141,981, while those with high school diploma education earn the least with $59,521. Women with an educational attainment of graduate degree earn the most with the average annual earnings of $116,923, while those with high school diploma education have the smallest earnings of $33,854.
| Educational Attainment | Male Income | Female Income |
| Less than High School | - | - |
| High School Diploma | $59,521 | $33,854 |
| College or Associate's Degree | $103,371 | $42,274 |
| Bachelor's Degree | $94,242 | $35,074 |
| Graduate Degree | $141,981 | $116,923 |
| Total | $99,969 | $50,208 |
Family Income in Felida
Family Income Brackets in Felida
According to the Felida family income data, there are 882 families falling into the $200,000+ income range, which is the most common income bracket and makes up 28.5% of all families.
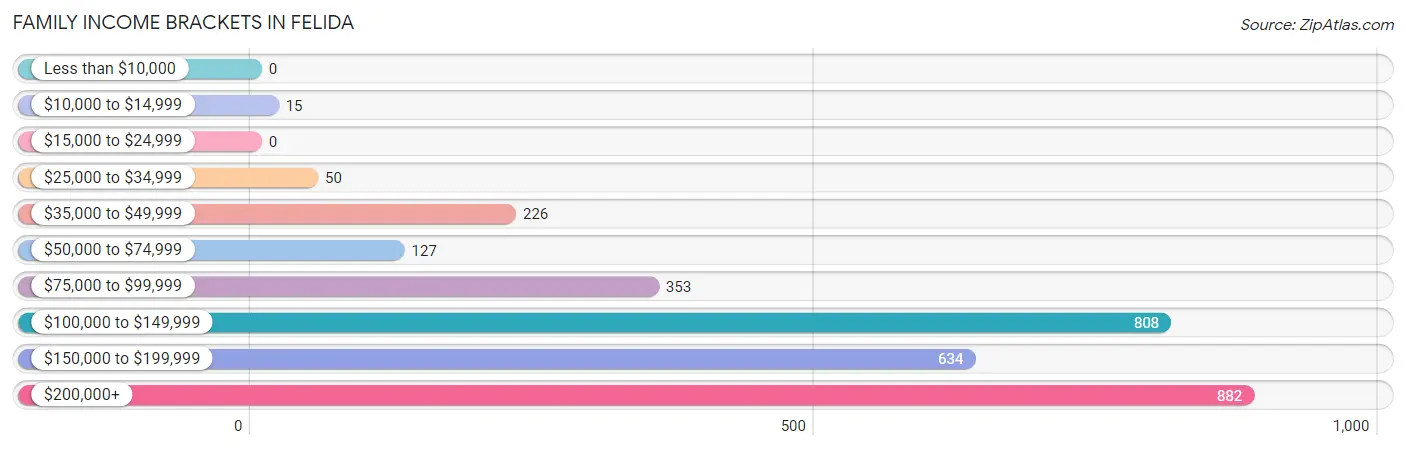
| Income Bracket | # Families | % Families |
| Less than $10,000 | 0 | 0.0% |
| $10,000 to $14,999 | 15 | 0.5% |
| $15,000 to $24,999 | 0 | 0.0% |
| $25,000 to $34,999 | 50 | 1.6% |
| $35,000 to $49,999 | 226 | 7.3% |
| $50,000 to $74,999 | 127 | 4.1% |
| $75,000 to $99,999 | 353 | 11.4% |
| $100,000 to $149,999 | 808 | 26.1% |
| $150,000 to $199,999 | 634 | 20.5% |
| $200,000+ | 882 | 28.5% |
Family Income by Famaliy Size in Felida
3-person families (704 | 22.8%) account for the highest median family income in Felida with $158,333 per family, while 2-person families (1,495 | 48.3%) have the highest median income of $76,283 per family member.
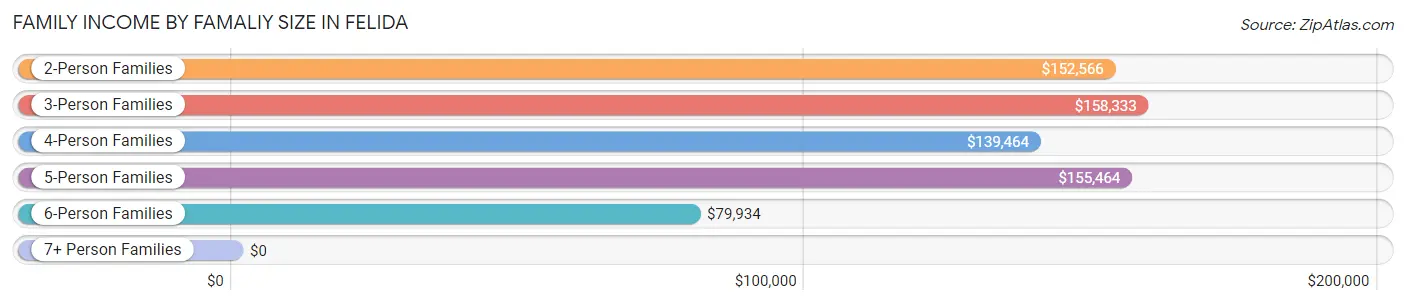
| Income Bracket | # Families | Median Income |
| 2-Person Families | 1,495 (48.3%) | $152,566 |
| 3-Person Families | 704 (22.8%) | $158,333 |
| 4-Person Families | 525 (17.0%) | $139,464 |
| 5-Person Families | 205 (6.6%) | $155,464 |
| 6-Person Families | 89 (2.9%) | $79,934 |
| 7+ Person Families | 76 (2.5%) | $0 |
| Total | 3,094 (100.0%) | $145,682 |
Family Income by Number of Earners in Felida
The median family income in Felida is $145,682, with families comprising 3+ earners (233) having the highest median family income of $201,250, while families with no earners (472) have the lowest median family income of $100,500, accounting for 7.5% and 15.3% of families, respectively.
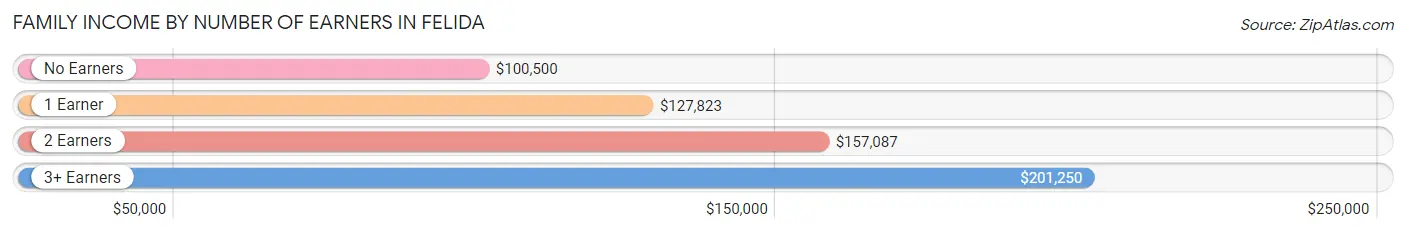
| Number of Earners | # Families | Median Income |
| No Earners | 472 (15.3%) | $100,500 |
| 1 Earner | 930 (30.1%) | $127,823 |
| 2 Earners | 1,459 (47.2%) | $157,087 |
| 3+ Earners | 233 (7.5%) | $201,250 |
| Total | 3,094 (100.0%) | $145,682 |
Household Income in Felida
Household Income Brackets in Felida
With 1,193 households falling in the category, the $200,000+ income range is the most frequent in Felida, accounting for 30.7% of all households. In contrast, only 19 households (0.5%) fall into the less than $10,000 income bracket, making it the least populous group.
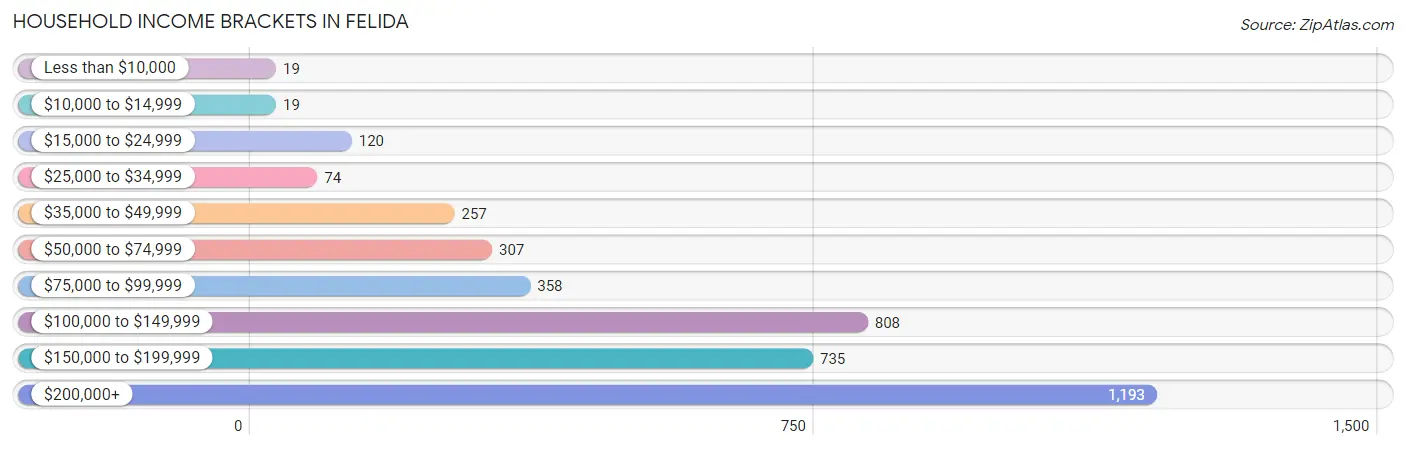
| Income Bracket | # Households | % Households |
| Less than $10,000 | 19 | 0.5% |
| $10,000 to $14,999 | 19 | 0.5% |
| $15,000 to $24,999 | 120 | 3.1% |
| $25,000 to $34,999 | 74 | 1.9% |
| $35,000 to $49,999 | 257 | 6.6% |
| $50,000 to $74,999 | 307 | 7.9% |
| $75,000 to $99,999 | 358 | 9.2% |
| $100,000 to $149,999 | 808 | 20.8% |
| $150,000 to $199,999 | 735 | 18.9% |
| $200,000+ | 1,193 | 30.7% |
Household Income by Householder Age in Felida
The median household income in Felida is $148,625, with the highest median household income of $170,825 found in the 45 to 64 years age bracket for the primary householder. A total of 2,039 households (52.5%) fall into this category.
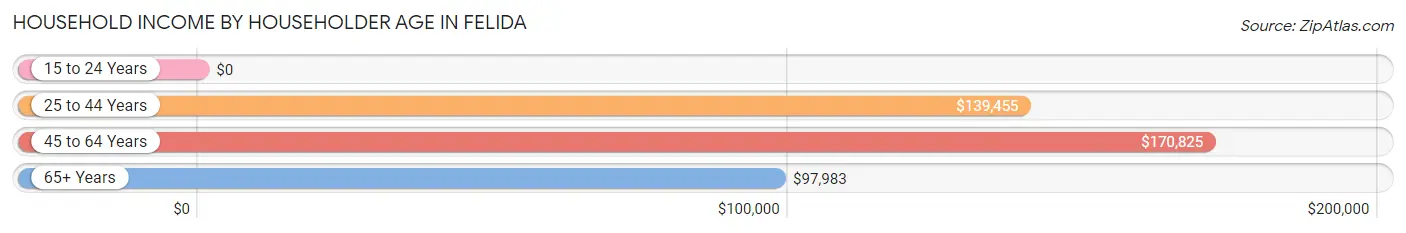
| Income Bracket | # Households | Median Income |
| 15 to 24 Years | 0 (0.0%) | $0 |
| 25 to 44 Years | 825 (21.2%) | $139,455 |
| 45 to 64 Years | 2,039 (52.5%) | $170,825 |
| 65+ Years | 1,023 (26.3%) | $97,983 |
| Total | 3,887 (100.0%) | $148,625 |
Poverty in Felida
Income Below Poverty by Sex and Age in Felida
With 1.3% poverty level for males and 3.1% for females among the residents of Felida, 35 to 44 year old males and 5 year old females are the most vulnerable to poverty, with 26 males (4.6%) and 25 females (29.1%) in their respective age groups living below the poverty level.
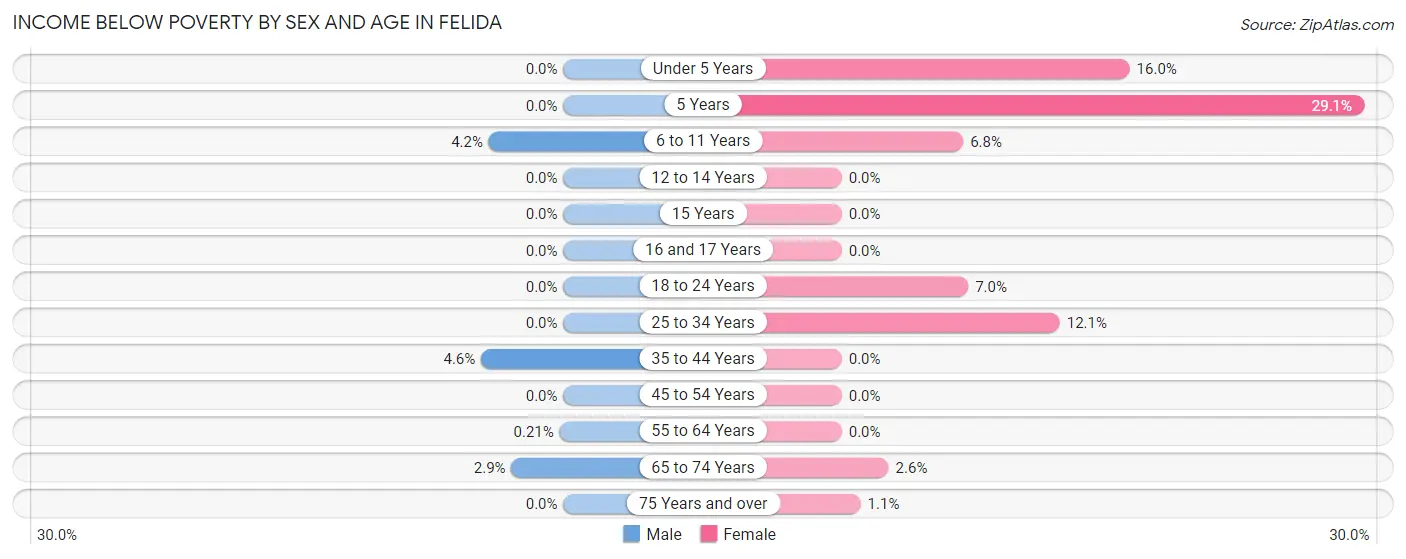
| Age Bracket | Male | Female |
| Under 5 Years | 0 (0.0%) | 25 (16.0%) |
| 5 Years | 0 (0.0%) | 25 (29.1%) |
| 6 to 11 Years | 26 (4.2%) | 25 (6.8%) |
| 12 to 14 Years | 0 (0.0%) | 0 (0.0%) |
| 15 Years | 0 (0.0%) | 0 (0.0%) |
| 16 and 17 Years | 0 (0.0%) | 0 (0.0%) |
| 18 to 24 Years | 0 (0.0%) | 15 (7.0%) |
| 25 to 34 Years | 0 (0.0%) | 50 (12.1%) |
| 35 to 44 Years | 26 (4.6%) | 0 (0.0%) |
| 45 to 54 Years | 0 (0.0%) | 0 (0.0%) |
| 55 to 64 Years | 2 (0.2%) | 0 (0.0%) |
| 65 to 74 Years | 18 (2.9%) | 15 (2.6%) |
| 75 Years and over | 0 (0.0%) | 4 (1.1%) |
| Total | 72 (1.3%) | 159 (3.1%) |
Income Above Poverty by Sex and Age in Felida
According to the poverty statistics in Felida, males aged under 5 years and females aged 12 to 14 years are the age groups that are most secure financially, with 100.0% of males and 100.0% of females in these age groups living above the poverty line.
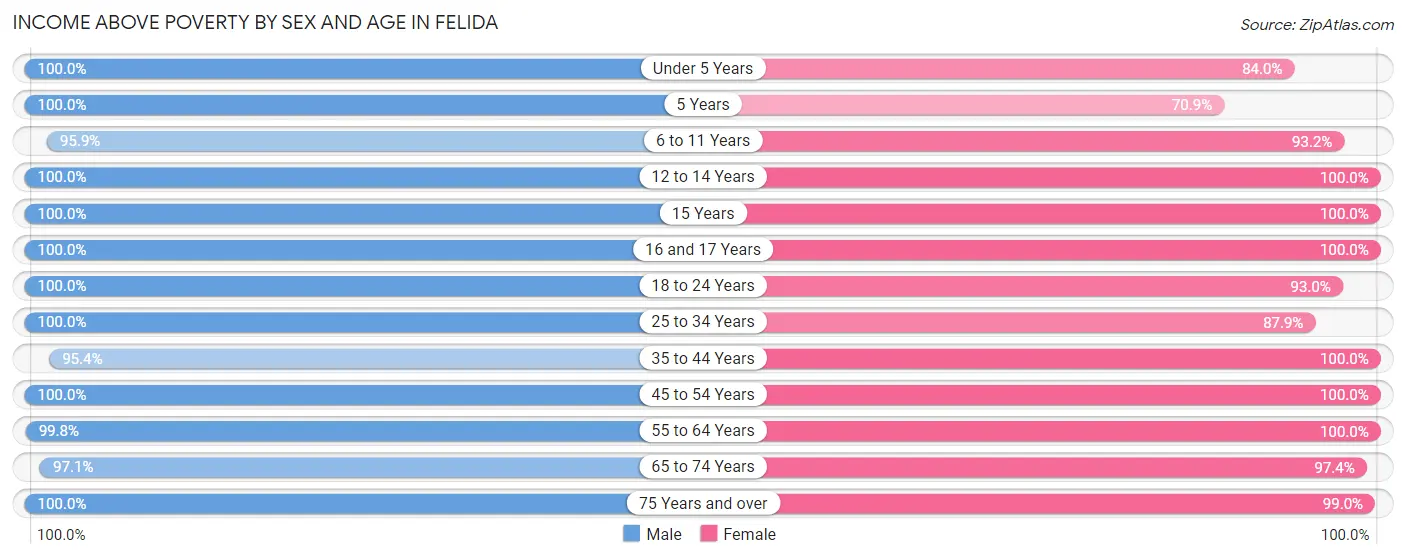
| Age Bracket | Male | Female |
| Under 5 Years | 421 (100.0%) | 131 (84.0%) |
| 5 Years | 74 (100.0%) | 61 (70.9%) |
| 6 to 11 Years | 600 (95.9%) | 345 (93.2%) |
| 12 to 14 Years | 183 (100.0%) | 247 (100.0%) |
| 15 Years | 33 (100.0%) | 66 (100.0%) |
| 16 and 17 Years | 293 (100.0%) | 137 (100.0%) |
| 18 to 24 Years | 243 (100.0%) | 198 (93.0%) |
| 25 to 34 Years | 245 (100.0%) | 362 (87.9%) |
| 35 to 44 Years | 542 (95.4%) | 673 (100.0%) |
| 45 to 54 Years | 882 (100.0%) | 737 (100.0%) |
| 55 to 64 Years | 972 (99.8%) | 1,053 (100.0%) |
| 65 to 74 Years | 604 (97.1%) | 559 (97.4%) |
| 75 Years and over | 242 (100.0%) | 378 (99.0%) |
| Total | 5,334 (98.7%) | 4,947 (96.9%) |
Income Below Poverty Among Married-Couple Families in Felida
The poverty statistics for married-couple families in Felida show that 0.9% or 26 of the total 2,735 families live below the poverty line. Families with 3 or 4 children have the highest poverty rate of 12.6%, comprising of 26 families. On the other hand, families with no children have the lowest poverty rate of 0.0%, which includes 0 families.
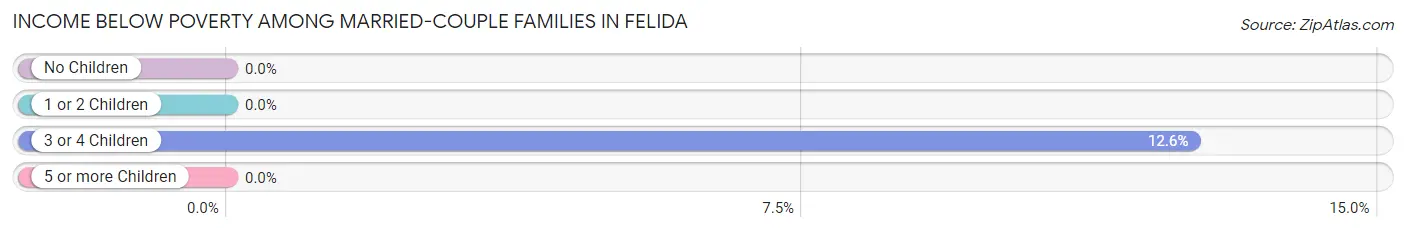
| Children | Above Poverty | Below Poverty |
| No Children | 1,579 (100.0%) | 0 (0.0%) |
| 1 or 2 Children | 873 (100.0%) | 0 (0.0%) |
| 3 or 4 Children | 181 (87.4%) | 26 (12.6%) |
| 5 or more Children | 76 (100.0%) | 0 (0.0%) |
| Total | 2,709 (99.1%) | 26 (0.9%) |
Income Below Poverty Among Single-Parent Households in Felida
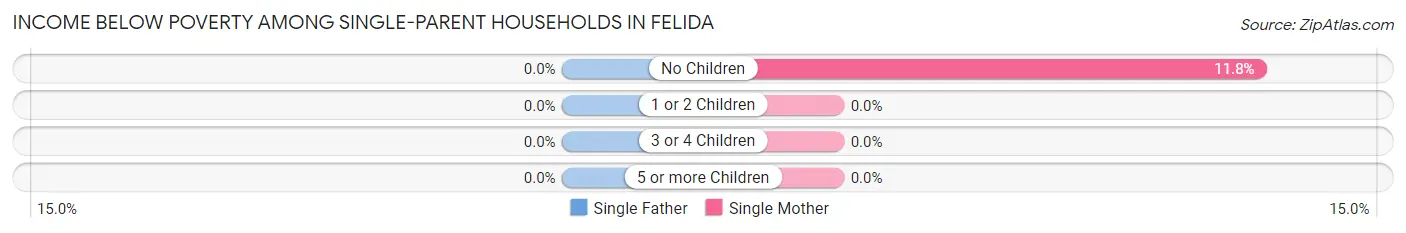
| Children | Single Father | Single Mother |
| No Children | 0 (0.0%) | 15 (11.8%) |
| 1 or 2 Children | 0 (0.0%) | 0 (0.0%) |
| 3 or 4 Children | 0 (0.0%) | 0 (0.0%) |
| 5 or more Children | 0 (0.0%) | 0 (0.0%) |
| Total | 0 (0.0%) | 15 (6.5%) |
Income Below Poverty Among Married-Couple vs Single-Parent Households in Felida
The poverty data for Felida shows that 26 of the married-couple family households (0.9%) and 15 of the single-parent households (4.2%) are living below the poverty level. Within the married-couple family households, those with 3 or 4 children have the highest poverty rate, with 26 households (12.6%) falling below the poverty line. Among the single-parent households, those with no children have the highest poverty rate, with 15 household (9.7%) living below poverty.
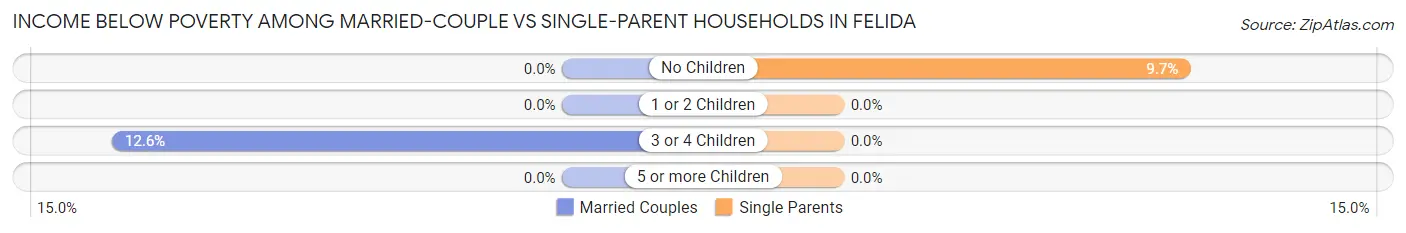
| Children | Married-Couple Families | Single-Parent Households |
| No Children | 0 (0.0%) | 15 (9.7%) |
| 1 or 2 Children | 0 (0.0%) | 0 (0.0%) |
| 3 or 4 Children | 26 (12.6%) | 0 (0.0%) |
| 5 or more Children | 0 (0.0%) | 0 (0.0%) |
| Total | 26 (0.9%) | 15 (4.2%) |
Race in Felida
The most populous races in Felida are White / Caucasian (9,222 | 87.7%), Two or more Races (831 | 7.9%), and Hispanic or Latino (471 | 4.5%).
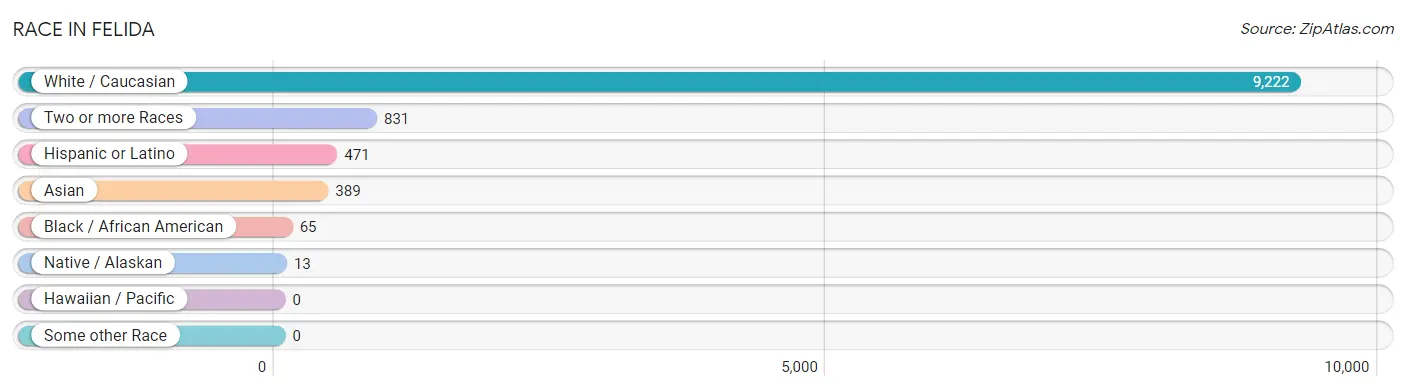
| Race | # Population | % Population |
| Asian | 389 | 3.7% |
| Black / African American | 65 | 0.6% |
| Hawaiian / Pacific | 0 | 0.0% |
| Hispanic or Latino | 471 | 4.5% |
| Native / Alaskan | 13 | 0.1% |
| White / Caucasian | 9,222 | 87.7% |
| Two or more Races | 831 | 7.9% |
| Some other Race | 0 | 0.0% |
| Total | 10,520 | 100.0% |
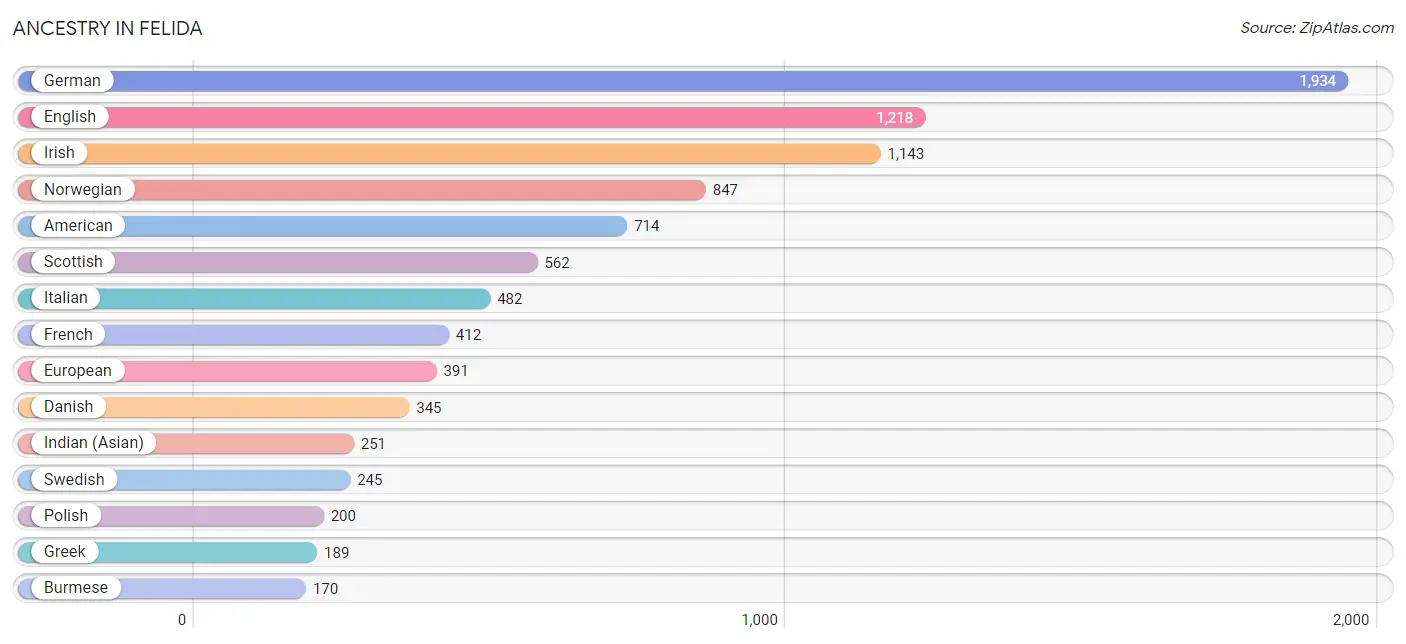
Ancestry in Felida
The most populous ancestries reported in Felida are German (1,934 | 18.4%), English (1,218 | 11.6%), Irish (1,143 | 10.9%), Norwegian (847 | 8.1%), and American (714 | 6.8%), together accounting for 55.7% of all Felida residents.
| Ancestry | # Population | % Population |
| American | 714 | 6.8% |
| Austrian | 53 | 0.5% |
| Bangladeshi | 49 | 0.5% |
| Basque | 15 | 0.1% |
| Belgian | 28 | 0.3% |
| Bhutanese | 78 | 0.7% |
| British | 82 | 0.8% |
| Burmese | 170 | 1.6% |
| Canadian | 39 | 0.4% |
| Colombian | 12 | 0.1% |
| Croatian | 12 | 0.1% |
| Cuban | 90 | 0.9% |
| Czech | 21 | 0.2% |
| Czechoslovakian | 28 | 0.3% |
| Danish | 345 | 3.3% |
| Dominican | 21 | 0.2% |
| Dutch | 137 | 1.3% |
| Eastern European | 18 | 0.2% |
| English | 1,218 | 11.6% |
| European | 391 | 3.7% |
| Finnish | 145 | 1.4% |
| French | 412 | 3.9% |
| French Canadian | 35 | 0.3% |
| German | 1,934 | 18.4% |
| Greek | 189 | 1.8% |
| Hungarian | 20 | 0.2% |
| Indian (Asian) | 251 | 2.4% |
| Irish | 1,143 | 10.9% |
| Italian | 482 | 4.6% |
| Korean | 117 | 1.1% |
| Lithuanian | 28 | 0.3% |
| Mexican | 140 | 1.3% |
| Native Hawaiian | 27 | 0.3% |
| Northern European | 116 | 1.1% |
| Norwegian | 847 | 8.1% |
| Peruvian | 22 | 0.2% |
| Polish | 200 | 1.9% |
| Portuguese | 24 | 0.2% |
| Puerto Rican | 14 | 0.1% |
| Russian | 43 | 0.4% |
| Scandinavian | 74 | 0.7% |
| Scotch-Irish | 163 | 1.5% |
| Scottish | 562 | 5.3% |
| South American | 34 | 0.3% |
| Spanish | 48 | 0.5% |
| Swedish | 245 | 2.3% |
| Swiss | 24 | 0.2% |
| Thai | 18 | 0.2% |
| Tlingit-Haida | 6 | 0.1% |
| Ukrainian | 156 | 1.5% |
| Welsh | 77 | 0.7% |
| Yugoslavian | 60 | 0.6% | View All 52 Rows |
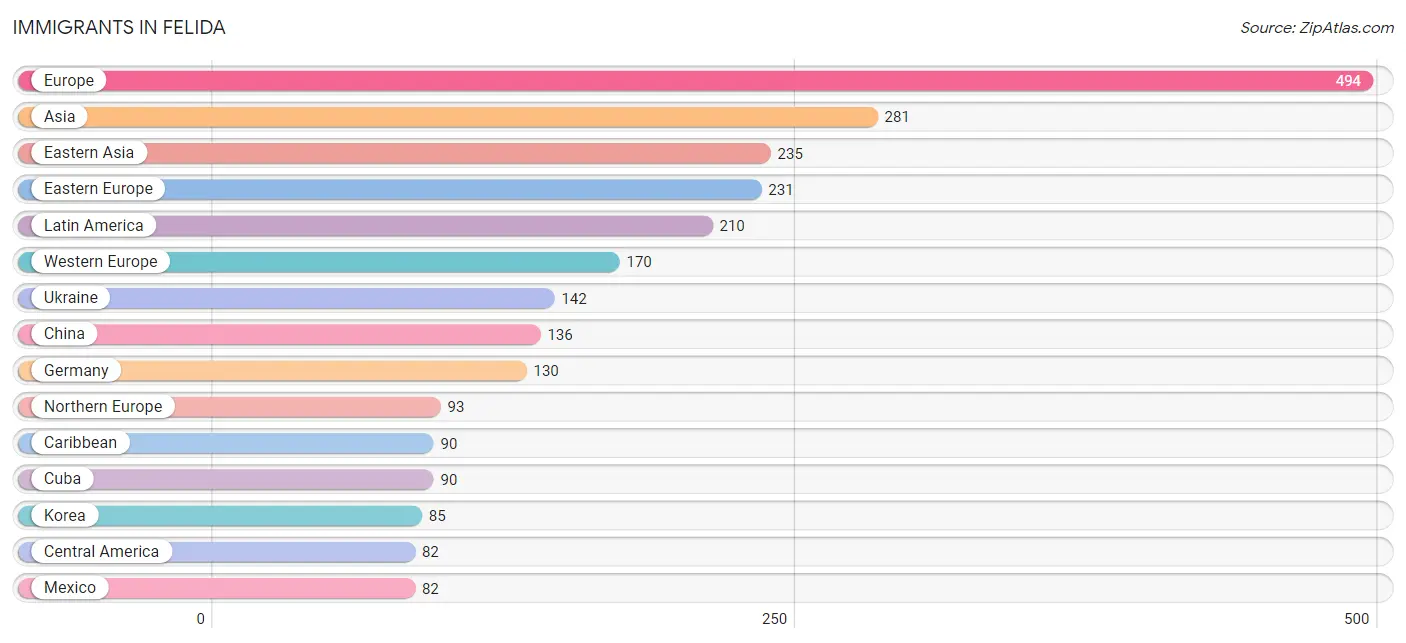
Immigrants in Felida
The most numerous immigrant groups reported in Felida came from Europe (494 | 4.7%), Asia (281 | 2.7%), Eastern Asia (235 | 2.2%), Eastern Europe (231 | 2.2%), and Latin America (210 | 2.0%), together accounting for 13.8% of all Felida residents.
| Immigration Origin | # Population | % Population |
| Asia | 281 | 2.7% |
| Bolivia | 12 | 0.1% |
| Bulgaria | 20 | 0.2% |
| Canada | 56 | 0.5% |
| Caribbean | 90 | 0.9% |
| Central America | 82 | 0.8% |
| China | 136 | 1.3% |
| Colombia | 12 | 0.1% |
| Cuba | 90 | 0.9% |
| Eastern Asia | 235 | 2.2% |
| Eastern Europe | 231 | 2.2% |
| Europe | 494 | 4.7% |
| Germany | 130 | 1.2% |
| Hong Kong | 20 | 0.2% |
| India | 31 | 0.3% |
| Japan | 14 | 0.1% |
| Korea | 85 | 0.8% |
| Latin America | 210 | 2.0% |
| Lithuania | 30 | 0.3% |
| Mexico | 82 | 0.8% |
| Netherlands | 40 | 0.4% |
| Northern Europe | 93 | 0.9% |
| Peru | 14 | 0.1% |
| Poland | 11 | 0.1% |
| Russia | 28 | 0.3% |
| Scotland | 65 | 0.6% |
| South America | 38 | 0.4% |
| South Central Asia | 31 | 0.3% |
| South Eastern Asia | 15 | 0.1% |
| Taiwan | 80 | 0.8% |
| Thailand | 15 | 0.1% |
| Ukraine | 142 | 1.3% |
| Western Europe | 170 | 1.6% | View All 33 Rows |
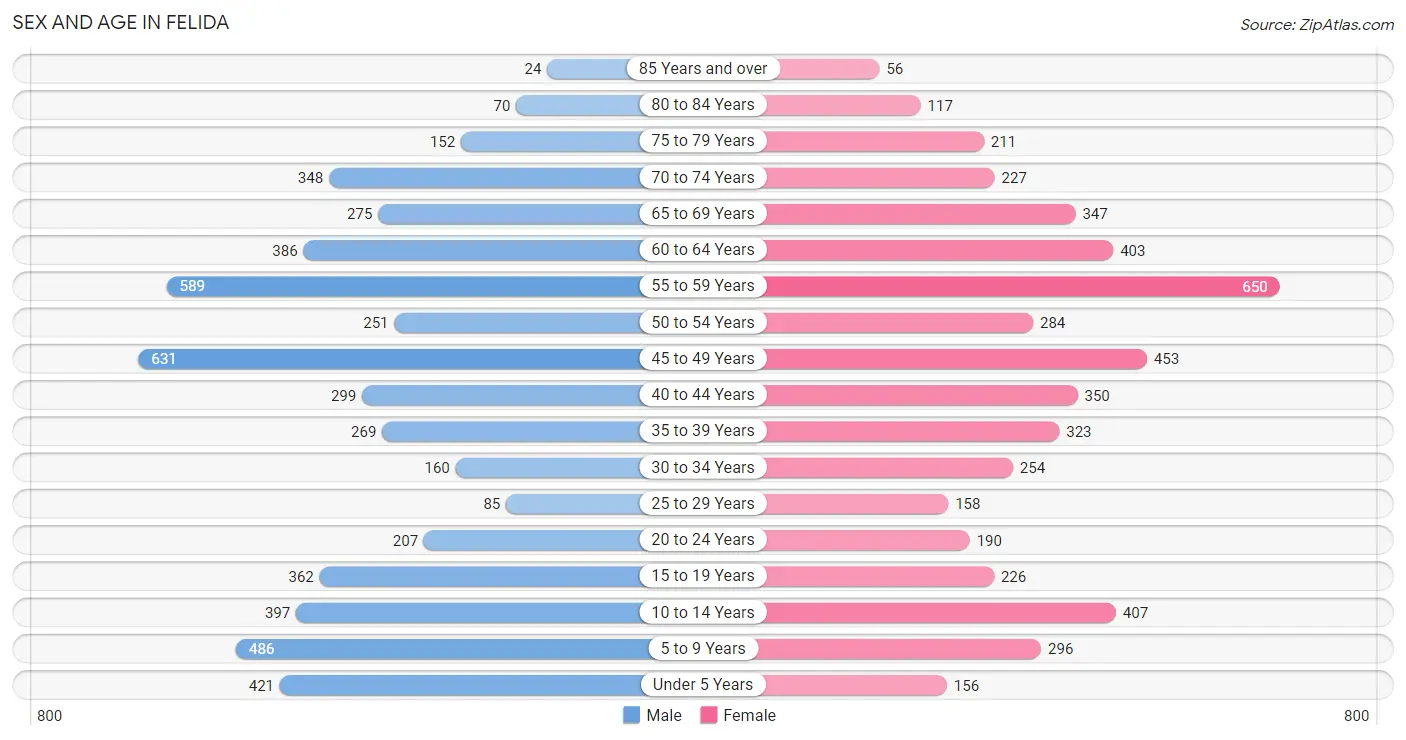
Sex and Age in Felida
Sex and Age in Felida
The most populous age groups in Felida are 45 to 49 Years (631 | 11.7%) for men and 55 to 59 Years (650 | 12.7%) for women.
| Age Bracket | Male | Female |
| Under 5 Years | 421 (7.8%) | 156 (3.0%) |
| 5 to 9 Years | 486 (9.0%) | 296 (5.8%) |
| 10 to 14 Years | 397 (7.3%) | 407 (8.0%) |
| 15 to 19 Years | 362 (6.7%) | 226 (4.4%) |
| 20 to 24 Years | 207 (3.8%) | 190 (3.7%) |
| 25 to 29 Years | 85 (1.6%) | 158 (3.1%) |
| 30 to 34 Years | 160 (3.0%) | 254 (5.0%) |
| 35 to 39 Years | 269 (5.0%) | 323 (6.3%) |
| 40 to 44 Years | 299 (5.5%) | 350 (6.9%) |
| 45 to 49 Years | 631 (11.7%) | 453 (8.9%) |
| 50 to 54 Years | 251 (4.6%) | 284 (5.6%) |
| 55 to 59 Years | 589 (10.9%) | 650 (12.7%) |
| 60 to 64 Years | 386 (7.1%) | 403 (7.9%) |
| 65 to 69 Years | 275 (5.1%) | 347 (6.8%) |
| 70 to 74 Years | 348 (6.4%) | 227 (4.4%) |
| 75 to 79 Years | 152 (2.8%) | 211 (4.1%) |
| 80 to 84 Years | 70 (1.3%) | 117 (2.3%) |
| 85 Years and over | 24 (0.4%) | 56 (1.1%) |
| Total | 5,412 (100.0%) | 5,108 (100.0%) |
Families and Households in Felida
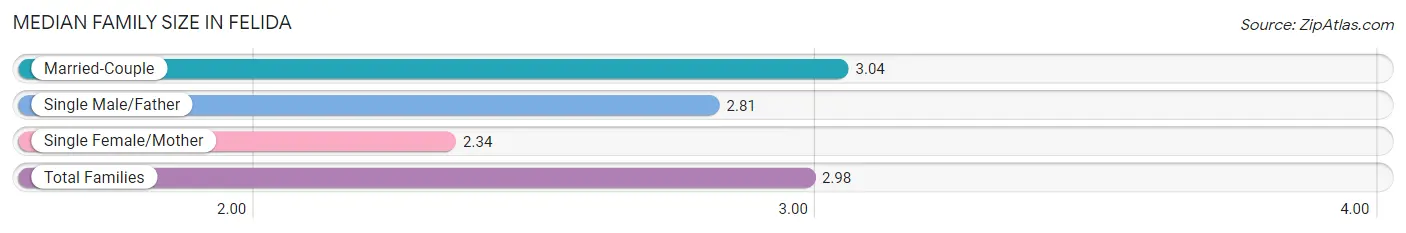
Median Family Size in Felida
The median family size in Felida is 2.98 persons per family, with married-couple families (2,735 | 88.4%) accounting for the largest median family size of 3.04 persons per family. On the other hand, single female/mother families (232 | 7.5%) represent the smallest median family size with 2.34 persons per family.
| Family Type | # Families | Family Size |
| Married-Couple | 2,735 (88.4%) | 3.04 |
| Single Male/Father | 127 (4.1%) | 2.81 |
| Single Female/Mother | 232 (7.5%) | 2.34 |
| Total Families | 3,094 (100.0%) | 2.98 |
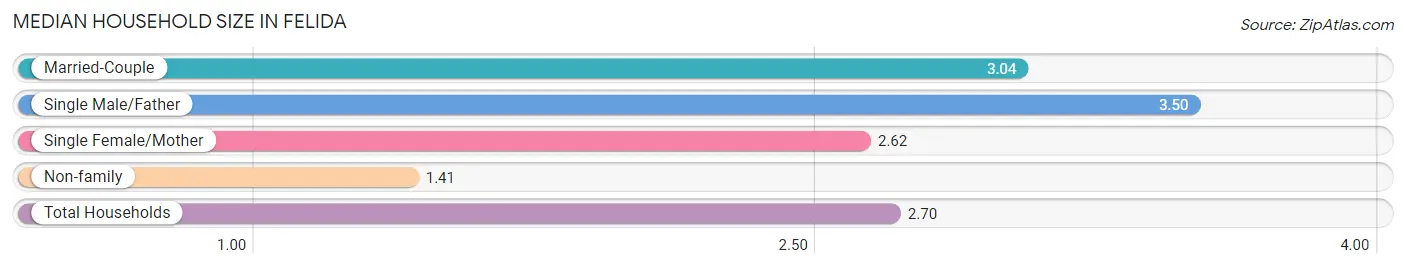
Median Household Size in Felida
The median household size in Felida is 2.70 persons per household, with single male/father households (127 | 3.3%) accounting for the largest median household size of 3.5 persons per household. non-family households (793 | 20.4%) represent the smallest median household size with 1.41 persons per household.
| Household Type | # Households | Household Size |
| Married-Couple | 2,735 (70.4%) | 3.04 |
| Single Male/Father | 127 (3.3%) | 3.50 |
| Single Female/Mother | 232 (6.0%) | 2.62 |
| Non-family | 793 (20.4%) | 1.41 |
| Total Households | 3,887 (100.0%) | 2.70 |
Household Size by Marriage Status in Felida
Out of a total of 3,887 households in Felida, 3,094 (79.6%) are family households, while 793 (20.4%) are nonfamily households. The most numerous type of family households are 2-person households, comprising 1,425, and the most common type of nonfamily households are 1-person households, comprising 505.
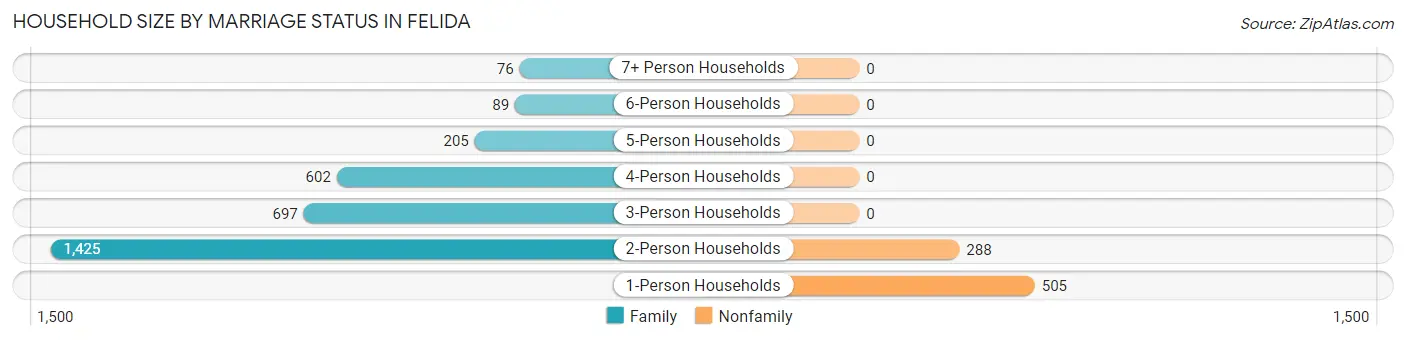
| Household Size | Family Households | Nonfamily Households |
| 1-Person Households | - | 505 (13.0%) |
| 2-Person Households | 1,425 (36.7%) | 288 (7.4%) |
| 3-Person Households | 697 (17.9%) | 0 (0.0%) |
| 4-Person Households | 602 (15.5%) | 0 (0.0%) |
| 5-Person Households | 205 (5.3%) | 0 (0.0%) |
| 6-Person Households | 89 (2.3%) | 0 (0.0%) |
| 7+ Person Households | 76 (2.0%) | 0 (0.0%) |
| Total | 3,094 (79.6%) | 793 (20.4%) |
Female Fertility in Felida
Fertility by Age in Felida
Average fertility rate in Felida is 80.0 births per 1,000 women. Women in the age bracket of 20 to 34 years have the highest fertility rate with 148.0 births per 1,000 women. Women in the age bracket of 20 to 34 years acount for 54.3% of all women with births.
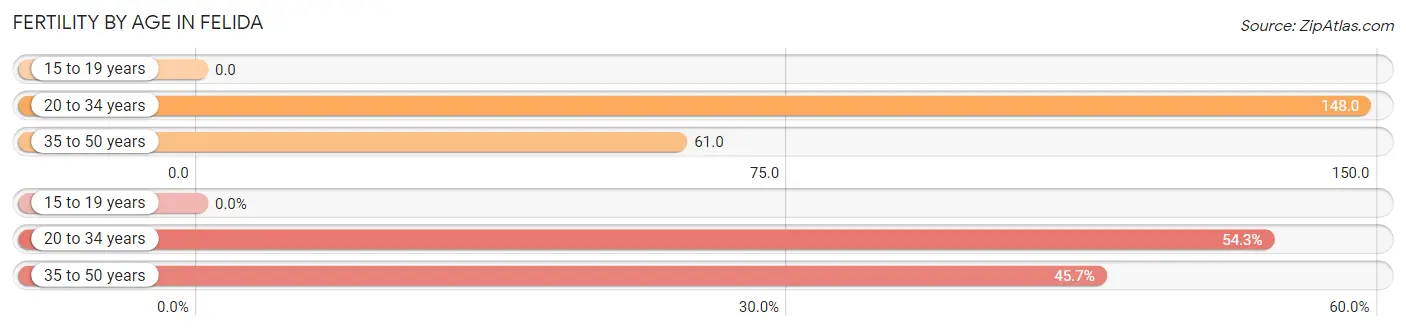
| Age Bracket | Women with Births | Births / 1,000 Women |
| 15 to 19 years | 0 (0.0%) | 0.0 |
| 20 to 34 years | 89 (54.3%) | 148.0 |
| 35 to 50 years | 75 (45.7%) | 61.0 |
| Total | 164 (100.0%) | 80.0 |
Fertility by Age by Marriage Status in Felida
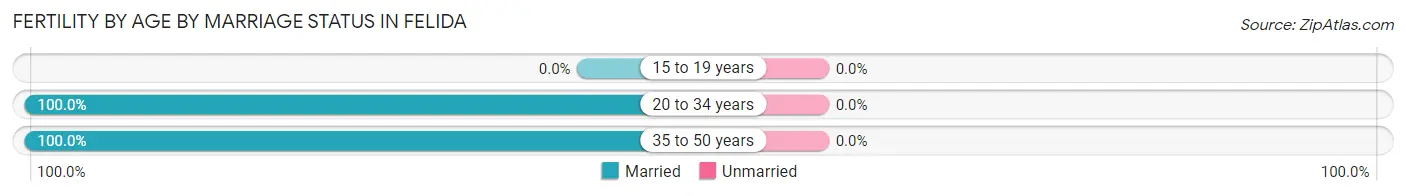
| Age Bracket | Married | Unmarried |
| 15 to 19 years | 0 (0.0%) | 0 (0.0%) |
| 20 to 34 years | 89 (100.0%) | 0 (0.0%) |
| 35 to 50 years | 75 (100.0%) | 0 (0.0%) |
| Total | 164 (100.0%) | 0 (0.0%) |
Fertility by Education in Felida
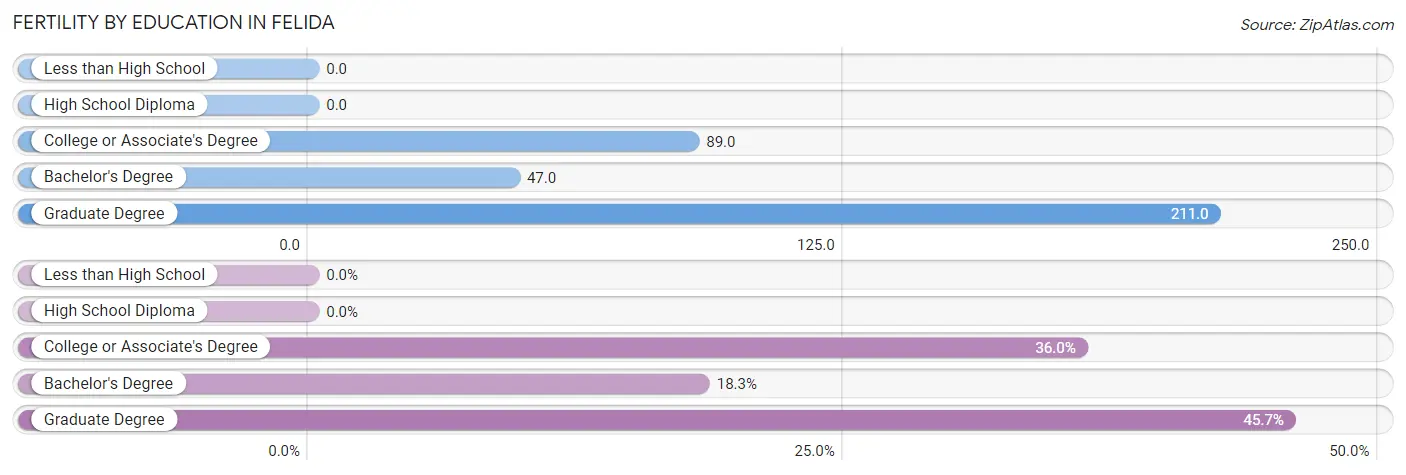
| Educational Attainment | Women with Births | Births / 1,000 Women |
| Less than High School | 0 (0.0%) | 0.0 |
| High School Diploma | 0 (0.0%) | 0.0 |
| College or Associate's Degree | 59 (36.0%) | 89.0 |
| Bachelor's Degree | 30 (18.3%) | 47.0 |
| Graduate Degree | 75 (45.7%) | 211.0 |
| Total | 164 (100.0%) | 80.0 |
Fertility by Education by Marriage Status in Felida
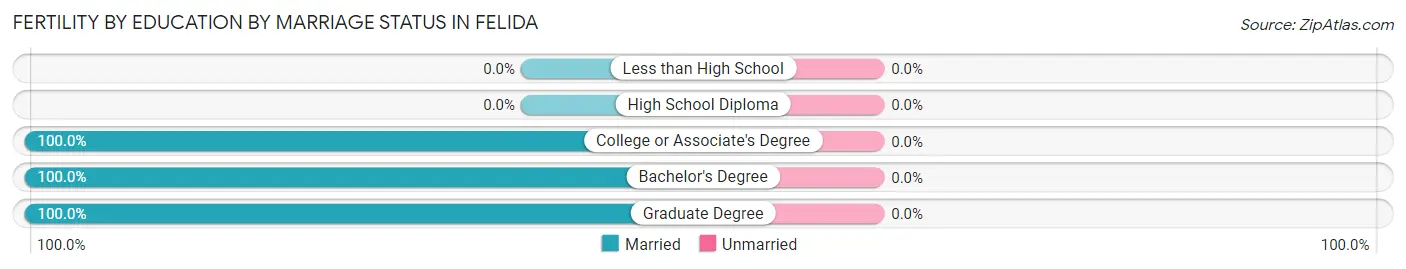
| Educational Attainment | Married | Unmarried |
| Less than High School | 0 (0.0%) | 0 (0.0%) |
| High School Diploma | 0 (0.0%) | 0 (0.0%) |
| College or Associate's Degree | 59 (100.0%) | 0 (0.0%) |
| Bachelor's Degree | 30 (100.0%) | 0 (0.0%) |
| Graduate Degree | 75 (100.0%) | 0 (0.0%) |
| Total | 164 (100.0%) | 0 (0.0%) |
Employment Characteristics in Felida
Employment by Class of Employer in Felida
Among the 5,319 employed individuals in Felida, private company employees (3,508 | 65.9%), not-for-profit organizations (539 | 10.1%), and local government employees (371 | 7.0%) make up the most common classes of employment.
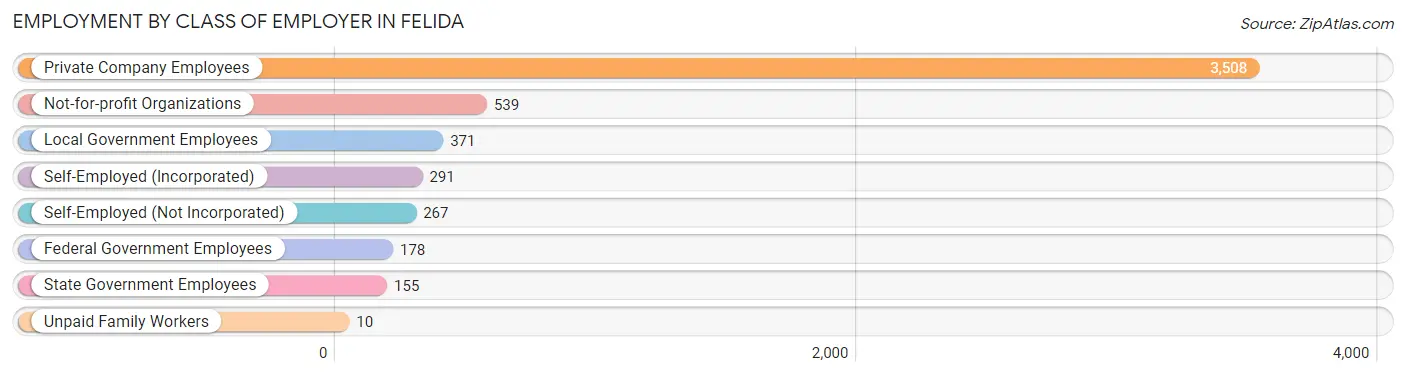
| Employer Class | # Employees | % Employees |
| Private Company Employees | 3,508 | 65.9% |
| Self-Employed (Incorporated) | 291 | 5.5% |
| Self-Employed (Not Incorporated) | 267 | 5.0% |
| Not-for-profit Organizations | 539 | 10.1% |
| Local Government Employees | 371 | 7.0% |
| State Government Employees | 155 | 2.9% |
| Federal Government Employees | 178 | 3.4% |
| Unpaid Family Workers | 10 | 0.2% |
| Total | 5,319 | 100.0% |
Employment Status by Age in Felida
According to the labor force statistics for Felida, out of the total population over 16 years of age (8,258), 68.6% or 5,665 individuals are in the labor force, with 5.3% or 300 of them unemployed. The age group with the highest labor force participation rate is 45 to 54 years, with 92.1% or 1,491 individuals in the labor force. Within the labor force, the 16 to 19 years age range has the highest percentage of unemployed individuals, with 49.0% or 73 of them being unemployed.
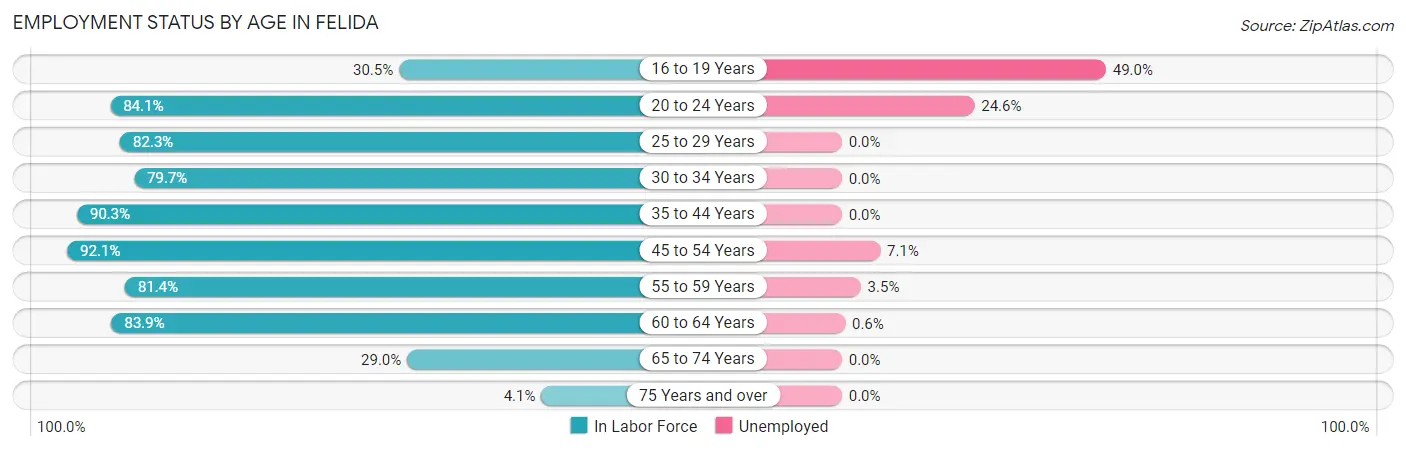
| Age Bracket | In Labor Force | Unemployed |
| 16 to 19 Years | 149 (30.5%) | 73 (49.0%) |
| 20 to 24 Years | 334 (84.1%) | 82 (24.6%) |
| 25 to 29 Years | 200 (82.3%) | 0 (0.0%) |
| 30 to 34 Years | 330 (79.7%) | 0 (0.0%) |
| 35 to 44 Years | 1,121 (90.3%) | 0 (0.0%) |
| 45 to 54 Years | 1,491 (92.1%) | 106 (7.1%) |
| 55 to 59 Years | 1,009 (81.4%) | 35 (3.5%) |
| 60 to 64 Years | 662 (83.9%) | 4 (0.6%) |
| 65 to 74 Years | 347 (29.0%) | 0 (0.0%) |
| 75 Years and over | 26 (4.1%) | 0 (0.0%) |
| Total | 5,665 (68.6%) | 300 (5.3%) |
Employment Status by Educational Attainment in Felida
According to labor force statistics for Felida, 86.8% of individuals (4,813) out of the total population between 25 and 64 years of age (5,545) are in the labor force, with 3.0% or 144 of them being unemployed. The group with the highest labor force participation rate are those with the educational attainment of bachelor's degree or higher, with 89.8% or 3,081 individuals in the labor force. Within the labor force, individuals with bachelor's degree or higher education have the highest percentage of unemployment, with 3.4% or 105 of them being unemployed.
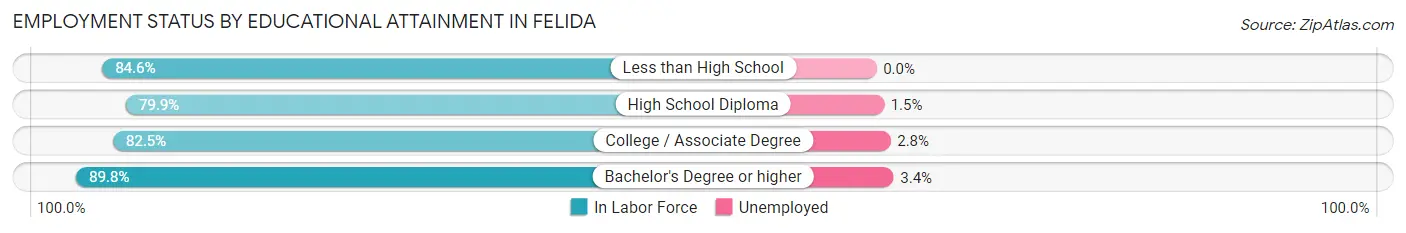
| Educational Attainment | In Labor Force | Unemployed |
| Less than High School | 104 (84.6%) | 0 (0.0%) |
| High School Diploma | 470 (79.9%) | 9 (1.5%) |
| College / Associate Degree | 1,157 (82.5%) | 39 (2.8%) |
| Bachelor's Degree or higher | 3,081 (89.8%) | 117 (3.4%) |
| Total | 4,813 (86.8%) | 166 (3.0%) |
Employment Occupations by Sex in Felida
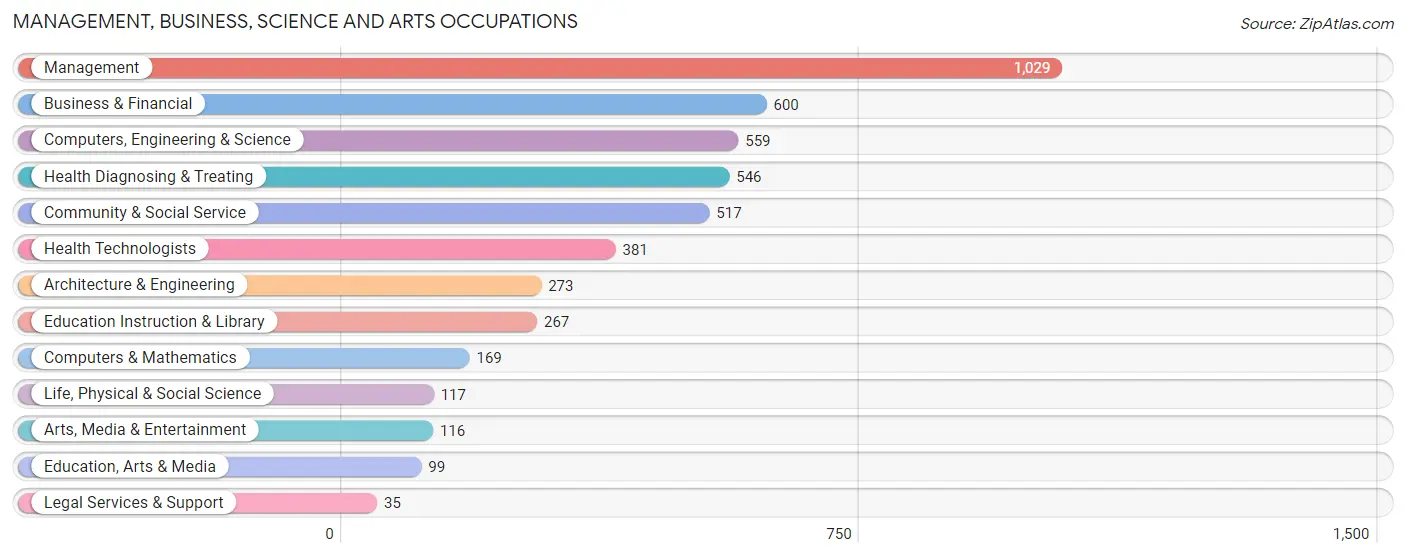
Management, Business, Science and Arts Occupations
The most common Management, Business, Science and Arts occupations in Felida are Management (1,029 | 19.2%), Business & Financial (600 | 11.2%), Computers, Engineering & Science (559 | 10.4%), Health Diagnosing & Treating (546 | 10.2%), and Community & Social Service (517 | 9.7%).
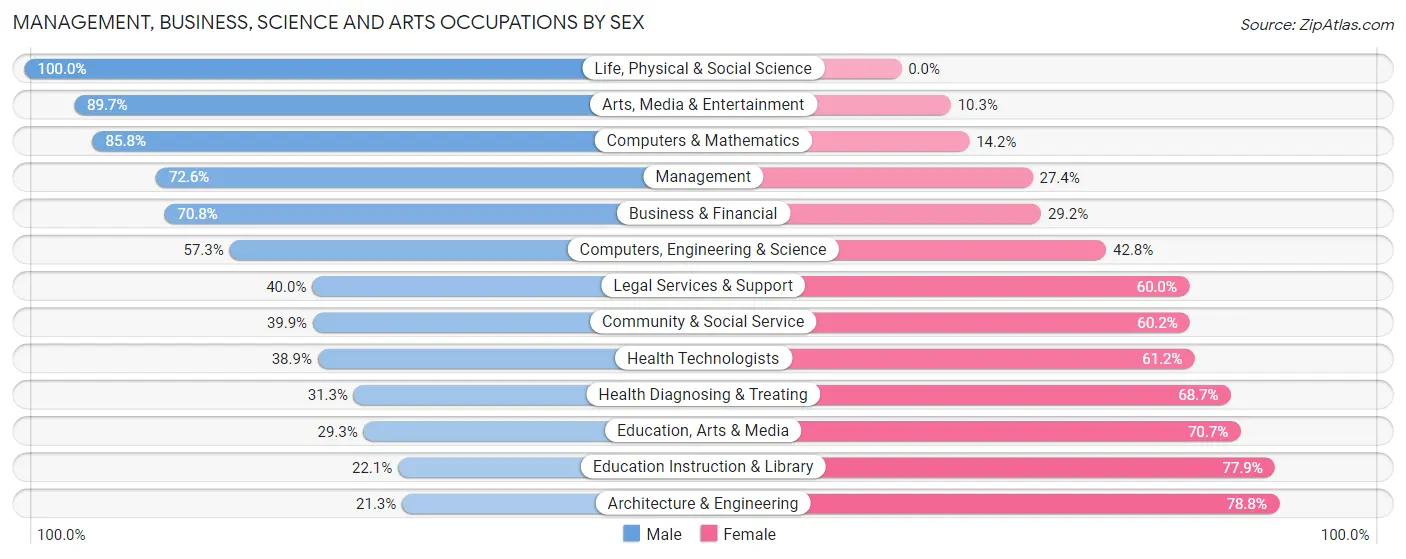
Management, Business, Science and Arts Occupations by Sex
Within the Management, Business, Science and Arts occupations in Felida, the most male-oriented occupations are Life, Physical & Social Science (100.0%), Arts, Media & Entertainment (89.7%), and Computers & Mathematics (85.8%), while the most female-oriented occupations are Architecture & Engineering (78.7%), Education Instruction & Library (77.9%), and Education, Arts & Media (70.7%).
| Occupation | Male | Female |
| Management | 747 (72.6%) | 282 (27.4%) |
| Business & Financial | 425 (70.8%) | 175 (29.2%) |
| Computers, Engineering & Science | 320 (57.3%) | 239 (42.7%) |
| Computers & Mathematics | 145 (85.8%) | 24 (14.2%) |
| Architecture & Engineering | 58 (21.2%) | 215 (78.7%) |
| Life, Physical & Social Science | 117 (100.0%) | 0 (0.0%) |
| Community & Social Service | 206 (39.9%) | 311 (60.2%) |
| Education, Arts & Media | 29 (29.3%) | 70 (70.7%) |
| Legal Services & Support | 14 (40.0%) | 21 (60.0%) |
| Education Instruction & Library | 59 (22.1%) | 208 (77.9%) |
| Arts, Media & Entertainment | 104 (89.7%) | 12 (10.3%) |
| Health Diagnosing & Treating | 171 (31.3%) | 375 (68.7%) |
| Health Technologists | 148 (38.9%) | 233 (61.2%) |
| Total (Category) | 1,869 (57.5%) | 1,382 (42.5%) |
| Total (Overall) | 2,949 (55.1%) | 2,407 (44.9%) |
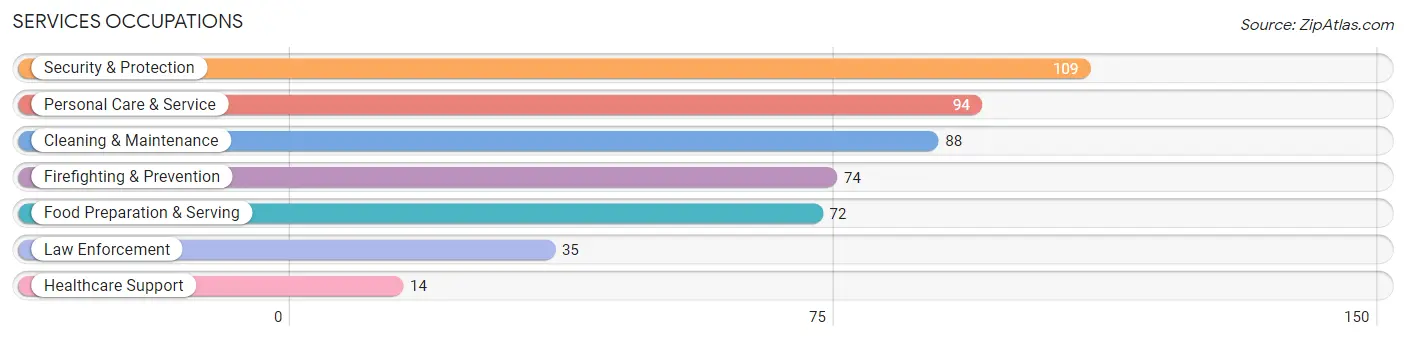
Services Occupations
The most common Services occupations in Felida are Security & Protection (109 | 2.0%), Personal Care & Service (94 | 1.8%), Cleaning & Maintenance (88 | 1.6%), Firefighting & Prevention (74 | 1.4%), and Food Preparation & Serving (72 | 1.3%).
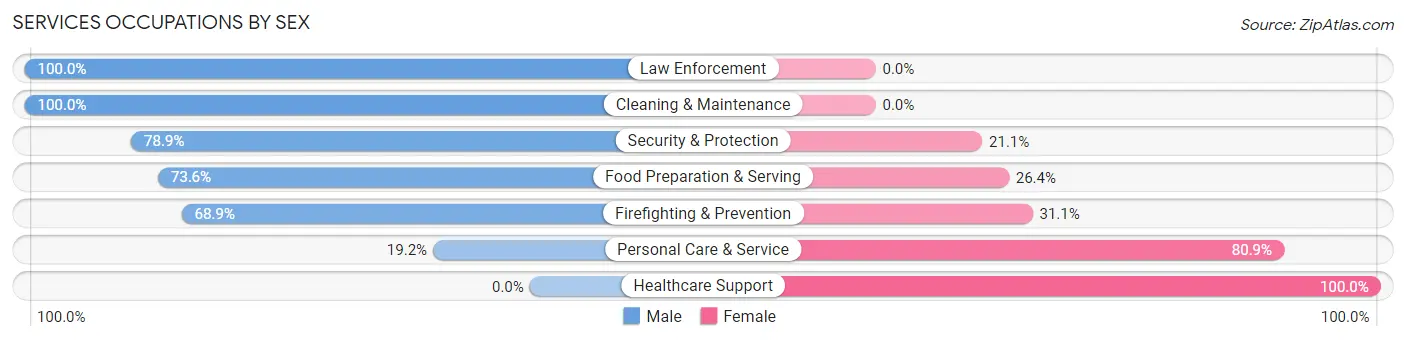
Services Occupations by Sex
Within the Services occupations in Felida, the most male-oriented occupations are Law Enforcement (100.0%), Cleaning & Maintenance (100.0%), and Security & Protection (78.9%), while the most female-oriented occupations are Healthcare Support (100.0%), Personal Care & Service (80.8%), and Firefighting & Prevention (31.1%).
| Occupation | Male | Female |
| Healthcare Support | 0 (0.0%) | 14 (100.0%) |
| Security & Protection | 86 (78.9%) | 23 (21.1%) |
| Firefighting & Prevention | 51 (68.9%) | 23 (31.1%) |
| Law Enforcement | 35 (100.0%) | 0 (0.0%) |
| Food Preparation & Serving | 53 (73.6%) | 19 (26.4%) |
| Cleaning & Maintenance | 88 (100.0%) | 0 (0.0%) |
| Personal Care & Service | 18 (19.2%) | 76 (80.8%) |
| Total (Category) | 245 (65.0%) | 132 (35.0%) |
| Total (Overall) | 2,949 (55.1%) | 2,407 (44.9%) |
Sales and Office Occupations
The most common Sales and Office occupations in Felida are Sales & Related (771 | 14.4%), and Office & Administration (616 | 11.5%).
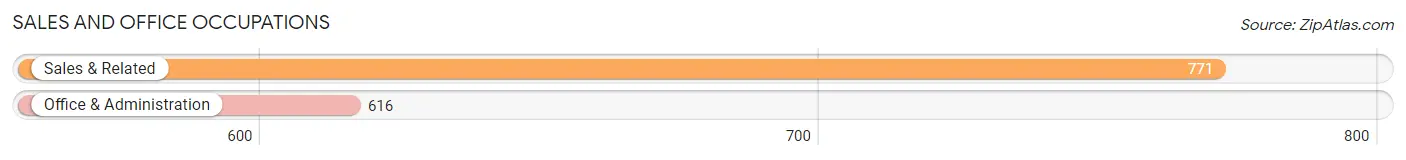
Sales and Office Occupations by Sex
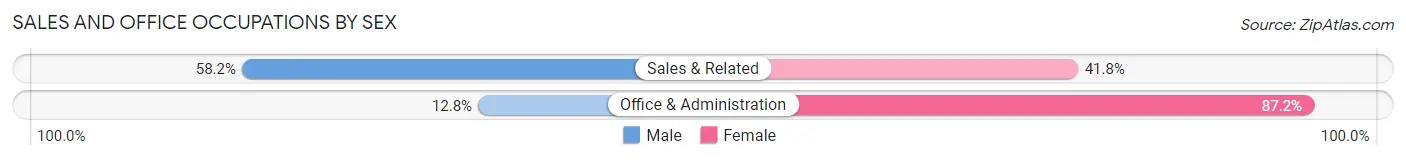
| Occupation | Male | Female |
| Sales & Related | 449 (58.2%) | 322 (41.8%) |
| Office & Administration | 79 (12.8%) | 537 (87.2%) |
| Total (Category) | 528 (38.1%) | 859 (61.9%) |
| Total (Overall) | 2,949 (55.1%) | 2,407 (44.9%) |
Natural Resources, Construction and Maintenance Occupations
The most common Natural Resources, Construction and Maintenance occupations in Felida are Construction & Extraction (103 | 1.9%), and Installation, Maintenance & Repair (37 | 0.7%).
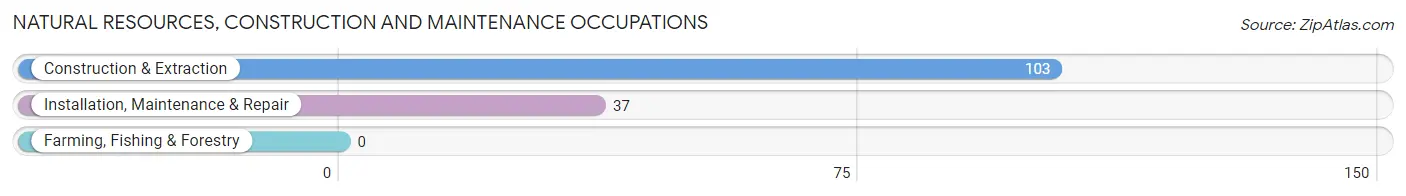
Natural Resources, Construction and Maintenance Occupations by Sex
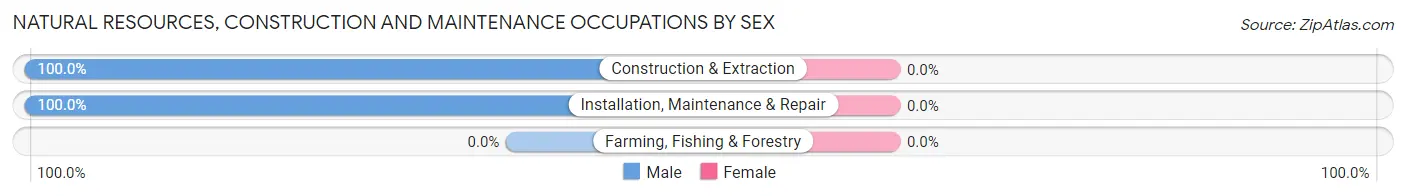
| Occupation | Male | Female |
| Farming, Fishing & Forestry | 0 (0.0%) | 0 (0.0%) |
| Construction & Extraction | 103 (100.0%) | 0 (0.0%) |
| Installation, Maintenance & Repair | 37 (100.0%) | 0 (0.0%) |
| Total (Category) | 140 (100.0%) | 0 (0.0%) |
| Total (Overall) | 2,949 (55.1%) | 2,407 (44.9%) |
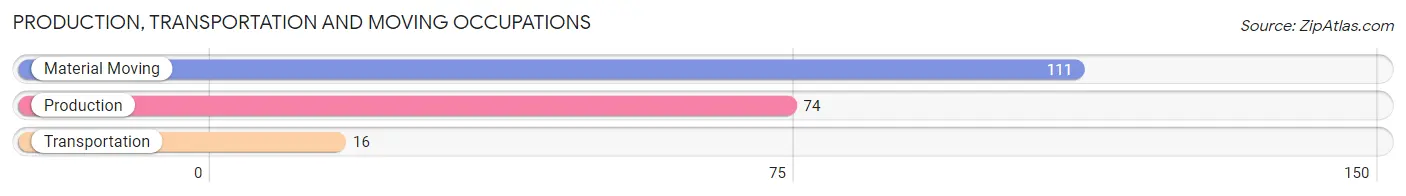
Production, Transportation and Moving Occupations
The most common Production, Transportation and Moving occupations in Felida are Material Moving (111 | 2.1%), Production (74 | 1.4%), and Transportation (16 | 0.3%).
Production, Transportation and Moving Occupations by Sex
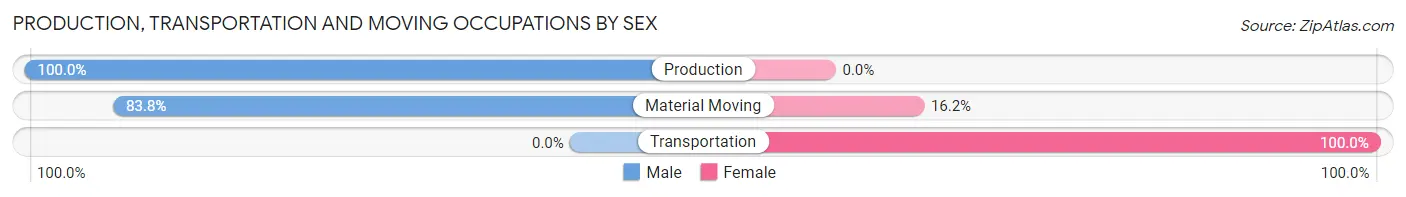
| Occupation | Male | Female |
| Production | 74 (100.0%) | 0 (0.0%) |
| Transportation | 0 (0.0%) | 16 (100.0%) |
| Material Moving | 93 (83.8%) | 18 (16.2%) |
| Total (Category) | 167 (83.1%) | 34 (16.9%) |
| Total (Overall) | 2,949 (55.1%) | 2,407 (44.9%) |
Employment Industries by Sex in Felida
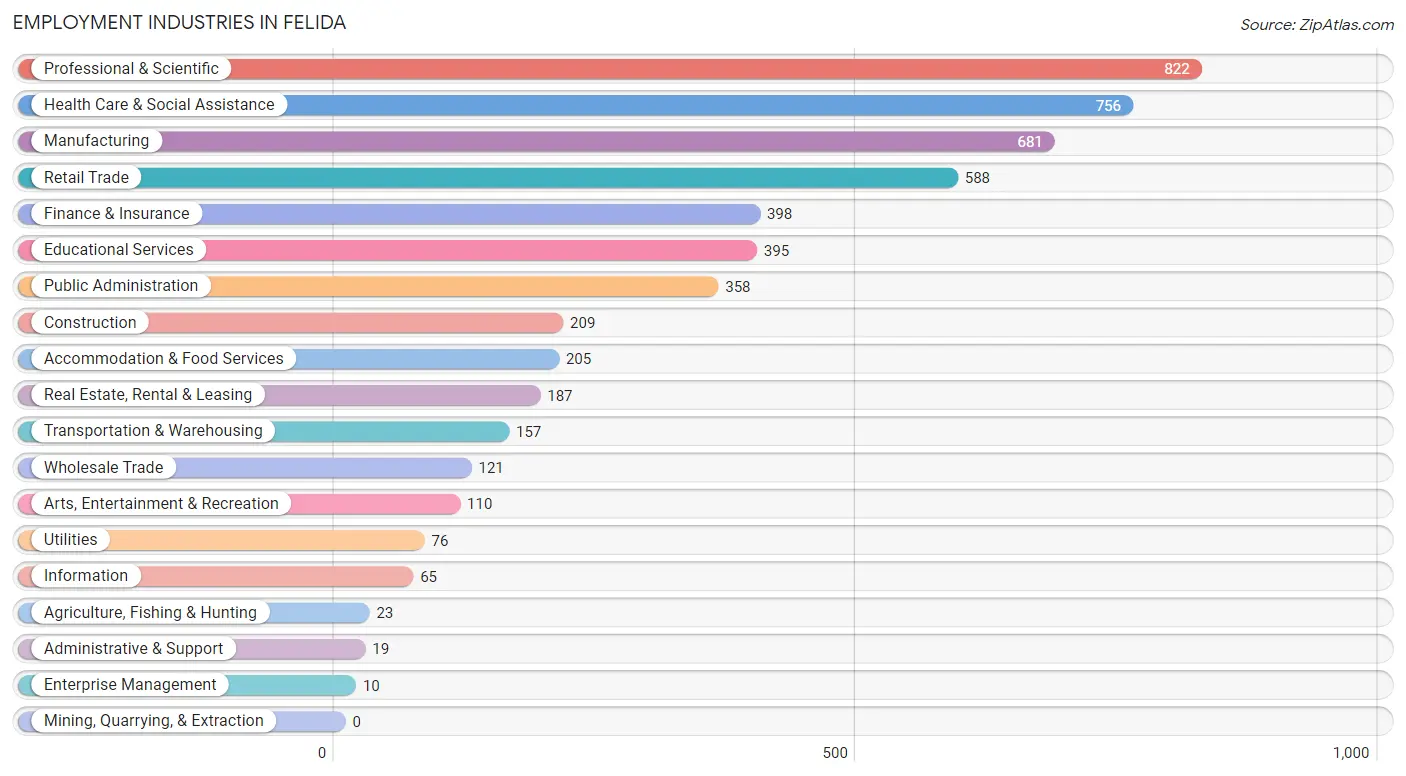
Employment Industries in Felida
The major employment industries in Felida include Professional & Scientific (822 | 15.3%), Health Care & Social Assistance (756 | 14.1%), Manufacturing (681 | 12.7%), Retail Trade (588 | 11.0%), and Finance & Insurance (398 | 7.4%).
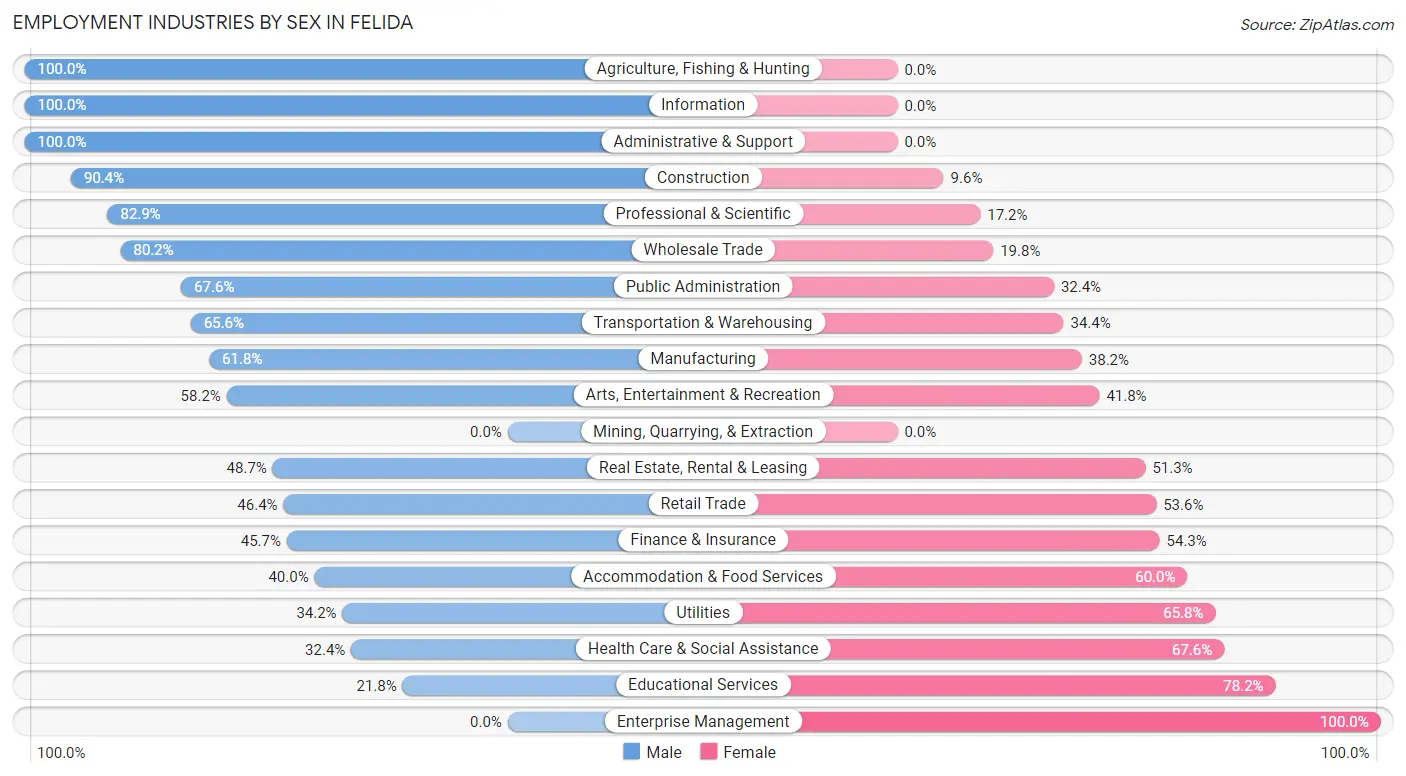
Employment Industries by Sex in Felida
The Felida industries that see more men than women are Agriculture, Fishing & Hunting (100.0%), Information (100.0%), and Administrative & Support (100.0%), whereas the industries that tend to have a higher number of women are Enterprise Management (100.0%), Educational Services (78.2%), and Health Care & Social Assistance (67.6%).
| Industry | Male | Female |
| Agriculture, Fishing & Hunting | 23 (100.0%) | 0 (0.0%) |
| Mining, Quarrying, & Extraction | 0 (0.0%) | 0 (0.0%) |
| Construction | 189 (90.4%) | 20 (9.6%) |
| Manufacturing | 421 (61.8%) | 260 (38.2%) |
| Wholesale Trade | 97 (80.2%) | 24 (19.8%) |
| Retail Trade | 273 (46.4%) | 315 (53.6%) |
| Transportation & Warehousing | 103 (65.6%) | 54 (34.4%) |
| Utilities | 26 (34.2%) | 50 (65.8%) |
| Information | 65 (100.0%) | 0 (0.0%) |
| Finance & Insurance | 182 (45.7%) | 216 (54.3%) |
| Real Estate, Rental & Leasing | 91 (48.7%) | 96 (51.3%) |
| Professional & Scientific | 681 (82.9%) | 141 (17.2%) |
| Enterprise Management | 0 (0.0%) | 10 (100.0%) |
| Administrative & Support | 19 (100.0%) | 0 (0.0%) |
| Educational Services | 86 (21.8%) | 309 (78.2%) |
| Health Care & Social Assistance | 245 (32.4%) | 511 (67.6%) |
| Arts, Entertainment & Recreation | 64 (58.2%) | 46 (41.8%) |
| Accommodation & Food Services | 82 (40.0%) | 123 (60.0%) |
| Public Administration | 242 (67.6%) | 116 (32.4%) |
| Total | 2,949 (55.1%) | 2,407 (44.9%) |
Education in Felida
School Enrollment in Felida
The most common levels of schooling among the 2,457 students in Felida are elementary school (728 | 29.6%), middle school (608 | 24.7%), and high school (592 | 24.1%).
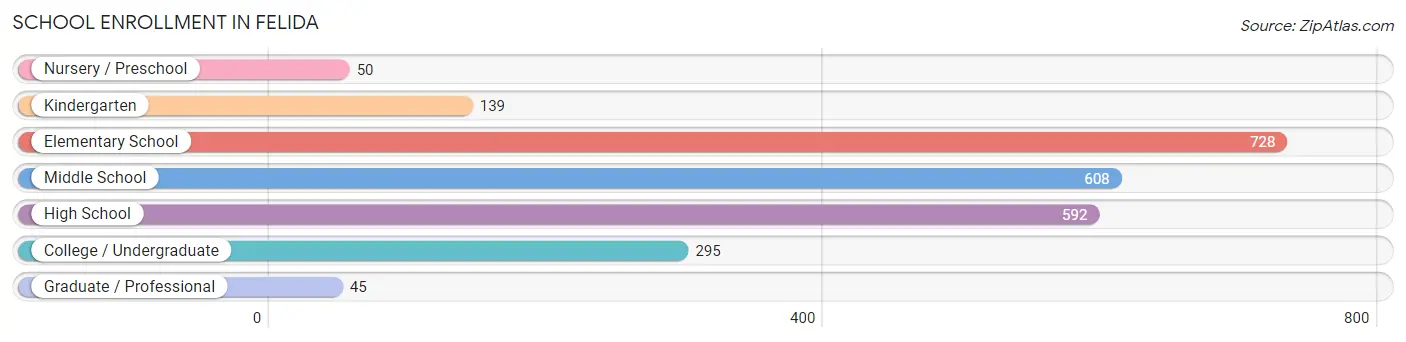
| School Level | # Students | % Students |
| Nursery / Preschool | 50 | 2.0% |
| Kindergarten | 139 | 5.7% |
| Elementary School | 728 | 29.6% |
| Middle School | 608 | 24.7% |
| High School | 592 | 24.1% |
| College / Undergraduate | 295 | 12.0% |
| Graduate / Professional | 45 | 1.8% |
| Total | 2,457 | 100.0% |
School Enrollment by Age by Funding Source in Felida
Out of a total of 2,457 students who are enrolled in schools in Felida, 246 (10.0%) attend a private institution, while the remaining 2,211 (90.0%) are enrolled in public schools. The age group of 3 to 4 year olds has the highest likelihood of being enrolled in private schools, with 20 (40.0% in the age bracket) enrolled. Conversely, the age group of 18 to 19 year olds has the lowest likelihood of being enrolled in a private school, with 20 (100.0% in the age bracket) attending a public institution.
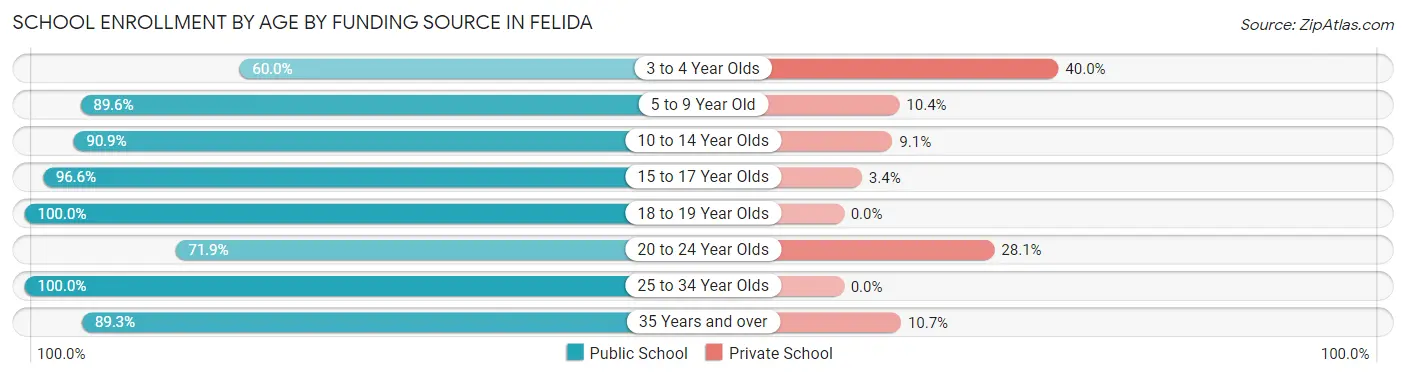
| Age Bracket | Public School | Private School |
| 3 to 4 Year Olds | 30 (60.0%) | 20 (40.0%) |
| 5 to 9 Year Old | 665 (89.6%) | 77 (10.4%) |
| 10 to 14 Year Olds | 731 (90.9%) | 73 (9.1%) |
| 15 to 17 Year Olds | 511 (96.6%) | 18 (3.4%) |
| 18 to 19 Year Olds | 20 (100.0%) | 0 (0.0%) |
| 20 to 24 Year Olds | 105 (71.9%) | 41 (28.1%) |
| 25 to 34 Year Olds | 16 (100.0%) | 0 (0.0%) |
| 35 Years and over | 134 (89.3%) | 16 (10.7%) |
| Total | 2,211 (90.0%) | 246 (10.0%) |
Educational Attainment by Field of Study in Felida
Business (815 | 17.8%), computers & mathematics (582 | 12.7%), science & technology (410 | 8.9%), communications (387 | 8.4%), and education (360 | 7.9%) are the most common fields of study among 4,584 individuals in Felida who have obtained a bachelor's degree or higher.
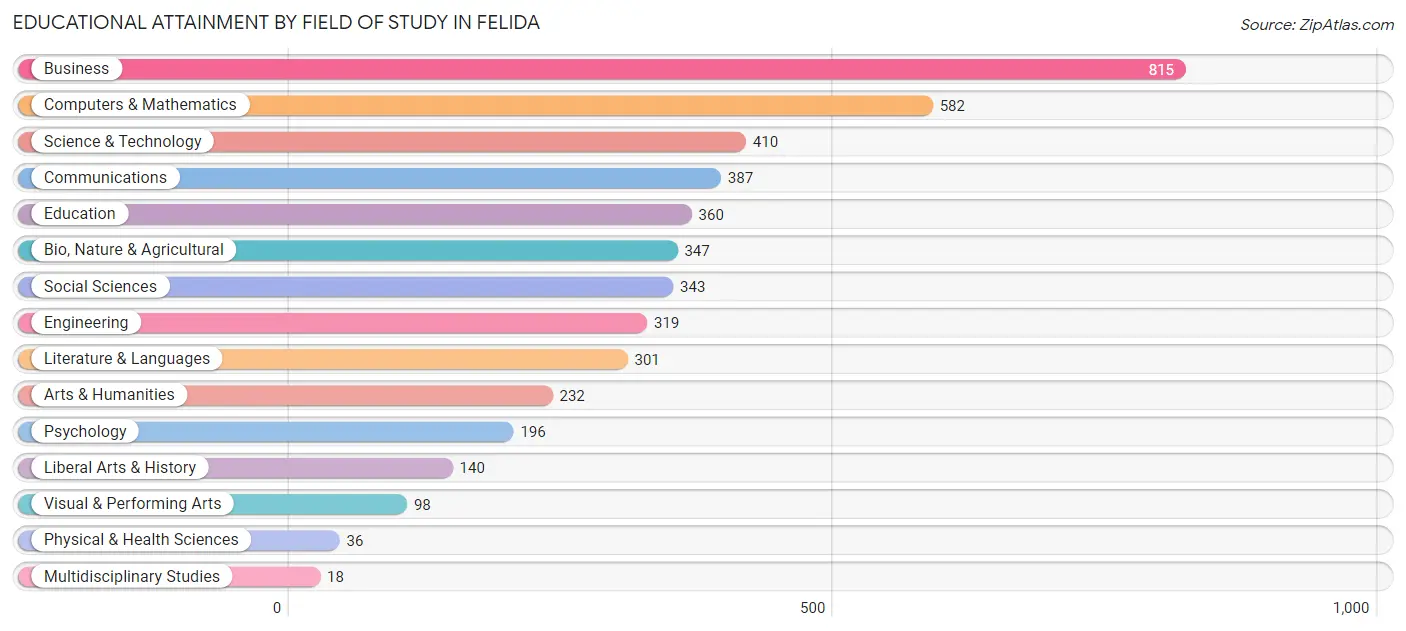
| Field of Study | # Graduates | % Graduates |
| Computers & Mathematics | 582 | 12.7% |
| Bio, Nature & Agricultural | 347 | 7.6% |
| Physical & Health Sciences | 36 | 0.8% |
| Psychology | 196 | 4.3% |
| Social Sciences | 343 | 7.5% |
| Engineering | 319 | 7.0% |
| Multidisciplinary Studies | 18 | 0.4% |
| Science & Technology | 410 | 8.9% |
| Business | 815 | 17.8% |
| Education | 360 | 7.9% |
| Literature & Languages | 301 | 6.6% |
| Liberal Arts & History | 140 | 3.0% |
| Visual & Performing Arts | 98 | 2.1% |
| Communications | 387 | 8.4% |
| Arts & Humanities | 232 | 5.1% |
| Total | 4,584 | 100.0% |
Transportation & Commute in Felida
Vehicle Availability by Sex in Felida
The most prevalent vehicle ownership categories in Felida are males with 2 vehicles (1,511, accounting for 51.0%) and females with 2 vehicles (1,192, making up 64.1%).
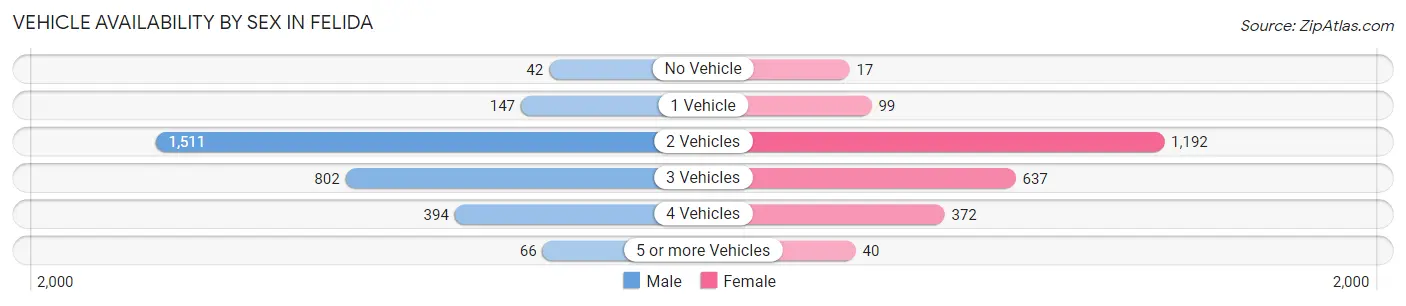
| Vehicles Available | Male | Female |
| No Vehicle | 42 (1.4%) | 17 (0.7%) |
| 1 Vehicle | 147 (5.0%) | 99 (4.2%) |
| 2 Vehicles | 1,511 (51.0%) | 1,192 (50.6%) |
| 3 Vehicles | 802 (27.1%) | 637 (27.0%) |
| 4 Vehicles | 394 (13.3%) | 372 (15.8%) |
| 5 or more Vehicles | 66 (2.2%) | 40 (1.7%) |
| Total | 2,962 (100.0%) | 2,357 (100.0%) |
Commute Time in Felida
The most frequently occuring commute durations in Felida are 15 to 19 minutes (1,040 commuters, 27.4%), 20 to 24 minutes (584 commuters, 15.4%), and 30 to 34 minutes (565 commuters, 14.9%).
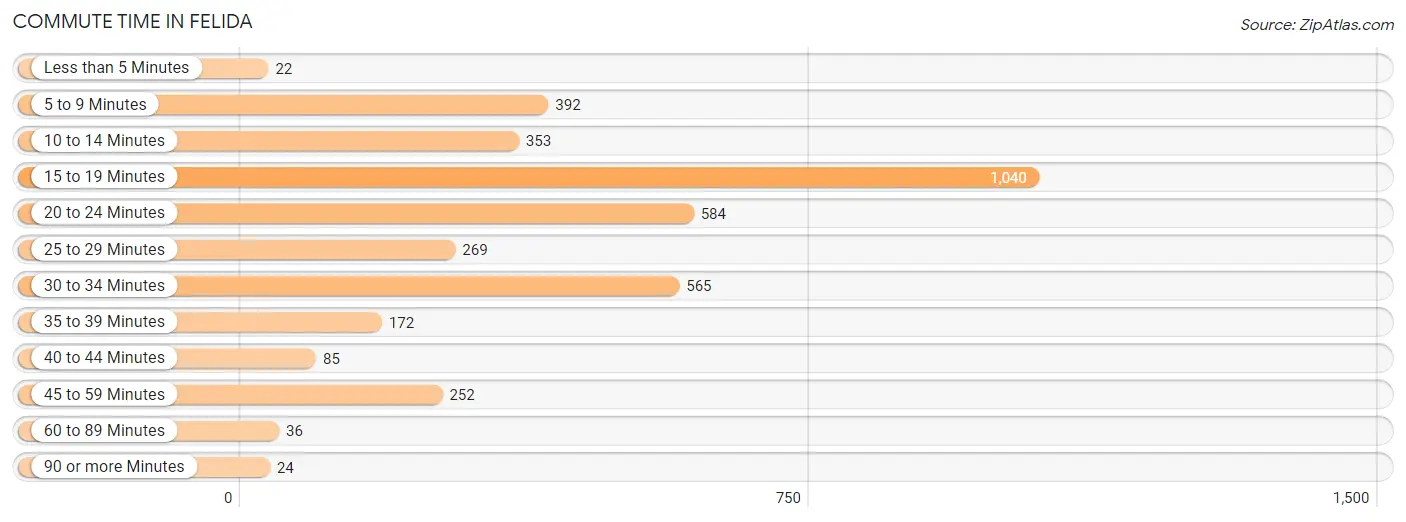
| Commute Time | # Commuters | % Commuters |
| Less than 5 Minutes | 22 | 0.6% |
| 5 to 9 Minutes | 392 | 10.3% |
| 10 to 14 Minutes | 353 | 9.3% |
| 15 to 19 Minutes | 1,040 | 27.4% |
| 20 to 24 Minutes | 584 | 15.4% |
| 25 to 29 Minutes | 269 | 7.1% |
| 30 to 34 Minutes | 565 | 14.9% |
| 35 to 39 Minutes | 172 | 4.5% |
| 40 to 44 Minutes | 85 | 2.2% |
| 45 to 59 Minutes | 252 | 6.6% |
| 60 to 89 Minutes | 36 | 0.9% |
| 90 or more Minutes | 24 | 0.6% |
Commute Time by Sex in Felida
The most common commute times in Felida are 15 to 19 minutes (657 commuters, 30.4%) for males and 15 to 19 minutes (383 commuters, 23.4%) for females.
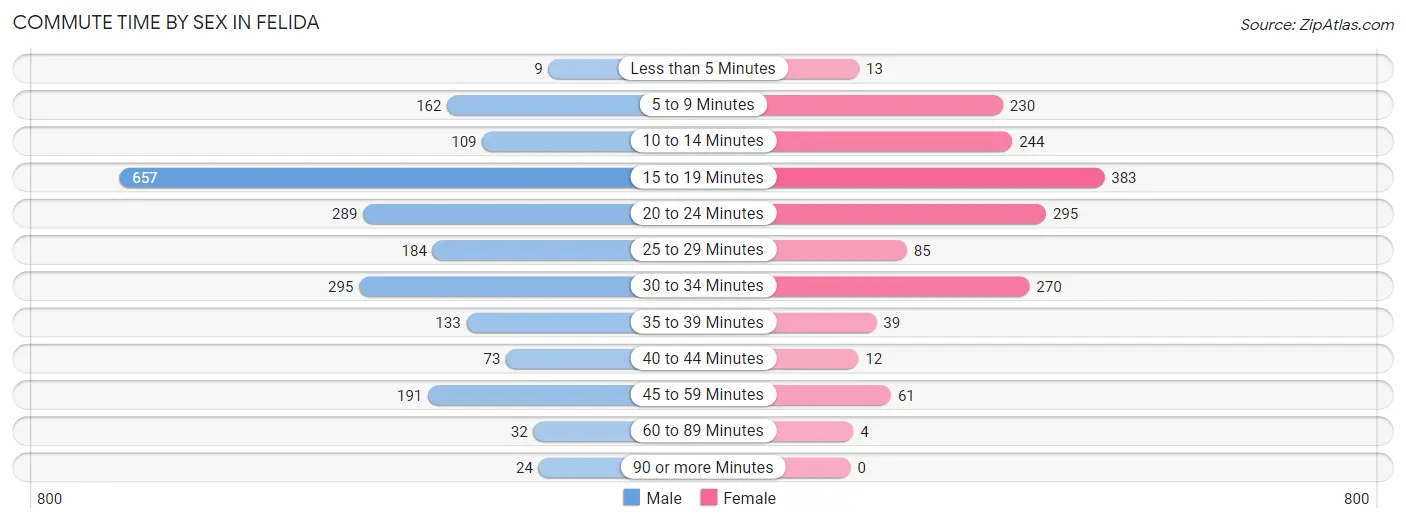
| Commute Time | Male | Female |
| Less than 5 Minutes | 9 (0.4%) | 13 (0.8%) |
| 5 to 9 Minutes | 162 (7.5%) | 230 (14.1%) |
| 10 to 14 Minutes | 109 (5.1%) | 244 (14.9%) |
| 15 to 19 Minutes | 657 (30.4%) | 383 (23.4%) |
| 20 to 24 Minutes | 289 (13.4%) | 295 (18.0%) |
| 25 to 29 Minutes | 184 (8.5%) | 85 (5.2%) |
| 30 to 34 Minutes | 295 (13.7%) | 270 (16.5%) |
| 35 to 39 Minutes | 133 (6.2%) | 39 (2.4%) |
| 40 to 44 Minutes | 73 (3.4%) | 12 (0.7%) |
| 45 to 59 Minutes | 191 (8.8%) | 61 (3.7%) |
| 60 to 89 Minutes | 32 (1.5%) | 4 (0.2%) |
| 90 or more Minutes | 24 (1.1%) | 0 (0.0%) |
Time of Departure to Work by Sex in Felida
The most frequent times of departure to work in Felida are 8:00 AM to 8:29 AM (384, 17.8%) for males and 7:00 AM to 7:29 AM (368, 22.5%) for females.
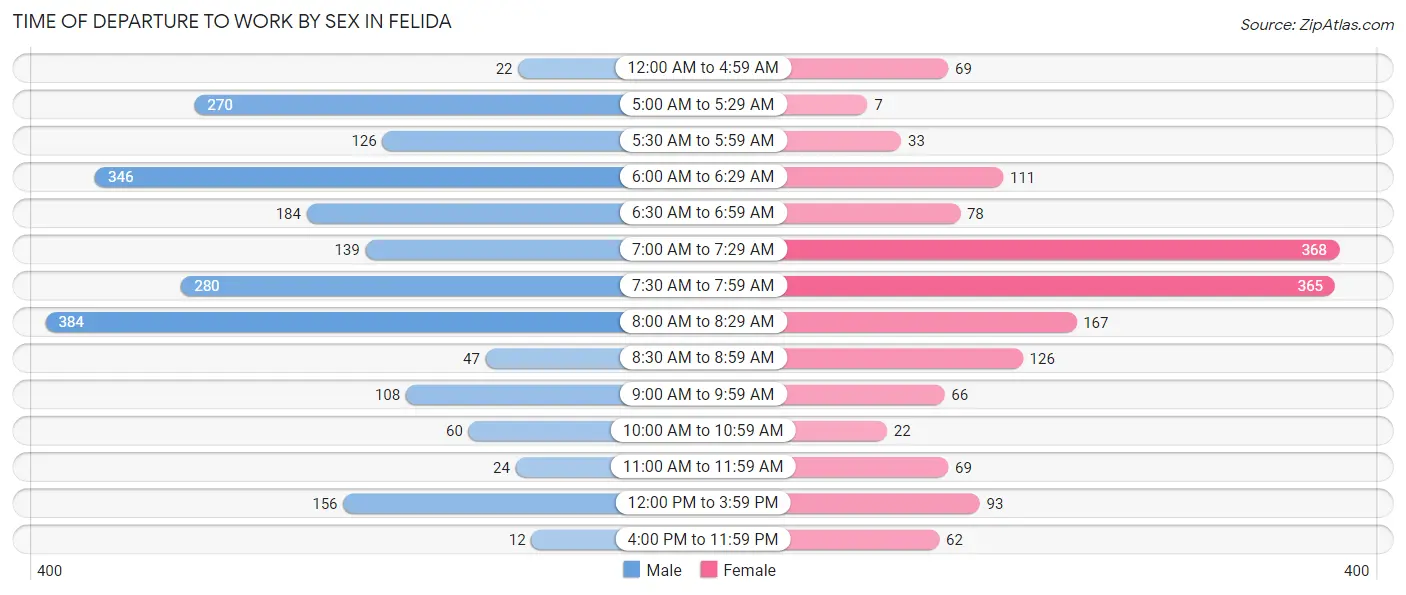
| Time of Departure | Male | Female |
| 12:00 AM to 4:59 AM | 22 (1.0%) | 69 (4.2%) |
| 5:00 AM to 5:29 AM | 270 (12.5%) | 7 (0.4%) |
| 5:30 AM to 5:59 AM | 126 (5.8%) | 33 (2.0%) |
| 6:00 AM to 6:29 AM | 346 (16.0%) | 111 (6.8%) |
| 6:30 AM to 6:59 AM | 184 (8.5%) | 78 (4.8%) |
| 7:00 AM to 7:29 AM | 139 (6.4%) | 368 (22.5%) |
| 7:30 AM to 7:59 AM | 280 (13.0%) | 365 (22.3%) |
| 8:00 AM to 8:29 AM | 384 (17.8%) | 167 (10.2%) |
| 8:30 AM to 8:59 AM | 47 (2.2%) | 126 (7.7%) |
| 9:00 AM to 9:59 AM | 108 (5.0%) | 66 (4.0%) |
| 10:00 AM to 10:59 AM | 60 (2.8%) | 22 (1.3%) |
| 11:00 AM to 11:59 AM | 24 (1.1%) | 69 (4.2%) |
| 12:00 PM to 3:59 PM | 156 (7.2%) | 93 (5.7%) |
| 4:00 PM to 11:59 PM | 12 (0.6%) | 62 (3.8%) |
| Total | 2,158 (100.0%) | 1,636 (100.0%) |
Housing Occupancy in Felida
Occupancy by Ownership in Felida
Of the total 3,887 dwellings in Felida, owner-occupied units account for 3,543 (91.1%), while renter-occupied units make up 344 (8.8%).
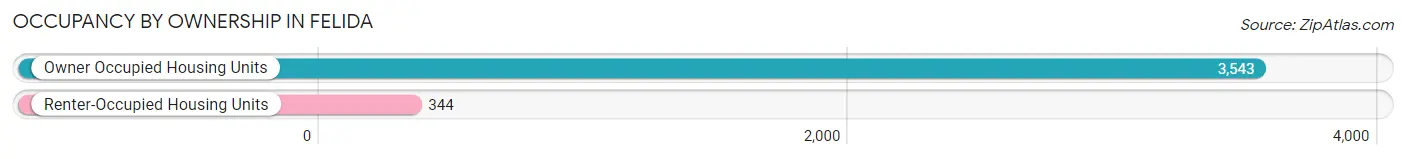
| Occupancy | # Housing Units | % Housing Units |
| Owner Occupied Housing Units | 3,543 | 91.1% |
| Renter-Occupied Housing Units | 344 | 8.8% |
| Total Occupied Housing Units | 3,887 | 100.0% |
Occupancy by Household Size in Felida
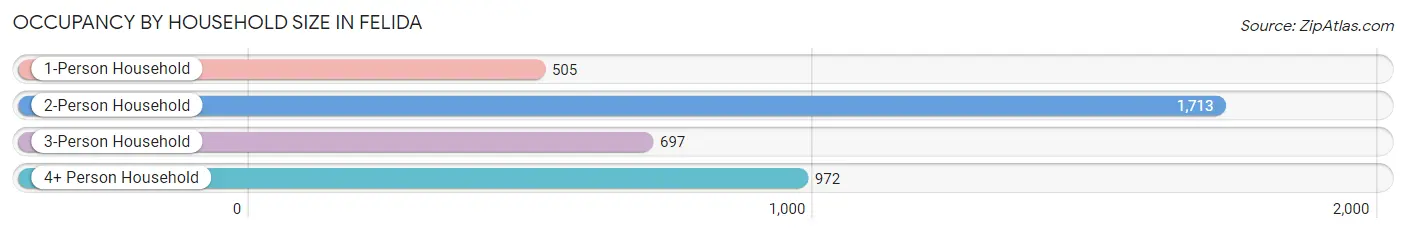
| Household Size | # Housing Units | % Housing Units |
| 1-Person Household | 505 | 13.0% |
| 2-Person Household | 1,713 | 44.1% |
| 3-Person Household | 697 | 17.9% |
| 4+ Person Household | 972 | 25.0% |
| Total Housing Units | 3,887 | 100.0% |
Occupancy by Ownership by Household Size in Felida
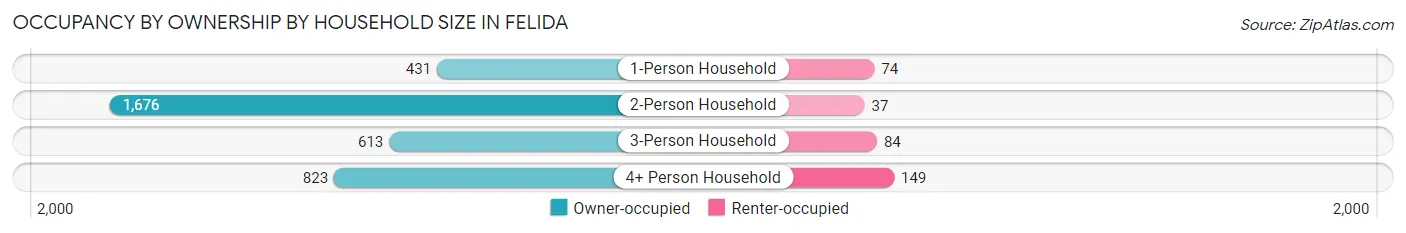
| Household Size | Owner-occupied | Renter-occupied |
| 1-Person Household | 431 (85.4%) | 74 (14.6%) |
| 2-Person Household | 1,676 (97.8%) | 37 (2.2%) |
| 3-Person Household | 613 (87.9%) | 84 (12.0%) |
| 4+ Person Household | 823 (84.7%) | 149 (15.3%) |
| Total Housing Units | 3,543 (91.1%) | 344 (8.8%) |
Occupancy by Educational Attainment in Felida
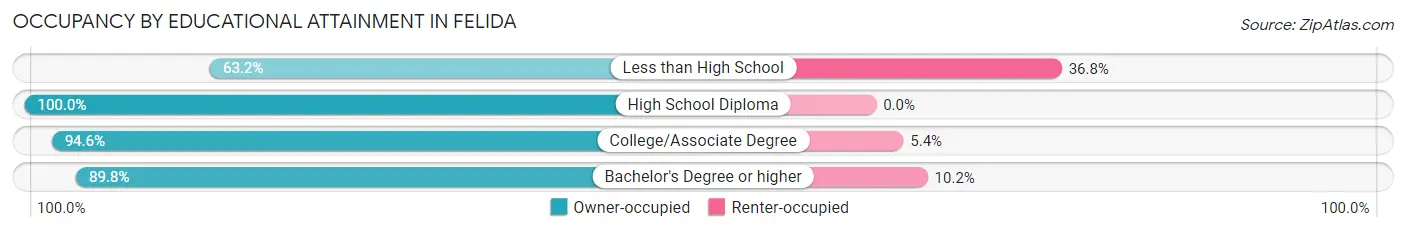
| Household Size | Owner-occupied | Renter-occupied |
| Less than High School | 55 (63.2%) | 32 (36.8%) |
| High School Diploma | 236 (100.0%) | 0 (0.0%) |
| College/Associate Degree | 1,019 (94.6%) | 58 (5.4%) |
| Bachelor's Degree or higher | 2,233 (89.8%) | 254 (10.2%) |
Occupancy by Age of Householder in Felida
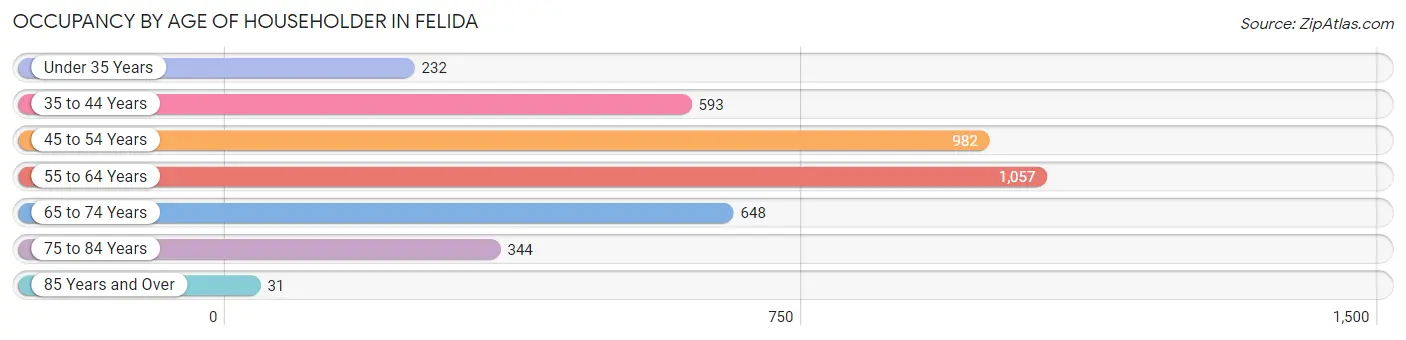
| Age Bracket | # Households | % Households |
| Under 35 Years | 232 | 6.0% |
| 35 to 44 Years | 593 | 15.3% |
| 45 to 54 Years | 982 | 25.3% |
| 55 to 64 Years | 1,057 | 27.2% |
| 65 to 74 Years | 648 | 16.7% |
| 75 to 84 Years | 344 | 8.8% |
| 85 Years and Over | 31 | 0.8% |
| Total | 3,887 | 100.0% |
Housing Finances in Felida
Median Income by Occupancy in Felida
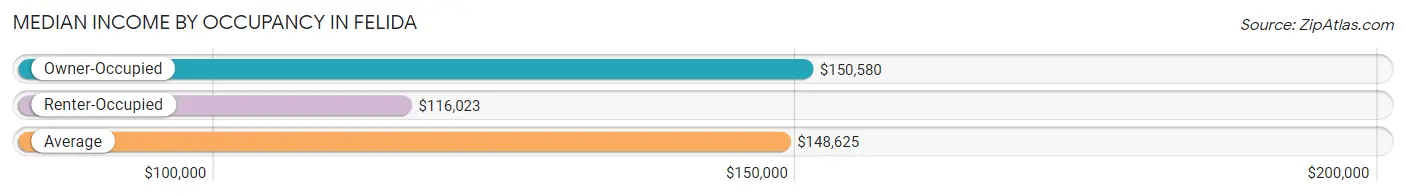
| Occupancy Type | # Households | Median Income |
| Owner-Occupied | 3,543 (91.1%) | $150,580 |
| Renter-Occupied | 344 (8.8%) | $116,023 |
| Average | 3,887 (100.0%) | $148,625 |
Occupancy by Householder Income Bracket in Felida
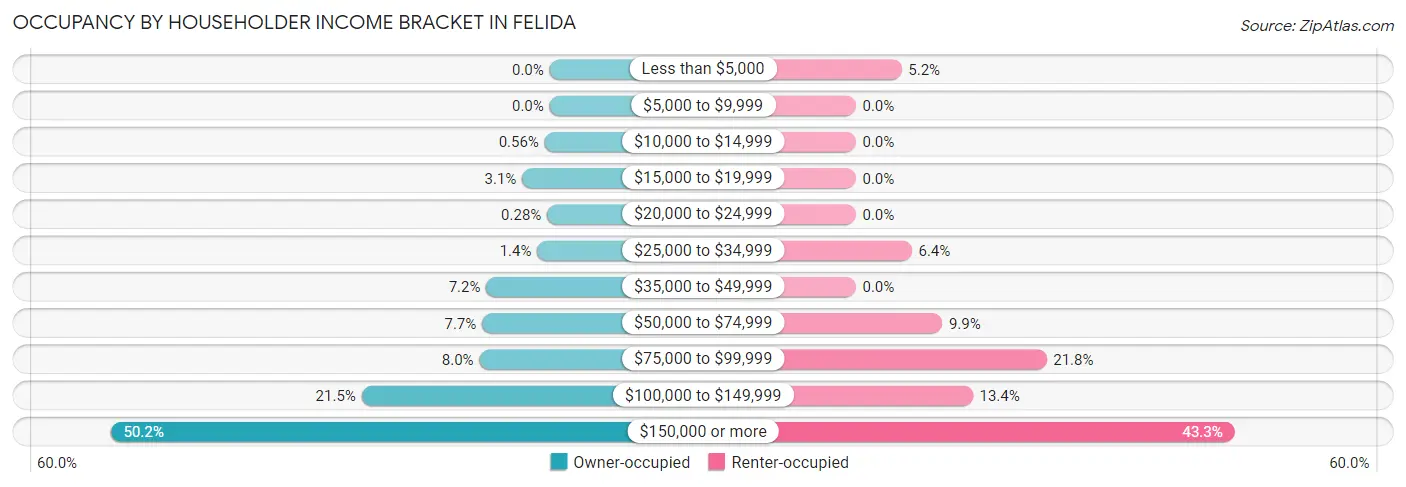
| Income Bracket | Owner-occupied | Renter-occupied |
| Less than $5,000 | 0 (0.0%) | 18 (5.2%) |
| $5,000 to $9,999 | 0 (0.0%) | 0 (0.0%) |
| $10,000 to $14,999 | 20 (0.6%) | 0 (0.0%) |
| $15,000 to $19,999 | 111 (3.1%) | 0 (0.0%) |
| $20,000 to $24,999 | 10 (0.3%) | 0 (0.0%) |
| $25,000 to $34,999 | 50 (1.4%) | 22 (6.4%) |
| $35,000 to $49,999 | 256 (7.2%) | 0 (0.0%) |
| $50,000 to $74,999 | 273 (7.7%) | 34 (9.9%) |
| $75,000 to $99,999 | 284 (8.0%) | 75 (21.8%) |
| $100,000 to $149,999 | 761 (21.5%) | 46 (13.4%) |
| $150,000 or more | 1,778 (50.2%) | 149 (43.3%) |
| Total | 3,543 (100.0%) | 344 (100.0%) |
Monthly Housing Cost Tiers in Felida
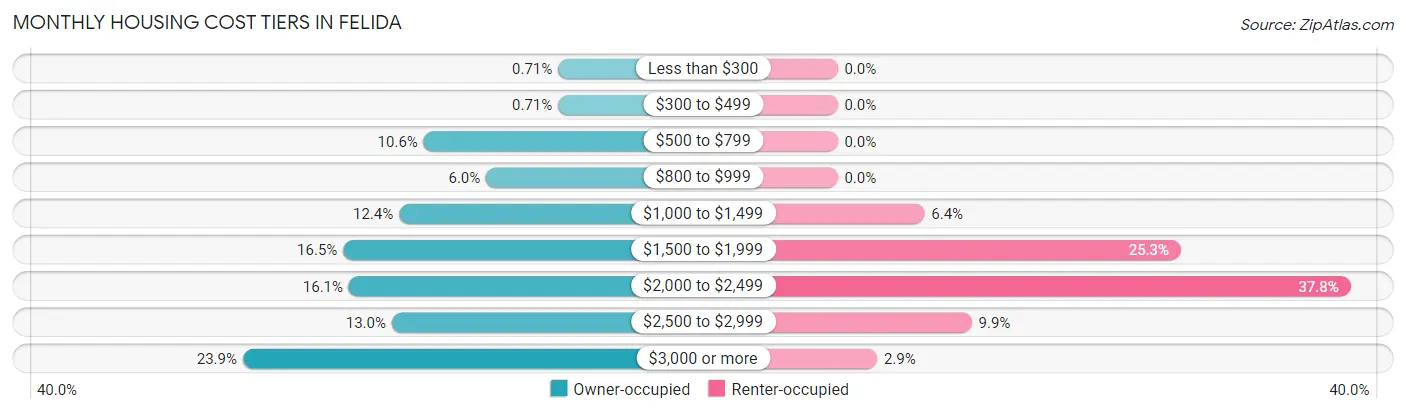
| Monthly Cost | Owner-occupied | Renter-occupied |
| Less than $300 | 25 (0.7%) | 0 (0.0%) |
| $300 to $499 | 25 (0.7%) | 0 (0.0%) |
| $500 to $799 | 376 (10.6%) | 0 (0.0%) |
| $800 to $999 | 213 (6.0%) | 0 (0.0%) |
| $1,000 to $1,499 | 440 (12.4%) | 22 (6.4%) |
| $1,500 to $1,999 | 586 (16.5%) | 87 (25.3%) |
| $2,000 to $2,499 | 571 (16.1%) | 130 (37.8%) |
| $2,500 to $2,999 | 459 (13.0%) | 34 (9.9%) |
| $3,000 or more | 848 (23.9%) | 10 (2.9%) |
| Total | 3,543 (100.0%) | 344 (100.0%) |
Physical Housing Characteristics in Felida
Housing Structures in Felida
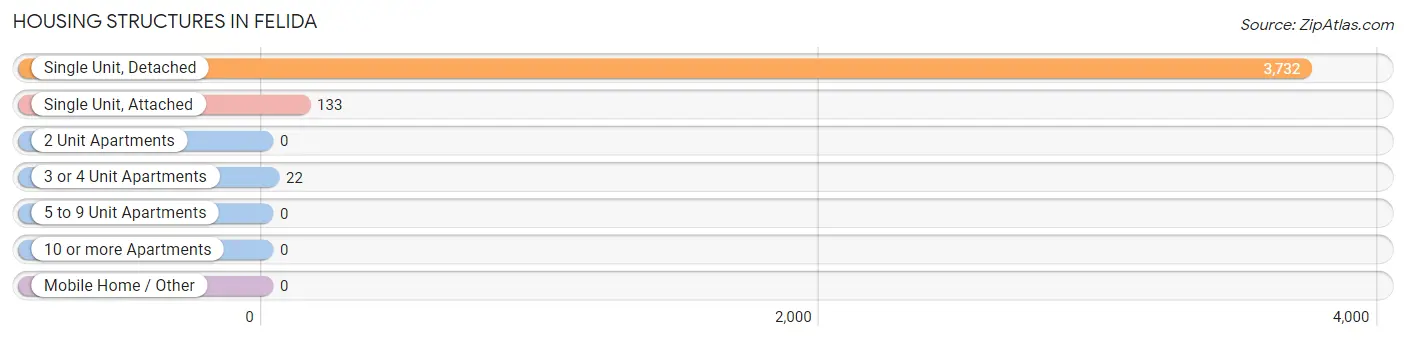
| Structure Type | # Housing Units | % Housing Units |
| Single Unit, Detached | 3,732 | 96.0% |
| Single Unit, Attached | 133 | 3.4% |
| 2 Unit Apartments | 0 | 0.0% |
| 3 or 4 Unit Apartments | 22 | 0.6% |
| 5 to 9 Unit Apartments | 0 | 0.0% |
| 10 or more Apartments | 0 | 0.0% |
| Mobile Home / Other | 0 | 0.0% |
| Total | 3,887 | 100.0% |
Housing Structures by Occupancy in Felida
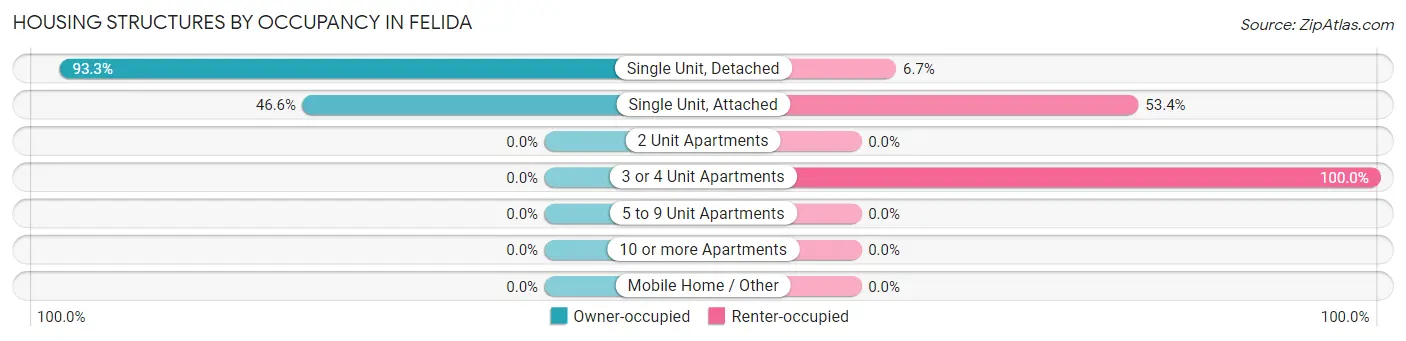
| Structure Type | Owner-occupied | Renter-occupied |
| Single Unit, Detached | 3,481 (93.3%) | 251 (6.7%) |
| Single Unit, Attached | 62 (46.6%) | 71 (53.4%) |
| 2 Unit Apartments | 0 (0.0%) | 0 (0.0%) |
| 3 or 4 Unit Apartments | 0 (0.0%) | 22 (100.0%) |
| 5 to 9 Unit Apartments | 0 (0.0%) | 0 (0.0%) |
| 10 or more Apartments | 0 (0.0%) | 0 (0.0%) |
| Mobile Home / Other | 0 (0.0%) | 0 (0.0%) |
| Total | 3,543 (91.1%) | 344 (8.8%) |
Housing Structures by Number of Rooms in Felida
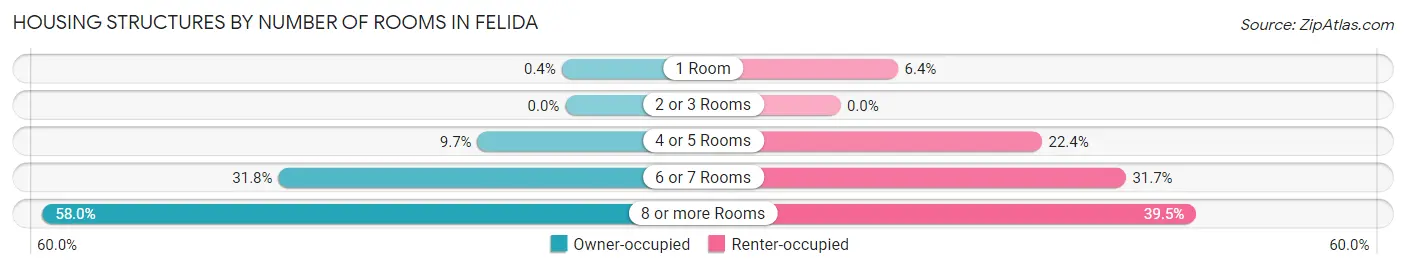
| Number of Rooms | Owner-occupied | Renter-occupied |
| 1 Room | 14 (0.4%) | 22 (6.4%) |
| 2 or 3 Rooms | 0 (0.0%) | 0 (0.0%) |
| 4 or 5 Rooms | 345 (9.7%) | 77 (22.4%) |
| 6 or 7 Rooms | 1,128 (31.8%) | 109 (31.7%) |
| 8 or more Rooms | 2,056 (58.0%) | 136 (39.5%) |
| Total | 3,543 (100.0%) | 344 (100.0%) |
Housing Structure by Heating Type in Felida
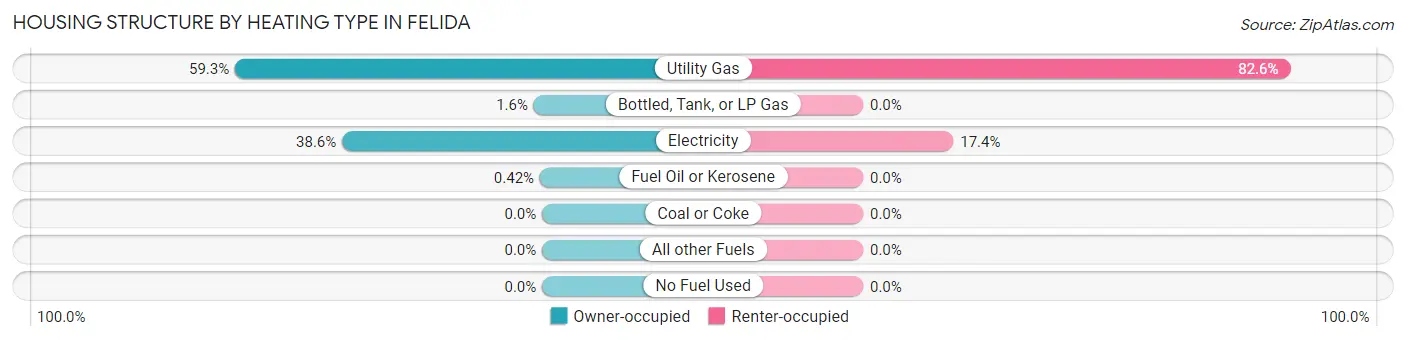
| Heating Type | Owner-occupied | Renter-occupied |
| Utility Gas | 2,102 (59.3%) | 284 (82.6%) |
| Bottled, Tank, or LP Gas | 57 (1.6%) | 0 (0.0%) |
| Electricity | 1,369 (38.6%) | 60 (17.4%) |
| Fuel Oil or Kerosene | 15 (0.4%) | 0 (0.0%) |
| Coal or Coke | 0 (0.0%) | 0 (0.0%) |
| All other Fuels | 0 (0.0%) | 0 (0.0%) |
| No Fuel Used | 0 (0.0%) | 0 (0.0%) |
| Total | 3,543 (100.0%) | 344 (100.0%) |
Household Vehicle Usage in Felida
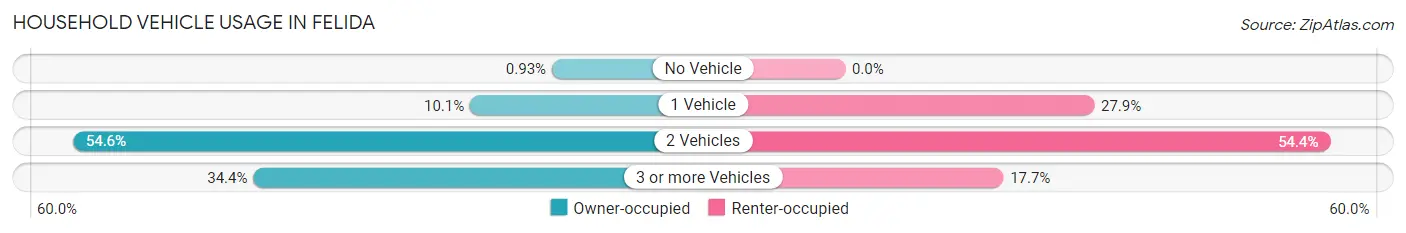
| Vehicles per Household | Owner-occupied | Renter-occupied |
| No Vehicle | 33 (0.9%) | 0 (0.0%) |
| 1 Vehicle | 358 (10.1%) | 96 (27.9%) |
| 2 Vehicles | 1,934 (54.6%) | 187 (54.4%) |
| 3 or more Vehicles | 1,218 (34.4%) | 61 (17.7%) |
| Total | 3,543 (100.0%) | 344 (100.0%) |
Real Estate & Mortgages in Felida
Real Estate and Mortgage Overview in Felida
| Characteristic | Without Mortgage | With Mortgage |
| Housing Units | 842 | 2,701 |
| Median Property Value | $611,000 | $601,700 |
| Median Household Income | $125,500 | $1,418 |
| Monthly Housing Costs | $803 | $848 |
| Real Estate Taxes | $5,850 | $0 |
Property Value by Mortgage Status in Felida
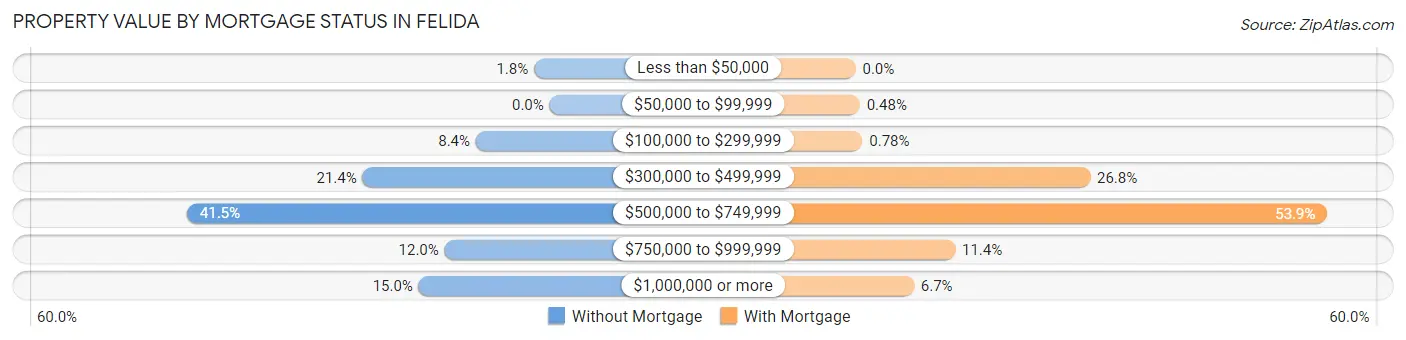
| Property Value | Without Mortgage | With Mortgage |
| Less than $50,000 | 15 (1.8%) | 0 (0.0%) |
| $50,000 to $99,999 | 0 (0.0%) | 13 (0.5%) |
| $100,000 to $299,999 | 71 (8.4%) | 21 (0.8%) |
| $300,000 to $499,999 | 180 (21.4%) | 724 (26.8%) |
| $500,000 to $749,999 | 349 (41.4%) | 1,456 (53.9%) |
| $750,000 to $999,999 | 101 (12.0%) | 307 (11.4%) |
| $1,000,000 or more | 126 (15.0%) | 180 (6.7%) |
| Total | 842 (100.0%) | 2,701 (100.0%) |
Household Income by Mortgage Status in Felida
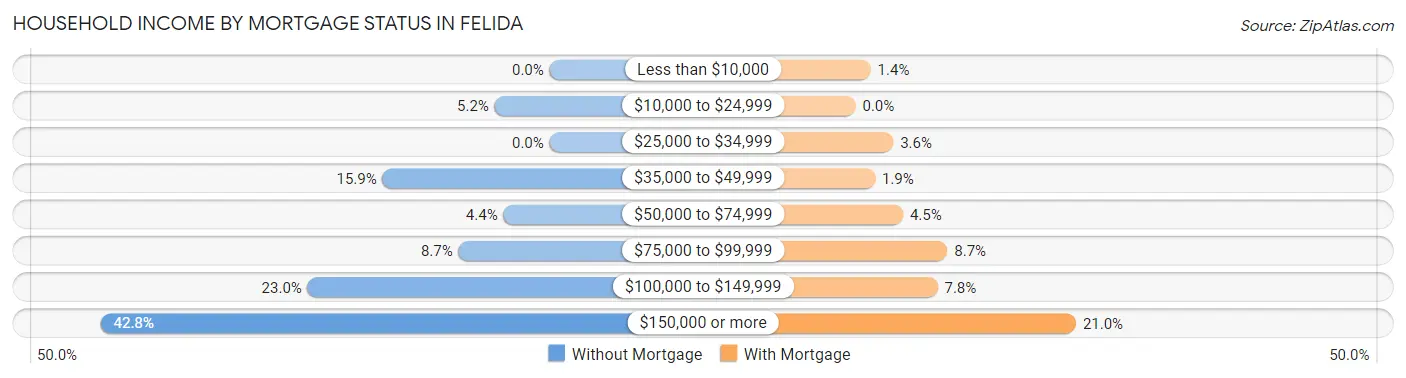
| Household Income | Without Mortgage | With Mortgage |
| Less than $10,000 | 0 (0.0%) | 39 (1.4%) |
| $10,000 to $24,999 | 44 (5.2%) | 0 (0.0%) |
| $25,000 to $34,999 | 0 (0.0%) | 97 (3.6%) |
| $35,000 to $49,999 | 134 (15.9%) | 50 (1.8%) |
| $50,000 to $74,999 | 37 (4.4%) | 122 (4.5%) |
| $75,000 to $99,999 | 73 (8.7%) | 236 (8.7%) |
| $100,000 to $149,999 | 194 (23.0%) | 211 (7.8%) |
| $150,000 or more | 360 (42.8%) | 567 (21.0%) |
| Total | 842 (100.0%) | 2,701 (100.0%) |
Property Value to Household Income Ratio in Felida
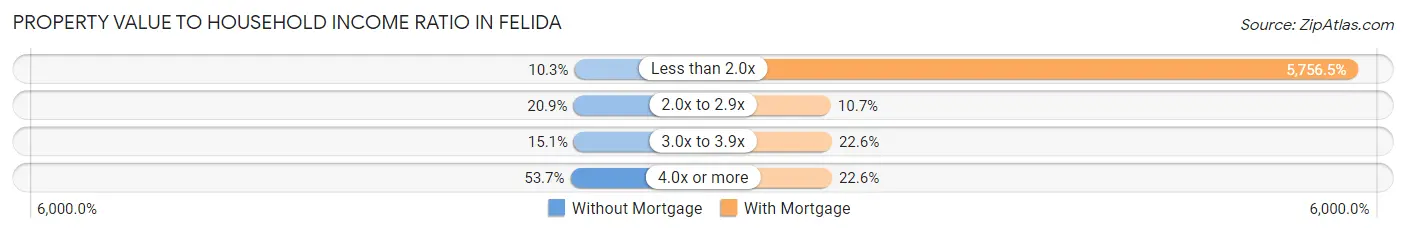
| Value-to-Income Ratio | Without Mortgage | With Mortgage |
| Less than 2.0x | 87 (10.3%) | 155,483 (5,756.5%) |
| 2.0x to 2.9x | 176 (20.9%) | 290 (10.7%) |
| 3.0x to 3.9x | 127 (15.1%) | 610 (22.6%) |
| 4.0x or more | 452 (53.7%) | 610 (22.6%) |
| Total | 842 (100.0%) | 2,701 (100.0%) |
Real Estate Taxes by Mortgage Status in Felida
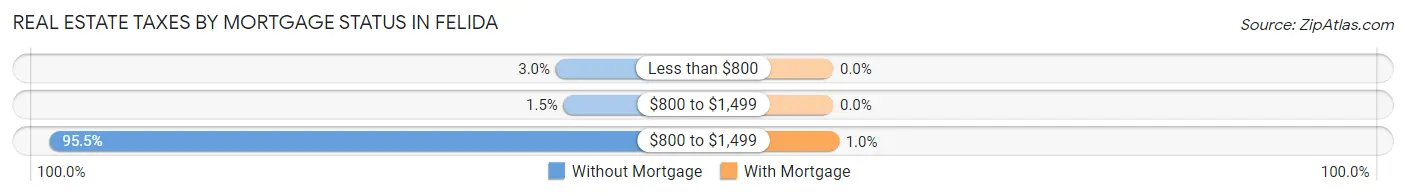
| Property Taxes | Without Mortgage | With Mortgage |
| Less than $800 | 25 (3.0%) | 0 (0.0%) |
| $800 to $1,499 | 13 (1.5%) | 0 (0.0%) |
| $800 to $1,499 | 804 (95.5%) | 28 (1.0%) |
| Total | 842 (100.0%) | 2,701 (100.0%) |
Health & Disability in Felida
Health Insurance Coverage by Age in Felida
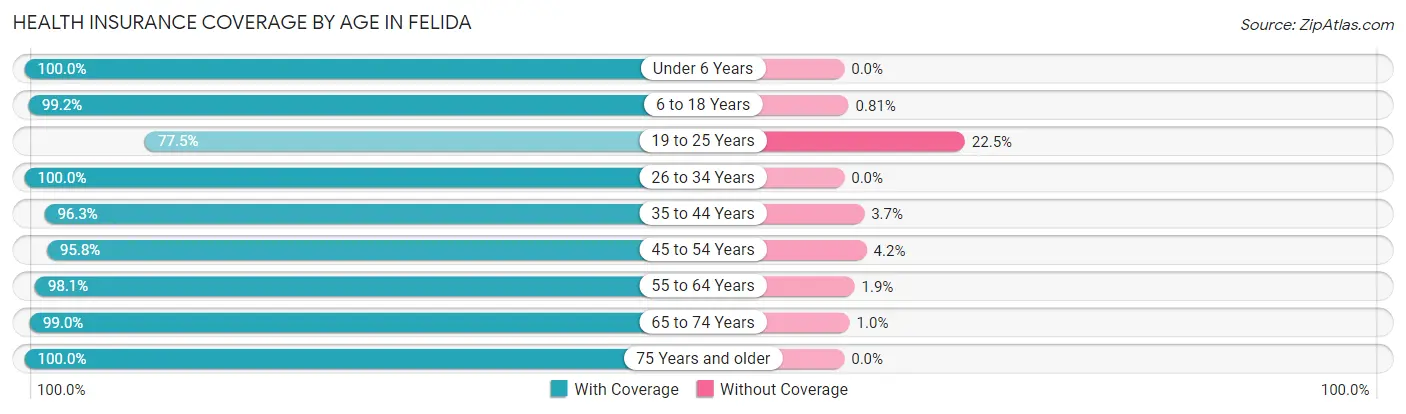
| Age Bracket | With Coverage | Without Coverage |
| Under 6 Years | 737 (100.0%) | 0 (0.0%) |
| 6 to 18 Years | 1,958 (99.2%) | 16 (0.8%) |
| 19 to 25 Years | 386 (77.5%) | 112 (22.5%) |
| 26 to 34 Years | 596 (100.0%) | 0 (0.0%) |
| 35 to 44 Years | 1,195 (96.3%) | 46 (3.7%) |
| 45 to 54 Years | 1,539 (95.8%) | 67 (4.2%) |
| 55 to 64 Years | 1,988 (98.1%) | 39 (1.9%) |
| 65 to 74 Years | 1,184 (99.0%) | 12 (1.0%) |
| 75 Years and older | 624 (100.0%) | 0 (0.0%) |
| Total | 10,207 (97.2%) | 292 (2.8%) |
Health Insurance Coverage by Citizenship Status in Felida
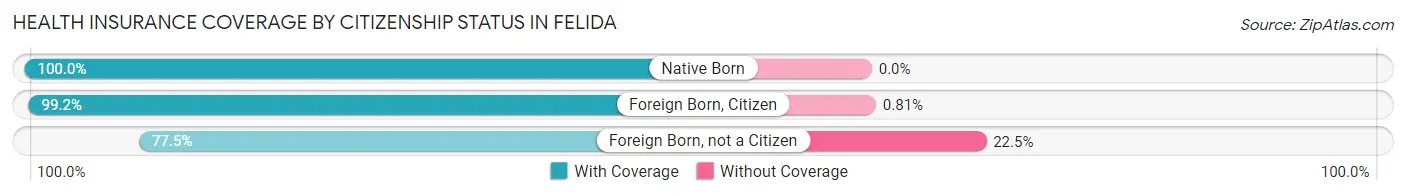
| Citizenship Status | With Coverage | Without Coverage |
| Native Born | 737 (100.0%) | 0 (0.0%) |
| Foreign Born, Citizen | 1,958 (99.2%) | 16 (0.8%) |
| Foreign Born, not a Citizen | 386 (77.5%) | 112 (22.5%) |
Health Insurance Coverage by Household Income in Felida
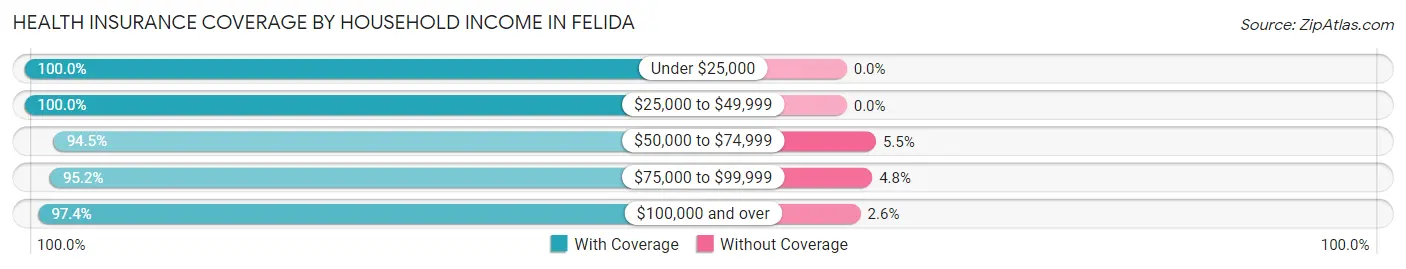
| Household Income | With Coverage | Without Coverage |
| Under $25,000 | 159 (100.0%) | 0 (0.0%) |
| $25,000 to $49,999 | 704 (100.0%) | 0 (0.0%) |
| $50,000 to $74,999 | 518 (94.5%) | 30 (5.5%) |
| $75,000 to $99,999 | 1,160 (95.2%) | 58 (4.8%) |
| $100,000 and over | 7,646 (97.4%) | 204 (2.6%) |
Public vs Private Health Insurance Coverage by Age in Felida
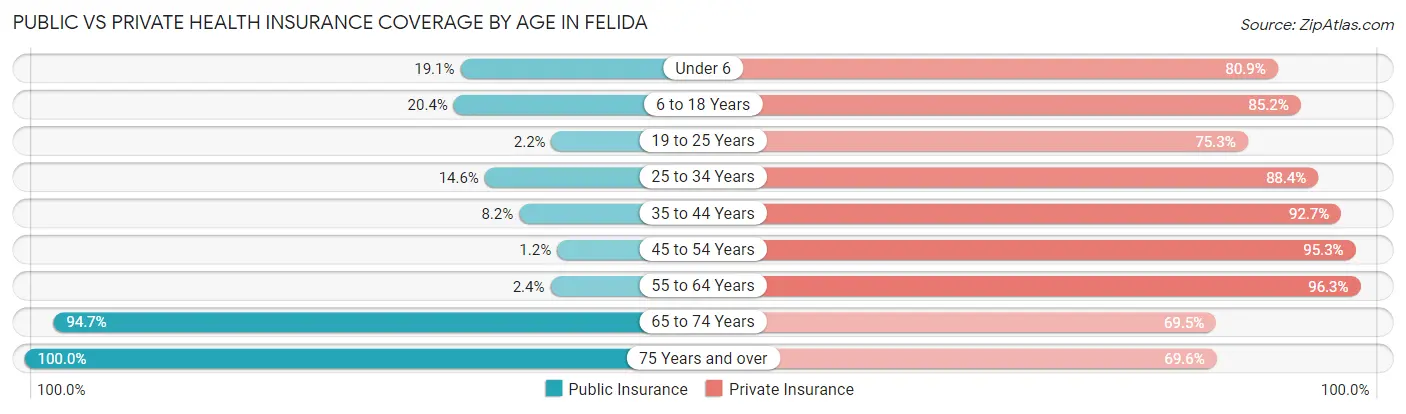
| Age Bracket | Public Insurance | Private Insurance |
| Under 6 | 141 (19.1%) | 596 (80.9%) |
| 6 to 18 Years | 402 (20.4%) | 1,681 (85.2%) |
| 19 to 25 Years | 11 (2.2%) | 375 (75.3%) |
| 25 to 34 Years | 87 (14.6%) | 527 (88.4%) |
| 35 to 44 Years | 102 (8.2%) | 1,150 (92.7%) |
| 45 to 54 Years | 19 (1.2%) | 1,531 (95.3%) |
| 55 to 64 Years | 49 (2.4%) | 1,951 (96.3%) |
| 65 to 74 Years | 1,132 (94.7%) | 831 (69.5%) |
| 75 Years and over | 624 (100.0%) | 434 (69.6%) |
| Total | 2,567 (24.4%) | 9,076 (86.5%) |
Disability Status by Sex by Age in Felida
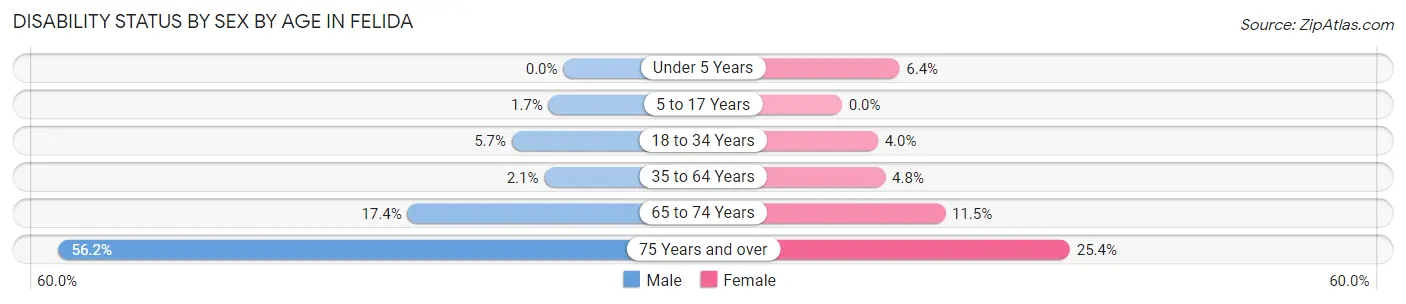
| Age Bracket | Male | Female |
| Under 5 Years | 0 (0.0%) | 10 (6.4%) |
| 5 to 17 Years | 20 (1.7%) | 0 (0.0%) |
| 18 to 34 Years | 28 (5.7%) | 25 (4.0%) |
| 35 to 64 Years | 51 (2.1%) | 119 (4.8%) |
| 65 to 74 Years | 108 (17.4%) | 66 (11.5%) |
| 75 Years and over | 136 (56.2%) | 97 (25.4%) |
Disability Class by Sex by Age in Felida
Disability Class: Hearing Difficulty
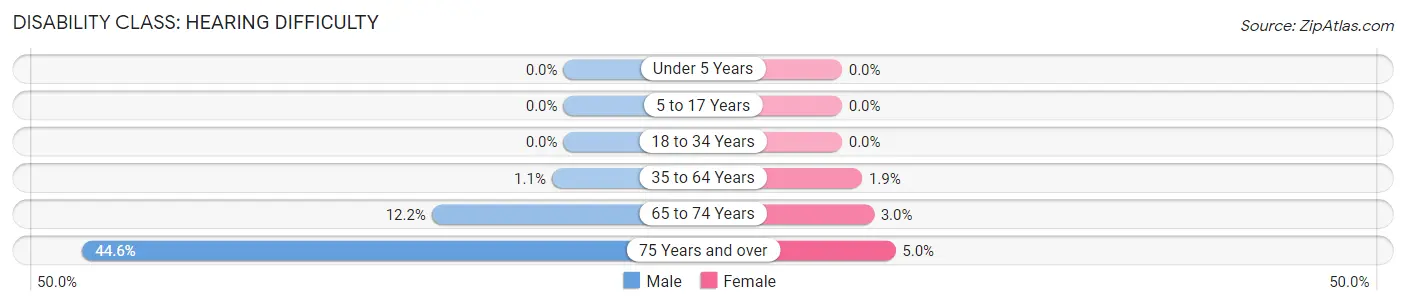
| Age Bracket | Male | Female |
| Under 5 Years | 0 (0.0%) | 0 (0.0%) |
| 5 to 17 Years | 0 (0.0%) | 0 (0.0%) |
| 18 to 34 Years | 0 (0.0%) | 0 (0.0%) |
| 35 to 64 Years | 26 (1.1%) | 46 (1.9%) |
| 65 to 74 Years | 76 (12.2%) | 17 (3.0%) |
| 75 Years and over | 108 (44.6%) | 19 (5.0%) |
Disability Class: Vision Difficulty
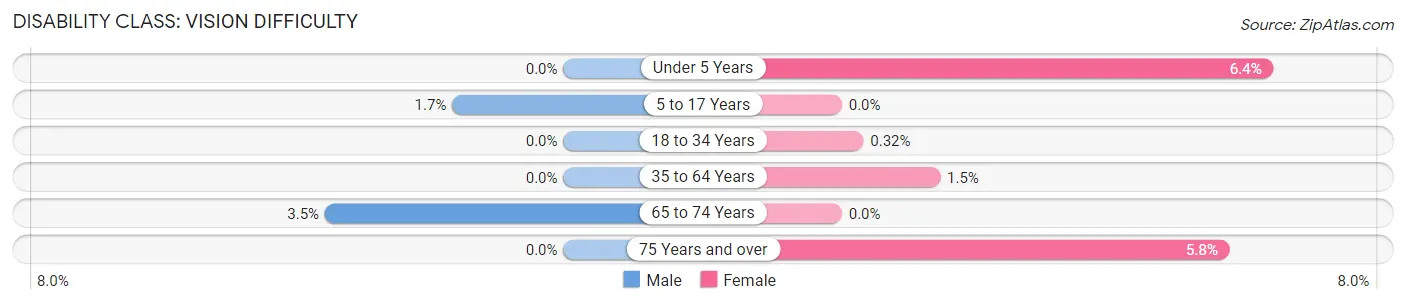
| Age Bracket | Male | Female |
| Under 5 Years | 0 (0.0%) | 10 (6.4%) |
| 5 to 17 Years | 20 (1.7%) | 0 (0.0%) |
| 18 to 34 Years | 0 (0.0%) | 2 (0.3%) |
| 35 to 64 Years | 0 (0.0%) | 36 (1.5%) |
| 65 to 74 Years | 22 (3.5%) | 0 (0.0%) |
| 75 Years and over | 0 (0.0%) | 22 (5.8%) |
Disability Class: Cognitive Difficulty
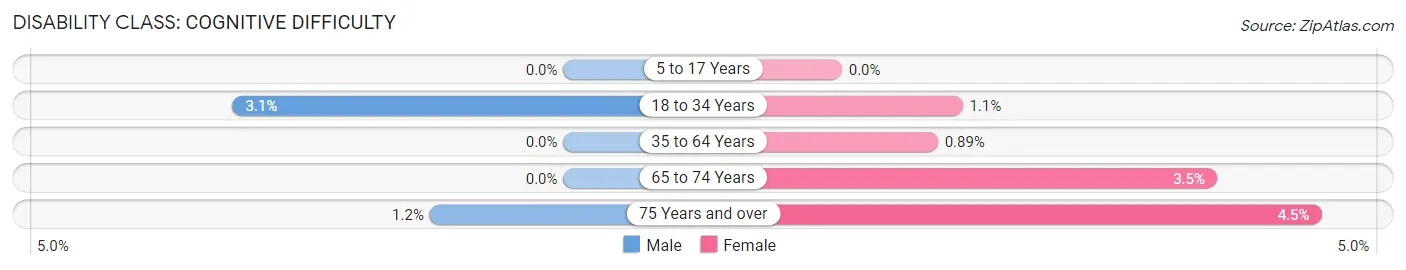
| Age Bracket | Male | Female |
| 5 to 17 Years | 0 (0.0%) | 0 (0.0%) |
| 18 to 34 Years | 15 (3.1%) | 7 (1.1%) |
| 35 to 64 Years | 0 (0.0%) | 22 (0.9%) |
| 65 to 74 Years | 0 (0.0%) | 20 (3.5%) |
| 75 Years and over | 3 (1.2%) | 17 (4.4%) |
Disability Class: Ambulatory Difficulty
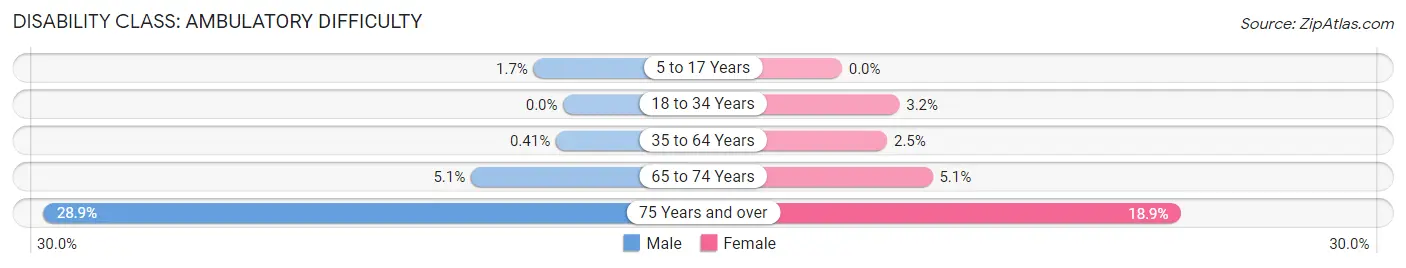
| Age Bracket | Male | Female |
| 5 to 17 Years | 20 (1.7%) | 0 (0.0%) |
| 18 to 34 Years | 0 (0.0%) | 20 (3.2%) |
| 35 to 64 Years | 10 (0.4%) | 62 (2.5%) |
| 65 to 74 Years | 32 (5.1%) | 29 (5.1%) |
| 75 Years and over | 70 (28.9%) | 72 (18.9%) |
Disability Class: Self-Care Difficulty
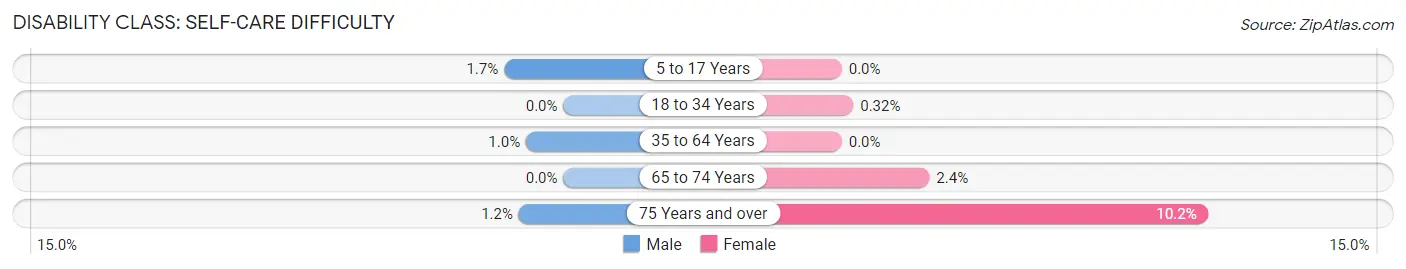
| Age Bracket | Male | Female |
| 5 to 17 Years | 20 (1.7%) | 0 (0.0%) |
| 18 to 34 Years | 0 (0.0%) | 2 (0.3%) |
| 35 to 64 Years | 25 (1.0%) | 0 (0.0%) |
| 65 to 74 Years | 0 (0.0%) | 14 (2.4%) |
| 75 Years and over | 3 (1.2%) | 39 (10.2%) |
Technology Access in Felida
Computing Device Access in Felida
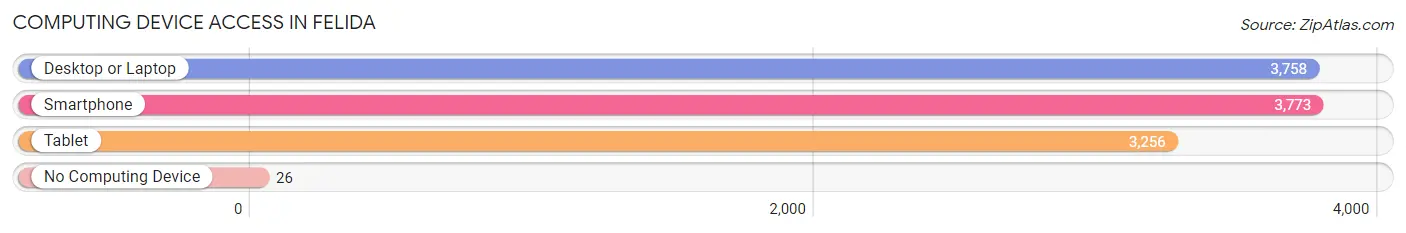
| Device Type | # Households | % Households |
| Desktop or Laptop | 3,758 | 96.7% |
| Smartphone | 3,773 | 97.1% |
| Tablet | 3,256 | 83.8% |
| No Computing Device | 26 | 0.7% |
| Total | 3,887 | 100.0% |
Internet Access in Felida
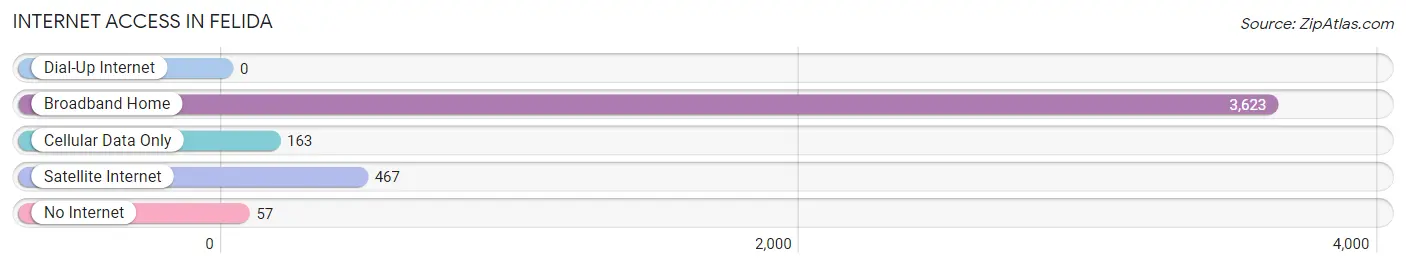
| Internet Type | # Households | % Households |
| Dial-Up Internet | 0 | 0.0% |
| Broadband Home | 3,623 | 93.2% |
| Cellular Data Only | 163 | 4.2% |
| Satellite Internet | 467 | 12.0% |
| No Internet | 57 | 1.5% |
| Total | 3,887 | 100.0% |
Felida Summary
Felida is a small unincorporated community located in Clark County, Washington, United States. It is situated on the north bank of the Salmon Creek, a tributary of the Columbia River. The community is located approximately 10 miles north of Vancouver, Washington and is part of the Portland-Vancouver metropolitan area.
History
The area that is now known as Felida was first settled in the late 1800s by homesteaders. The community was originally known as “Fisher’s Landing”, named after the first settler, John Fisher. In the early 1900s, the area was renamed “Felida”, which is derived from the Latin word for “happy”.
The community was primarily an agricultural area, with many of the residents growing vegetables, fruits, and grains. In the early 1900s, the area was also home to a sawmill and a brickyard.
In the 1950s, the area began to experience rapid growth as the population of Vancouver and the surrounding area increased. This growth was fueled by the construction of Interstate 5, which runs through the community.
Geography
Felida is located in Clark County, Washington, approximately 10 miles north of Vancouver. The community is situated on the north bank of the Salmon Creek, a tributary of the Columbia River. The area is mostly flat, with an elevation of approximately 200 feet.
The climate in Felida is mild and temperate, with an average annual temperature of 54 degrees Fahrenheit. The area receives an average of 37 inches of precipitation per year, with most of it falling in the winter months.
Economy
The economy of Felida is primarily based on agriculture and services. The area is home to several small farms, which produce a variety of fruits, vegetables, and grains. There are also several small businesses in the area, including restaurants, retail stores, and auto repair shops.
The area is also home to several large employers, including the Vancouver School District, Clark County Public Works, and the Port of Vancouver.
Demographics
As of the 2010 census, the population of Felida was 4,845. The racial makeup of the community was 87.3% White, 4.2% Hispanic or Latino, 2.2% Asian, and 1.2% African American. The median household income was $60,945, and the median age was 39.
Conclusion
Felida is a small unincorporated community located in Clark County, Washington. The area was first settled in the late 1800s and was originally known as “Fisher’s Landing”. The economy of Felida is primarily based on agriculture and services, and the area is home to several large employers. As of the 2010 census, the population of Felida was 4,845.
Common Questions
What is Per Capita Income in Felida?
Per Capita income in Felida is $72,889.
What is the Median Family Income in Felida?
Median Family Income in Felida is $145,682.
What is the Median Household income in Felida?
Median Household Income in Felida is $148,625.
What is Income or Wage Gap in Felida?
Income or Wage Gap in Felida is 52.2%.
Women in Felida earn 47.8 cents for every dollar earned by a man.
What is Inequality or Gini Index in Felida?
Inequality or Gini Index in Felida is 0.45.
What is the Total Population of Felida?
Total Population of Felida is 10,520.
What is the Total Male Population of Felida?
Total Male Population of Felida is 5,412.
What is the Total Female Population of Felida?
Total Female Population of Felida is 5,108.
What is the Ratio of Males per 100 Females in Felida?
There are 105.95 Males per 100 Females in Felida.
What is the Ratio of Females per 100 Males in Felida?
There are 94.38 Females per 100 Males in Felida.
What is the Median Population Age in Felida?
Median Population Age in Felida is 45.9 Years.
What is the Average Family Size in Felida
Average Family Size in Felida is 3.0 People.
What is the Average Household Size in Felida
Average Household Size in Felida is 2.7 People.
How Large is the Labor Force in Felida?
There are 5,665 People in the Labor Forcein in Felida.
What is the Percentage of People in the Labor Force in Felida?
68.6% of People are in the Labor Force in Felida.
What is the Unemployment Rate in Felida?
Unemployment Rate in Felida is 5.3%.