Suquamish, WA Map & Demographics
Suquamish Map
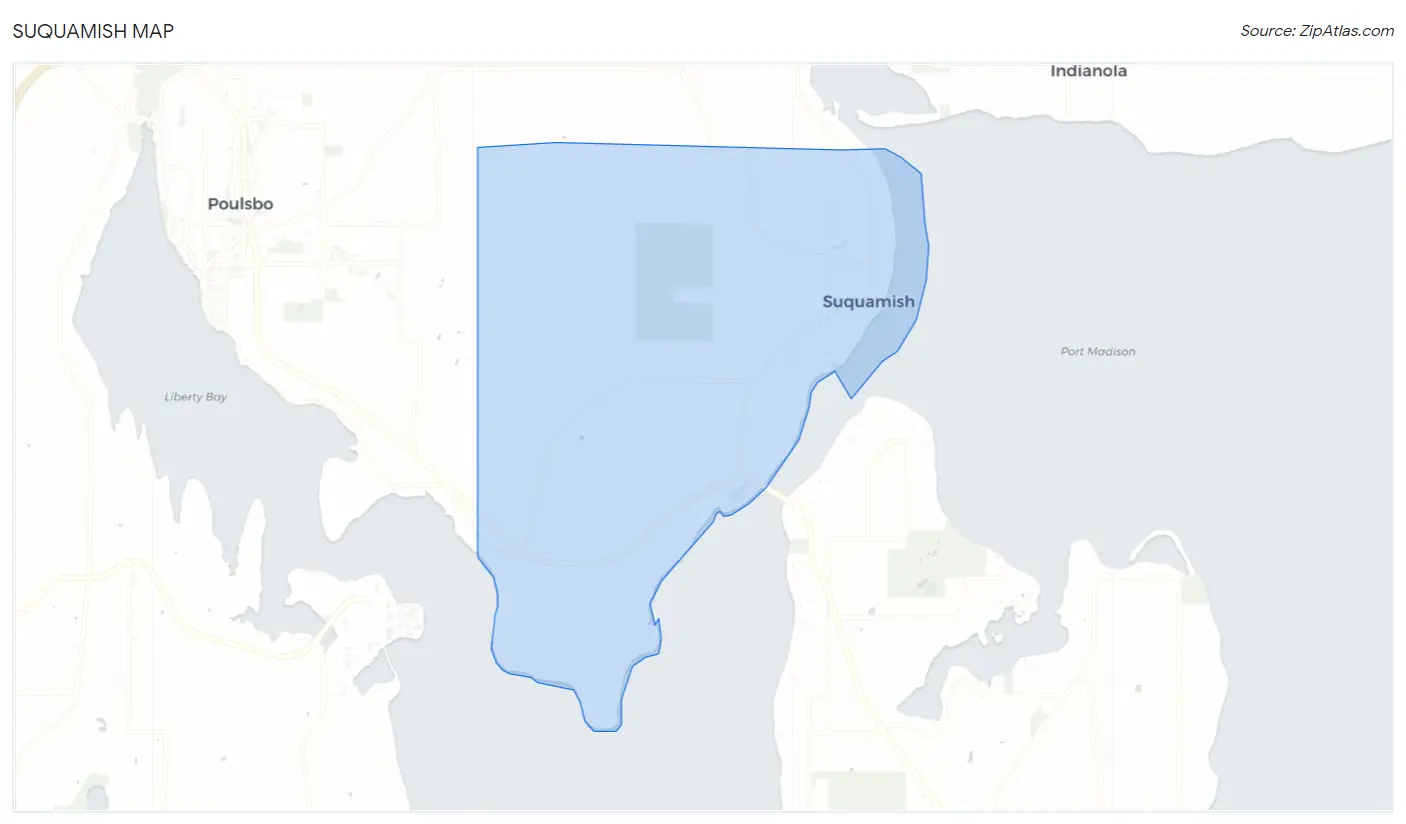
Suquamish Overview
$42,872
PER CAPITA INCOME
$94,955
AVG FAMILY INCOME
$80,216
AVG HOUSEHOLD INCOME
27.6%
WAGE / INCOME GAP [ % ]
72.4¢/ $1
WAGE / INCOME GAP [ $ ]
0.41
INEQUALITY / GINI INDEX
4,329
TOTAL POPULATION
2,159
MALE POPULATION
2,170
FEMALE POPULATION
99.49
MALES / 100 FEMALES
100.51
FEMALES / 100 MALES
46.1
MEDIAN AGE
2.9
AVG FAMILY SIZE
2.4
AVG HOUSEHOLD SIZE
2,203
LABOR FORCE [ PEOPLE ]
60.4%
PERCENT IN LABOR FORCE
5.8%
UNEMPLOYMENT RATE
Suquamish Zip Codes
Income in Suquamish
Income Overview in Suquamish
Per Capita Income in Suquamish is $42,872, while median incomes of families and households are $94,955 and $80,216 respectively.
| Characteristic | Number | Measure |
| Per Capita Income | 4,329 | $42,872 |
| Median Family Income | 1,141 | $94,955 |
| Mean Family Income | 1,141 | $114,540 |
| Median Household Income | 1,835 | $80,216 |
| Mean Household Income | 1,835 | $98,974 |
| Income Deficit | 1,141 | $0 |
| Wage / Income Gap (%) | 4,329 | 27.57% |
| Wage / Income Gap ($) | 4,329 | 72.43¢ per $1 |
| Gini / Inequality Index | 4,329 | 0.41 |
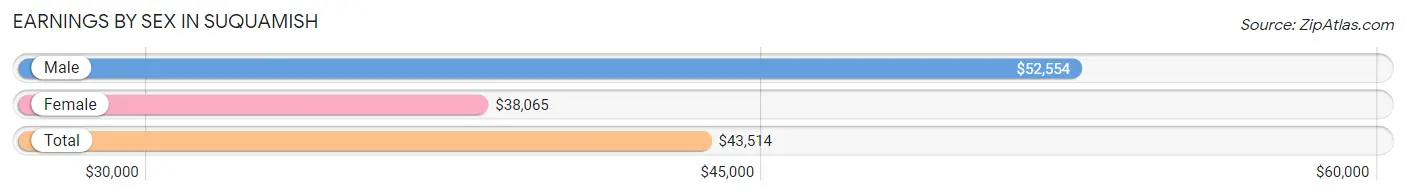
Earnings by Sex in Suquamish
Average Earnings in Suquamish are $43,514, $52,554 for men and $38,065 for women, a difference of 27.6%.
| Sex | Number | Average Earnings |
| Male | 1,155 (50.1%) | $52,554 |
| Female | 1,150 (49.9%) | $38,065 |
| Total | 2,305 (100.0%) | $43,514 |
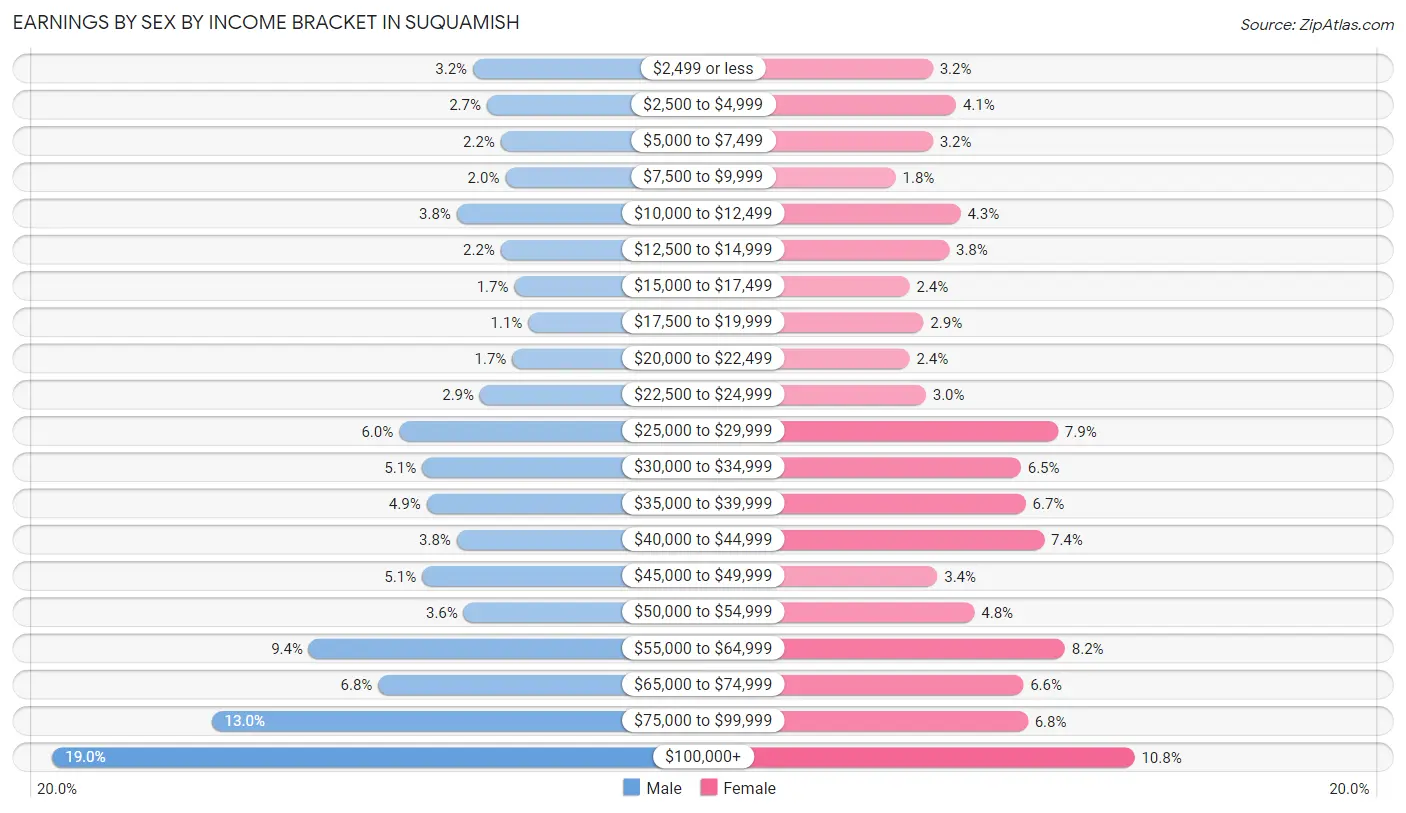
Earnings by Sex by Income Bracket in Suquamish
The most common earnings brackets in Suquamish are $100,000+ for men (219 | 19.0%) and $100,000+ for women (124 | 10.8%).
| Income | Male | Female |
| $2,499 or less | 37 (3.2%) | 37 (3.2%) |
| $2,500 to $4,999 | 31 (2.7%) | 47 (4.1%) |
| $5,000 to $7,499 | 25 (2.2%) | 37 (3.2%) |
| $7,500 to $9,999 | 23 (2.0%) | 21 (1.8%) |
| $10,000 to $12,499 | 44 (3.8%) | 49 (4.3%) |
| $12,500 to $14,999 | 25 (2.2%) | 44 (3.8%) |
| $15,000 to $17,499 | 19 (1.7%) | 27 (2.4%) |
| $17,500 to $19,999 | 13 (1.1%) | 33 (2.9%) |
| $20,000 to $22,499 | 20 (1.7%) | 27 (2.4%) |
| $22,500 to $24,999 | 34 (2.9%) | 34 (3.0%) |
| $25,000 to $29,999 | 69 (6.0%) | 91 (7.9%) |
| $30,000 to $34,999 | 59 (5.1%) | 75 (6.5%) |
| $35,000 to $39,999 | 57 (4.9%) | 77 (6.7%) |
| $40,000 to $44,999 | 44 (3.8%) | 85 (7.4%) |
| $45,000 to $49,999 | 59 (5.1%) | 39 (3.4%) |
| $50,000 to $54,999 | 41 (3.5%) | 55 (4.8%) |
| $55,000 to $64,999 | 108 (9.3%) | 94 (8.2%) |
| $65,000 to $74,999 | 78 (6.8%) | 76 (6.6%) |
| $75,000 to $99,999 | 150 (13.0%) | 78 (6.8%) |
| $100,000+ | 219 (19.0%) | 124 (10.8%) |
| Total | 1,155 (100.0%) | 1,150 (100.0%) |
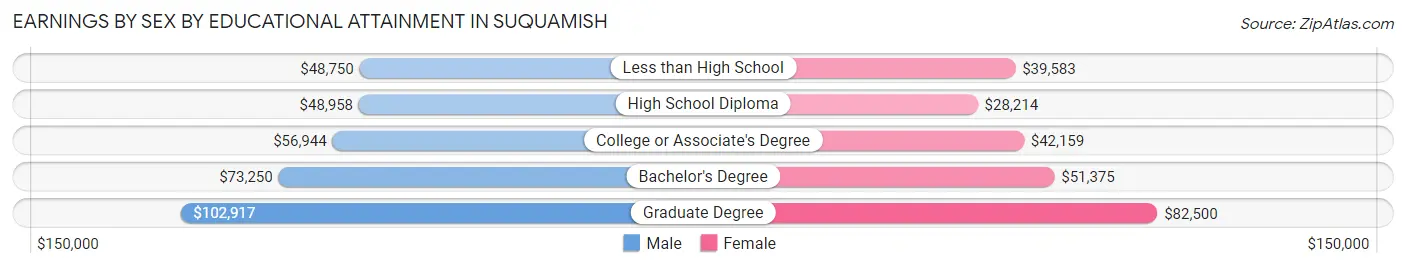
Earnings by Sex by Educational Attainment in Suquamish
Average earnings in Suquamish are $57,763 for men and $41,781 for women, a difference of 27.7%. Men with an educational attainment of graduate degree enjoy the highest average annual earnings of $102,917, while those with less than high school education earn the least with $48,750. Women with an educational attainment of graduate degree earn the most with the average annual earnings of $82,500, while those with high school diploma education have the smallest earnings of $28,214.
| Educational Attainment | Male Income | Female Income |
| Less than High School | $48,750 | $39,583 |
| High School Diploma | $48,958 | $28,214 |
| College or Associate's Degree | $56,944 | $42,159 |
| Bachelor's Degree | $73,250 | $51,375 |
| Graduate Degree | $102,917 | $82,500 |
| Total | $57,763 | $41,781 |
Family Income in Suquamish
Family Income Brackets in Suquamish
According to the Suquamish family income data, there are 272 families falling into the $100,000 to $149,999 income range, which is the most common income bracket and makes up 23.8% of all families. Conversely, the $10,000 to $14,999 income bracket is the least frequent group with only 15 families (1.3%) belonging to this category.
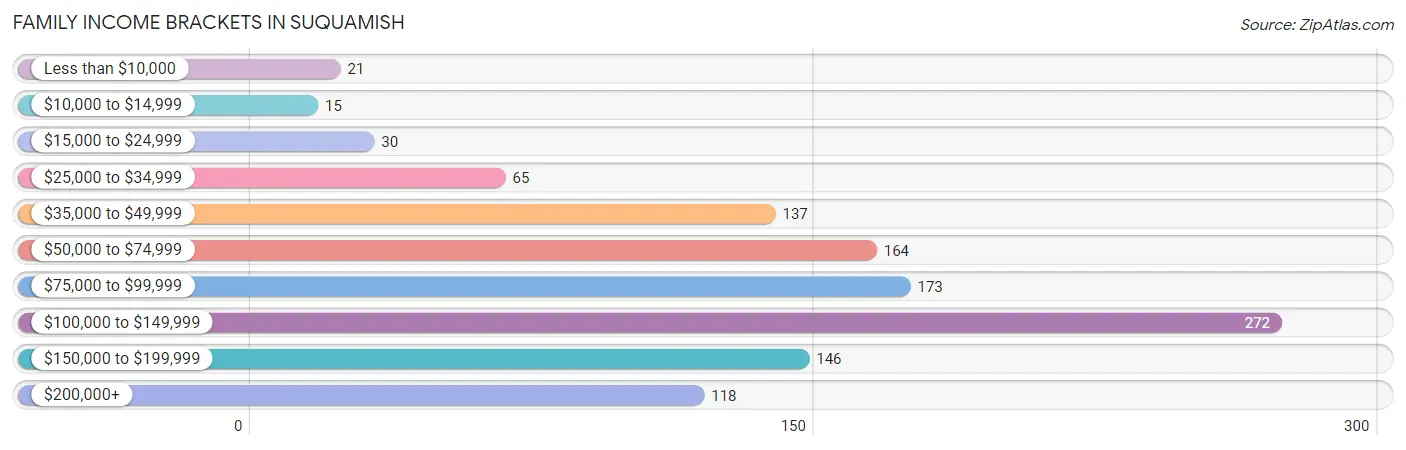
| Income Bracket | # Families | % Families |
| Less than $10,000 | 21 | 1.8% |
| $10,000 to $14,999 | 15 | 1.3% |
| $15,000 to $24,999 | 30 | 2.6% |
| $25,000 to $34,999 | 65 | 5.7% |
| $35,000 to $49,999 | 137 | 12.0% |
| $50,000 to $74,999 | 164 | 14.4% |
| $75,000 to $99,999 | 173 | 15.2% |
| $100,000 to $149,999 | 272 | 23.8% |
| $150,000 to $199,999 | 146 | 12.8% |
| $200,000+ | 118 | 10.3% |
Family Income by Famaliy Size in Suquamish
5-person families (68 | 6.0%) account for the highest median family income in Suquamish with $128,750 per family, while 2-person families (664 | 58.2%) have the highest median income of $43,424 per family member.
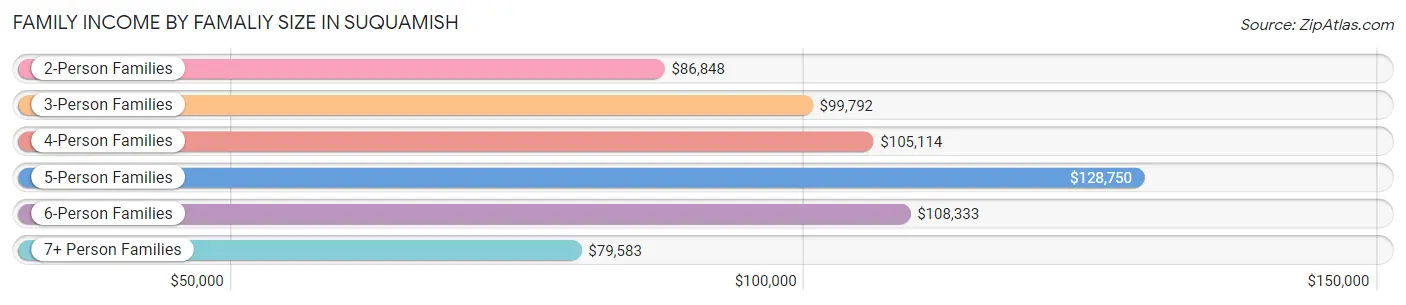
| Income Bracket | # Families | Median Income |
| 2-Person Families | 664 (58.2%) | $86,848 |
| 3-Person Families | 193 (16.9%) | $99,792 |
| 4-Person Families | 177 (15.5%) | $105,114 |
| 5-Person Families | 68 (6.0%) | $128,750 |
| 6-Person Families | 26 (2.3%) | $108,333 |
| 7+ Person Families | 13 (1.1%) | $79,583 |
| Total | 1,141 (100.0%) | $94,955 |
Family Income by Number of Earners in Suquamish
The median family income in Suquamish is $94,955, with families comprising 3+ earners (94) having the highest median family income of $150,500, while families with no earners (251) have the lowest median family income of $54,583, accounting for 8.2% and 22.0% of families, respectively.
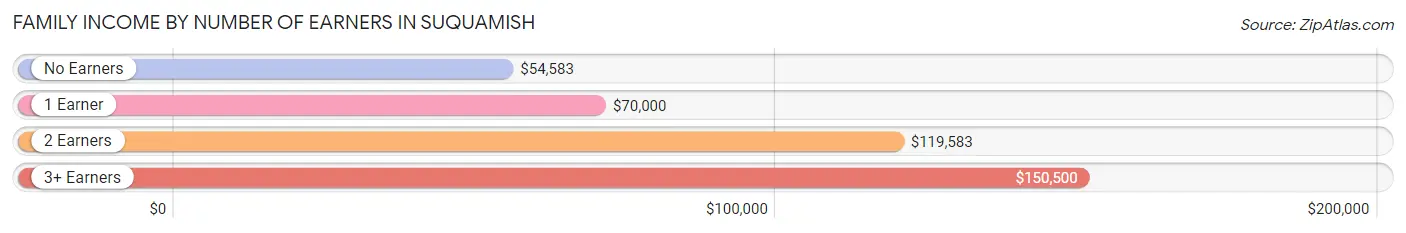
| Number of Earners | # Families | Median Income |
| No Earners | 251 (22.0%) | $54,583 |
| 1 Earner | 342 (30.0%) | $70,000 |
| 2 Earners | 454 (39.8%) | $119,583 |
| 3+ Earners | 94 (8.2%) | $150,500 |
| Total | 1,141 (100.0%) | $94,955 |
Household Income in Suquamish
Household Income Brackets in Suquamish
With 350 households falling in the category, the $100,000 to $149,999 income range is the most frequent in Suquamish, accounting for 19.1% of all households. In contrast, only 51 households (2.8%) fall into the less than $10,000 income bracket, making it the least populous group.
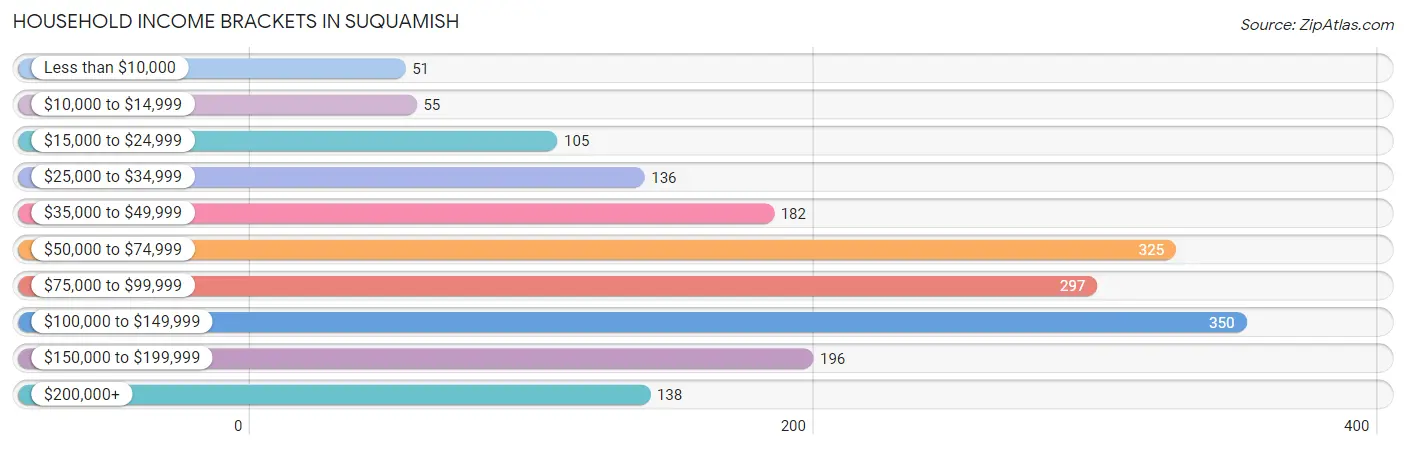
| Income Bracket | # Households | % Households |
| Less than $10,000 | 51 | 2.8% |
| $10,000 to $14,999 | 55 | 3.0% |
| $15,000 to $24,999 | 105 | 5.7% |
| $25,000 to $34,999 | 136 | 7.4% |
| $35,000 to $49,999 | 182 | 9.9% |
| $50,000 to $74,999 | 325 | 17.7% |
| $75,000 to $99,999 | 297 | 16.2% |
| $100,000 to $149,999 | 350 | 19.1% |
| $150,000 to $199,999 | 196 | 10.7% |
| $200,000+ | 138 | 7.5% |
Household Income by Householder Age in Suquamish
The median household income in Suquamish is $80,216, with the highest median household income of $89,722 found in the 25 to 44 years age bracket for the primary householder. A total of 436 households (23.8%) fall into this category. Meanwhile, the 15 to 24 years age bracket for the primary householder has the lowest median household income of $61,875, with 17 households (0.9%) in this group.
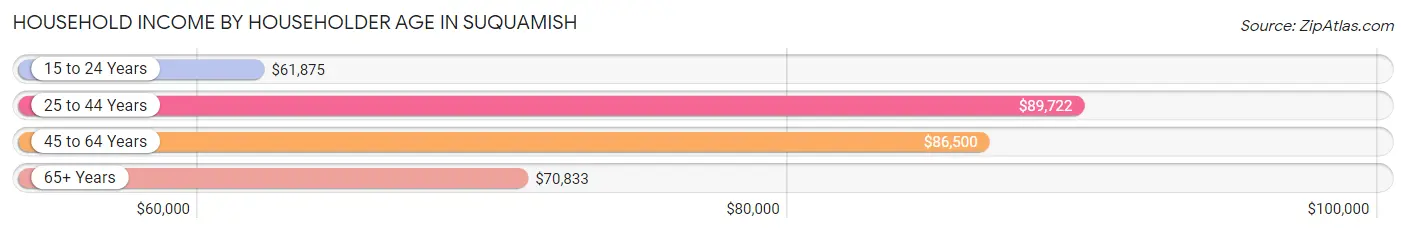
| Income Bracket | # Households | Median Income |
| 15 to 24 Years | 17 (0.9%) | $61,875 |
| 25 to 44 Years | 436 (23.8%) | $89,722 |
| 45 to 64 Years | 708 (38.6%) | $86,500 |
| 65+ Years | 674 (36.7%) | $70,833 |
| Total | 1,835 (100.0%) | $80,216 |
Poverty in Suquamish
Income Below Poverty by Sex and Age in Suquamish
With 7.8% poverty level for males and 9.7% for females among the residents of Suquamish, 16 and 17 year old males and 5 year old females are the most vulnerable to poverty, with 11 males (21.1%) and 6 females (30.0%) in their respective age groups living below the poverty level.
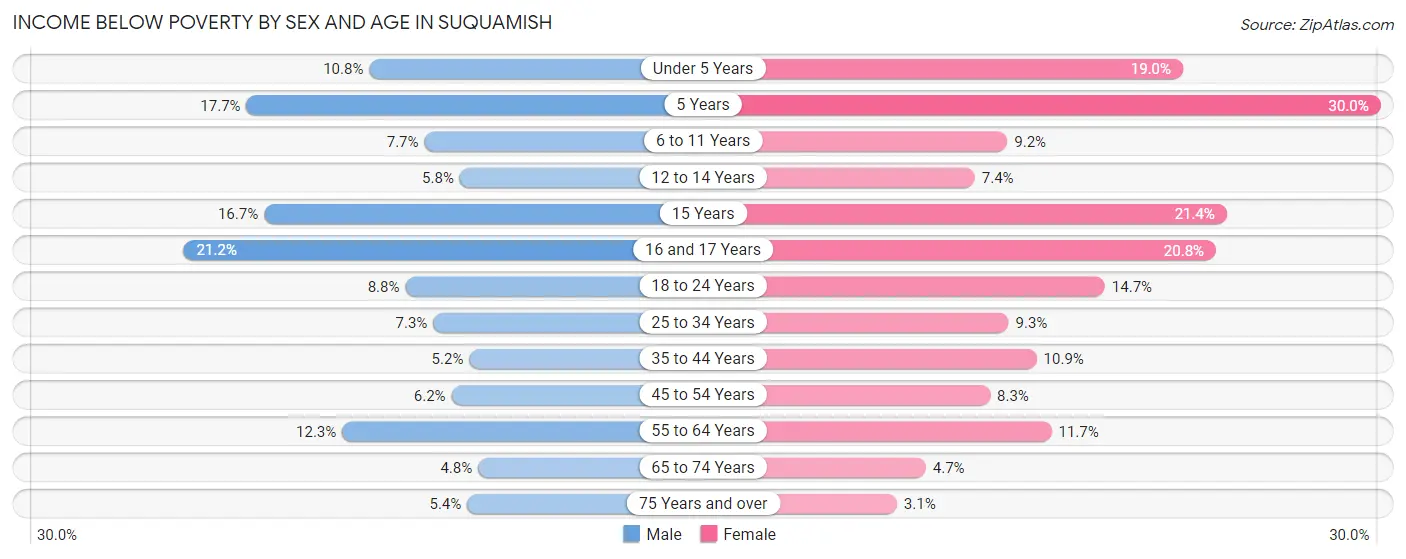
| Age Bracket | Male | Female |
| Under 5 Years | 8 (10.8%) | 15 (19.0%) |
| 5 Years | 3 (17.6%) | 6 (30.0%) |
| 6 to 11 Years | 13 (7.7%) | 13 (9.2%) |
| 12 to 14 Years | 3 (5.8%) | 4 (7.4%) |
| 15 Years | 5 (16.7%) | 3 (21.4%) |
| 16 and 17 Years | 11 (21.1%) | 5 (20.8%) |
| 18 to 24 Years | 11 (8.8%) | 23 (14.6%) |
| 25 to 34 Years | 20 (7.2%) | 25 (9.3%) |
| 35 to 44 Years | 14 (5.2%) | 28 (10.8%) |
| 45 to 54 Years | 18 (6.2%) | 20 (8.3%) |
| 55 to 64 Years | 35 (12.3%) | 46 (11.7%) |
| 65 to 74 Years | 16 (4.8%) | 16 (4.7%) |
| 75 Years and over | 9 (5.4%) | 5 (3.1%) |
| Total | 166 (7.8%) | 209 (9.7%) |
Income Above Poverty by Sex and Age in Suquamish
According to the poverty statistics in Suquamish, males aged 65 to 74 years and females aged 75 years and over are the age groups that are most secure financially, with 95.3% of males and 96.9% of females in these age groups living above the poverty line.
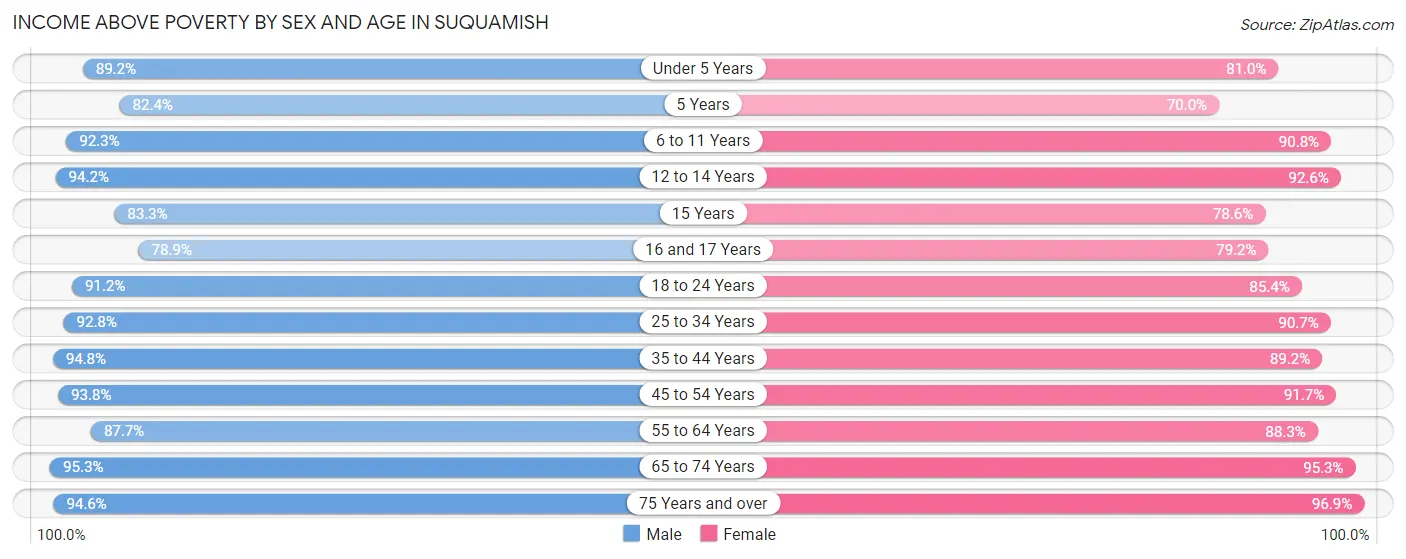
| Age Bracket | Male | Female |
| Under 5 Years | 66 (89.2%) | 64 (81.0%) |
| 5 Years | 14 (82.4%) | 14 (70.0%) |
| 6 to 11 Years | 155 (92.3%) | 128 (90.8%) |
| 12 to 14 Years | 49 (94.2%) | 50 (92.6%) |
| 15 Years | 25 (83.3%) | 11 (78.6%) |
| 16 and 17 Years | 41 (78.8%) | 19 (79.2%) |
| 18 to 24 Years | 114 (91.2%) | 134 (85.4%) |
| 25 to 34 Years | 256 (92.7%) | 244 (90.7%) |
| 35 to 44 Years | 253 (94.8%) | 230 (89.1%) |
| 45 to 54 Years | 271 (93.8%) | 222 (91.7%) |
| 55 to 64 Years | 249 (87.7%) | 348 (88.3%) |
| 65 to 74 Years | 321 (95.3%) | 326 (95.3%) |
| 75 Years and over | 159 (94.6%) | 158 (96.9%) |
| Total | 1,973 (92.2%) | 1,948 (90.3%) |
Income Below Poverty Among Married-Couple Families in Suquamish
The poverty statistics for married-couple families in Suquamish show that 3.7% or 31 of the total 846 families live below the poverty line. Families with 3 or 4 children have the highest poverty rate of 18.8%, comprising of 12 families. On the other hand, families with 1 or 2 children have the lowest poverty rate of 0.0%, which includes 0 families.
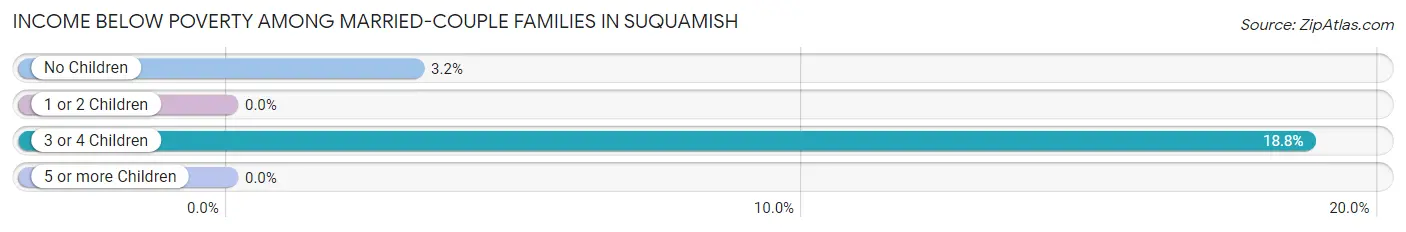
| Children | Above Poverty | Below Poverty |
| No Children | 568 (96.8%) | 19 (3.2%) |
| 1 or 2 Children | 195 (100.0%) | 0 (0.0%) |
| 3 or 4 Children | 52 (81.2%) | 12 (18.8%) |
| 5 or more Children | 0 (0.0%) | 0 (0.0%) |
| Total | 815 (96.3%) | 31 (3.7%) |
Income Below Poverty Among Single-Parent Households in Suquamish
According to the poverty data in Suquamish, 4.3% or 4 single-father households and 14.4% or 29 single-mother households are living below the poverty line. Among single-father households, those with 5 or more children have the highest poverty rate, with 2 households (100.0%) experiencing poverty. Likewise, among single-mother households, those with 3 or 4 children have the highest poverty rate, with 6 households (40.0%) falling below the poverty line.
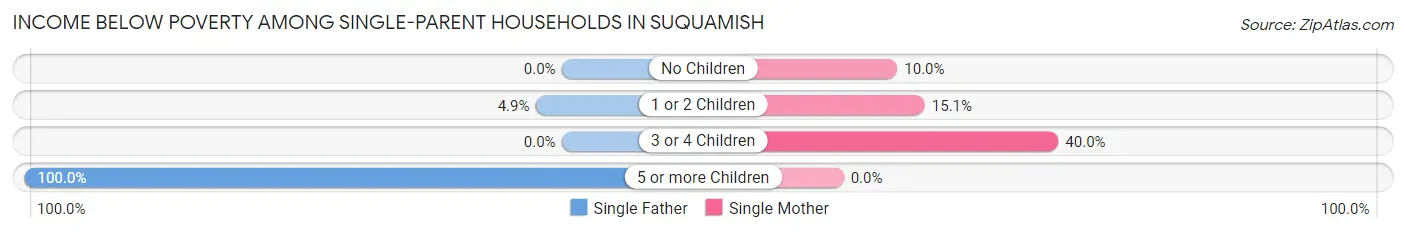
| Children | Single Father | Single Mother |
| No Children | 0 (0.0%) | 10 (10.0%) |
| 1 or 2 Children | 2 (4.9%) | 13 (15.1%) |
| 3 or 4 Children | 0 (0.0%) | 6 (40.0%) |
| 5 or more Children | 2 (100.0%) | 0 (0.0%) |
| Total | 4 (4.3%) | 29 (14.4%) |
Income Below Poverty Among Married-Couple vs Single-Parent Households in Suquamish
The poverty data for Suquamish shows that 31 of the married-couple family households (3.7%) and 33 of the single-parent households (11.2%) are living below the poverty level. Within the married-couple family households, those with 3 or 4 children have the highest poverty rate, with 12 households (18.8%) falling below the poverty line. Among the single-parent households, those with 5 or more children have the highest poverty rate, with 2 household (100.0%) living below poverty.
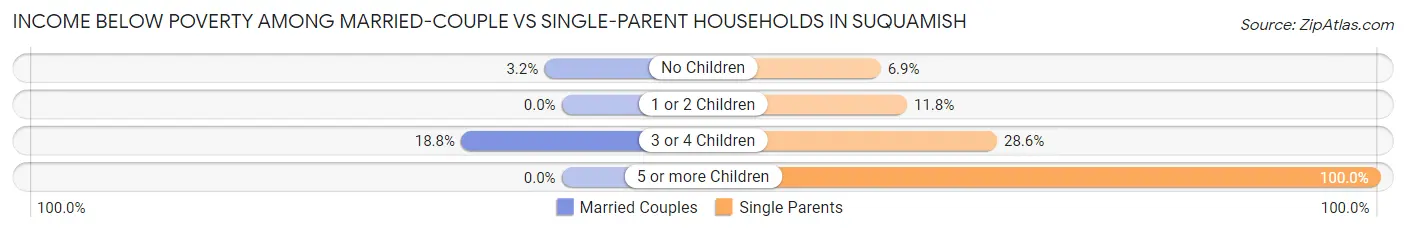
| Children | Married-Couple Families | Single-Parent Households |
| No Children | 19 (3.2%) | 10 (6.9%) |
| 1 or 2 Children | 0 (0.0%) | 15 (11.8%) |
| 3 or 4 Children | 12 (18.8%) | 6 (28.6%) |
| 5 or more Children | 0 (0.0%) | 2 (100.0%) |
| Total | 31 (3.7%) | 33 (11.2%) |
Race in Suquamish
The most populous races in Suquamish are White / Caucasian (3,012 | 69.6%), Two or more Races (601 | 13.9%), and Native / Alaskan (393 | 9.1%).
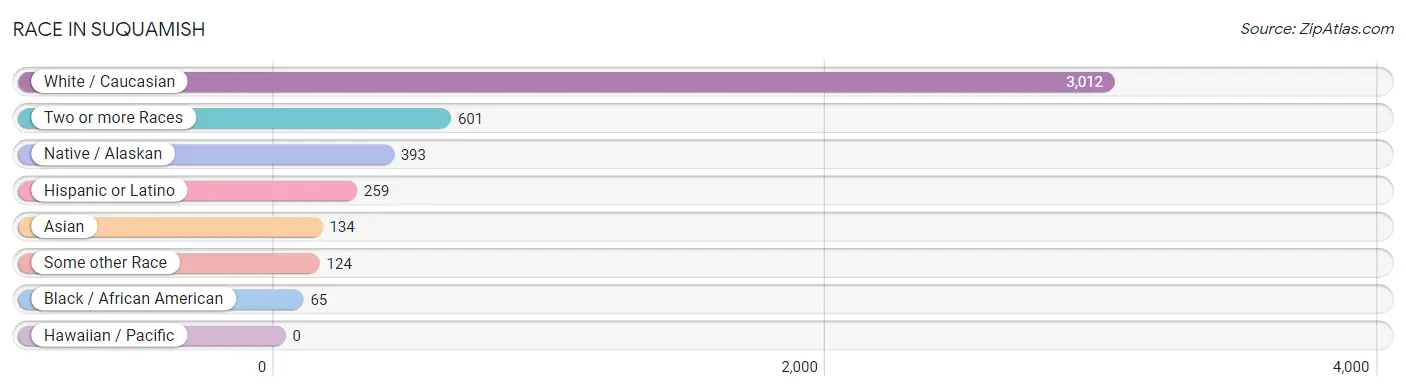
| Race | # Population | % Population |
| Asian | 134 | 3.1% |
| Black / African American | 65 | 1.5% |
| Hawaiian / Pacific | 0 | 0.0% |
| Hispanic or Latino | 259 | 6.0% |
| Native / Alaskan | 393 | 9.1% |
| White / Caucasian | 3,012 | 69.6% |
| Two or more Races | 601 | 13.9% |
| Some other Race | 124 | 2.9% |
| Total | 4,329 | 100.0% |
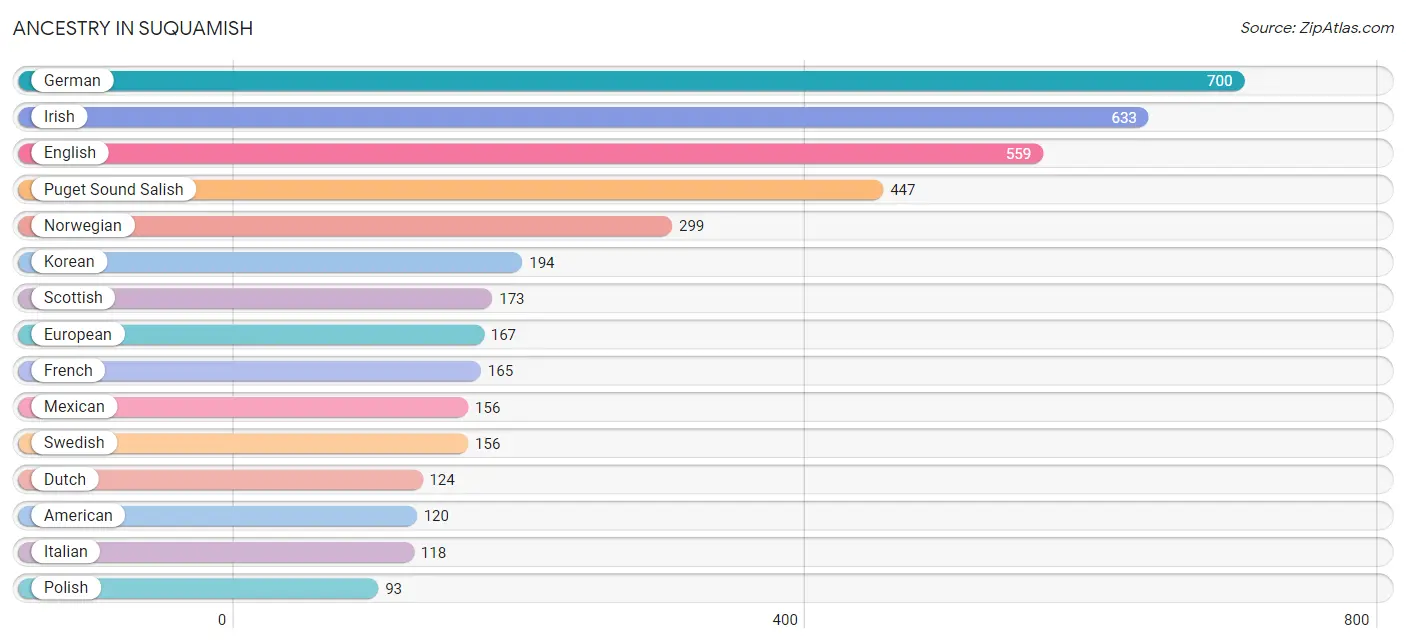
Ancestry in Suquamish
The most populous ancestries reported in Suquamish are German (700 | 16.2%), Irish (633 | 14.6%), English (559 | 12.9%), Puget Sound Salish (447 | 10.3%), and Norwegian (299 | 6.9%), together accounting for 60.9% of all Suquamish residents.
| Ancestry | # Population | % Population |
| African | 1 | 0.0% |
| Alaska Native | 8 | 0.2% |
| Alaskan Athabascan | 2 | 0.1% |
| Aleut | 2 | 0.1% |
| American | 120 | 2.8% |
| Arab | 8 | 0.2% |
| Argentinean | 5 | 0.1% |
| Armenian | 6 | 0.1% |
| Austrian | 8 | 0.2% |
| Bangladeshi | 8 | 0.2% |
| Basque | 3 | 0.1% |
| Belgian | 7 | 0.2% |
| Bhutanese | 43 | 1.0% |
| Blackfeet | 11 | 0.3% |
| Brazilian | 4 | 0.1% |
| British | 85 | 2.0% |
| Burmese | 6 | 0.1% |
| Cajun | 6 | 0.1% |
| Canadian | 19 | 0.4% |
| Celtic | 3 | 0.1% |
| Central American | 20 | 0.5% |
| Cherokee | 22 | 0.5% |
| Chippewa | 4 | 0.1% |
| Choctaw | 7 | 0.2% |
| Colombian | 8 | 0.2% |
| Colville | 5 | 0.1% |
| Comanche | 2 | 0.1% |
| Cree | 4 | 0.1% |
| Croatian | 6 | 0.1% |
| Crow | 1 | 0.0% |
| Cuban | 7 | 0.2% |
| Czech | 10 | 0.2% |
| Danish | 48 | 1.1% |
| Dutch | 124 | 2.9% |
| Eastern European | 11 | 0.3% |
| Ecuadorian | 3 | 0.1% |
| English | 559 | 12.9% |
| European | 167 | 3.9% |
| Finnish | 46 | 1.1% |
| French | 165 | 3.8% |
| French American Indian | 21 | 0.5% |
| French Canadian | 39 | 0.9% |
| German | 700 | 16.2% |
| Greek | 10 | 0.2% |
| Guamanian / Chamorro | 4 | 0.1% |
| Guatemalan | 10 | 0.2% |
| Hopi | 2 | 0.1% |
| Hungarian | 14 | 0.3% |
| Icelander | 2 | 0.1% |
| Indian (Asian) | 41 | 0.9% |
| Iranian | 10 | 0.2% |
| Irish | 633 | 14.6% |
| Iroquois | 14 | 0.3% |
| Italian | 118 | 2.7% |
| Jamaican | 13 | 0.3% |
| Korean | 194 | 4.5% |
| Latvian | 7 | 0.2% |
| Lebanese | 8 | 0.2% |
| Liberian | 2 | 0.1% |
| Lithuanian | 19 | 0.4% |
| Lumbee | 1 | 0.0% |
| Malaysian | 2 | 0.1% |
| Mexican | 156 | 3.6% |
| Native Hawaiian | 27 | 0.6% |
| Navajo | 2 | 0.1% |
| New Zealander | 4 | 0.1% |
| Northern European | 43 | 1.0% |
| Norwegian | 299 | 6.9% |
| Osage | 2 | 0.1% |
| Pakistani | 12 | 0.3% |
| Pennsylvania German | 2 | 0.1% |
| Polish | 93 | 2.1% |
| Portuguese | 13 | 0.3% |
| Pueblo | 10 | 0.2% |
| Puerto Rican | 7 | 0.2% |
| Puget Sound Salish | 447 | 10.3% |
| Russian | 37 | 0.9% |
| Salvadoran | 10 | 0.2% |
| Samoan | 5 | 0.1% |
| Scandinavian | 66 | 1.5% |
| Scotch-Irish | 56 | 1.3% |
| Scottish | 173 | 4.0% |
| Serbian | 6 | 0.1% |
| Sioux | 22 | 0.5% |
| Slavic | 4 | 0.1% |
| Slovene | 6 | 0.1% |
| South American | 21 | 0.5% |
| Spaniard | 7 | 0.2% |
| Spanish | 16 | 0.4% |
| Spanish American | 2 | 0.1% |
| Sri Lankan | 17 | 0.4% |
| Subsaharan African | 4 | 0.1% |
| Swedish | 156 | 3.6% |
| Swiss | 15 | 0.4% |
| Thai | 9 | 0.2% |
| Tlingit-Haida | 17 | 0.4% |
| Tsimshian | 3 | 0.1% |
| Ugandan | 1 | 0.0% |
| Ukrainian | 17 | 0.4% |
| Venezuelan | 5 | 0.1% |
| Welsh | 83 | 1.9% |
| Yakama | 4 | 0.1% |
| Yugoslavian | 4 | 0.1% |
| Yup'ik | 6 | 0.1% | View All 104 Rows |
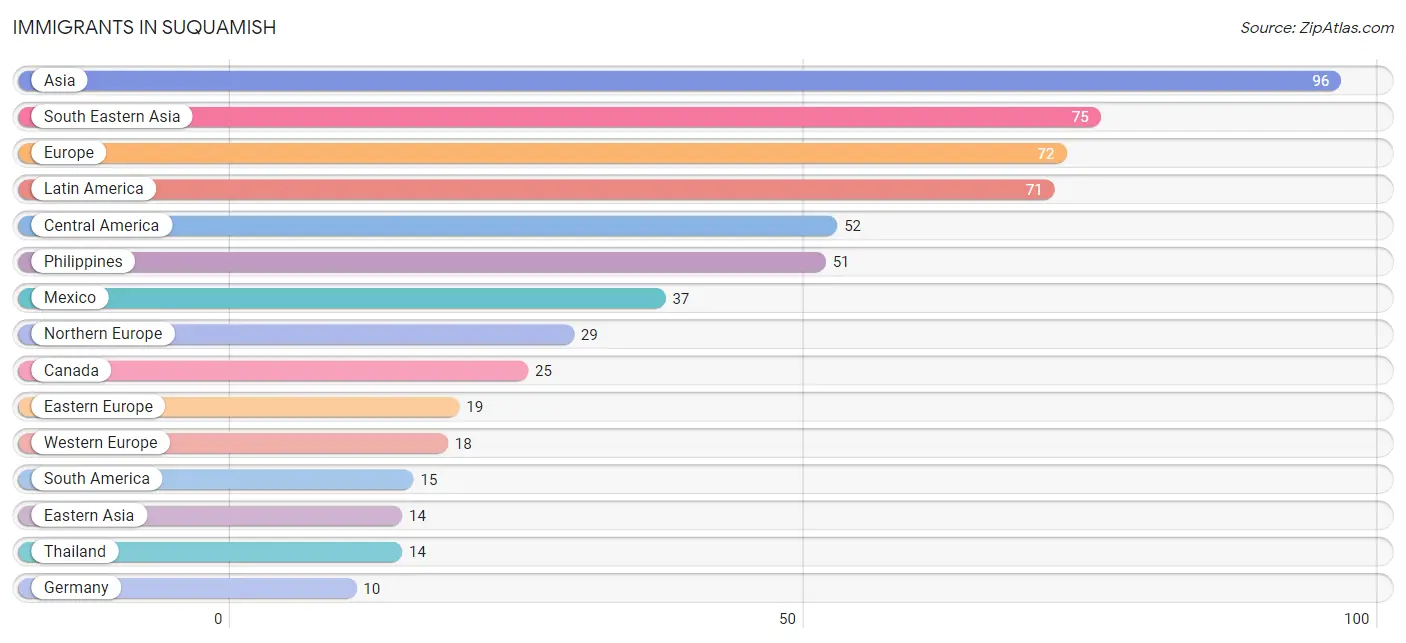
Immigrants in Suquamish
The most numerous immigrant groups reported in Suquamish came from Asia (96 | 2.2%), South Eastern Asia (75 | 1.7%), Europe (72 | 1.7%), Latin America (71 | 1.6%), and Central America (52 | 1.2%), together accounting for 8.4% of all Suquamish residents.
| Immigration Origin | # Population | % Population |
| Africa | 4 | 0.1% |
| Argentina | 2 | 0.1% |
| Asia | 96 | 2.2% |
| Belarus | 4 | 0.1% |
| Belgium | 3 | 0.1% |
| Brazil | 2 | 0.1% |
| Canada | 25 | 0.6% |
| Caribbean | 4 | 0.1% |
| Central America | 52 | 1.2% |
| China | 9 | 0.2% |
| Colombia | 6 | 0.1% |
| Costa Rica | 4 | 0.1% |
| Eastern Asia | 14 | 0.3% |
| Eastern Europe | 19 | 0.4% |
| El Salvador | 3 | 0.1% |
| England | 8 | 0.2% |
| Europe | 72 | 1.7% |
| Germany | 10 | 0.2% |
| Guatemala | 8 | 0.2% |
| India | 2 | 0.1% |
| Indonesia | 3 | 0.1% |
| Iran | 5 | 0.1% |
| Italy | 6 | 0.1% |
| Jamaica | 4 | 0.1% |
| Japan | 2 | 0.1% |
| Korea | 3 | 0.1% |
| Latin America | 71 | 1.6% |
| Latvia | 6 | 0.1% |
| Liberia | 2 | 0.1% |
| Mexico | 37 | 0.9% |
| Northern Europe | 29 | 0.7% |
| Norway | 2 | 0.1% |
| Oceania | 5 | 0.1% |
| Philippines | 51 | 1.2% |
| Poland | 2 | 0.1% |
| Russia | 4 | 0.1% |
| Scotland | 1 | 0.0% |
| South Africa | 2 | 0.1% |
| South America | 15 | 0.4% |
| South Central Asia | 7 | 0.2% |
| South Eastern Asia | 75 | 1.7% |
| Southern Europe | 6 | 0.1% |
| Switzerland | 5 | 0.1% |
| Taiwan | 2 | 0.1% |
| Thailand | 14 | 0.3% |
| Ukraine | 2 | 0.1% |
| Venezuela | 5 | 0.1% |
| Vietnam | 7 | 0.2% |
| Western Africa | 2 | 0.1% |
| Western Europe | 18 | 0.4% | View All 50 Rows |
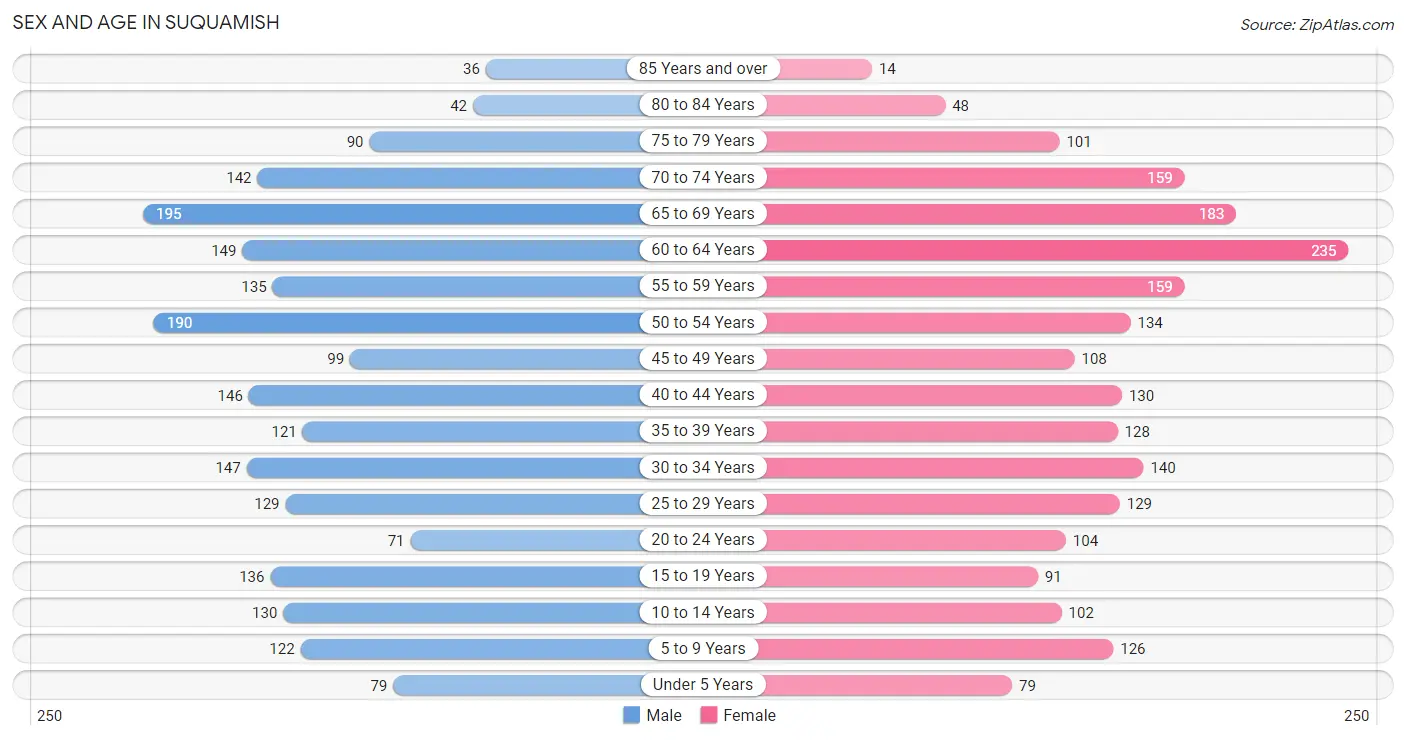
Sex and Age in Suquamish
Sex and Age in Suquamish
The most populous age groups in Suquamish are 65 to 69 Years (195 | 9.0%) for men and 60 to 64 Years (235 | 10.8%) for women.
| Age Bracket | Male | Female |
| Under 5 Years | 79 (3.7%) | 79 (3.6%) |
| 5 to 9 Years | 122 (5.7%) | 126 (5.8%) |
| 10 to 14 Years | 130 (6.0%) | 102 (4.7%) |
| 15 to 19 Years | 136 (6.3%) | 91 (4.2%) |
| 20 to 24 Years | 71 (3.3%) | 104 (4.8%) |
| 25 to 29 Years | 129 (6.0%) | 129 (5.9%) |
| 30 to 34 Years | 147 (6.8%) | 140 (6.5%) |
| 35 to 39 Years | 121 (5.6%) | 128 (5.9%) |
| 40 to 44 Years | 146 (6.8%) | 130 (6.0%) |
| 45 to 49 Years | 99 (4.6%) | 108 (5.0%) |
| 50 to 54 Years | 190 (8.8%) | 134 (6.2%) |
| 55 to 59 Years | 135 (6.2%) | 159 (7.3%) |
| 60 to 64 Years | 149 (6.9%) | 235 (10.8%) |
| 65 to 69 Years | 195 (9.0%) | 183 (8.4%) |
| 70 to 74 Years | 142 (6.6%) | 159 (7.3%) |
| 75 to 79 Years | 90 (4.2%) | 101 (4.6%) |
| 80 to 84 Years | 42 (1.9%) | 48 (2.2%) |
| 85 Years and over | 36 (1.7%) | 14 (0.6%) |
| Total | 2,159 (100.0%) | 2,170 (100.0%) |
Families and Households in Suquamish
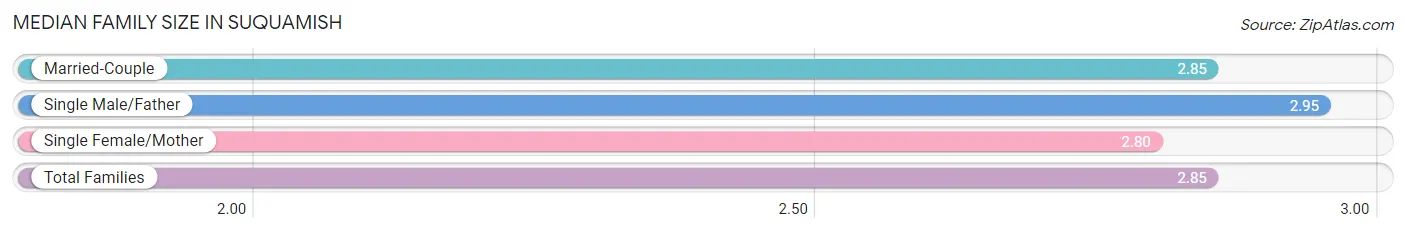
Median Family Size in Suquamish
The median family size in Suquamish is 2.85 persons per family, with single male/father families (94 | 8.2%) accounting for the largest median family size of 2.95 persons per family. On the other hand, single female/mother families (201 | 17.6%) represent the smallest median family size with 2.80 persons per family.
| Family Type | # Families | Family Size |
| Married-Couple | 846 (74.2%) | 2.85 |
| Single Male/Father | 94 (8.2%) | 2.95 |
| Single Female/Mother | 201 (17.6%) | 2.80 |
| Total Families | 1,141 (100.0%) | 2.85 |
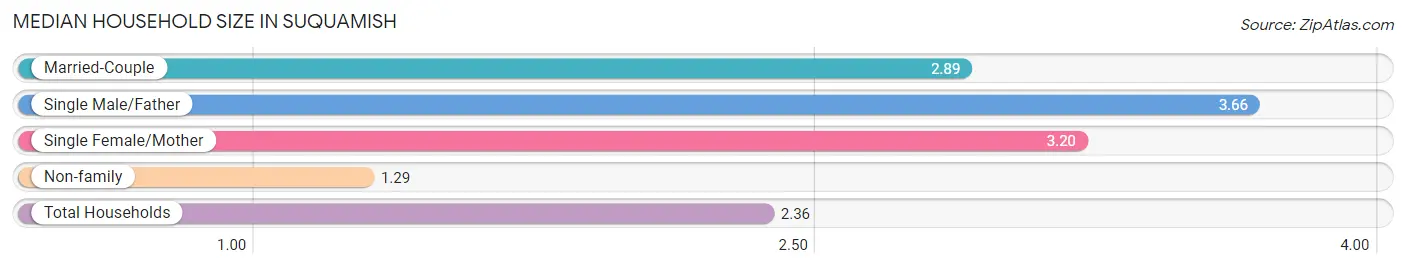
Median Household Size in Suquamish
The median household size in Suquamish is 2.36 persons per household, with single male/father households (94 | 5.1%) accounting for the largest median household size of 3.66 persons per household. non-family households (694 | 37.8%) represent the smallest median household size with 1.29 persons per household.
| Household Type | # Households | Household Size |
| Married-Couple | 846 (46.1%) | 2.89 |
| Single Male/Father | 94 (5.1%) | 3.66 |
| Single Female/Mother | 201 (11.0%) | 3.20 |
| Non-family | 694 (37.8%) | 1.29 |
| Total Households | 1,835 (100.0%) | 2.36 |
Household Size by Marriage Status in Suquamish
Out of a total of 1,835 households in Suquamish, 1,141 (62.2%) are family households, while 694 (37.8%) are nonfamily households. The most numerous type of family households are 2-person households, comprising 619, and the most common type of nonfamily households are 1-person households, comprising 555.
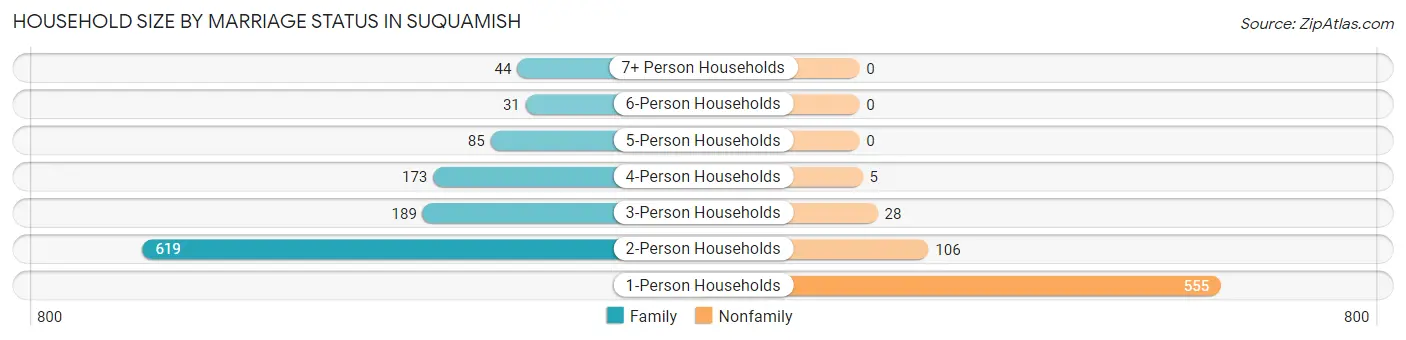
| Household Size | Family Households | Nonfamily Households |
| 1-Person Households | - | 555 (30.2%) |
| 2-Person Households | 619 (33.7%) | 106 (5.8%) |
| 3-Person Households | 189 (10.3%) | 28 (1.5%) |
| 4-Person Households | 173 (9.4%) | 5 (0.3%) |
| 5-Person Households | 85 (4.6%) | 0 (0.0%) |
| 6-Person Households | 31 (1.7%) | 0 (0.0%) |
| 7+ Person Households | 44 (2.4%) | 0 (0.0%) |
| Total | 1,141 (62.2%) | 694 (37.8%) |
Female Fertility in Suquamish
Fertility by Age in Suquamish
Average fertility rate in Suquamish is 33.0 births per 1,000 women. Women in the age bracket of 20 to 34 years have the highest fertility rate with 64.0 births per 1,000 women. Women in the age bracket of 20 to 34 years acount for 85.7% of all women with births.
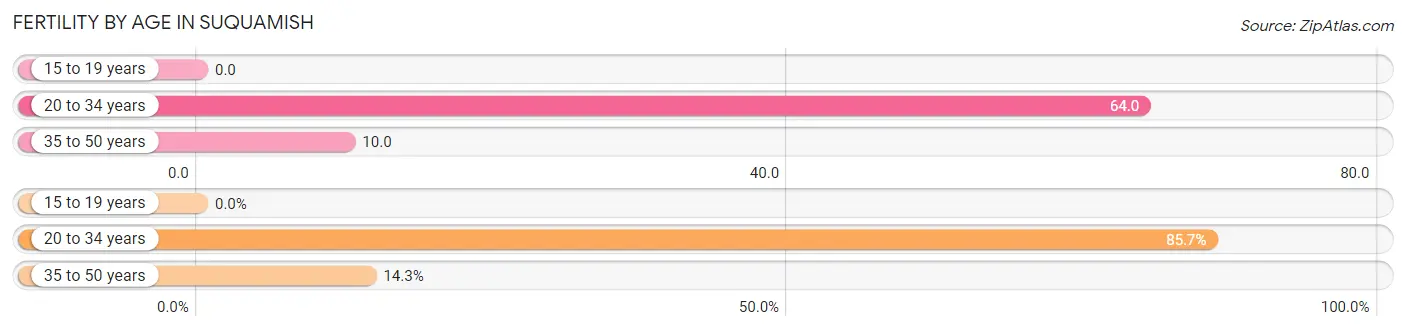
| Age Bracket | Women with Births | Births / 1,000 Women |
| 15 to 19 years | 0 (0.0%) | 0.0 |
| 20 to 34 years | 24 (85.7%) | 64.0 |
| 35 to 50 years | 4 (14.3%) | 10.0 |
| Total | 28 (100.0%) | 33.0 |
Fertility by Age by Marriage Status in Suquamish
64.3% of women with births (28) in Suquamish are married. The highest percentage of unmarried women with births falls into 20 to 34 years age bracket with 41.7% of them unmarried at the time of birth, while the lowest percentage of unmarried women with births belong to 35 to 50 years age bracket with 0.0% of them unmarried.
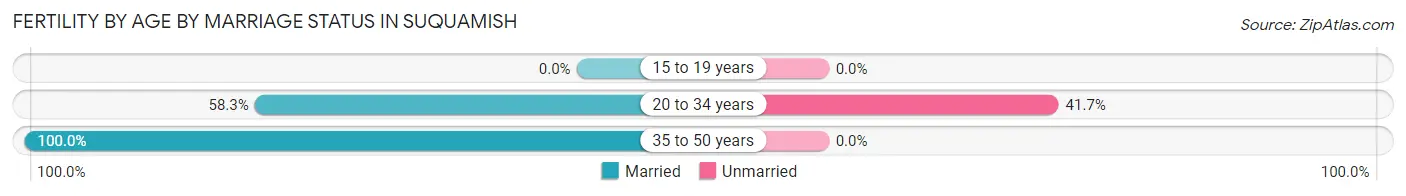
| Age Bracket | Married | Unmarried |
| 15 to 19 years | 0 (0.0%) | 0 (0.0%) |
| 20 to 34 years | 14 (58.3%) | 10 (41.7%) |
| 35 to 50 years | 4 (100.0%) | 0 (0.0%) |
| Total | 18 (64.3%) | 10 (35.7%) |
Fertility by Education in Suquamish
Average fertility rate in Suquamish is 33.0 births per 1,000 women. Women with the education attainment of graduate degree have the highest fertility rate of 63.0 births per 1,000 women, while women with the education attainment of high school diploma have the lowest fertility at 14.0 births per 1,000 women. Women with the education attainment of college or associate's degree represent 42.9% of all women with births.
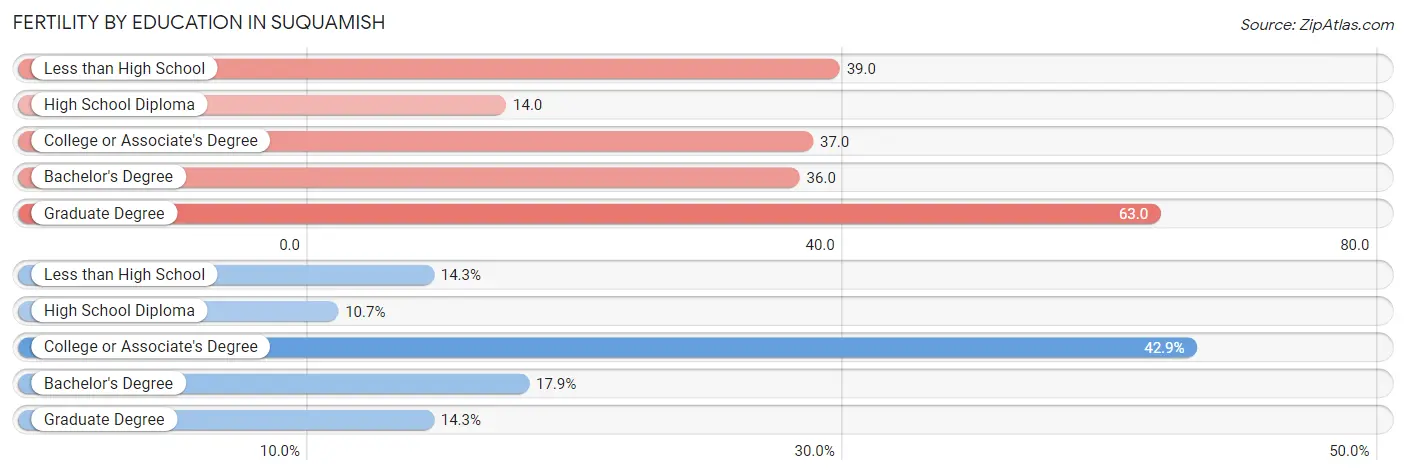
| Educational Attainment | Women with Births | Births / 1,000 Women |
| Less than High School | 4 (14.3%) | 39.0 |
| High School Diploma | 3 (10.7%) | 14.0 |
| College or Associate's Degree | 12 (42.9%) | 37.0 |
| Bachelor's Degree | 5 (17.9%) | 36.0 |
| Graduate Degree | 4 (14.3%) | 63.0 |
| Total | 28 (100.0%) | 33.0 |
Fertility by Education by Marriage Status in Suquamish
35.7% of women with births in Suquamish are unmarried. Women with the educational attainment of bachelor's degree are most likely to be married with 100.0% of them married at childbirth, while women with the educational attainment of less than high school are least likely to be married with 100.0% of them unmarried at childbirth.
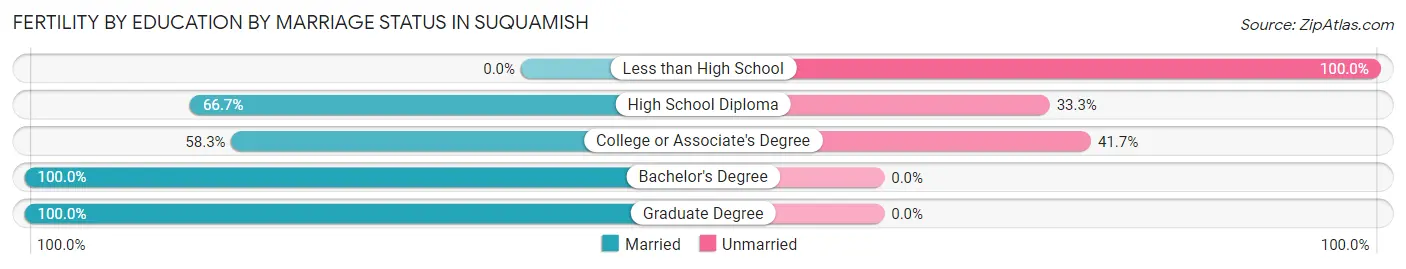
| Educational Attainment | Married | Unmarried |
| Less than High School | 0 (0.0%) | 4 (100.0%) |
| High School Diploma | 2 (66.7%) | 1 (33.3%) |
| College or Associate's Degree | 7 (58.3%) | 5 (41.7%) |
| Bachelor's Degree | 5 (100.0%) | 0 (0.0%) |
| Graduate Degree | 4 (100.0%) | 0 (0.0%) |
| Total | 18 (64.3%) | 10 (35.7%) |
Employment Characteristics in Suquamish
Employment by Class of Employer in Suquamish
Among the 2,039 employed individuals in Suquamish, private company employees (1,147 | 56.2%), local government employees (226 | 11.1%), and federal government employees (185 | 9.1%) make up the most common classes of employment.
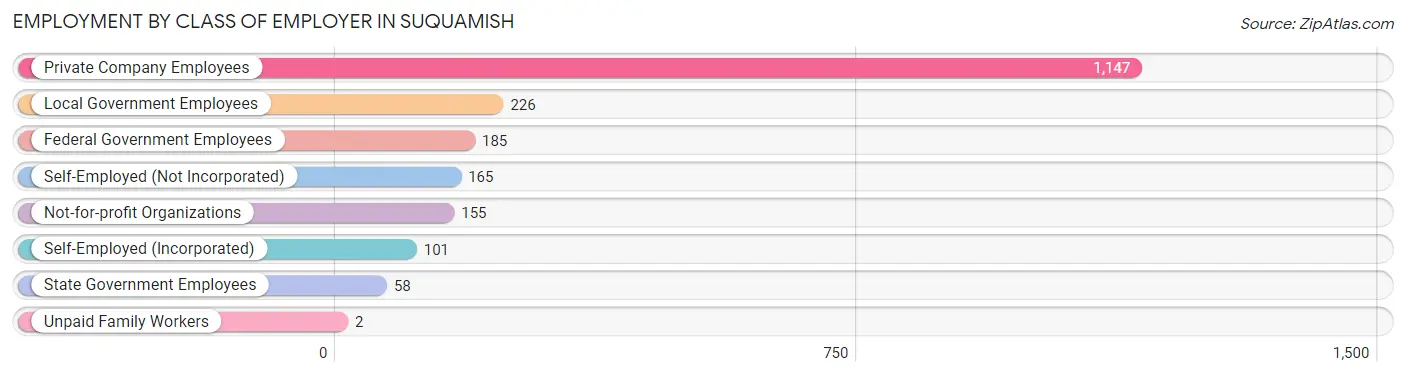
| Employer Class | # Employees | % Employees |
| Private Company Employees | 1,147 | 56.2% |
| Self-Employed (Incorporated) | 101 | 5.0% |
| Self-Employed (Not Incorporated) | 165 | 8.1% |
| Not-for-profit Organizations | 155 | 7.6% |
| Local Government Employees | 226 | 11.1% |
| State Government Employees | 58 | 2.8% |
| Federal Government Employees | 185 | 9.1% |
| Unpaid Family Workers | 2 | 0.1% |
| Total | 2,039 | 100.0% |
Employment Status by Age in Suquamish
According to the labor force statistics for Suquamish, out of the total population over 16 years of age (3,647), 60.4% or 2,203 individuals are in the labor force, with 5.8% or 128 of them unemployed. The age group with the highest labor force participation rate is 35 to 44 years, with 85.0% or 446 individuals in the labor force. Within the labor force, the 20 to 24 years age range has the highest percentage of unemployed individuals, with 19.0% or 28 of them being unemployed.
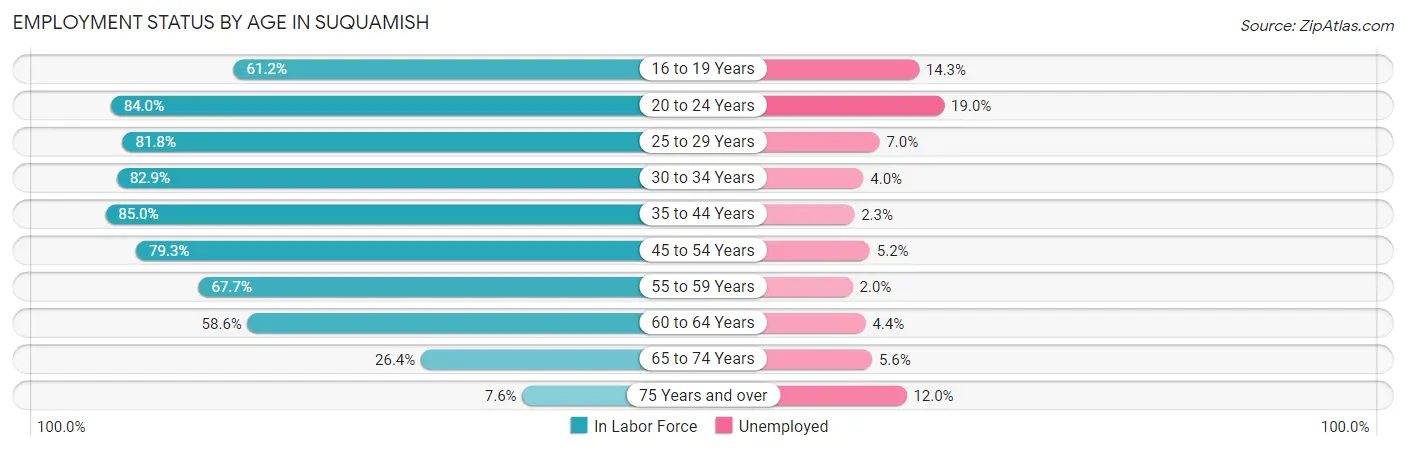
| Age Bracket | In Labor Force | Unemployed |
| 16 to 19 Years | 112 (61.2%) | 16 (14.3%) |
| 20 to 24 Years | 147 (84.0%) | 28 (19.0%) |
| 25 to 29 Years | 211 (81.8%) | 15 (7.0%) |
| 30 to 34 Years | 238 (82.9%) | 10 (4.0%) |
| 35 to 44 Years | 446 (85.0%) | 10 (2.3%) |
| 45 to 54 Years | 421 (79.3%) | 22 (5.2%) |
| 55 to 59 Years | 199 (67.7%) | 4 (2.0%) |
| 60 to 64 Years | 225 (58.6%) | 10 (4.4%) |
| 65 to 74 Years | 179 (26.4%) | 10 (5.6%) |
| 75 Years and over | 25 (7.6%) | 3 (12.0%) |
| Total | 2,203 (60.4%) | 128 (5.8%) |
Employment Status by Educational Attainment in Suquamish
According to labor force statistics for Suquamish, 76.3% of individuals (1,739) out of the total population between 25 and 64 years of age (2,279) are in the labor force, with 4.0% or 70 of them being unemployed. The group with the highest labor force participation rate are those with the educational attainment of bachelor's degree or higher, with 83.0% or 552 individuals in the labor force. Within the labor force, individuals with bachelor's degree or higher education have the highest percentage of unemployment, with 4.9% or 27 of them being unemployed.
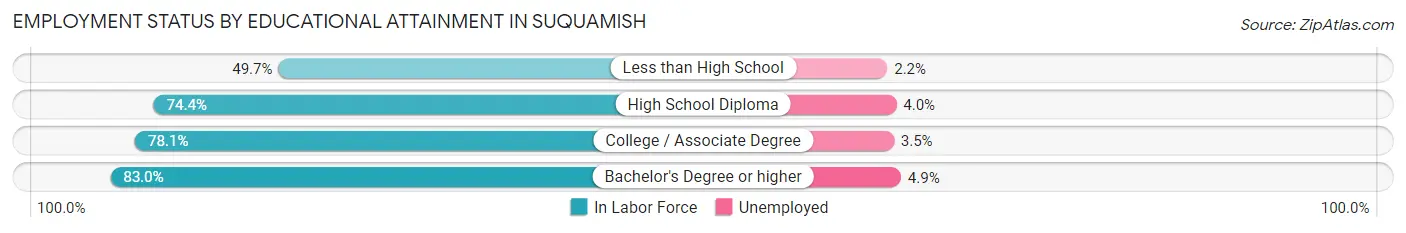
| Educational Attainment | In Labor Force | Unemployed |
| Less than High School | 90 (49.7%) | 4 (2.2%) |
| High School Diploma | 431 (74.4%) | 23 (4.0%) |
| College / Associate Degree | 667 (78.1%) | 30 (3.5%) |
| Bachelor's Degree or higher | 552 (83.0%) | 33 (4.9%) |
| Total | 1,739 (76.3%) | 91 (4.0%) |
Employment Occupations by Sex in Suquamish
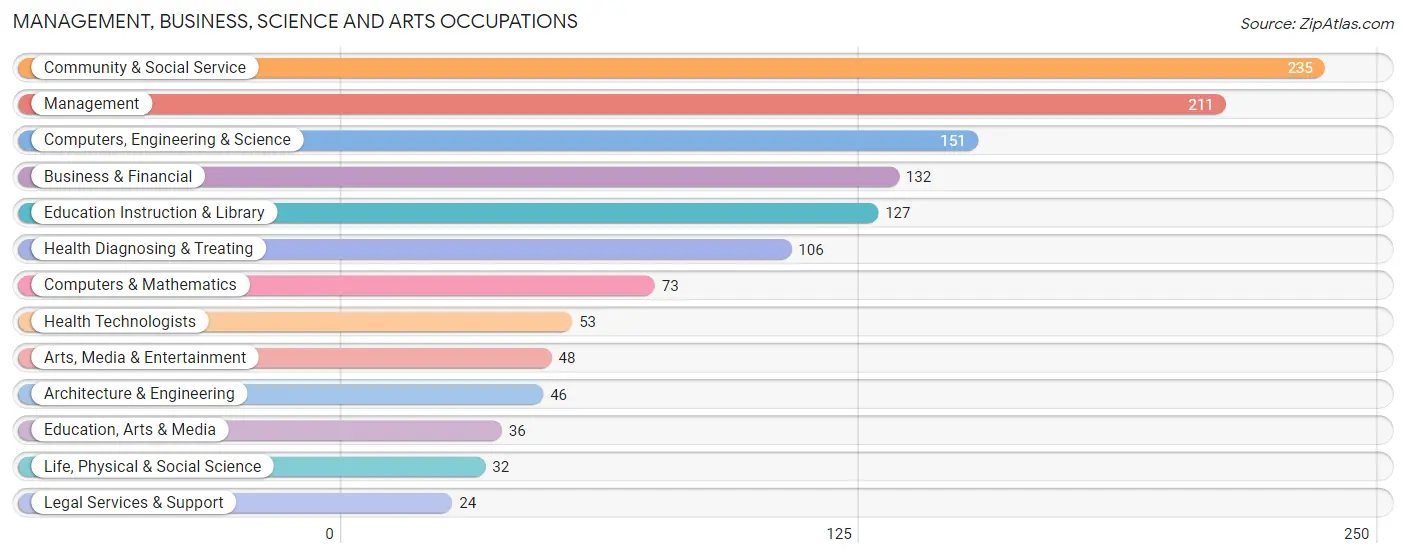
Management, Business, Science and Arts Occupations
The most common Management, Business, Science and Arts occupations in Suquamish are Community & Social Service (235 | 11.5%), Management (211 | 10.3%), Computers, Engineering & Science (151 | 7.4%), Business & Financial (132 | 6.5%), and Education Instruction & Library (127 | 6.2%).
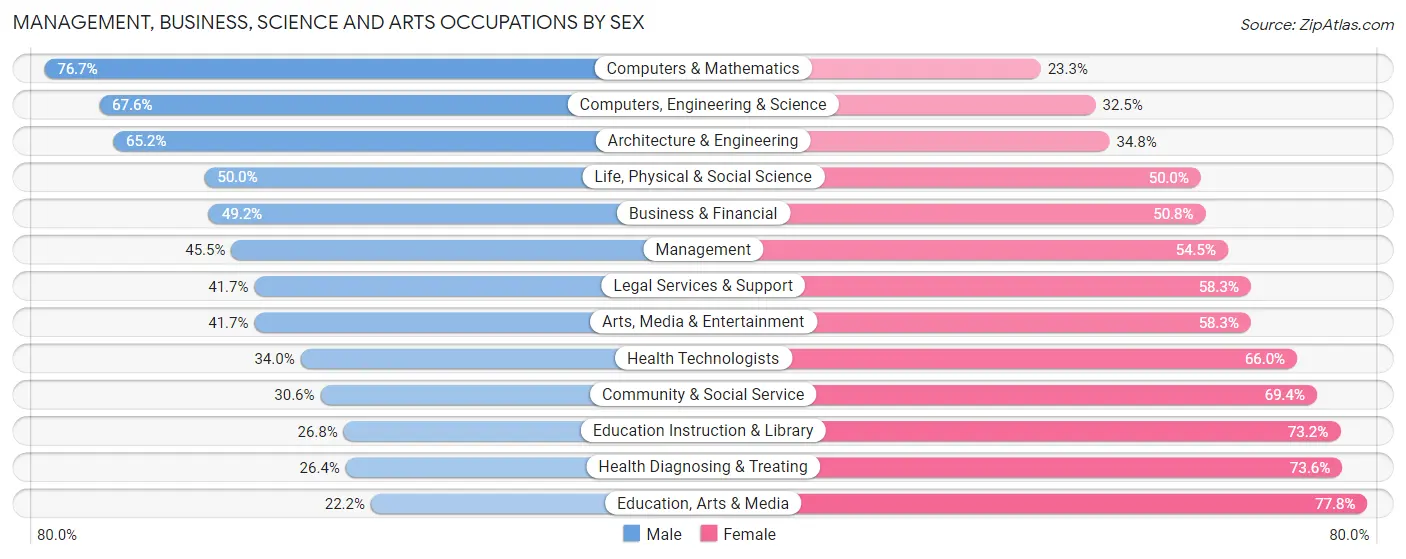
Management, Business, Science and Arts Occupations by Sex
Within the Management, Business, Science and Arts occupations in Suquamish, the most male-oriented occupations are Computers & Mathematics (76.7%), Computers, Engineering & Science (67.5%), and Architecture & Engineering (65.2%), while the most female-oriented occupations are Education, Arts & Media (77.8%), Health Diagnosing & Treating (73.6%), and Education Instruction & Library (73.2%).
| Occupation | Male | Female |
| Management | 96 (45.5%) | 115 (54.5%) |
| Business & Financial | 65 (49.2%) | 67 (50.8%) |
| Computers, Engineering & Science | 102 (67.5%) | 49 (32.5%) |
| Computers & Mathematics | 56 (76.7%) | 17 (23.3%) |
| Architecture & Engineering | 30 (65.2%) | 16 (34.8%) |
| Life, Physical & Social Science | 16 (50.0%) | 16 (50.0%) |
| Community & Social Service | 72 (30.6%) | 163 (69.4%) |
| Education, Arts & Media | 8 (22.2%) | 28 (77.8%) |
| Legal Services & Support | 10 (41.7%) | 14 (58.3%) |
| Education Instruction & Library | 34 (26.8%) | 93 (73.2%) |
| Arts, Media & Entertainment | 20 (41.7%) | 28 (58.3%) |
| Health Diagnosing & Treating | 28 (26.4%) | 78 (73.6%) |
| Health Technologists | 18 (34.0%) | 35 (66.0%) |
| Total (Category) | 363 (43.5%) | 472 (56.5%) |
| Total (Overall) | 1,007 (49.2%) | 1,040 (50.8%) |
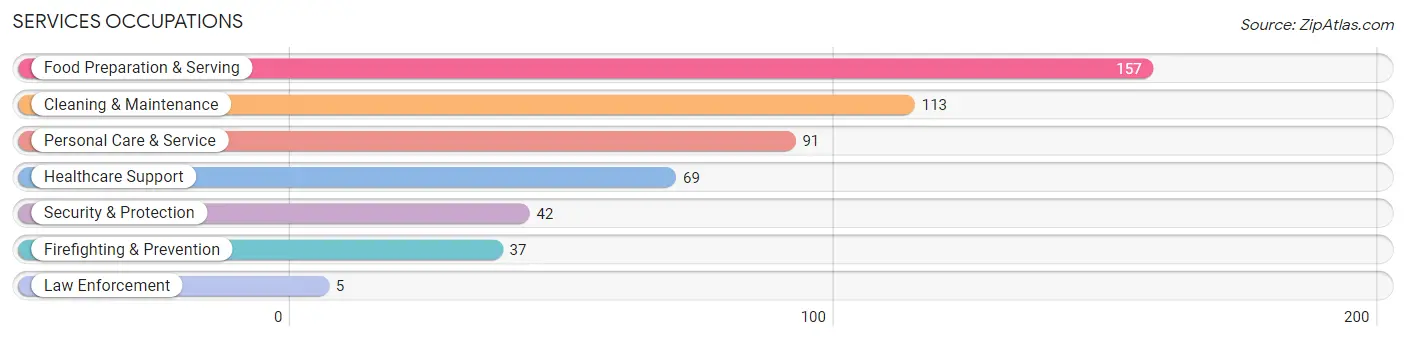
Services Occupations
The most common Services occupations in Suquamish are Food Preparation & Serving (157 | 7.7%), Cleaning & Maintenance (113 | 5.5%), Personal Care & Service (91 | 4.4%), Healthcare Support (69 | 3.4%), and Security & Protection (42 | 2.1%).
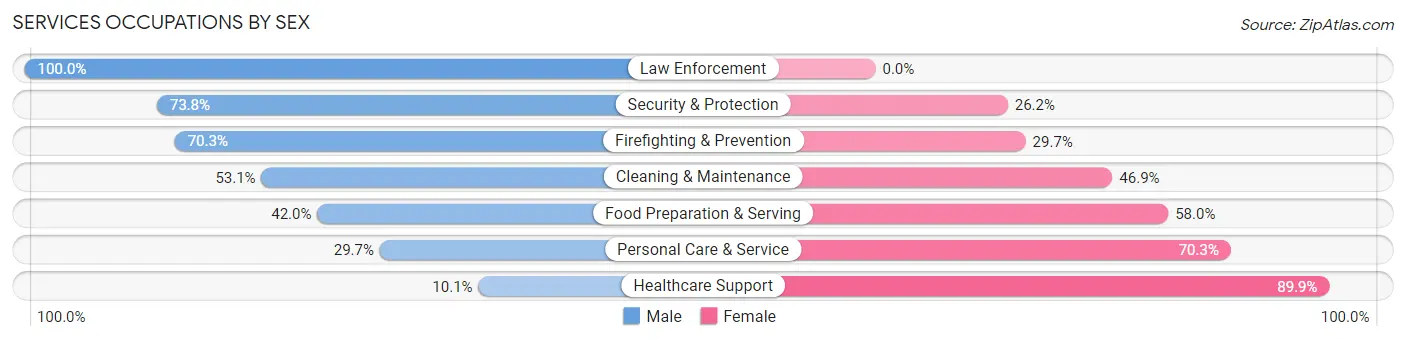
Services Occupations by Sex
Within the Services occupations in Suquamish, the most male-oriented occupations are Law Enforcement (100.0%), Security & Protection (73.8%), and Firefighting & Prevention (70.3%), while the most female-oriented occupations are Healthcare Support (89.9%), Personal Care & Service (70.3%), and Food Preparation & Serving (58.0%).
| Occupation | Male | Female |
| Healthcare Support | 7 (10.1%) | 62 (89.9%) |
| Security & Protection | 31 (73.8%) | 11 (26.2%) |
| Firefighting & Prevention | 26 (70.3%) | 11 (29.7%) |
| Law Enforcement | 5 (100.0%) | 0 (0.0%) |
| Food Preparation & Serving | 66 (42.0%) | 91 (58.0%) |
| Cleaning & Maintenance | 60 (53.1%) | 53 (46.9%) |
| Personal Care & Service | 27 (29.7%) | 64 (70.3%) |
| Total (Category) | 191 (40.5%) | 281 (59.5%) |
| Total (Overall) | 1,007 (49.2%) | 1,040 (50.8%) |
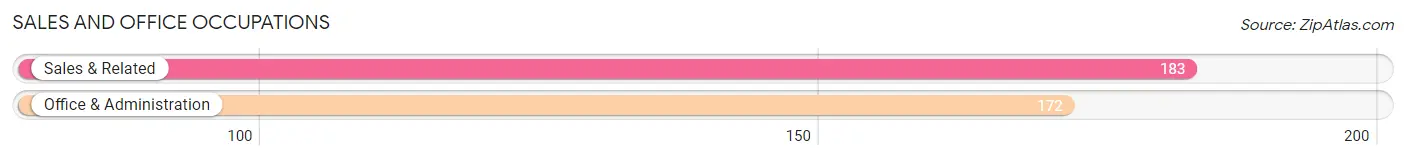
Sales and Office Occupations
The most common Sales and Office occupations in Suquamish are Sales & Related (183 | 8.9%), and Office & Administration (172 | 8.4%).
Sales and Office Occupations by Sex
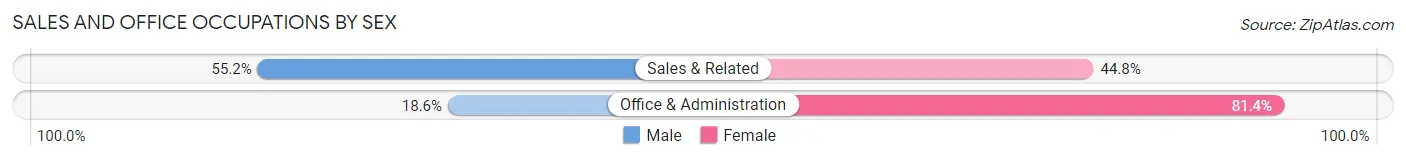
| Occupation | Male | Female |
| Sales & Related | 101 (55.2%) | 82 (44.8%) |
| Office & Administration | 32 (18.6%) | 140 (81.4%) |
| Total (Category) | 133 (37.5%) | 222 (62.5%) |
| Total (Overall) | 1,007 (49.2%) | 1,040 (50.8%) |
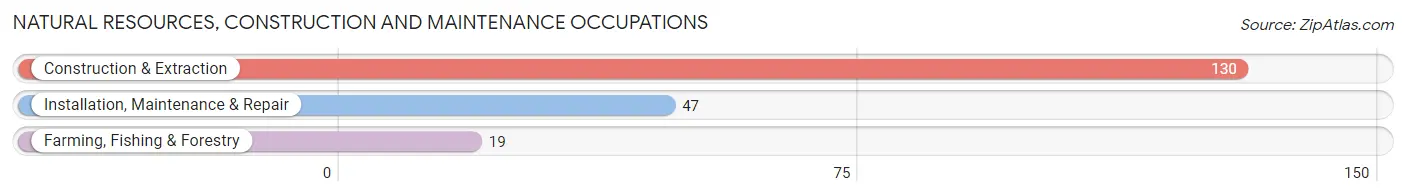
Natural Resources, Construction and Maintenance Occupations
The most common Natural Resources, Construction and Maintenance occupations in Suquamish are Construction & Extraction (130 | 6.4%), Installation, Maintenance & Repair (47 | 2.3%), and Farming, Fishing & Forestry (19 | 0.9%).
Natural Resources, Construction and Maintenance Occupations by Sex
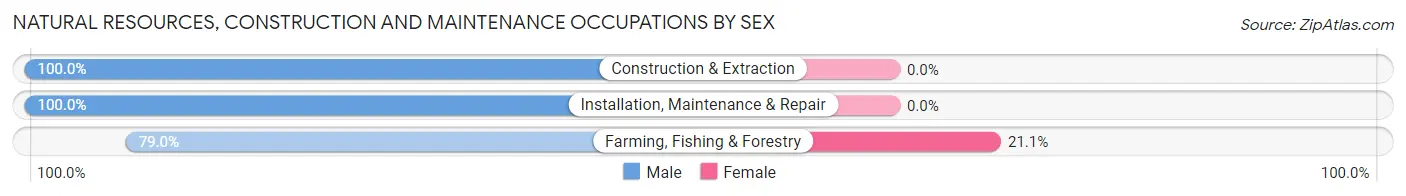
| Occupation | Male | Female |
| Farming, Fishing & Forestry | 15 (78.9%) | 4 (21.0%) |
| Construction & Extraction | 130 (100.0%) | 0 (0.0%) |
| Installation, Maintenance & Repair | 47 (100.0%) | 0 (0.0%) |
| Total (Category) | 192 (98.0%) | 4 (2.0%) |
| Total (Overall) | 1,007 (49.2%) | 1,040 (50.8%) |
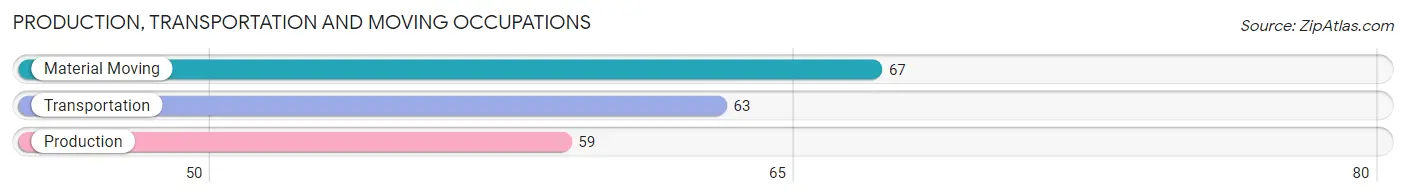
Production, Transportation and Moving Occupations
The most common Production, Transportation and Moving occupations in Suquamish are Material Moving (67 | 3.3%), Transportation (63 | 3.1%), and Production (59 | 2.9%).
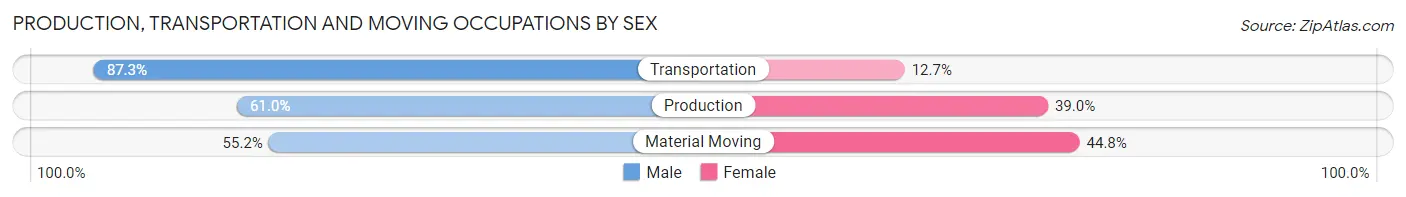
Production, Transportation and Moving Occupations by Sex
| Occupation | Male | Female |
| Production | 36 (61.0%) | 23 (39.0%) |
| Transportation | 55 (87.3%) | 8 (12.7%) |
| Material Moving | 37 (55.2%) | 30 (44.8%) |
| Total (Category) | 128 (67.7%) | 61 (32.3%) |
| Total (Overall) | 1,007 (49.2%) | 1,040 (50.8%) |
Employment Industries by Sex in Suquamish
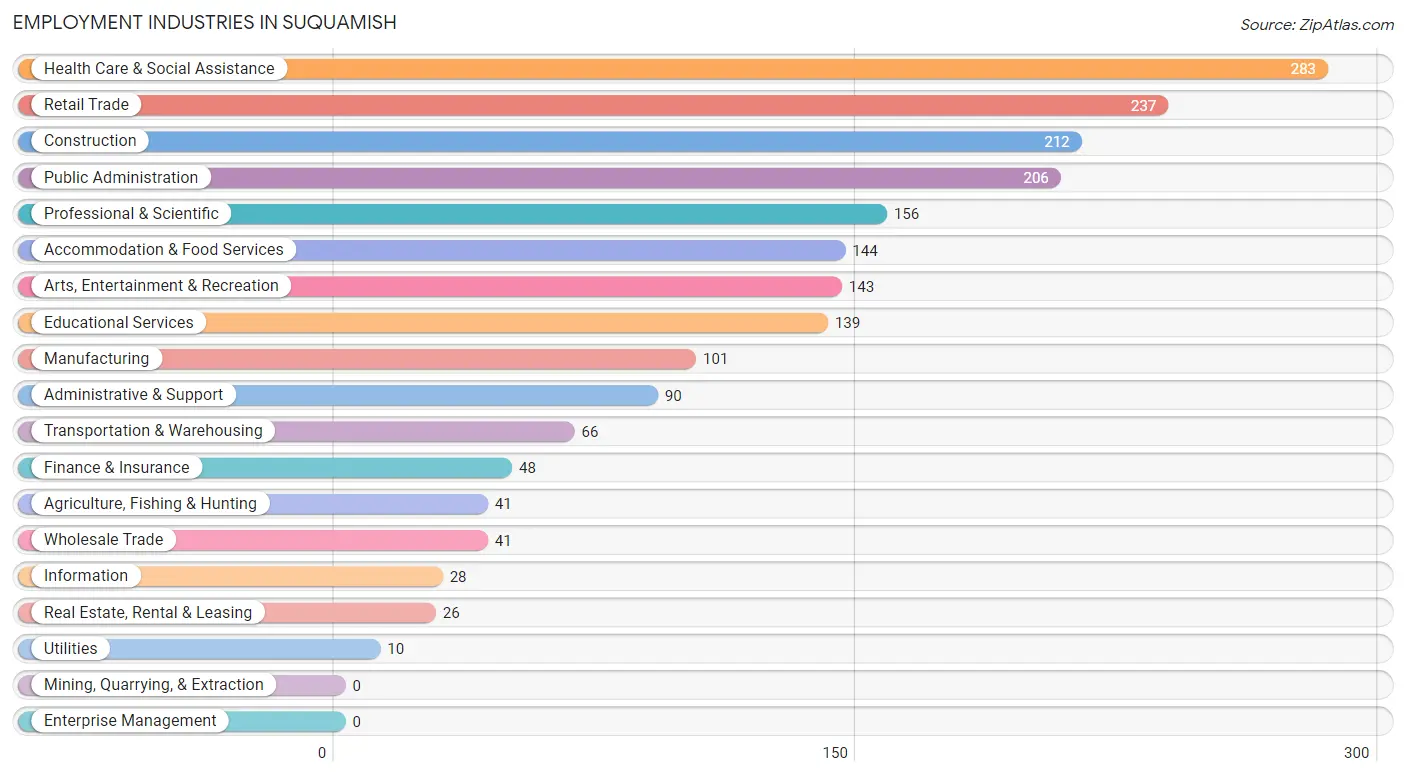
Employment Industries in Suquamish
The major employment industries in Suquamish include Health Care & Social Assistance (283 | 13.8%), Retail Trade (237 | 11.6%), Construction (212 | 10.4%), Public Administration (206 | 10.1%), and Professional & Scientific (156 | 7.6%).
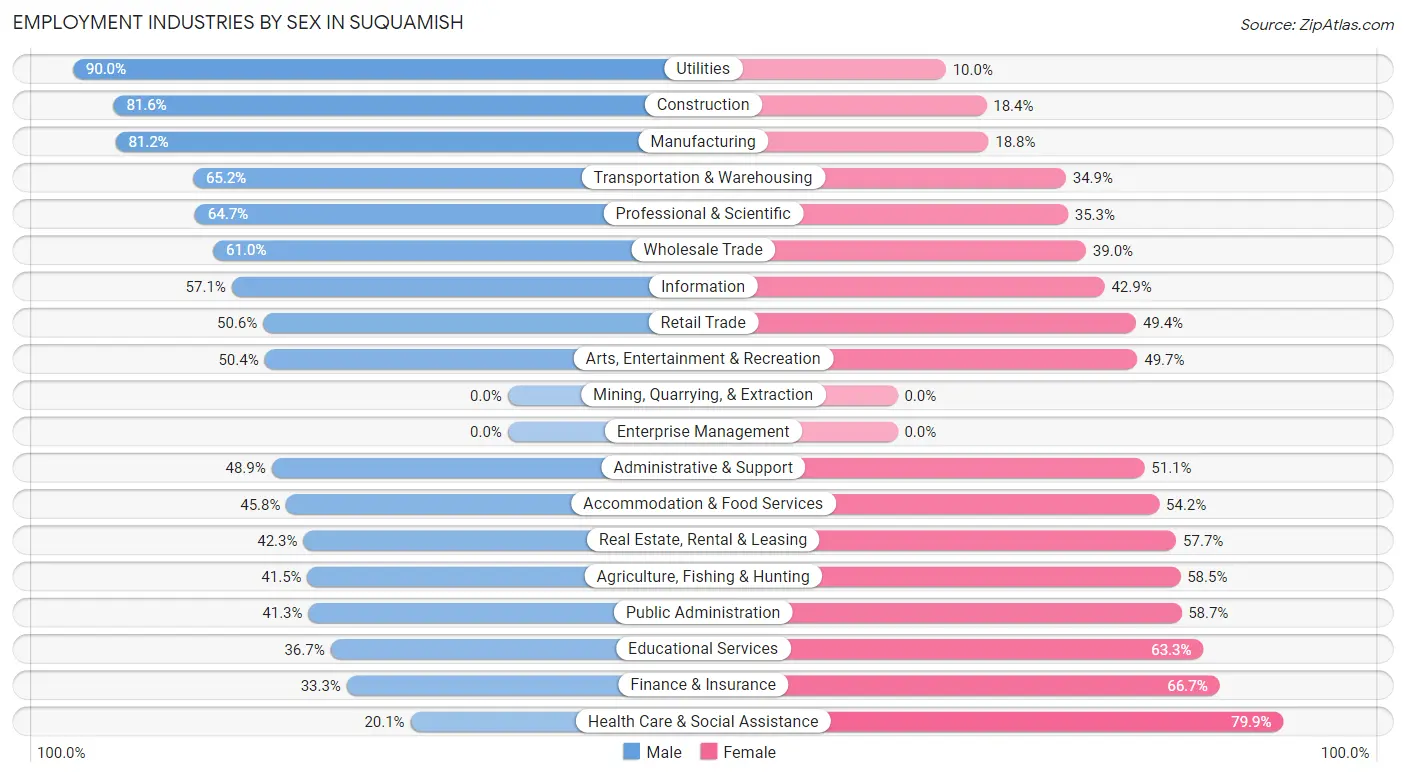
Employment Industries by Sex in Suquamish
The Suquamish industries that see more men than women are Utilities (90.0%), Construction (81.6%), and Manufacturing (81.2%), whereas the industries that tend to have a higher number of women are Health Care & Social Assistance (79.9%), Finance & Insurance (66.7%), and Educational Services (63.3%).
| Industry | Male | Female |
| Agriculture, Fishing & Hunting | 17 (41.5%) | 24 (58.5%) |
| Mining, Quarrying, & Extraction | 0 (0.0%) | 0 (0.0%) |
| Construction | 173 (81.6%) | 39 (18.4%) |
| Manufacturing | 82 (81.2%) | 19 (18.8%) |
| Wholesale Trade | 25 (61.0%) | 16 (39.0%) |
| Retail Trade | 120 (50.6%) | 117 (49.4%) |
| Transportation & Warehousing | 43 (65.1%) | 23 (34.8%) |
| Utilities | 9 (90.0%) | 1 (10.0%) |
| Information | 16 (57.1%) | 12 (42.9%) |
| Finance & Insurance | 16 (33.3%) | 32 (66.7%) |
| Real Estate, Rental & Leasing | 11 (42.3%) | 15 (57.7%) |
| Professional & Scientific | 101 (64.7%) | 55 (35.3%) |
| Enterprise Management | 0 (0.0%) | 0 (0.0%) |
| Administrative & Support | 44 (48.9%) | 46 (51.1%) |
| Educational Services | 51 (36.7%) | 88 (63.3%) |
| Health Care & Social Assistance | 57 (20.1%) | 226 (79.9%) |
| Arts, Entertainment & Recreation | 72 (50.3%) | 71 (49.6%) |
| Accommodation & Food Services | 66 (45.8%) | 78 (54.2%) |
| Public Administration | 85 (41.3%) | 121 (58.7%) |
| Total | 1,007 (49.2%) | 1,040 (50.8%) |
Education in Suquamish
School Enrollment in Suquamish
The most common levels of schooling among the 811 students in Suquamish are elementary school (216 | 26.6%), middle school (175 | 21.6%), and high school (166 | 20.5%).
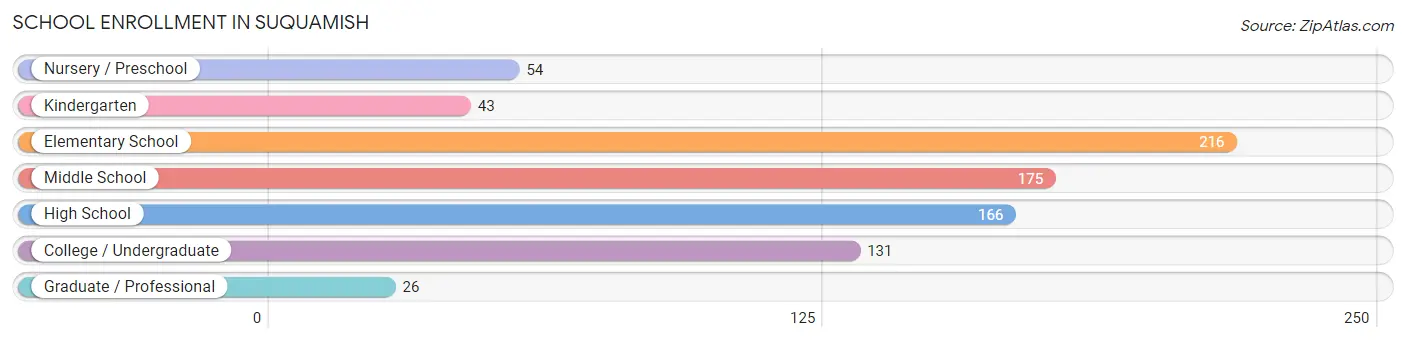
| School Level | # Students | % Students |
| Nursery / Preschool | 54 | 6.7% |
| Kindergarten | 43 | 5.3% |
| Elementary School | 216 | 26.6% |
| Middle School | 175 | 21.6% |
| High School | 166 | 20.5% |
| College / Undergraduate | 131 | 16.2% |
| Graduate / Professional | 26 | 3.2% |
| Total | 811 | 100.0% |
School Enrollment by Age by Funding Source in Suquamish
Out of a total of 811 students who are enrolled in schools in Suquamish, 105 (12.9%) attend a private institution, while the remaining 706 (87.1%) are enrolled in public schools. The age group of 3 to 4 year olds has the highest likelihood of being enrolled in private schools, with 15 (39.5% in the age bracket) enrolled. Conversely, the age group of 18 to 19 year olds has the lowest likelihood of being enrolled in a private school, with 48 (100.0% in the age bracket) attending a public institution.
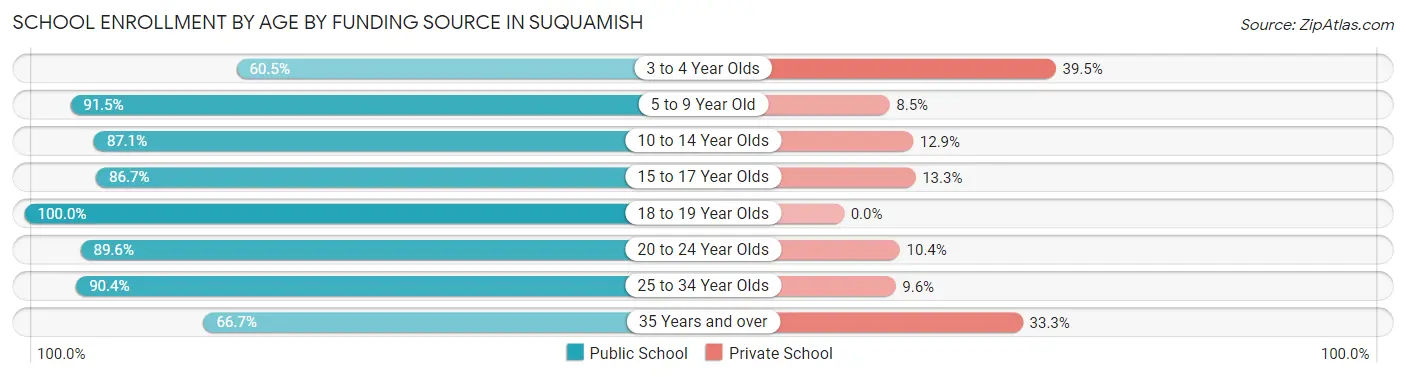
| Age Bracket | Public School | Private School |
| 3 to 4 Year Olds | 23 (60.5%) | 15 (39.5%) |
| 5 to 9 Year Old | 215 (91.5%) | 20 (8.5%) |
| 10 to 14 Year Olds | 196 (87.1%) | 29 (12.9%) |
| 15 to 17 Year Olds | 104 (86.7%) | 16 (13.3%) |
| 18 to 19 Year Olds | 48 (100.0%) | 0 (0.0%) |
| 20 to 24 Year Olds | 43 (89.6%) | 5 (10.4%) |
| 25 to 34 Year Olds | 47 (90.4%) | 5 (9.6%) |
| 35 Years and over | 30 (66.7%) | 15 (33.3%) |
| Total | 706 (87.1%) | 105 (12.9%) |
Educational Attainment by Field of Study in Suquamish
Social sciences (136 | 11.4%), business (128 | 10.7%), education (128 | 10.7%), engineering (127 | 10.6%), and science & technology (108 | 9.0%) are the most common fields of study among 1,193 individuals in Suquamish who have obtained a bachelor's degree or higher.
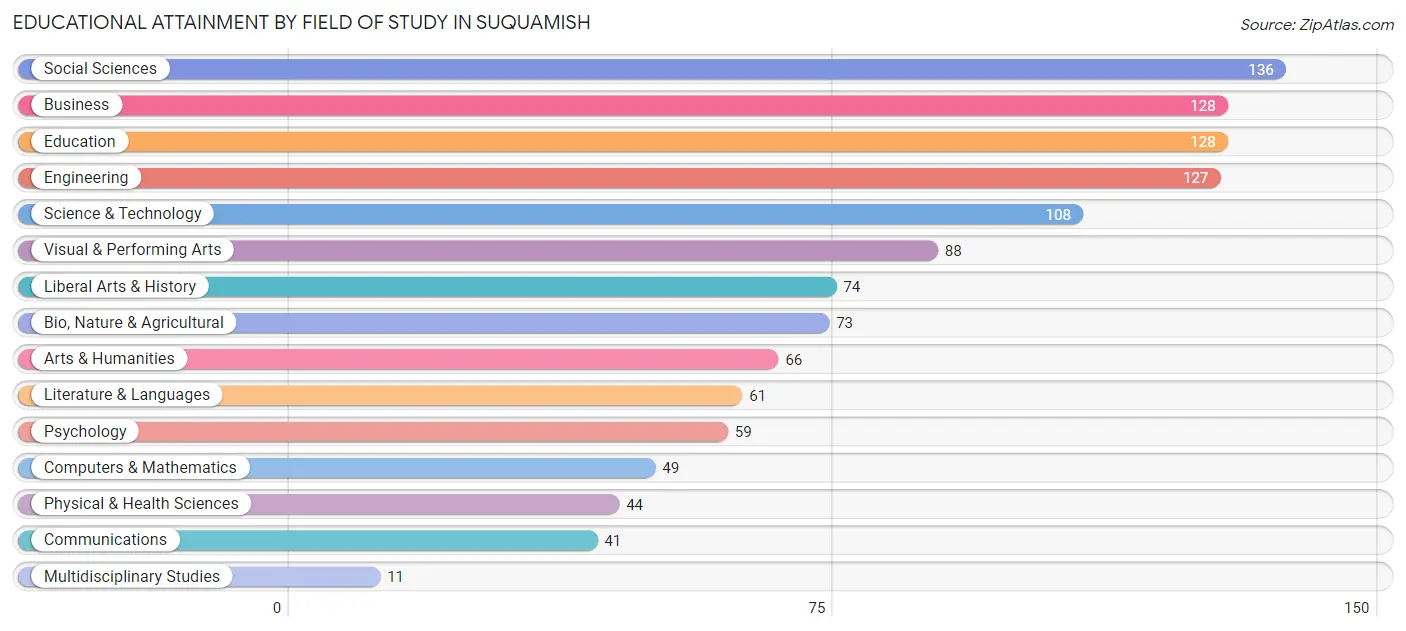
| Field of Study | # Graduates | % Graduates |
| Computers & Mathematics | 49 | 4.1% |
| Bio, Nature & Agricultural | 73 | 6.1% |
| Physical & Health Sciences | 44 | 3.7% |
| Psychology | 59 | 5.0% |
| Social Sciences | 136 | 11.4% |
| Engineering | 127 | 10.6% |
| Multidisciplinary Studies | 11 | 0.9% |
| Science & Technology | 108 | 9.0% |
| Business | 128 | 10.7% |
| Education | 128 | 10.7% |
| Literature & Languages | 61 | 5.1% |
| Liberal Arts & History | 74 | 6.2% |
| Visual & Performing Arts | 88 | 7.4% |
| Communications | 41 | 3.4% |
| Arts & Humanities | 66 | 5.5% |
| Total | 1,193 | 100.0% |
Transportation & Commute in Suquamish
Vehicle Availability by Sex in Suquamish
The most prevalent vehicle ownership categories in Suquamish are males with 2 vehicles (442, accounting for 43.3%) and females with 2 vehicles (416, making up 43.4%).
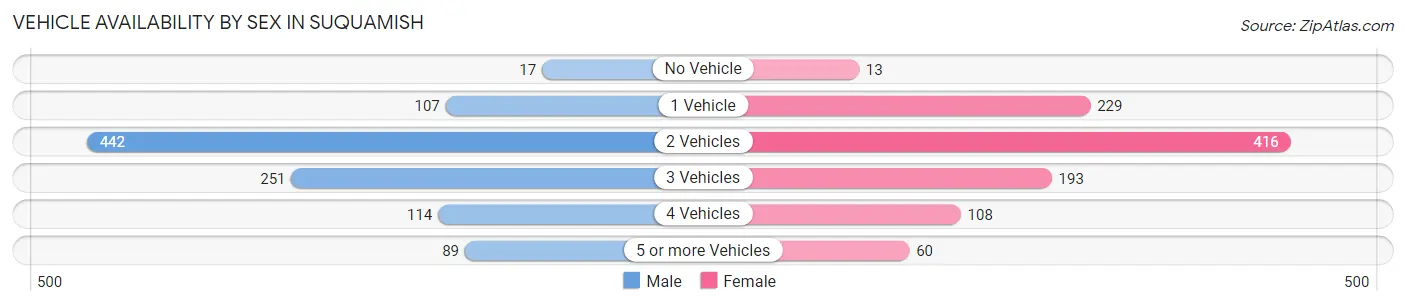
| Vehicles Available | Male | Female |
| No Vehicle | 17 (1.7%) | 13 (1.3%) |
| 1 Vehicle | 107 (10.5%) | 229 (22.5%) |
| 2 Vehicles | 442 (43.3%) | 416 (40.8%) |
| 3 Vehicles | 251 (24.6%) | 193 (18.9%) |
| 4 Vehicles | 114 (11.2%) | 108 (10.6%) |
| 5 or more Vehicles | 89 (8.7%) | 60 (5.9%) |
| Total | 1,020 (100.0%) | 1,019 (100.0%) |
Commute Time in Suquamish
The most frequently occuring commute durations in Suquamish are 20 to 24 minutes (320 commuters, 18.3%), 15 to 19 minutes (313 commuters, 17.9%), and 10 to 14 minutes (193 commuters, 11.0%).
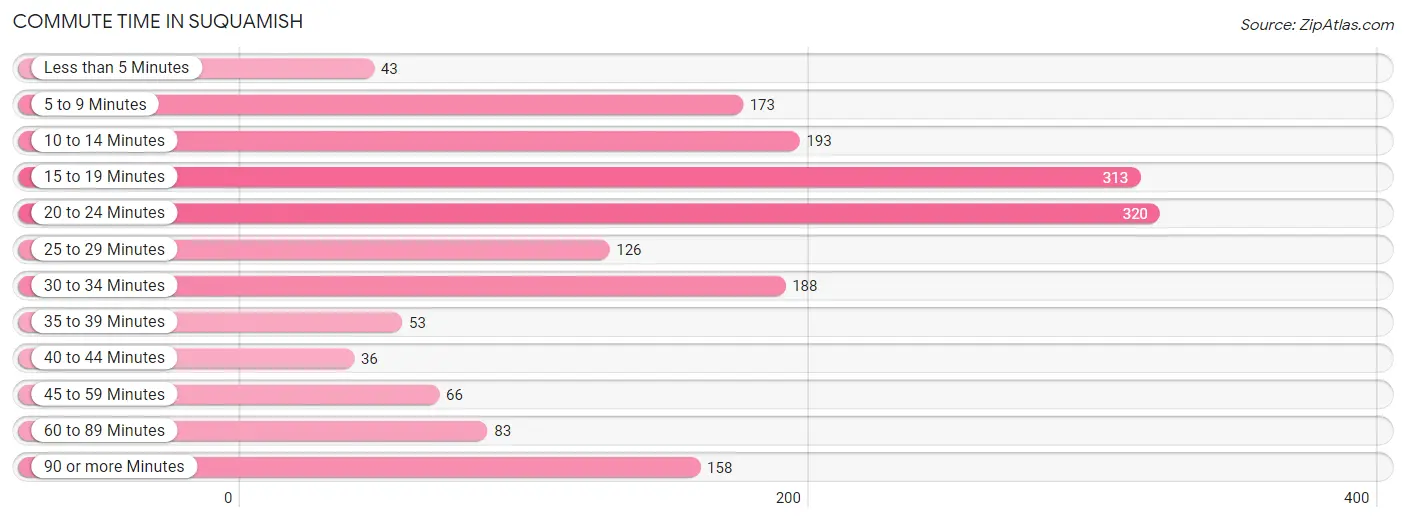
| Commute Time | # Commuters | % Commuters |
| Less than 5 Minutes | 43 | 2.5% |
| 5 to 9 Minutes | 173 | 9.9% |
| 10 to 14 Minutes | 193 | 11.0% |
| 15 to 19 Minutes | 313 | 17.9% |
| 20 to 24 Minutes | 320 | 18.3% |
| 25 to 29 Minutes | 126 | 7.2% |
| 30 to 34 Minutes | 188 | 10.7% |
| 35 to 39 Minutes | 53 | 3.0% |
| 40 to 44 Minutes | 36 | 2.1% |
| 45 to 59 Minutes | 66 | 3.8% |
| 60 to 89 Minutes | 83 | 4.7% |
| 90 or more Minutes | 158 | 9.0% |
Commute Time by Sex in Suquamish
The most common commute times in Suquamish are 15 to 19 minutes (155 commuters, 17.6%) for males and 20 to 24 minutes (165 commuters, 18.9%) for females.
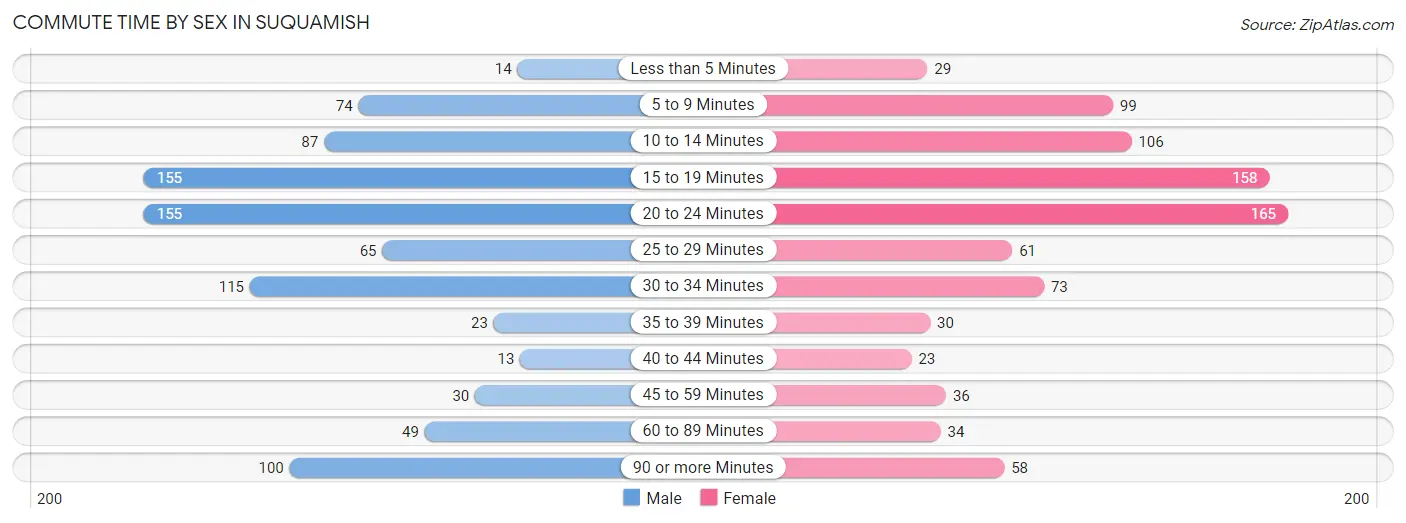
| Commute Time | Male | Female |
| Less than 5 Minutes | 14 (1.6%) | 29 (3.3%) |
| 5 to 9 Minutes | 74 (8.4%) | 99 (11.4%) |
| 10 to 14 Minutes | 87 (9.9%) | 106 (12.2%) |
| 15 to 19 Minutes | 155 (17.6%) | 158 (18.1%) |
| 20 to 24 Minutes | 155 (17.6%) | 165 (18.9%) |
| 25 to 29 Minutes | 65 (7.4%) | 61 (7.0%) |
| 30 to 34 Minutes | 115 (13.1%) | 73 (8.4%) |
| 35 to 39 Minutes | 23 (2.6%) | 30 (3.4%) |
| 40 to 44 Minutes | 13 (1.5%) | 23 (2.6%) |
| 45 to 59 Minutes | 30 (3.4%) | 36 (4.1%) |
| 60 to 89 Minutes | 49 (5.6%) | 34 (3.9%) |
| 90 or more Minutes | 100 (11.4%) | 58 (6.7%) |
Time of Departure to Work by Sex in Suquamish
The most frequent times of departure to work in Suquamish are 7:00 AM to 7:29 AM (113, 12.8%) for males and 7:30 AM to 7:59 AM (135, 15.5%) for females.
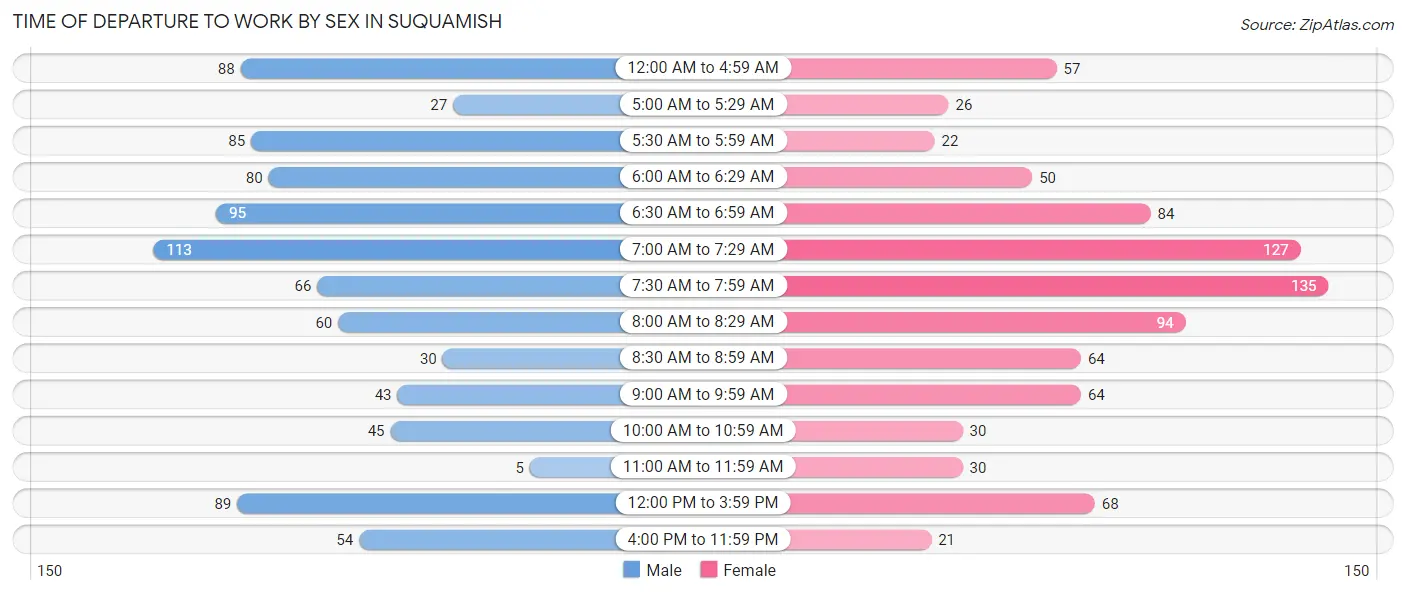
| Time of Departure | Male | Female |
| 12:00 AM to 4:59 AM | 88 (10.0%) | 57 (6.5%) |
| 5:00 AM to 5:29 AM | 27 (3.1%) | 26 (3.0%) |
| 5:30 AM to 5:59 AM | 85 (9.7%) | 22 (2.5%) |
| 6:00 AM to 6:29 AM | 80 (9.1%) | 50 (5.7%) |
| 6:30 AM to 6:59 AM | 95 (10.8%) | 84 (9.6%) |
| 7:00 AM to 7:29 AM | 113 (12.8%) | 127 (14.6%) |
| 7:30 AM to 7:59 AM | 66 (7.5%) | 135 (15.5%) |
| 8:00 AM to 8:29 AM | 60 (6.8%) | 94 (10.8%) |
| 8:30 AM to 8:59 AM | 30 (3.4%) | 64 (7.3%) |
| 9:00 AM to 9:59 AM | 43 (4.9%) | 64 (7.3%) |
| 10:00 AM to 10:59 AM | 45 (5.1%) | 30 (3.4%) |
| 11:00 AM to 11:59 AM | 5 (0.6%) | 30 (3.4%) |
| 12:00 PM to 3:59 PM | 89 (10.1%) | 68 (7.8%) |
| 4:00 PM to 11:59 PM | 54 (6.1%) | 21 (2.4%) |
| Total | 880 (100.0%) | 872 (100.0%) |
Housing Occupancy in Suquamish
Occupancy by Ownership in Suquamish
Of the total 1,835 dwellings in Suquamish, owner-occupied units account for 1,423 (77.5%), while renter-occupied units make up 412 (22.5%).
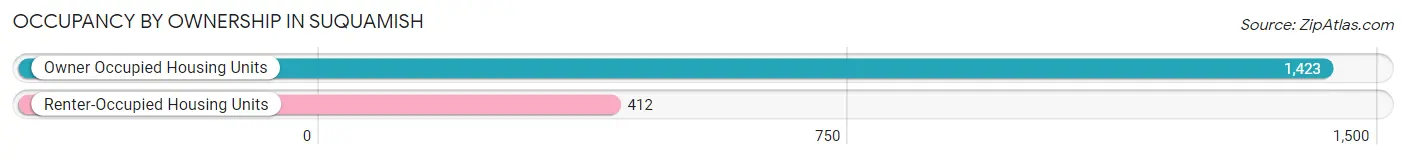
| Occupancy | # Housing Units | % Housing Units |
| Owner Occupied Housing Units | 1,423 | 77.5% |
| Renter-Occupied Housing Units | 412 | 22.5% |
| Total Occupied Housing Units | 1,835 | 100.0% |
Occupancy by Household Size in Suquamish
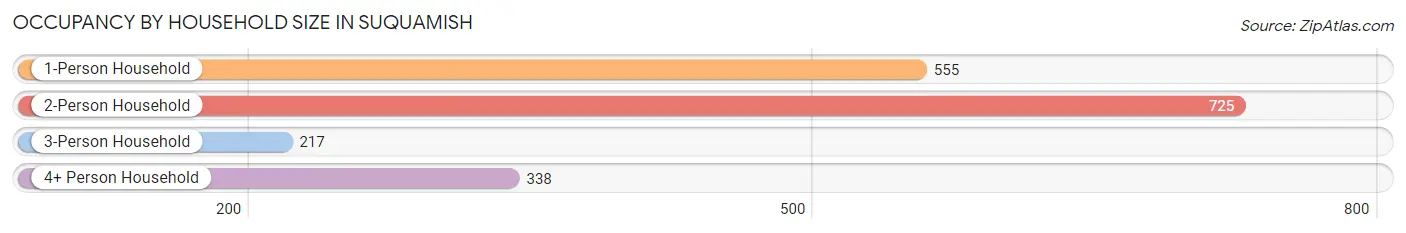
| Household Size | # Housing Units | % Housing Units |
| 1-Person Household | 555 | 30.2% |
| 2-Person Household | 725 | 39.5% |
| 3-Person Household | 217 | 11.8% |
| 4+ Person Household | 338 | 18.4% |
| Total Housing Units | 1,835 | 100.0% |
Occupancy by Ownership by Household Size in Suquamish
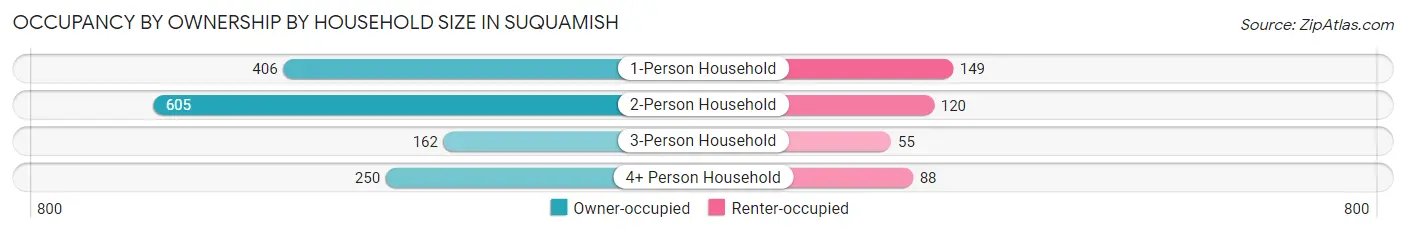
| Household Size | Owner-occupied | Renter-occupied |
| 1-Person Household | 406 (73.2%) | 149 (26.9%) |
| 2-Person Household | 605 (83.5%) | 120 (16.6%) |
| 3-Person Household | 162 (74.7%) | 55 (25.4%) |
| 4+ Person Household | 250 (74.0%) | 88 (26.0%) |
| Total Housing Units | 1,423 (77.5%) | 412 (22.5%) |
Occupancy by Educational Attainment in Suquamish
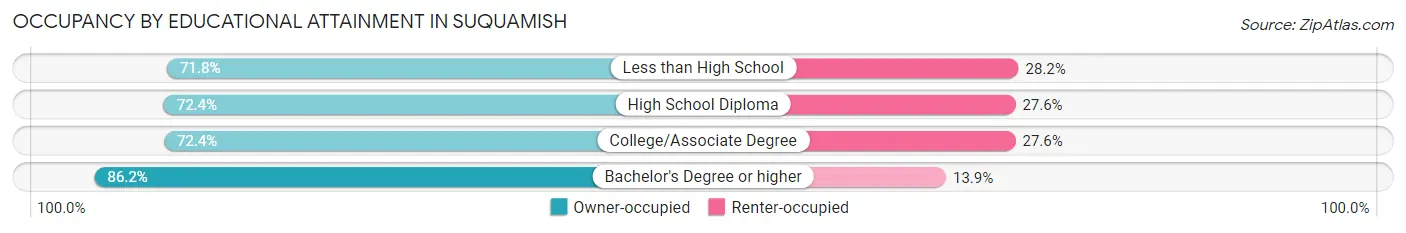
| Household Size | Owner-occupied | Renter-occupied |
| Less than High School | 61 (71.8%) | 24 (28.2%) |
| High School Diploma | 236 (72.4%) | 90 (27.6%) |
| College/Associate Degree | 529 (72.4%) | 202 (27.6%) |
| Bachelor's Degree or higher | 597 (86.2%) | 96 (13.9%) |
Occupancy by Age of Householder in Suquamish
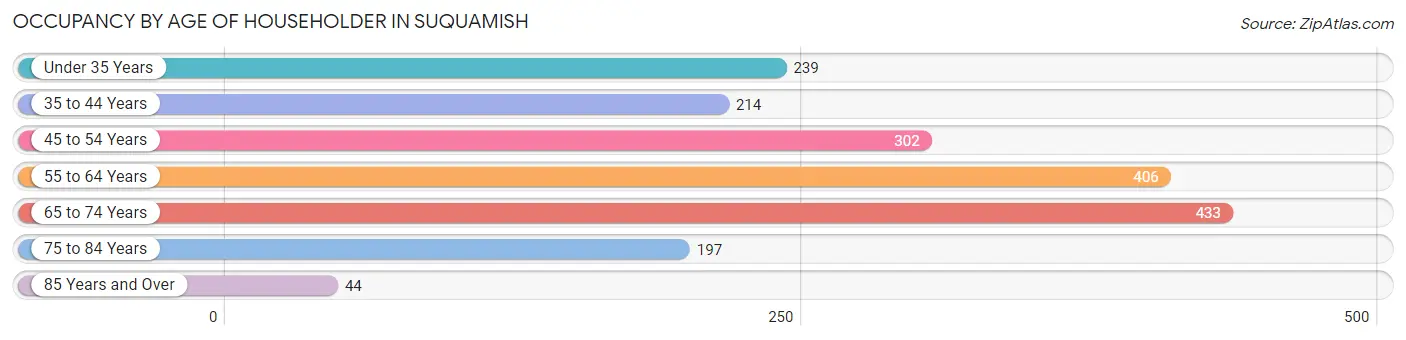
| Age Bracket | # Households | % Households |
| Under 35 Years | 239 | 13.0% |
| 35 to 44 Years | 214 | 11.7% |
| 45 to 54 Years | 302 | 16.5% |
| 55 to 64 Years | 406 | 22.1% |
| 65 to 74 Years | 433 | 23.6% |
| 75 to 84 Years | 197 | 10.7% |
| 85 Years and Over | 44 | 2.4% |
| Total | 1,835 | 100.0% |
Housing Finances in Suquamish
Median Income by Occupancy in Suquamish
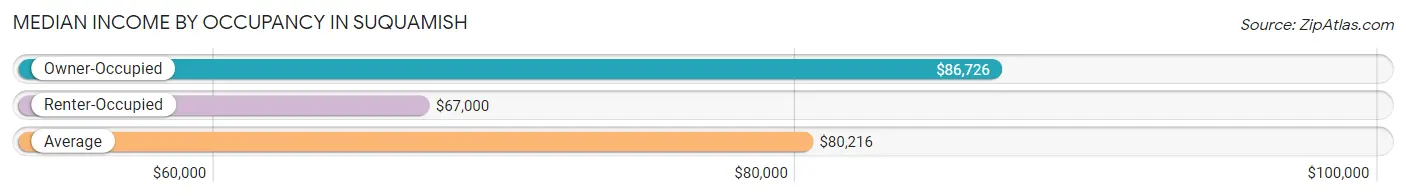
| Occupancy Type | # Households | Median Income |
| Owner-Occupied | 1,423 (77.5%) | $86,726 |
| Renter-Occupied | 412 (22.5%) | $67,000 |
| Average | 1,835 (100.0%) | $80,216 |
Occupancy by Householder Income Bracket in Suquamish
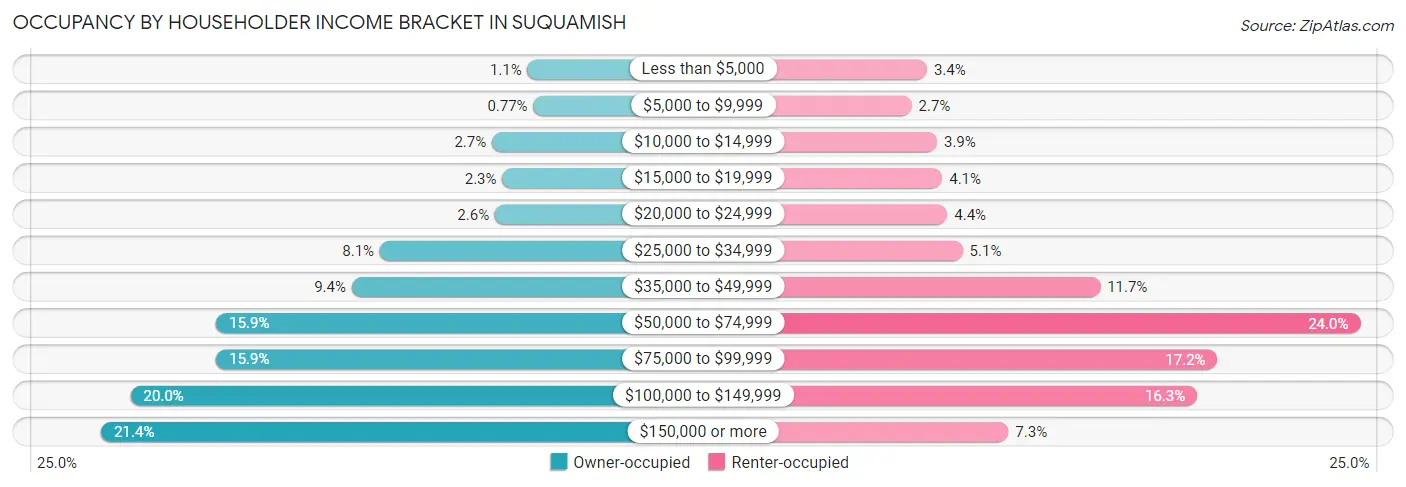
| Income Bracket | Owner-occupied | Renter-occupied |
| Less than $5,000 | 15 (1.1%) | 14 (3.4%) |
| $5,000 to $9,999 | 11 (0.8%) | 11 (2.7%) |
| $10,000 to $14,999 | 39 (2.7%) | 16 (3.9%) |
| $15,000 to $19,999 | 32 (2.2%) | 17 (4.1%) |
| $20,000 to $24,999 | 37 (2.6%) | 18 (4.4%) |
| $25,000 to $34,999 | 115 (8.1%) | 21 (5.1%) |
| $35,000 to $49,999 | 134 (9.4%) | 48 (11.7%) |
| $50,000 to $74,999 | 226 (15.9%) | 99 (24.0%) |
| $75,000 to $99,999 | 226 (15.9%) | 71 (17.2%) |
| $100,000 to $149,999 | 284 (20.0%) | 67 (16.3%) |
| $150,000 or more | 304 (21.4%) | 30 (7.3%) |
| Total | 1,423 (100.0%) | 412 (100.0%) |
Monthly Housing Cost Tiers in Suquamish
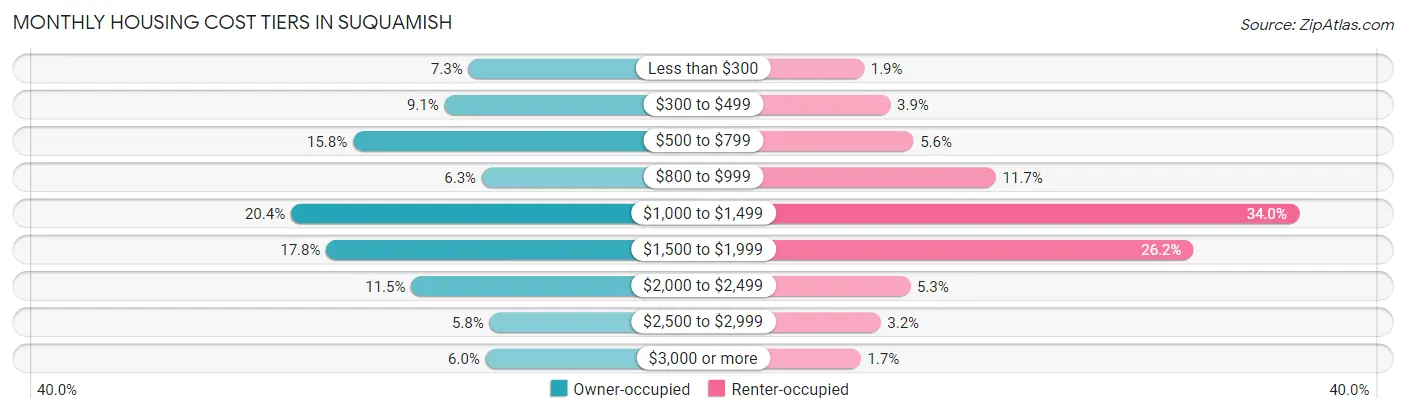
| Monthly Cost | Owner-occupied | Renter-occupied |
| Less than $300 | 104 (7.3%) | 8 (1.9%) |
| $300 to $499 | 129 (9.1%) | 16 (3.9%) |
| $500 to $799 | 225 (15.8%) | 23 (5.6%) |
| $800 to $999 | 90 (6.3%) | 48 (11.7%) |
| $1,000 to $1,499 | 290 (20.4%) | 140 (34.0%) |
| $1,500 to $1,999 | 253 (17.8%) | 108 (26.2%) |
| $2,000 to $2,499 | 164 (11.5%) | 22 (5.3%) |
| $2,500 to $2,999 | 82 (5.8%) | 13 (3.2%) |
| $3,000 or more | 86 (6.0%) | 7 (1.7%) |
| Total | 1,423 (100.0%) | 412 (100.0%) |
Physical Housing Characteristics in Suquamish
Housing Structures in Suquamish
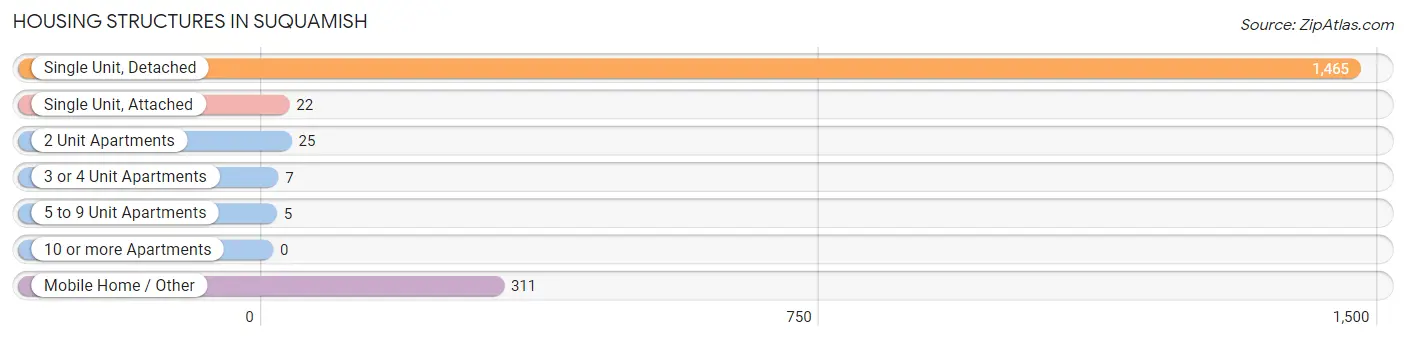
| Structure Type | # Housing Units | % Housing Units |
| Single Unit, Detached | 1,465 | 79.8% |
| Single Unit, Attached | 22 | 1.2% |
| 2 Unit Apartments | 25 | 1.4% |
| 3 or 4 Unit Apartments | 7 | 0.4% |
| 5 to 9 Unit Apartments | 5 | 0.3% |
| 10 or more Apartments | 0 | 0.0% |
| Mobile Home / Other | 311 | 17.0% |
| Total | 1,835 | 100.0% |
Housing Structures by Occupancy in Suquamish
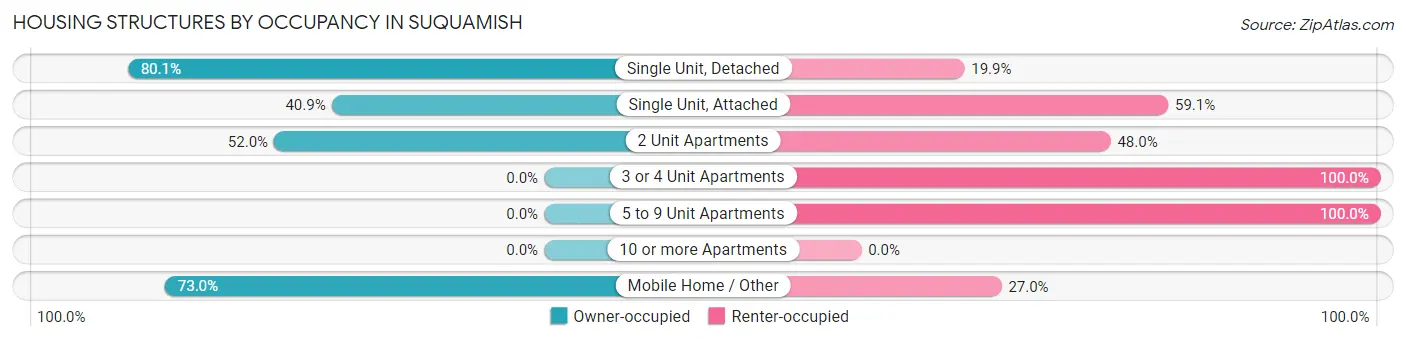
| Structure Type | Owner-occupied | Renter-occupied |
| Single Unit, Detached | 1,174 (80.1%) | 291 (19.9%) |
| Single Unit, Attached | 9 (40.9%) | 13 (59.1%) |
| 2 Unit Apartments | 13 (52.0%) | 12 (48.0%) |
| 3 or 4 Unit Apartments | 0 (0.0%) | 7 (100.0%) |
| 5 to 9 Unit Apartments | 0 (0.0%) | 5 (100.0%) |
| 10 or more Apartments | 0 (0.0%) | 0 (0.0%) |
| Mobile Home / Other | 227 (73.0%) | 84 (27.0%) |
| Total | 1,423 (77.5%) | 412 (22.5%) |
Housing Structures by Number of Rooms in Suquamish
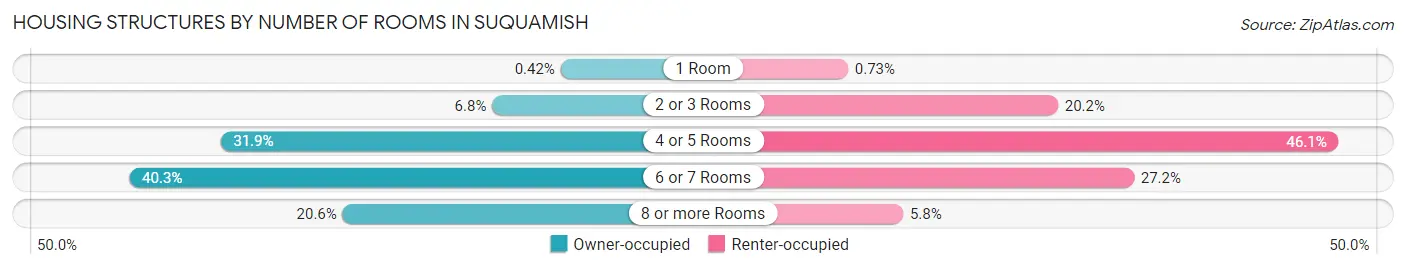
| Number of Rooms | Owner-occupied | Renter-occupied |
| 1 Room | 6 (0.4%) | 3 (0.7%) |
| 2 or 3 Rooms | 96 (6.8%) | 83 (20.2%) |
| 4 or 5 Rooms | 454 (31.9%) | 190 (46.1%) |
| 6 or 7 Rooms | 574 (40.3%) | 112 (27.2%) |
| 8 or more Rooms | 293 (20.6%) | 24 (5.8%) |
| Total | 1,423 (100.0%) | 412 (100.0%) |
Housing Structure by Heating Type in Suquamish
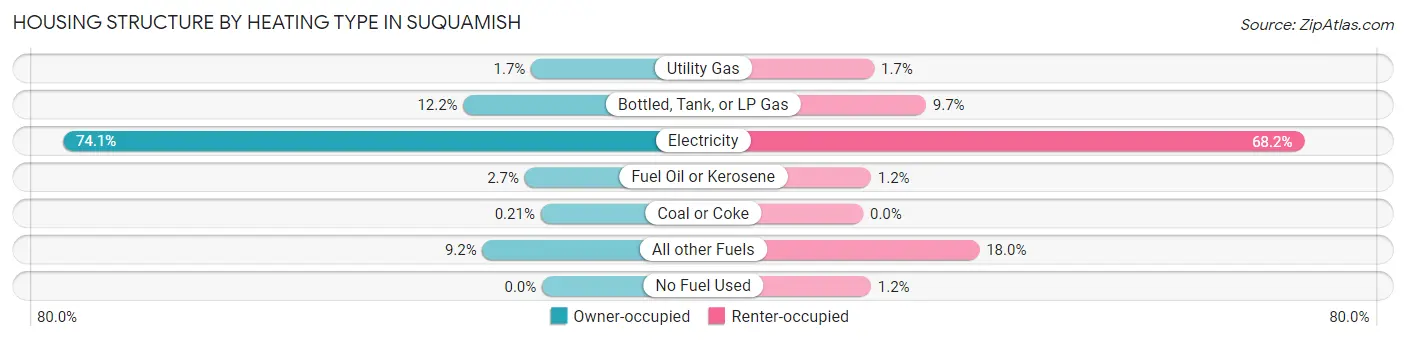
| Heating Type | Owner-occupied | Renter-occupied |
| Utility Gas | 24 (1.7%) | 7 (1.7%) |
| Bottled, Tank, or LP Gas | 173 (12.2%) | 40 (9.7%) |
| Electricity | 1,054 (74.1%) | 281 (68.2%) |
| Fuel Oil or Kerosene | 38 (2.7%) | 5 (1.2%) |
| Coal or Coke | 3 (0.2%) | 0 (0.0%) |
| All other Fuels | 131 (9.2%) | 74 (18.0%) |
| No Fuel Used | 0 (0.0%) | 5 (1.2%) |
| Total | 1,423 (100.0%) | 412 (100.0%) |
Household Vehicle Usage in Suquamish
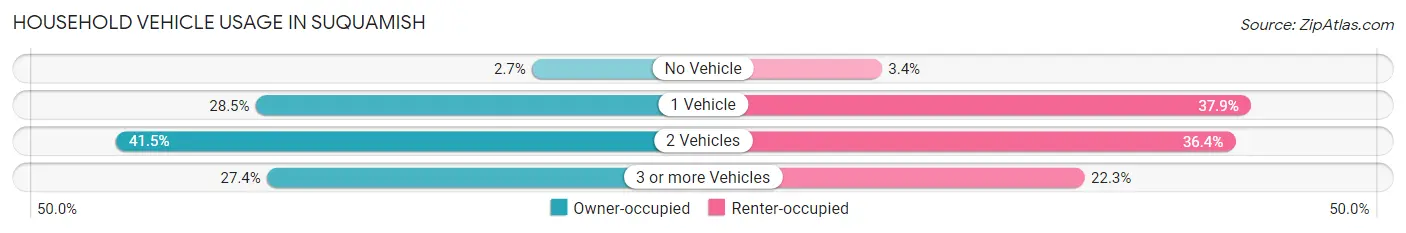
| Vehicles per Household | Owner-occupied | Renter-occupied |
| No Vehicle | 38 (2.7%) | 14 (3.4%) |
| 1 Vehicle | 405 (28.5%) | 156 (37.9%) |
| 2 Vehicles | 590 (41.5%) | 150 (36.4%) |
| 3 or more Vehicles | 390 (27.4%) | 92 (22.3%) |
| Total | 1,423 (100.0%) | 412 (100.0%) |
Real Estate & Mortgages in Suquamish
Real Estate and Mortgage Overview in Suquamish
| Characteristic | Without Mortgage | With Mortgage |
| Housing Units | 633 | 790 |
| Median Property Value | $287,300 | $432,800 |
| Median Household Income | $63,125 | $224 |
| Monthly Housing Costs | $605 | $86 |
| Real Estate Taxes | $2,747 | $49 |
Property Value by Mortgage Status in Suquamish
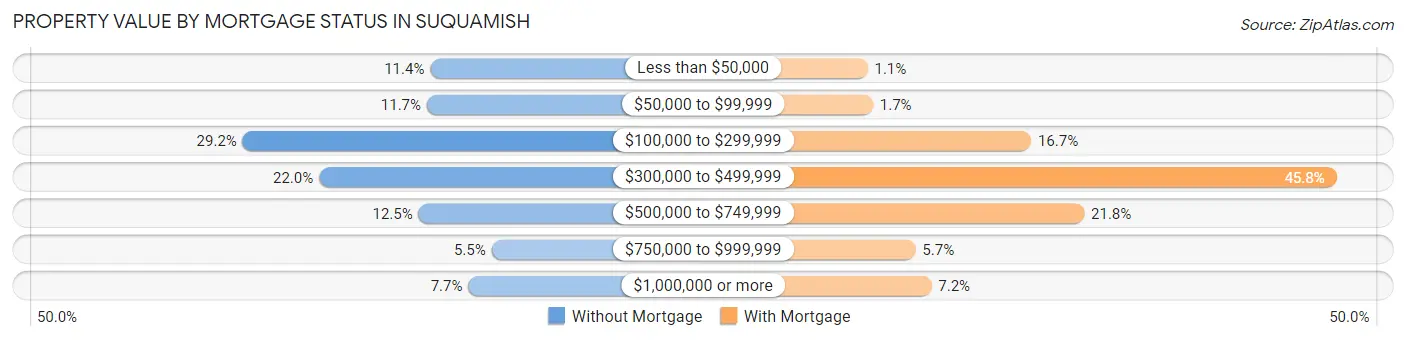
| Property Value | Without Mortgage | With Mortgage |
| Less than $50,000 | 72 (11.4%) | 9 (1.1%) |
| $50,000 to $99,999 | 74 (11.7%) | 13 (1.7%) |
| $100,000 to $299,999 | 185 (29.2%) | 132 (16.7%) |
| $300,000 to $499,999 | 139 (22.0%) | 362 (45.8%) |
| $500,000 to $749,999 | 79 (12.5%) | 172 (21.8%) |
| $750,000 to $999,999 | 35 (5.5%) | 45 (5.7%) |
| $1,000,000 or more | 49 (7.7%) | 57 (7.2%) |
| Total | 633 (100.0%) | 790 (100.0%) |
Household Income by Mortgage Status in Suquamish
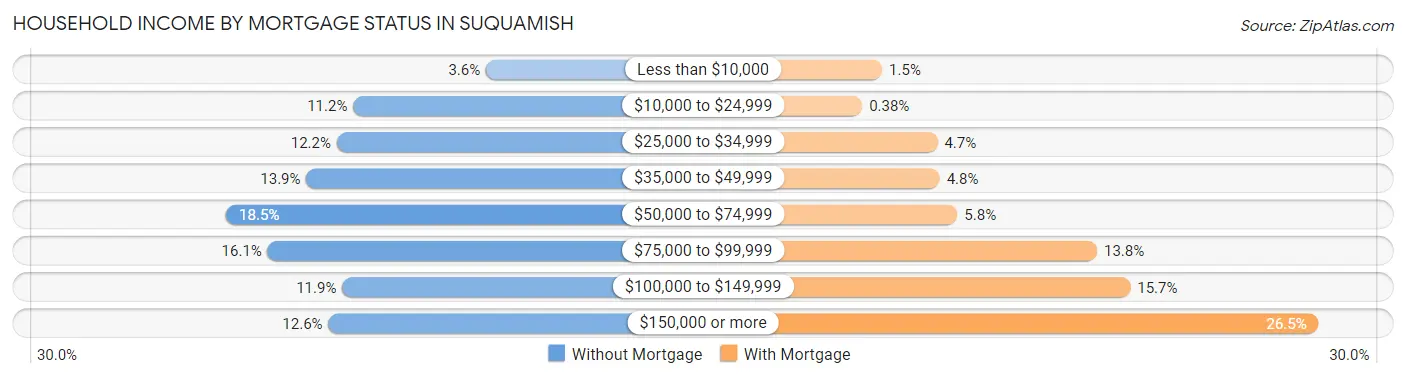
| Household Income | Without Mortgage | With Mortgage |
| Less than $10,000 | 23 (3.6%) | 12 (1.5%) |
| $10,000 to $24,999 | 71 (11.2%) | 3 (0.4%) |
| $25,000 to $34,999 | 77 (12.2%) | 37 (4.7%) |
| $35,000 to $49,999 | 88 (13.9%) | 38 (4.8%) |
| $50,000 to $74,999 | 117 (18.5%) | 46 (5.8%) |
| $75,000 to $99,999 | 102 (16.1%) | 109 (13.8%) |
| $100,000 to $149,999 | 75 (11.8%) | 124 (15.7%) |
| $150,000 or more | 80 (12.6%) | 209 (26.5%) |
| Total | 633 (100.0%) | 790 (100.0%) |
Property Value to Household Income Ratio in Suquamish
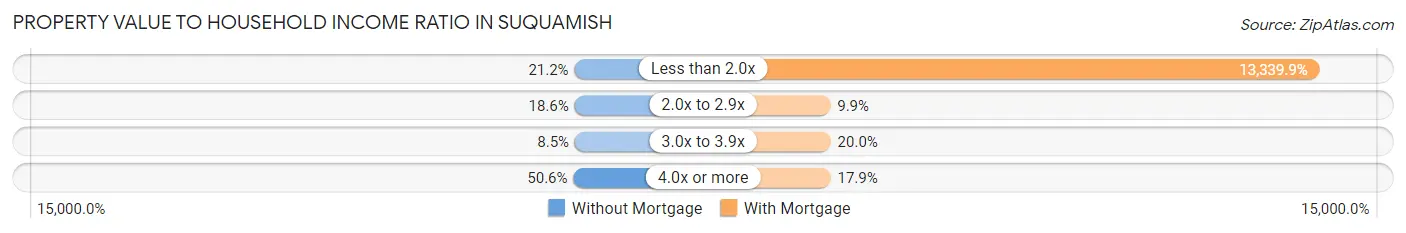
| Value-to-Income Ratio | Without Mortgage | With Mortgage |
| Less than 2.0x | 134 (21.2%) | 105,385 (13,339.9%) |
| 2.0x to 2.9x | 118 (18.6%) | 78 (9.9%) |
| 3.0x to 3.9x | 54 (8.5%) | 158 (20.0%) |
| 4.0x or more | 320 (50.5%) | 141 (17.8%) |
| Total | 633 (100.0%) | 790 (100.0%) |
Real Estate Taxes by Mortgage Status in Suquamish
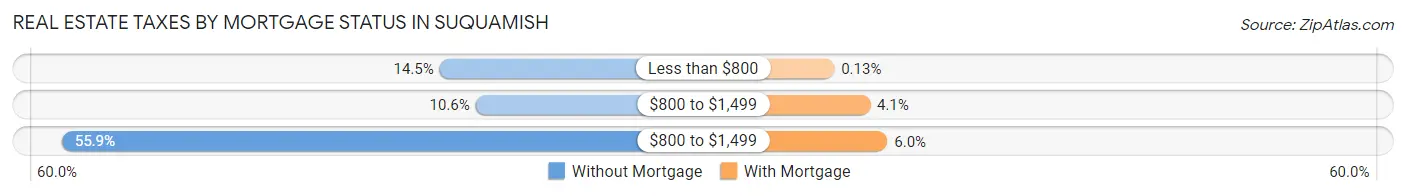
| Property Taxes | Without Mortgage | With Mortgage |
| Less than $800 | 92 (14.5%) | 1 (0.1%) |
| $800 to $1,499 | 67 (10.6%) | 32 (4.1%) |
| $800 to $1,499 | 354 (55.9%) | 47 (5.9%) |
| Total | 633 (100.0%) | 790 (100.0%) |
Health & Disability in Suquamish
Health Insurance Coverage by Age in Suquamish
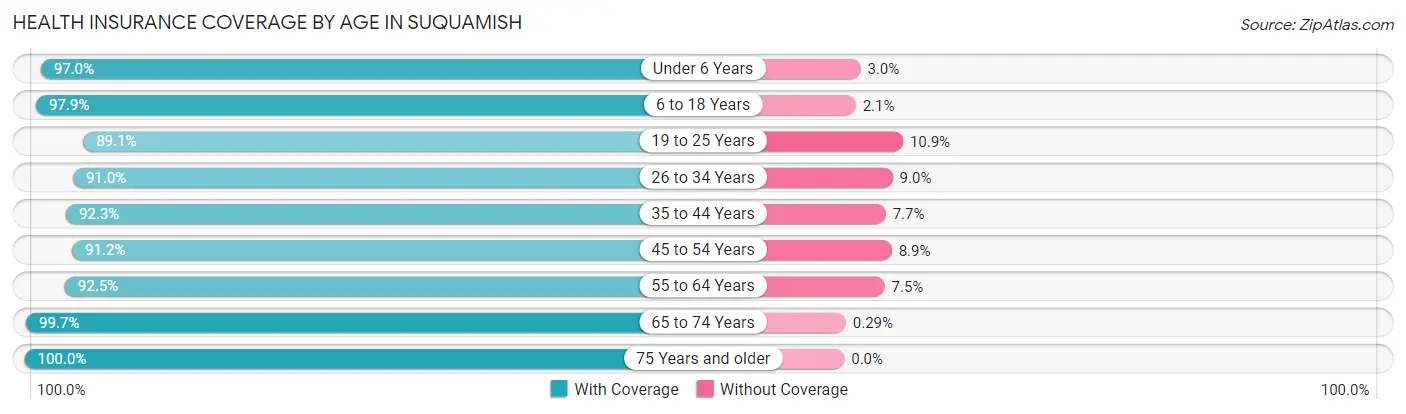
| Age Bracket | With Coverage | Without Coverage |
| Under 6 Years | 192 (97.0%) | 6 (3.0%) |
| 6 to 18 Years | 598 (97.9%) | 13 (2.1%) |
| 19 to 25 Years | 236 (89.1%) | 29 (10.9%) |
| 26 to 34 Years | 444 (91.0%) | 44 (9.0%) |
| 35 to 44 Years | 478 (92.3%) | 40 (7.7%) |
| 45 to 54 Years | 484 (91.1%) | 47 (8.8%) |
| 55 to 64 Years | 627 (92.5%) | 51 (7.5%) |
| 65 to 74 Years | 677 (99.7%) | 2 (0.3%) |
| 75 Years and older | 331 (100.0%) | 0 (0.0%) |
| Total | 4,067 (94.6%) | 232 (5.4%) |
Health Insurance Coverage by Citizenship Status in Suquamish
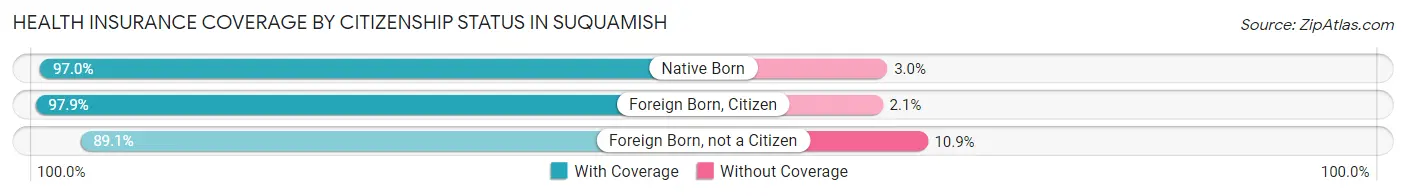
| Citizenship Status | With Coverage | Without Coverage |
| Native Born | 192 (97.0%) | 6 (3.0%) |
| Foreign Born, Citizen | 598 (97.9%) | 13 (2.1%) |
| Foreign Born, not a Citizen | 236 (89.1%) | 29 (10.9%) |
Health Insurance Coverage by Household Income in Suquamish
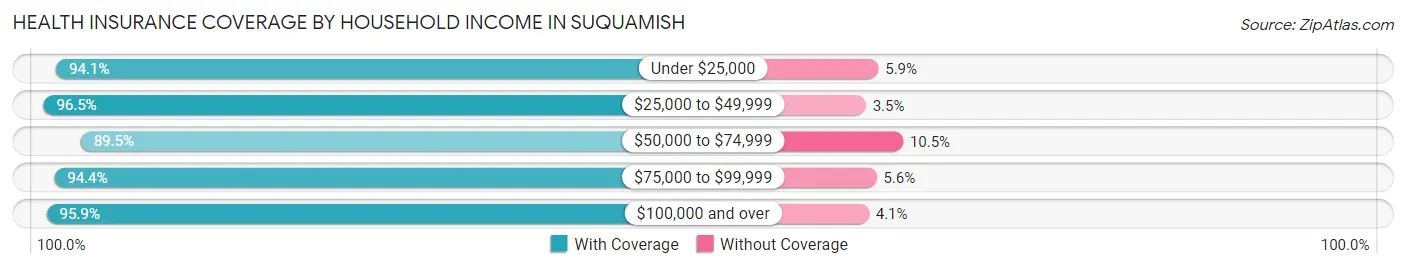
| Household Income | With Coverage | Without Coverage |
| Under $25,000 | 287 (94.1%) | 18 (5.9%) |
| $25,000 to $49,999 | 573 (96.5%) | 21 (3.5%) |
| $50,000 to $74,999 | 604 (89.5%) | 71 (10.5%) |
| $75,000 to $99,999 | 627 (94.4%) | 37 (5.6%) |
| $100,000 and over | 1,976 (95.9%) | 85 (4.1%) |
Public vs Private Health Insurance Coverage by Age in Suquamish
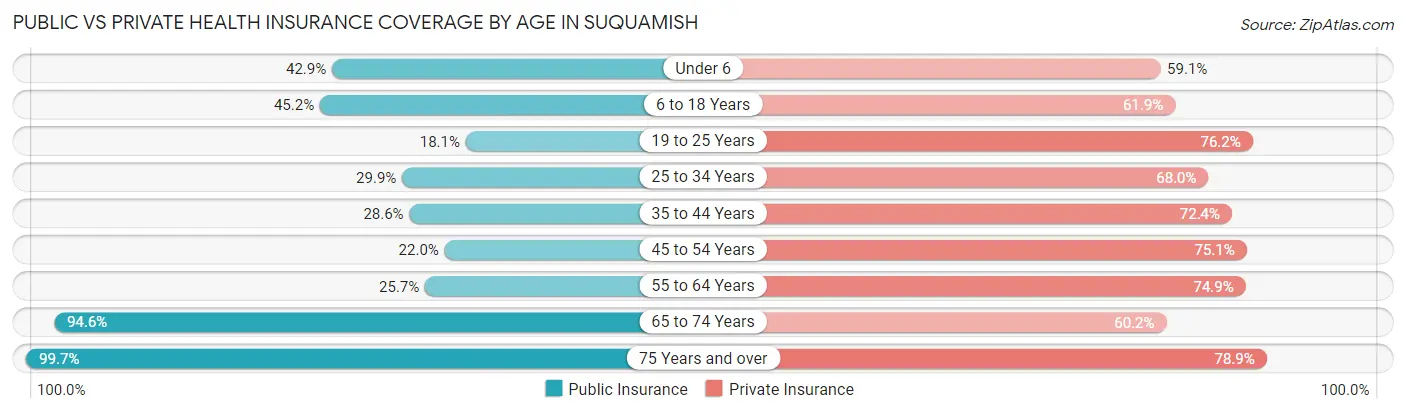
| Age Bracket | Public Insurance | Private Insurance |
| Under 6 | 85 (42.9%) | 117 (59.1%) |
| 6 to 18 Years | 276 (45.2%) | 378 (61.9%) |
| 19 to 25 Years | 48 (18.1%) | 202 (76.2%) |
| 25 to 34 Years | 146 (29.9%) | 332 (68.0%) |
| 35 to 44 Years | 148 (28.6%) | 375 (72.4%) |
| 45 to 54 Years | 117 (22.0%) | 399 (75.1%) |
| 55 to 64 Years | 174 (25.7%) | 508 (74.9%) |
| 65 to 74 Years | 642 (94.6%) | 409 (60.2%) |
| 75 Years and over | 330 (99.7%) | 261 (78.8%) |
| Total | 1,966 (45.7%) | 2,981 (69.3%) |
Disability Status by Sex by Age in Suquamish
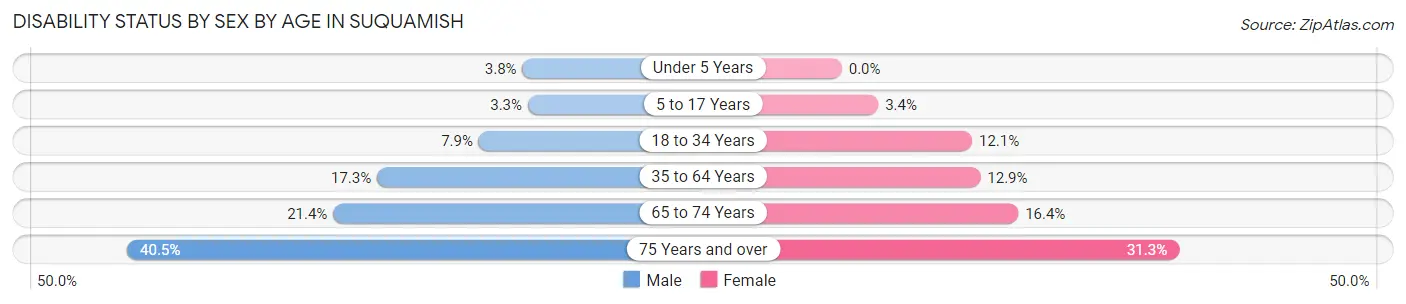
| Age Bracket | Male | Female |
| Under 5 Years | 3 (3.8%) | 0 (0.0%) |
| 5 to 17 Years | 11 (3.3%) | 9 (3.4%) |
| 18 to 34 Years | 30 (7.9%) | 51 (12.1%) |
| 35 to 64 Years | 144 (17.3%) | 115 (12.9%) |
| 65 to 74 Years | 72 (21.4%) | 56 (16.4%) |
| 75 Years and over | 68 (40.5%) | 51 (31.3%) |
Disability Class by Sex by Age in Suquamish
Disability Class: Hearing Difficulty
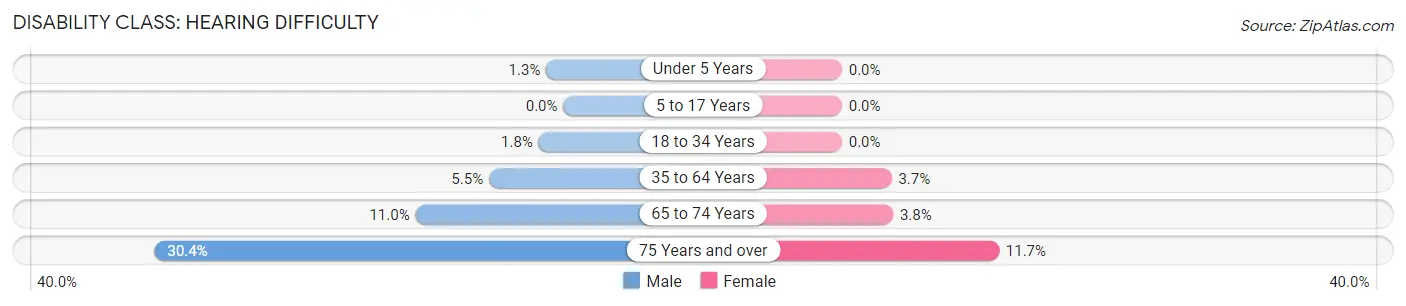
| Age Bracket | Male | Female |
| Under 5 Years | 1 (1.3%) | 0 (0.0%) |
| 5 to 17 Years | 0 (0.0%) | 0 (0.0%) |
| 18 to 34 Years | 7 (1.8%) | 0 (0.0%) |
| 35 to 64 Years | 46 (5.5%) | 33 (3.7%) |
| 65 to 74 Years | 37 (11.0%) | 13 (3.8%) |
| 75 Years and over | 51 (30.4%) | 19 (11.7%) |
Disability Class: Vision Difficulty
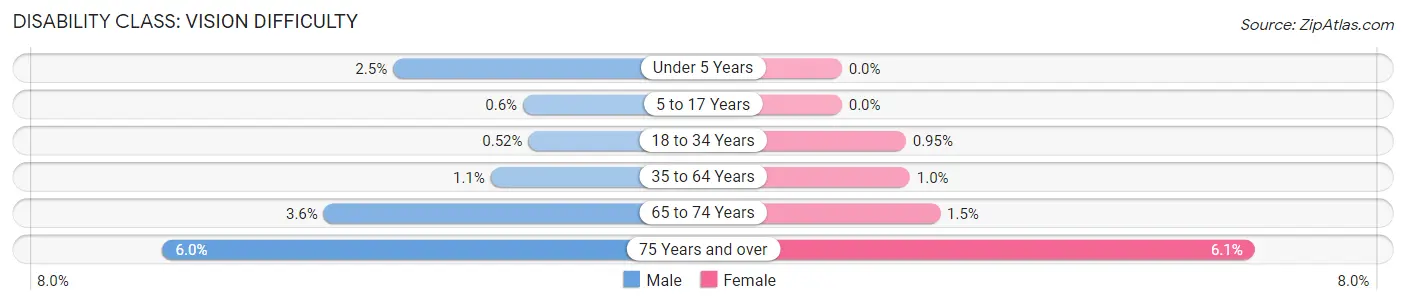
| Age Bracket | Male | Female |
| Under 5 Years | 2 (2.5%) | 0 (0.0%) |
| 5 to 17 Years | 2 (0.6%) | 0 (0.0%) |
| 18 to 34 Years | 2 (0.5%) | 4 (0.9%) |
| 35 to 64 Years | 9 (1.1%) | 9 (1.0%) |
| 65 to 74 Years | 12 (3.6%) | 5 (1.5%) |
| 75 Years and over | 10 (5.9%) | 10 (6.1%) |
Disability Class: Cognitive Difficulty
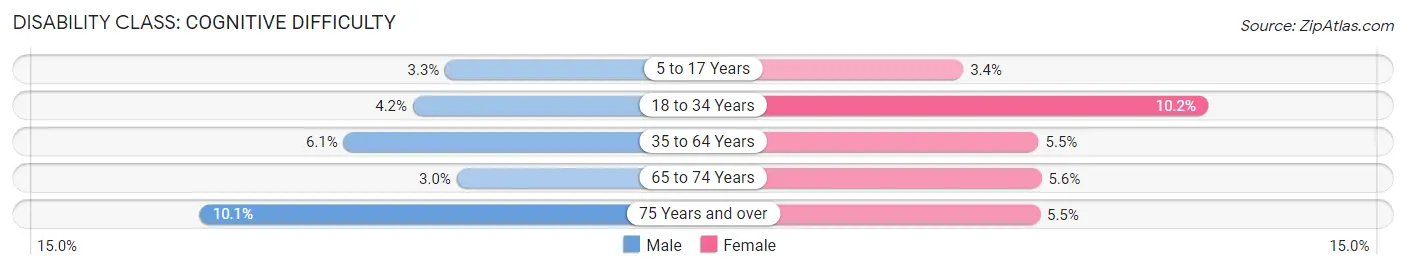
| Age Bracket | Male | Female |
| 5 to 17 Years | 11 (3.3%) | 9 (3.4%) |
| 18 to 34 Years | 16 (4.2%) | 43 (10.2%) |
| 35 to 64 Years | 51 (6.1%) | 49 (5.5%) |
| 65 to 74 Years | 10 (3.0%) | 19 (5.6%) |
| 75 Years and over | 17 (10.1%) | 9 (5.5%) |
Disability Class: Ambulatory Difficulty
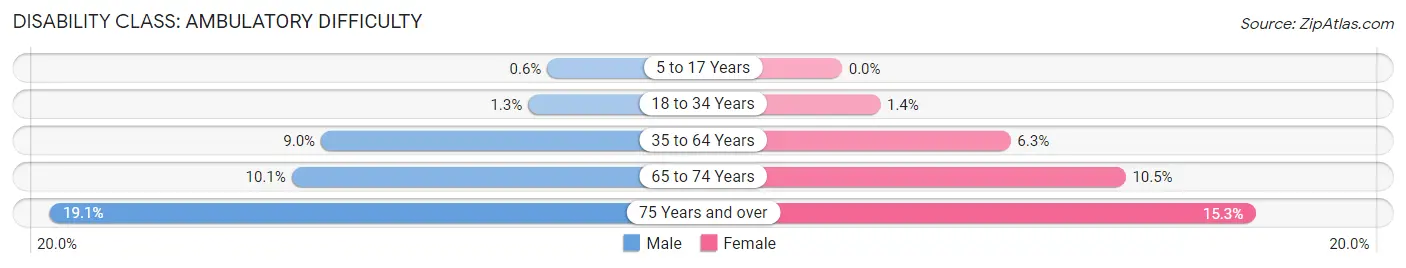
| Age Bracket | Male | Female |
| 5 to 17 Years | 2 (0.6%) | 0 (0.0%) |
| 18 to 34 Years | 5 (1.3%) | 6 (1.4%) |
| 35 to 64 Years | 75 (9.0%) | 56 (6.3%) |
| 65 to 74 Years | 34 (10.1%) | 36 (10.5%) |
| 75 Years and over | 32 (19.1%) | 25 (15.3%) |
Disability Class: Self-Care Difficulty
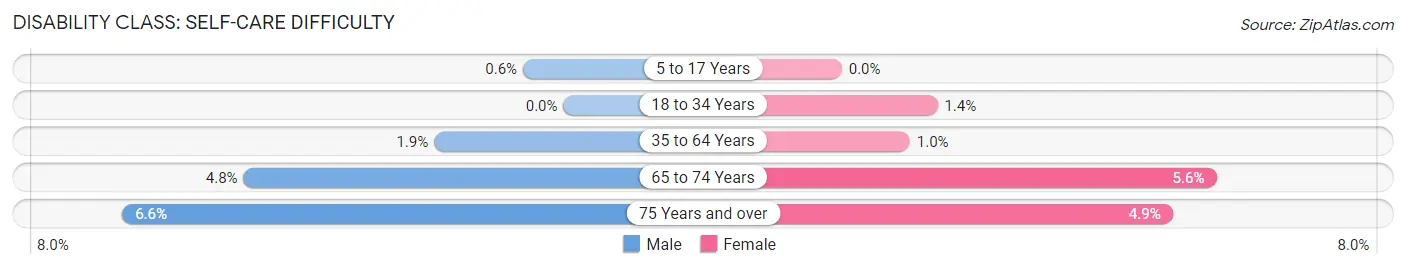
| Age Bracket | Male | Female |
| 5 to 17 Years | 2 (0.6%) | 0 (0.0%) |
| 18 to 34 Years | 0 (0.0%) | 6 (1.4%) |
| 35 to 64 Years | 16 (1.9%) | 9 (1.0%) |
| 65 to 74 Years | 16 (4.8%) | 19 (5.6%) |
| 75 Years and over | 11 (6.6%) | 8 (4.9%) |
Technology Access in Suquamish
Computing Device Access in Suquamish
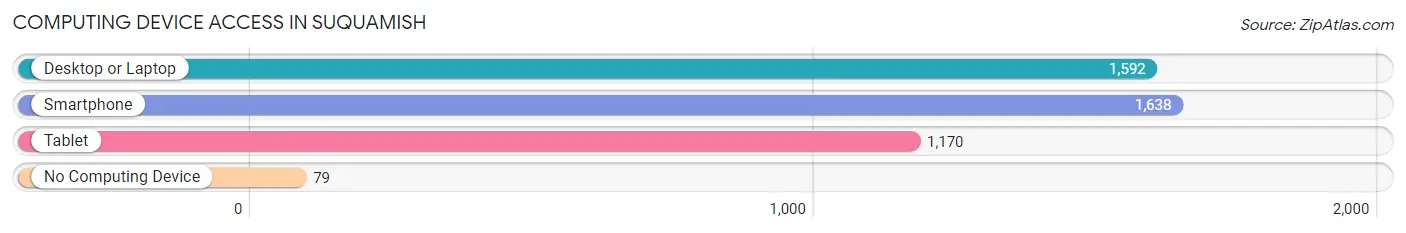
| Device Type | # Households | % Households |
| Desktop or Laptop | 1,592 | 86.8% |
| Smartphone | 1,638 | 89.3% |
| Tablet | 1,170 | 63.8% |
| No Computing Device | 79 | 4.3% |
| Total | 1,835 | 100.0% |
Internet Access in Suquamish
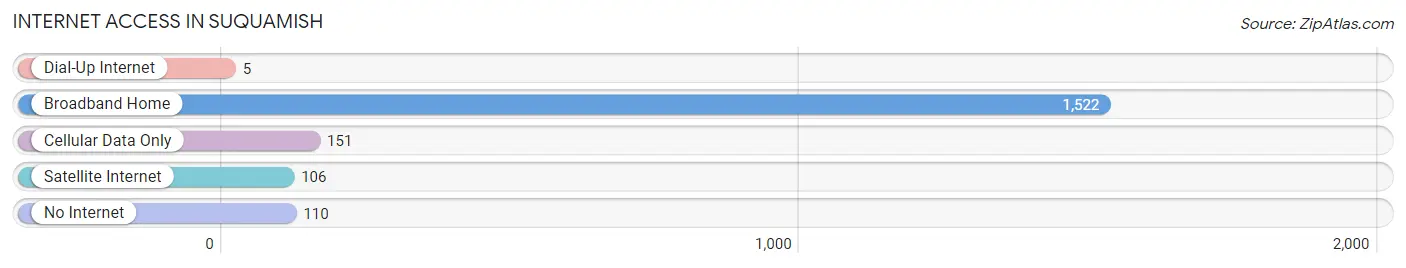
| Internet Type | # Households | % Households |
| Dial-Up Internet | 5 | 0.3% |
| Broadband Home | 1,522 | 82.9% |
| Cellular Data Only | 151 | 8.2% |
| Satellite Internet | 106 | 5.8% |
| No Internet | 110 | 6.0% |
| Total | 1,835 | 100.0% |
Suquamish Summary
Suquamish is a small town located on the Kitsap Peninsula in the Puget Sound region of Washington State. It is located on the eastern shore of the Kitsap Peninsula, just north of the city of Bainbridge Island. The town is part of the Port Madison Indian Reservation, and is home to the Suquamish Tribe, a federally recognized tribe of the Coast Salish people.
Geography
Suquamish is located on the Kitsap Peninsula, which is bordered by the Puget Sound to the west and the Hood Canal to the east. The town is situated on the eastern shore of the Kitsap Peninsula, just north of the city of Bainbridge Island. The town is surrounded by the waters of the Puget Sound, and is home to several small islands, including Agate Passage, Blake Island, and Miller Bay. The town is located in Kitsap County, and is part of the Port Madison Indian Reservation.
The town of Suquamish is located at the mouth of the Suquamish River, which flows into the Puget Sound. The town is situated on a small peninsula, and is surrounded by the waters of the Puget Sound. The town is home to several small islands, including Agate Passage, Blake Island, and Miller Bay.
Economy
The economy of Suquamish is largely based on tourism and fishing. The town is home to several popular tourist attractions, including the Suquamish Museum, the Suquamish Tribal Center, and the Suquamish Clearwater Casino Resort. The town is also home to several marinas, which provide access to the Puget Sound and the surrounding islands.
The town is also home to several commercial fishing operations, which provide a variety of seafood to local restaurants and markets. The town is also home to several boatyards, which provide boat repair and maintenance services.
Demographics
As of the 2010 census, the population of Suquamish was 2,541. The population is primarily Native American, with the Suquamish Tribe making up the majority of the population. The town is also home to a small number of non-Native Americans, primarily of European descent.
The median household income in Suquamish is $45,938, and the median family income is $50,938. The town has a poverty rate of 16.3%, which is higher than the national average.
Conclusion
Suquamish is a small town located on the Kitsap Peninsula in the Puget Sound region of Washington State. It is home to the Suquamish Tribe, a federally recognized tribe of the Coast Salish people. The town is surrounded by the waters of the Puget Sound, and is home to several small islands. The economy of Suquamish is largely based on tourism and fishing, and the town is home to several popular tourist attractions. The population of Suquamish is primarily Native American, with the Suquamish Tribe making up the majority of the population. The median household income in Suquamish is $45,938, and the town has a poverty rate of 16.3%.
Common Questions
What is Per Capita Income in Suquamish?
Per Capita income in Suquamish is $42,872.
What is the Median Family Income in Suquamish?
Median Family Income in Suquamish is $94,955.
What is the Median Household income in Suquamish?
Median Household Income in Suquamish is $80,216.
What is Income or Wage Gap in Suquamish?
Income or Wage Gap in Suquamish is 27.6%.
Women in Suquamish earn 72.4 cents for every dollar earned by a man.
What is Inequality or Gini Index in Suquamish?
Inequality or Gini Index in Suquamish is 0.41.
What is the Total Population of Suquamish?
Total Population of Suquamish is 4,329.
What is the Total Male Population of Suquamish?
Total Male Population of Suquamish is 2,159.
What is the Total Female Population of Suquamish?
Total Female Population of Suquamish is 2,170.
What is the Ratio of Males per 100 Females in Suquamish?
There are 99.49 Males per 100 Females in Suquamish.
What is the Ratio of Females per 100 Males in Suquamish?
There are 100.51 Females per 100 Males in Suquamish.
What is the Median Population Age in Suquamish?
Median Population Age in Suquamish is 46.1 Years.
What is the Average Family Size in Suquamish
Average Family Size in Suquamish is 2.9 People.
What is the Average Household Size in Suquamish
Average Household Size in Suquamish is 2.4 People.
How Large is the Labor Force in Suquamish?
There are 2,203 People in the Labor Forcein in Suquamish.
What is the Percentage of People in the Labor Force in Suquamish?
60.4% of People are in the Labor Force in Suquamish.
What is the Unemployment Rate in Suquamish?
Unemployment Rate in Suquamish is 5.8%.