Thorp, WA Map & Demographics
Thorp Map
Thorp Overview
$39,111
PER CAPITA INCOME
$62,500
AVG HOUSEHOLD INCOME
0.46
INEQUALITY / GINI INDEX
90
TOTAL POPULATION
55
MALE POPULATION
35
FEMALE POPULATION
157.14
MALES / 100 FEMALES
63.64
FEMALES / 100 MALES
61.5
MEDIAN AGE
2.7
AVG FAMILY SIZE
1.8
AVG HOUSEHOLD SIZE
47
LABOR FORCE [ PEOPLE ]
56.0%
PERCENT IN LABOR FORCE
12.8%
UNEMPLOYMENT RATE
Thorp Zip Codes
Thorp Area Codes
Income in Thorp
Income Overview in Thorp
| Characteristic | Number | Measure |
| Per Capita Income | 90 | $39,111 |
| Median Family Income | 23 | $0 |
| Mean Family Income | 23 | $105,970 |
| Median Household Income | 50 | $62,500 |
| Mean Household Income | 50 | $80,094 |
| Income Deficit | 23 | $0 |
| Wage / Income Gap (%) | 90 | 0.00% |
| Wage / Income Gap ($) | 90 | 100.00¢ per $1 |
| Gini / Inequality Index | 90 | 0.46 |
Earnings by Sex in Thorp
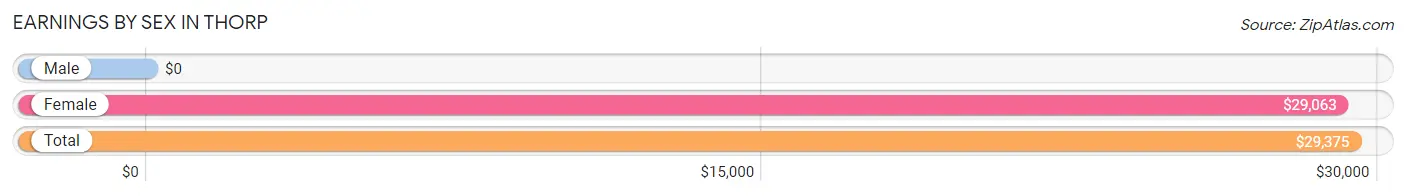
| Sex | Number | Average Earnings |
| Male | 31 (55.4%) | $0 |
| Female | 25 (44.6%) | $29,063 |
| Total | 56 (100.0%) | $29,375 |
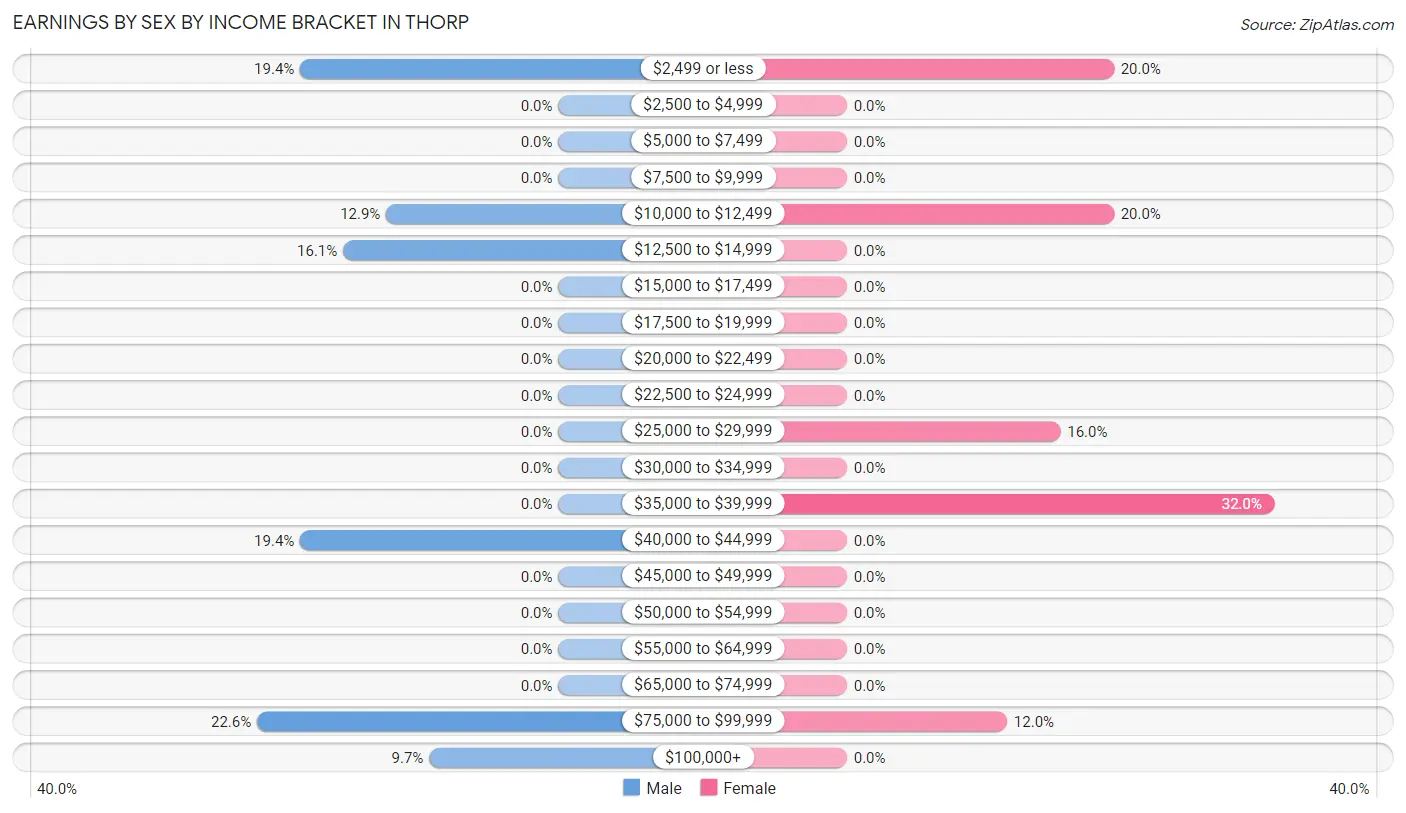
Earnings by Sex by Income Bracket in Thorp
The most common earnings brackets in Thorp are $75,000 to $99,999 for men (7 | 22.6%) and $35,000 to $39,999 for women (8 | 32.0%).
| Income | Male | Female |
| $2,499 or less | 6 (19.4%) | 5 (20.0%) |
| $2,500 to $4,999 | 0 (0.0%) | 0 (0.0%) |
| $5,000 to $7,499 | 0 (0.0%) | 0 (0.0%) |
| $7,500 to $9,999 | 0 (0.0%) | 0 (0.0%) |
| $10,000 to $12,499 | 4 (12.9%) | 5 (20.0%) |
| $12,500 to $14,999 | 5 (16.1%) | 0 (0.0%) |
| $15,000 to $17,499 | 0 (0.0%) | 0 (0.0%) |
| $17,500 to $19,999 | 0 (0.0%) | 0 (0.0%) |
| $20,000 to $22,499 | 0 (0.0%) | 0 (0.0%) |
| $22,500 to $24,999 | 0 (0.0%) | 0 (0.0%) |
| $25,000 to $29,999 | 0 (0.0%) | 4 (16.0%) |
| $30,000 to $34,999 | 0 (0.0%) | 0 (0.0%) |
| $35,000 to $39,999 | 0 (0.0%) | 8 (32.0%) |
| $40,000 to $44,999 | 6 (19.4%) | 0 (0.0%) |
| $45,000 to $49,999 | 0 (0.0%) | 0 (0.0%) |
| $50,000 to $54,999 | 0 (0.0%) | 0 (0.0%) |
| $55,000 to $64,999 | 0 (0.0%) | 0 (0.0%) |
| $65,000 to $74,999 | 0 (0.0%) | 0 (0.0%) |
| $75,000 to $99,999 | 7 (22.6%) | 3 (12.0%) |
| $100,000+ | 3 (9.7%) | 0 (0.0%) |
| Total | 31 (100.0%) | 25 (100.0%) |
Earnings by Sex by Educational Attainment in Thorp
| Educational Attainment | Male Income | Female Income |
| Less than High School | - | - |
| High School Diploma | - | - |
| College or Associate's Degree | - | - |
| Bachelor's Degree | - | - |
| Graduate Degree | - | - |
| Total | - | - |
Family Income in Thorp
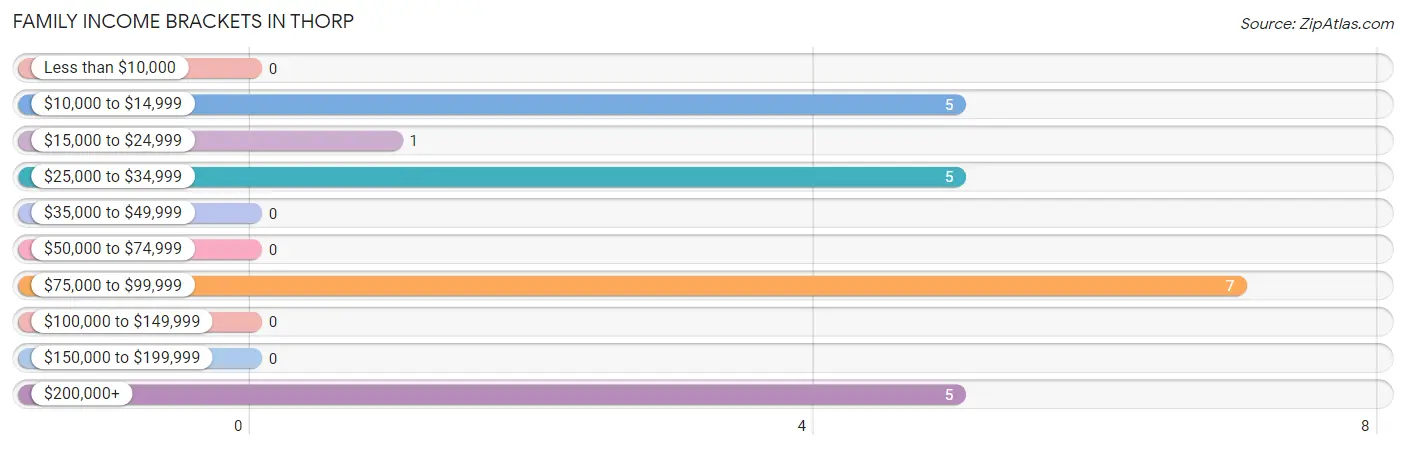
Family Income Brackets in Thorp
According to the Thorp family income data, there are 7 families falling into the $75,000 to $99,999 income range, which is the most common income bracket and makes up 30.4% of all families.
| Income Bracket | # Families | % Families |
| Less than $10,000 | 0 | 0.0% |
| $10,000 to $14,999 | 5 | 21.7% |
| $15,000 to $24,999 | 1 | 4.3% |
| $25,000 to $34,999 | 5 | 21.7% |
| $35,000 to $49,999 | 0 | 0.0% |
| $50,000 to $74,999 | 0 | 0.0% |
| $75,000 to $99,999 | 7 | 30.4% |
| $100,000 to $149,999 | 0 | 0.0% |
| $150,000 to $199,999 | 0 | 0.0% |
| $200,000+ | 5 | 21.7% |
Family Income by Famaliy Size in Thorp
| Income Bracket | # Families | Median Income |
| 2-Person Families | 13 (56.5%) | $0 |
| 3-Person Families | 0 (0.0%) | $0 |
| 4-Person Families | 5 (21.7%) | $0 |
| 5-Person Families | 5 (21.7%) | $0 |
| 6-Person Families | 0 (0.0%) | $0 |
| 7+ Person Families | 0 (0.0%) | $0 |
| Total | 23 (100.0%) | $0 |
Family Income by Number of Earners in Thorp
| Number of Earners | # Families | Median Income |
| No Earners | 2 (8.7%) | $0 |
| 1 Earner | 5 (21.7%) | $0 |
| 2 Earners | 11 (47.8%) | $0 |
| 3+ Earners | 5 (21.7%) | $0 |
| Total | 23 (100.0%) | $0 |
Household Income in Thorp
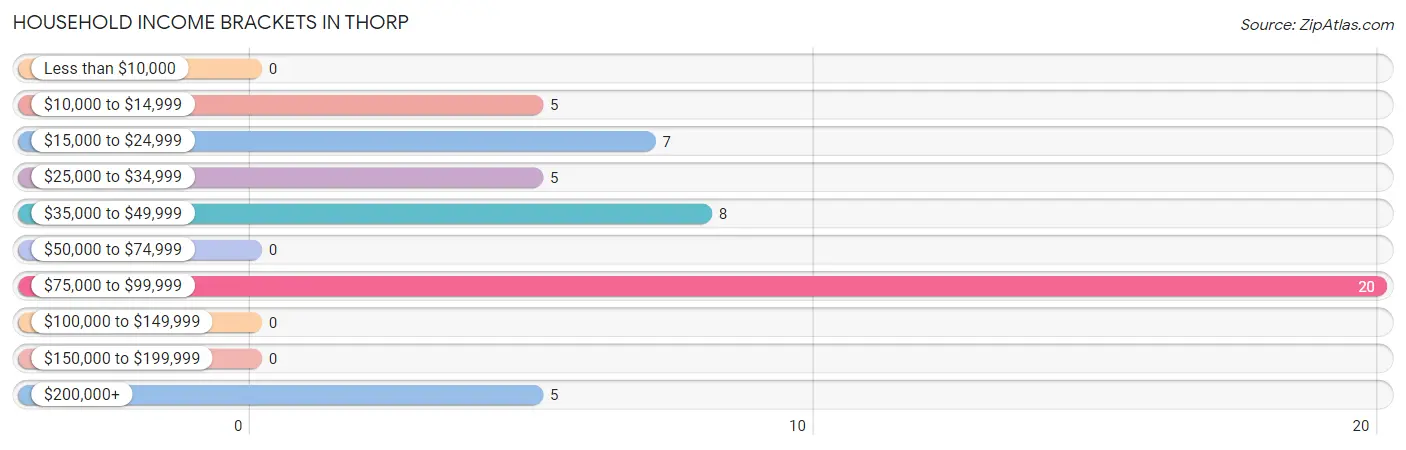
Household Income Brackets in Thorp
With 20 households falling in the category, the $75,000 to $99,999 income range is the most frequent in Thorp, accounting for 40.0% of all households.
| Income Bracket | # Households | % Households |
| Less than $10,000 | 0 | 0.0% |
| $10,000 to $14,999 | 5 | 10.0% |
| $15,000 to $24,999 | 7 | 14.0% |
| $25,000 to $34,999 | 5 | 10.0% |
| $35,000 to $49,999 | 8 | 16.0% |
| $50,000 to $74,999 | 0 | 0.0% |
| $75,000 to $99,999 | 20 | 40.0% |
| $100,000 to $149,999 | 0 | 0.0% |
| $150,000 to $199,999 | 0 | 0.0% |
| $200,000+ | 5 | 10.0% |
Household Income by Householder Age in Thorp
The median household income in Thorp is $62,500, with the highest median household income of $85,208 found in the 65+ years age bracket for the primary householder. A total of 32 households (64.0%) fall into this category.
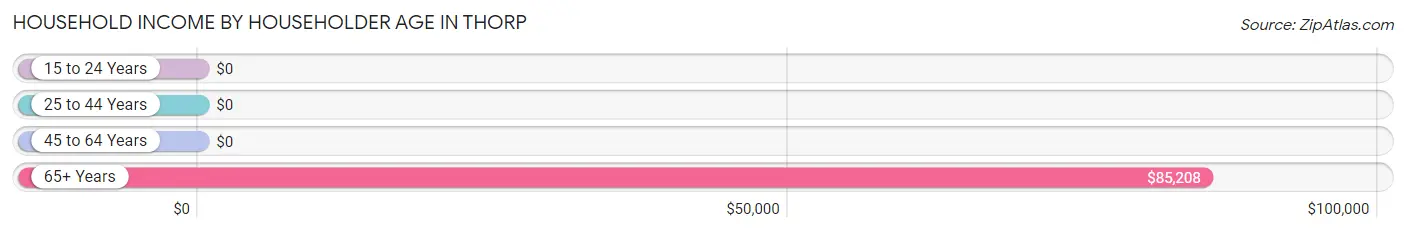
| Income Bracket | # Households | Median Income |
| 15 to 24 Years | 0 (0.0%) | $0 |
| 25 to 44 Years | 13 (26.0%) | $0 |
| 45 to 64 Years | 5 (10.0%) | $0 |
| 65+ Years | 32 (64.0%) | $85,208 |
| Total | 50 (100.0%) | $62,500 |
Poverty in Thorp
Income Below Poverty by Sex and Age in Thorp
With 23.6% poverty level for males and 34.3% for females among the residents of Thorp, under 5 year old males and under 5 year old females are the most vulnerable to poverty, with 3 males (100.0%) and 3 females (100.0%) in their respective age groups living below the poverty level.
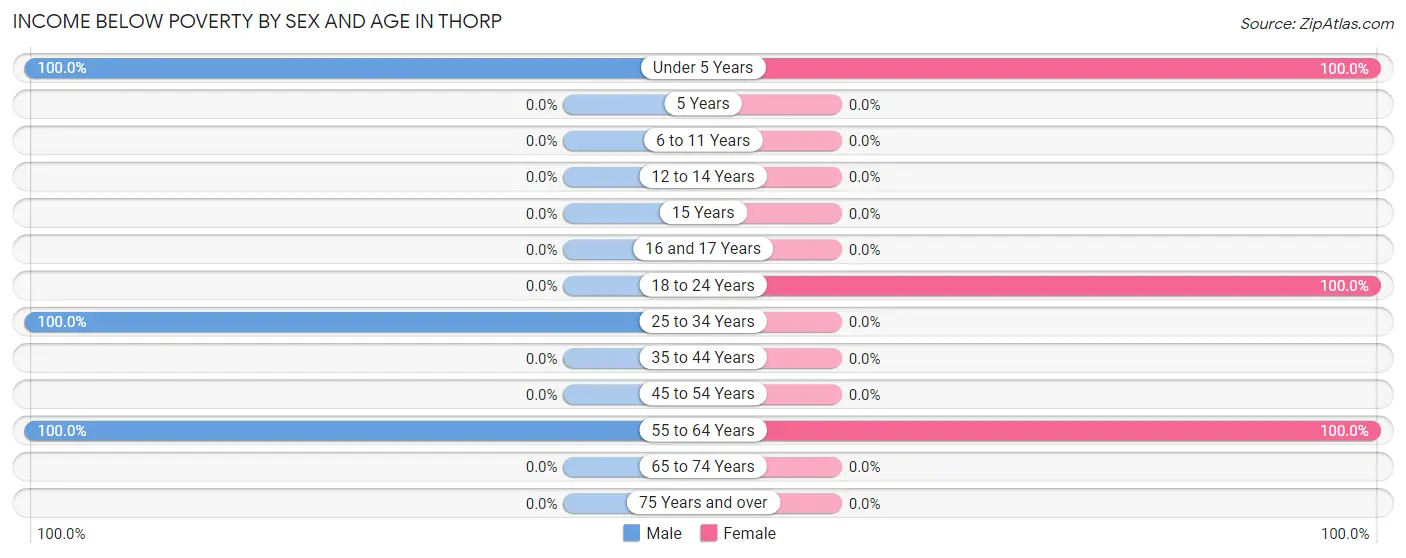
| Age Bracket | Male | Female |
| Under 5 Years | 3 (100.0%) | 3 (100.0%) |
| 5 Years | 0 (0.0%) | 0 (0.0%) |
| 6 to 11 Years | 0 (0.0%) | 0 (0.0%) |
| 12 to 14 Years | 0 (0.0%) | 0 (0.0%) |
| 15 Years | 0 (0.0%) | 0 (0.0%) |
| 16 and 17 Years | 0 (0.0%) | 0 (0.0%) |
| 18 to 24 Years | 0 (0.0%) | 4 (100.0%) |
| 25 to 34 Years | 5 (100.0%) | 0 (0.0%) |
| 35 to 44 Years | 0 (0.0%) | 0 (0.0%) |
| 45 to 54 Years | 0 (0.0%) | 0 (0.0%) |
| 55 to 64 Years | 5 (100.0%) | 5 (100.0%) |
| 65 to 74 Years | 0 (0.0%) | 0 (0.0%) |
| 75 Years and over | 0 (0.0%) | 0 (0.0%) |
| Total | 13 (23.6%) | 12 (34.3%) |
Income Above Poverty by Sex and Age in Thorp
According to the poverty statistics in Thorp, males aged 35 to 44 years and females aged 25 to 34 years are the age groups that are most secure financially, with 100.0% of males and 100.0% of females in these age groups living above the poverty line.
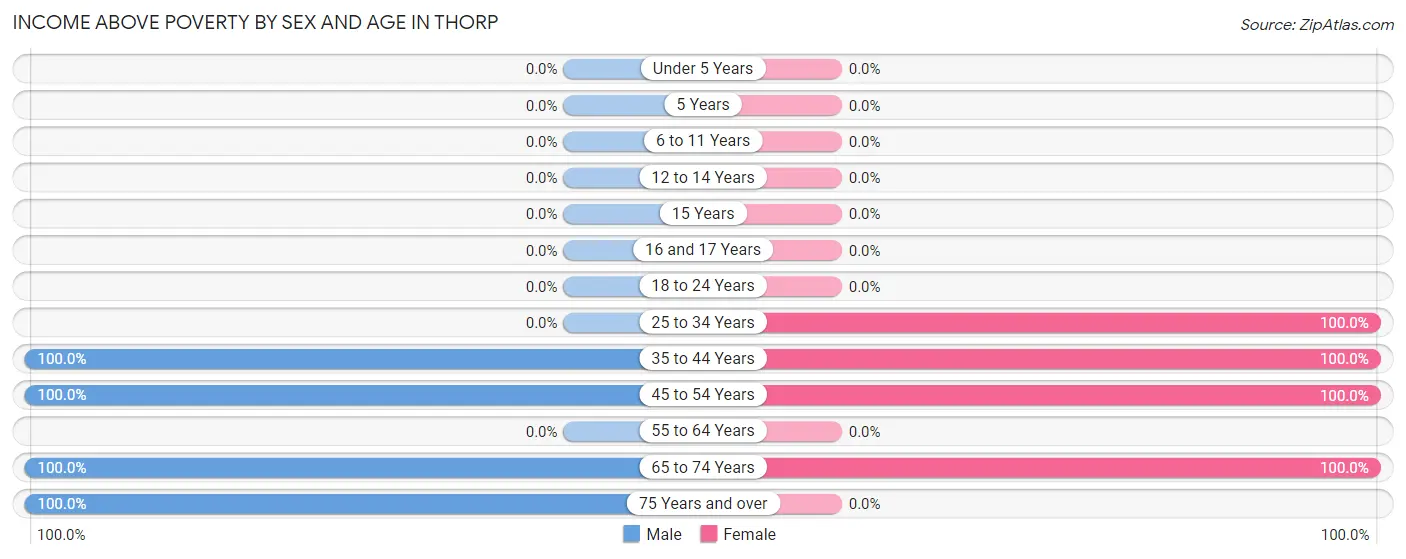
| Age Bracket | Male | Female |
| Under 5 Years | 0 (0.0%) | 0 (0.0%) |
| 5 Years | 0 (0.0%) | 0 (0.0%) |
| 6 to 11 Years | 0 (0.0%) | 0 (0.0%) |
| 12 to 14 Years | 0 (0.0%) | 0 (0.0%) |
| 15 Years | 0 (0.0%) | 0 (0.0%) |
| 16 and 17 Years | 0 (0.0%) | 0 (0.0%) |
| 18 to 24 Years | 0 (0.0%) | 0 (0.0%) |
| 25 to 34 Years | 0 (0.0%) | 5 (100.0%) |
| 35 to 44 Years | 7 (100.0%) | 1 (100.0%) |
| 45 to 54 Years | 4 (100.0%) | 3 (100.0%) |
| 55 to 64 Years | 0 (0.0%) | 0 (0.0%) |
| 65 to 74 Years | 21 (100.0%) | 14 (100.0%) |
| 75 Years and over | 10 (100.0%) | 0 (0.0%) |
| Total | 42 (76.4%) | 23 (65.7%) |
Income Below Poverty Among Married-Couple Families in Thorp
The poverty statistics for married-couple families in Thorp show that 43.5% or 10 of the total 23 families live below the poverty line. Families with 1 or 2 children have the highest poverty rate of 100.0%, comprising of 5 families. On the other hand, families with no children have the lowest poverty rate of 27.8%, which includes 5 families.
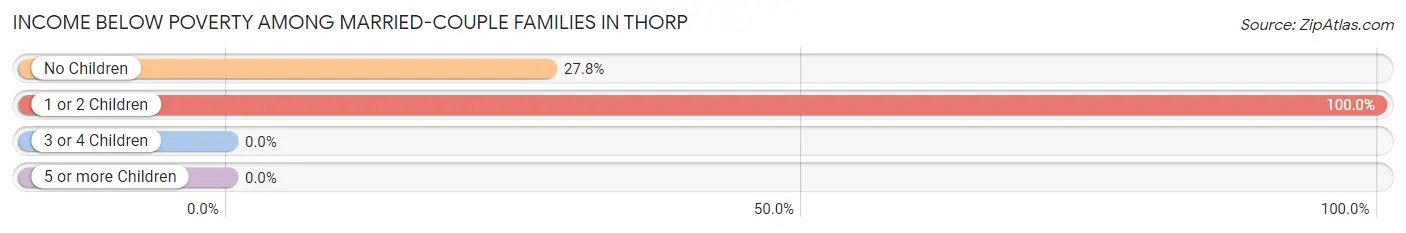
| Children | Above Poverty | Below Poverty |
| No Children | 13 (72.2%) | 5 (27.8%) |
| 1 or 2 Children | 0 (0.0%) | 5 (100.0%) |
| 3 or 4 Children | 0 (0.0%) | 0 (0.0%) |
| 5 or more Children | 0 (0.0%) | 0 (0.0%) |
| Total | 13 (56.5%) | 10 (43.5%) |
Income Below Poverty Among Single-Parent Households in Thorp
| Children | Single Father | Single Mother |
| No Children | 0 (0.0%) | 0 (0.0%) |
| 1 or 2 Children | 0 (0.0%) | 0 (0.0%) |
| 3 or 4 Children | 0 (0.0%) | 0 (0.0%) |
| 5 or more Children | 0 (0.0%) | 0 (0.0%) |
| Total | 0 (0.0%) | 0 (0.0%) |
Income Below Poverty Among Married-Couple vs Single-Parent Households in Thorp
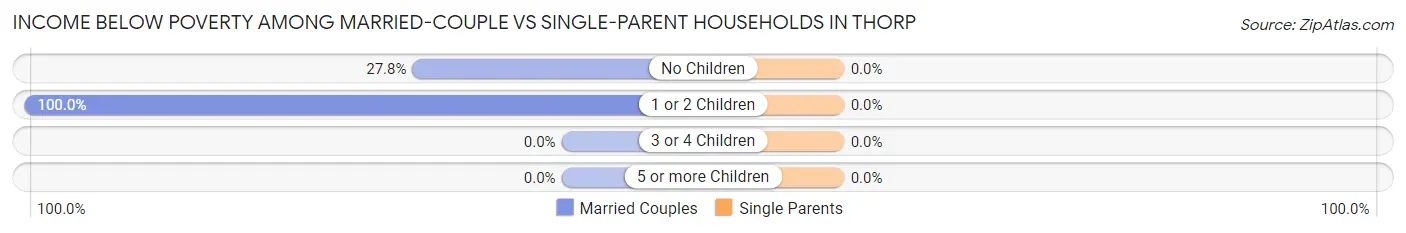
| Children | Married-Couple Families | Single-Parent Households |
| No Children | 5 (27.8%) | 0 (0.0%) |
| 1 or 2 Children | 5 (100.0%) | 0 (0.0%) |
| 3 or 4 Children | 0 (0.0%) | 0 (0.0%) |
| 5 or more Children | 0 (0.0%) | 0 (0.0%) |
| Total | 10 (43.5%) | 0 (0.0%) |
Race in Thorp
The most populous races in Thorp are , and White / Caucasian (90 | 100.0%).
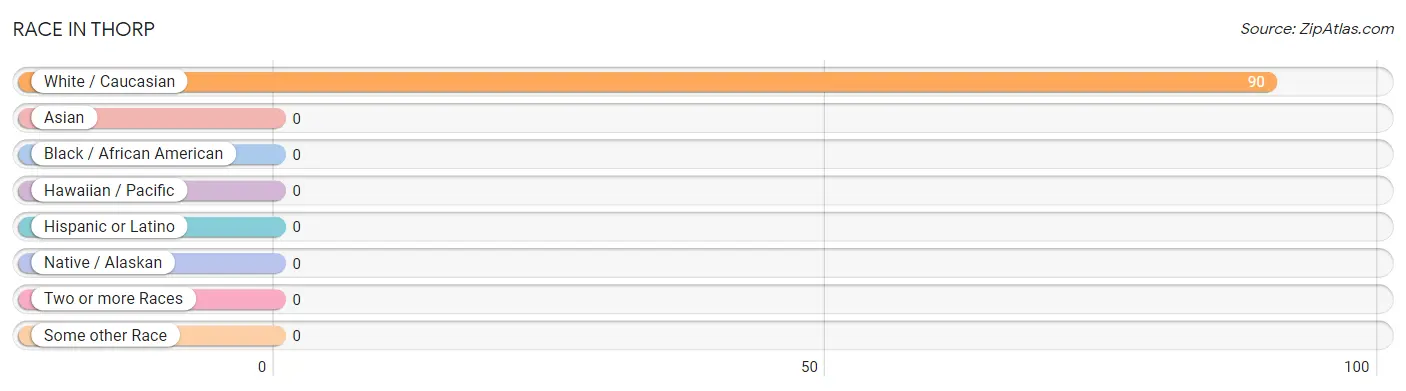
| Race | # Population | % Population |
| Asian | 0 | 0.0% |
| Black / African American | 0 | 0.0% |
| Hawaiian / Pacific | 0 | 0.0% |
| Hispanic or Latino | 0 | 0.0% |
| Native / Alaskan | 0 | 0.0% |
| White / Caucasian | 90 | 100.0% |
| Two or more Races | 0 | 0.0% |
| Some other Race | 0 | 0.0% |
| Total | 90 | 100.0% |
Ancestry in Thorp
The most populous ancestries reported in Thorp are German (23 | 25.6%), European (15 | 16.7%), English (11 | 12.2%), Finnish (8 | 8.9%), and Irish (7 | 7.8%), together accounting for 71.1% of all Thorp residents.
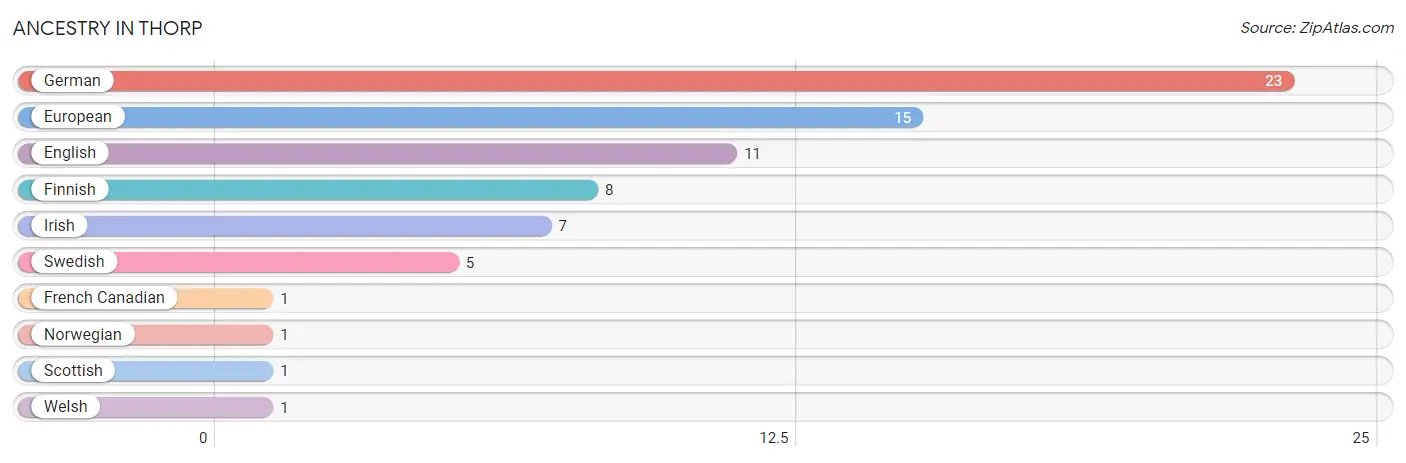
| Ancestry | # Population | % Population |
| English | 11 | 12.2% |
| European | 15 | 16.7% |
| Finnish | 8 | 8.9% |
| French Canadian | 1 | 1.1% |
| German | 23 | 25.6% |
| Irish | 7 | 7.8% |
| Norwegian | 1 | 1.1% |
| Scottish | 1 | 1.1% |
| Swedish | 5 | 5.6% |
| Welsh | 1 | 1.1% | View All 10 Rows |
Immigrants in Thorp

| Immigration Origin | # Population | % Population | View All 0 Rows |
Sex and Age in Thorp
Sex and Age in Thorp
The most populous age groups in Thorp are 70 to 74 Years (14 | 25.5%) for men and 65 to 69 Years (9 | 25.7%) for women.
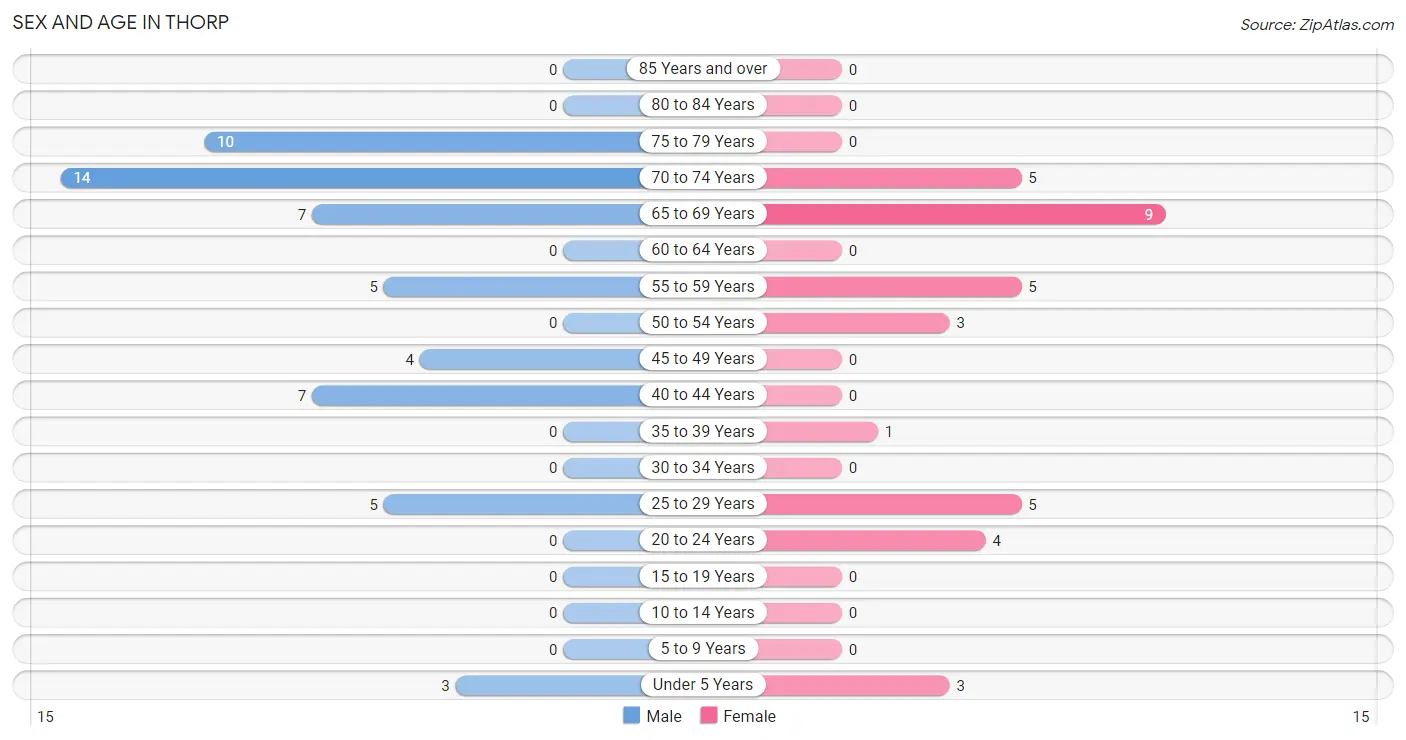
| Age Bracket | Male | Female |
| Under 5 Years | 3 (5.4%) | 3 (8.6%) |
| 5 to 9 Years | 0 (0.0%) | 0 (0.0%) |
| 10 to 14 Years | 0 (0.0%) | 0 (0.0%) |
| 15 to 19 Years | 0 (0.0%) | 0 (0.0%) |
| 20 to 24 Years | 0 (0.0%) | 4 (11.4%) |
| 25 to 29 Years | 5 (9.1%) | 5 (14.3%) |
| 30 to 34 Years | 0 (0.0%) | 0 (0.0%) |
| 35 to 39 Years | 0 (0.0%) | 1 (2.9%) |
| 40 to 44 Years | 7 (12.7%) | 0 (0.0%) |
| 45 to 49 Years | 4 (7.3%) | 0 (0.0%) |
| 50 to 54 Years | 0 (0.0%) | 3 (8.6%) |
| 55 to 59 Years | 5 (9.1%) | 5 (14.3%) |
| 60 to 64 Years | 0 (0.0%) | 0 (0.0%) |
| 65 to 69 Years | 7 (12.7%) | 9 (25.7%) |
| 70 to 74 Years | 14 (25.5%) | 5 (14.3%) |
| 75 to 79 Years | 10 (18.2%) | 0 (0.0%) |
| 80 to 84 Years | 0 (0.0%) | 0 (0.0%) |
| 85 Years and over | 0 (0.0%) | 0 (0.0%) |
| Total | 55 (100.0%) | 35 (100.0%) |
Families and Households in Thorp
Median Family Size in Thorp
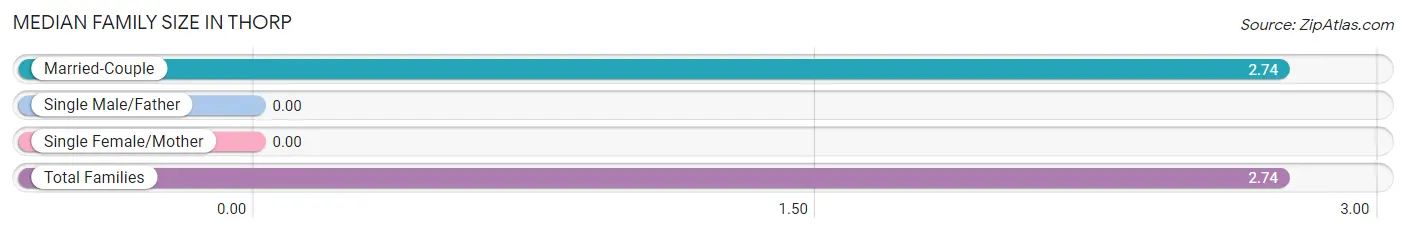
| Family Type | # Families | Family Size |
| Married-Couple | 23 (100.0%) | 2.74 |
| Single Male/Father | 0 (0.0%) | - |
| Single Female/Mother | 0 (0.0%) | - |
| Total Families | 23 (100.0%) | 2.74 |
Median Household Size in Thorp
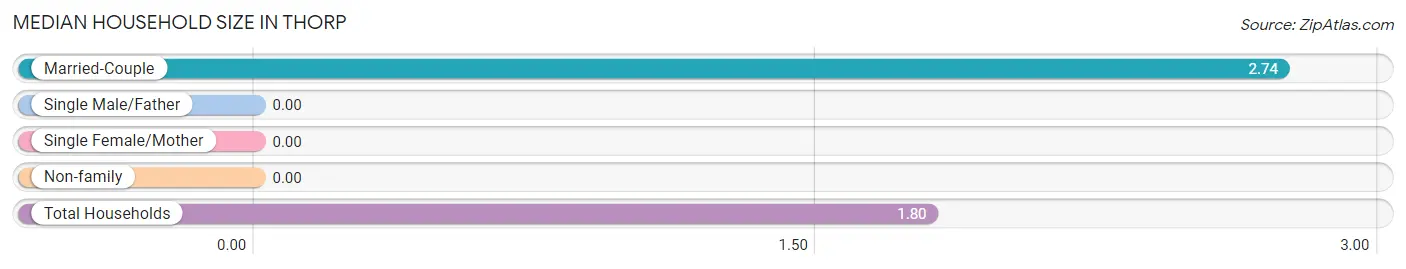
| Household Type | # Households | Household Size |
| Married-Couple | 23 (46.0%) | 2.74 |
| Single Male/Father | 0 (0.0%) | - |
| Single Female/Mother | 0 (0.0%) | - |
| Non-family | 27 (54.0%) | - |
| Total Households | 50 (100.0%) | 1.80 |
Household Size by Marriage Status in Thorp
Out of a total of 50 households in Thorp, 23 (46.0%) are family households, while 27 (54.0%) are nonfamily households. The most numerous type of family households are 2-person households, comprising 13, and the most common type of nonfamily households are 1-person households, comprising 27.
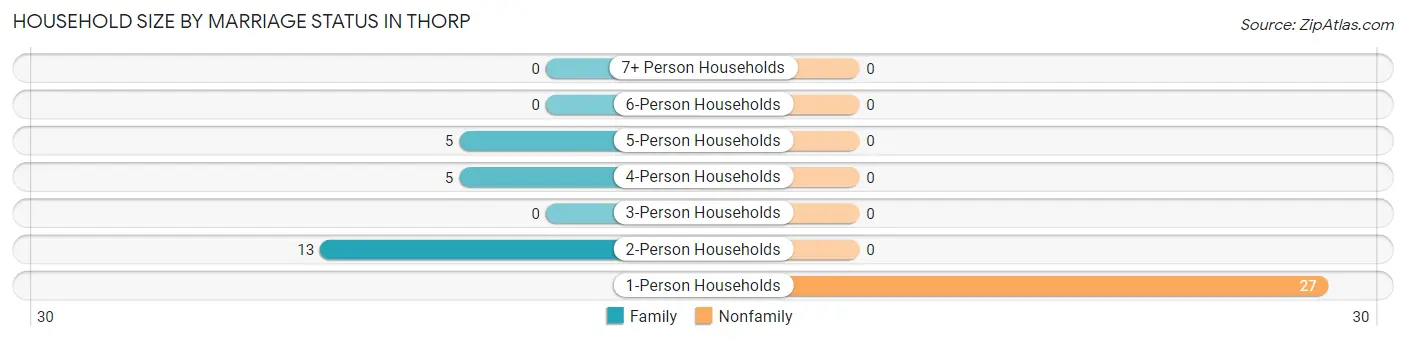
| Household Size | Family Households | Nonfamily Households |
| 1-Person Households | - | 27 (54.0%) |
| 2-Person Households | 13 (26.0%) | 0 (0.0%) |
| 3-Person Households | 0 (0.0%) | 0 (0.0%) |
| 4-Person Households | 5 (10.0%) | 0 (0.0%) |
| 5-Person Households | 5 (10.0%) | 0 (0.0%) |
| 6-Person Households | 0 (0.0%) | 0 (0.0%) |
| 7+ Person Households | 0 (0.0%) | 0 (0.0%) |
| Total | 23 (46.0%) | 27 (54.0%) |
Female Fertility in Thorp
Fertility by Age in Thorp
| Age Bracket | Women with Births | Births / 1,000 Women |
| 15 to 19 years | 0 (0.0%) | 0.0 |
| 20 to 34 years | 0 (0.0%) | 0.0 |
| 35 to 50 years | 0 (0.0%) | 0.0 |
| Total | 0 (0.0%) | 0.0 |
Fertility by Age by Marriage Status in Thorp
| Age Bracket | Married | Unmarried |
| 15 to 19 years | 0 (0.0%) | 0 (0.0%) |
| 20 to 34 years | 0 (0.0%) | 0 (0.0%) |
| 35 to 50 years | 0 (0.0%) | 0 (0.0%) |
| Total | 0 (0.0%) | 0 (0.0%) |
Fertility by Education in Thorp
| Educational Attainment | Women with Births | Births / 1,000 Women |
| Less than High School | 0 (0.0%) | 0.0 |
| High School Diploma | 0 (0.0%) | 0.0 |
| College or Associate's Degree | 0 (0.0%) | 0.0 |
| Bachelor's Degree | 0 (0.0%) | 0.0 |
| Graduate Degree | 0 (0.0%) | 0.0 |
| Total | 0 (0.0%) | 0.0 |
Fertility by Education by Marriage Status in Thorp
| Educational Attainment | Married | Unmarried |
| Less than High School | 0 (0.0%) | 0 (0.0%) |
| High School Diploma | 0 (0.0%) | 0 (0.0%) |
| College or Associate's Degree | 0 (0.0%) | 0 (0.0%) |
| Bachelor's Degree | 0 (0.0%) | 0 (0.0%) |
| Graduate Degree | 0 (0.0%) | 0 (0.0%) |
| Total | 0 (0.0%) | 0 (0.0%) |
Employment Characteristics in Thorp
Employment by Class of Employer in Thorp
Among the 41 employed individuals in Thorp, private company employees (11 | 26.8%), local government employees (9 | 22.0%), and self-employed (incorporated) (8 | 19.5%) make up the most common classes of employment.
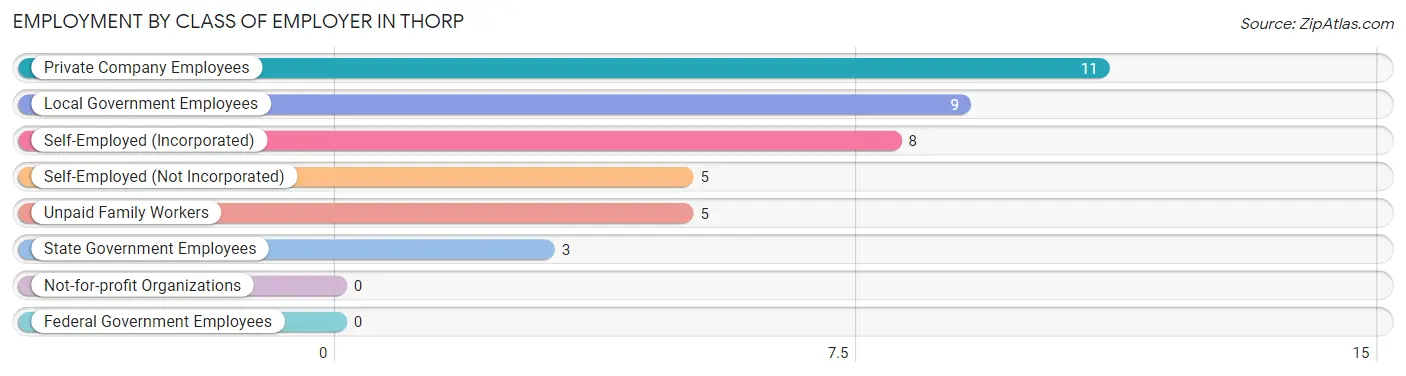
| Employer Class | # Employees | % Employees |
| Private Company Employees | 11 | 26.8% |
| Self-Employed (Incorporated) | 8 | 19.5% |
| Self-Employed (Not Incorporated) | 5 | 12.2% |
| Not-for-profit Organizations | 0 | 0.0% |
| Local Government Employees | 9 | 22.0% |
| State Government Employees | 3 | 7.3% |
| Federal Government Employees | 0 | 0.0% |
| Unpaid Family Workers | 5 | 12.2% |
| Total | 41 | 100.0% |
Employment Status by Age in Thorp
According to the labor force statistics for Thorp, out of the total population over 16 years of age (84), 56.0% or 47 individuals are in the labor force, with 12.8% or 6 of them unemployed. The age group with the highest labor force participation rate is 20 to 24 years, with 100.0% or 4 individuals in the labor force. Within the labor force, the 25 to 29 years age range has the highest percentage of unemployed individuals, with 100.0% or 5 of them being unemployed.
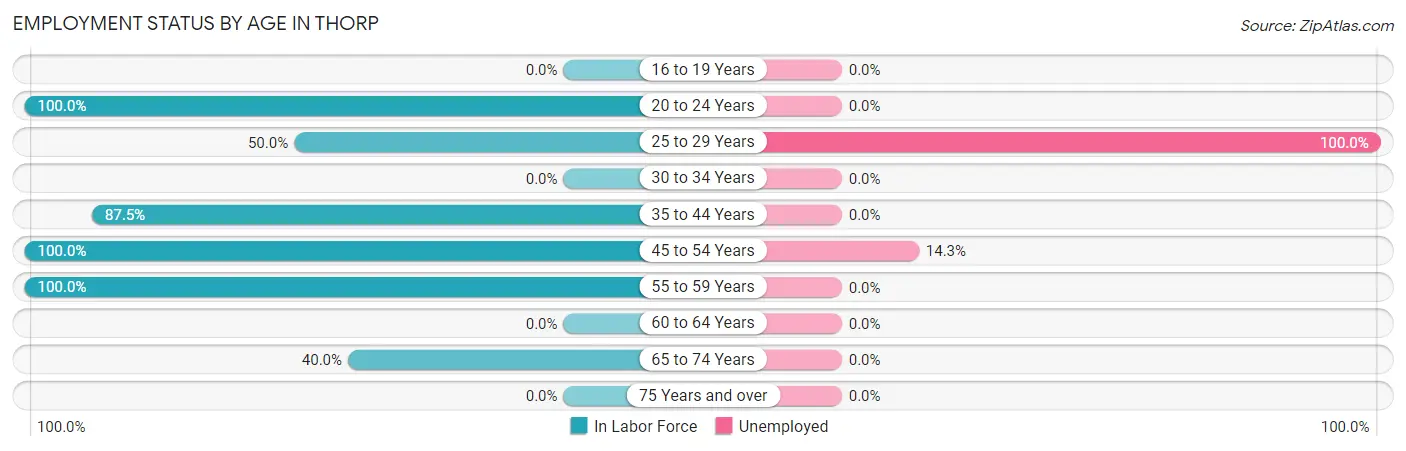
| Age Bracket | In Labor Force | Unemployed |
| 16 to 19 Years | 0 (0.0%) | 0 (0.0%) |
| 20 to 24 Years | 4 (100.0%) | 0 (0.0%) |
| 25 to 29 Years | 5 (50.0%) | 5 (100.0%) |
| 30 to 34 Years | 0 (0.0%) | 0 (0.0%) |
| 35 to 44 Years | 7 (87.5%) | 0 (0.0%) |
| 45 to 54 Years | 7 (100.0%) | 1 (14.3%) |
| 55 to 59 Years | 10 (100.0%) | 0 (0.0%) |
| 60 to 64 Years | 0 (0.0%) | 0 (0.0%) |
| 65 to 74 Years | 14 (40.0%) | 0 (0.0%) |
| 75 Years and over | 0 (0.0%) | 0 (0.0%) |
| Total | 47 (56.0%) | 6 (12.8%) |
Employment Status by Educational Attainment in Thorp
According to labor force statistics for Thorp, 82.9% of individuals (29) out of the total population between 25 and 64 years of age (35) are in the labor force, with 20.7% or 6 of them being unemployed. The group with the highest labor force participation rate are those with the educational attainment of bachelor's degree or higher, with 100.0% or 8 individuals in the labor force. Within the labor force, individuals with bachelor's degree or higher education have the highest percentage of unemployment, with 62.5% or 5 of them being unemployed.
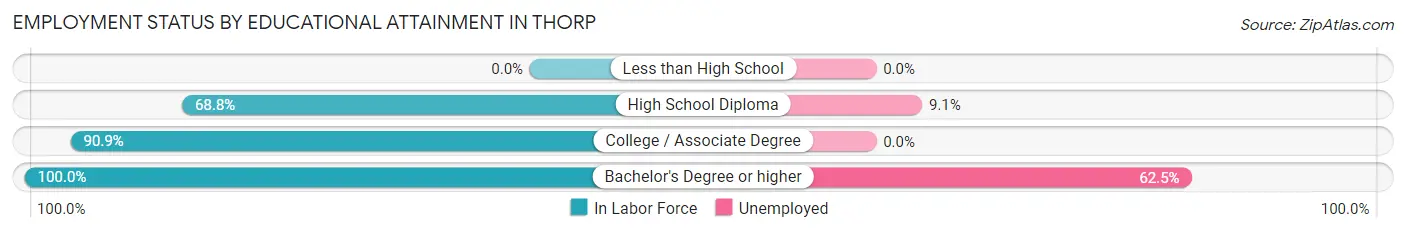
| Educational Attainment | In Labor Force | Unemployed |
| Less than High School | 0 (0.0%) | 0 (0.0%) |
| High School Diploma | 11 (68.8%) | 1 (9.1%) |
| College / Associate Degree | 10 (90.9%) | 0 (0.0%) |
| Bachelor's Degree or higher | 8 (100.0%) | 5 (62.5%) |
| Total | 29 (82.9%) | 7 (20.7%) |
Employment Occupations by Sex in Thorp
Management, Business, Science and Arts Occupations
The most common Management, Business, Science and Arts occupations in Thorp are Management (5 | 12.2%), and Business & Financial (3 | 7.3%).
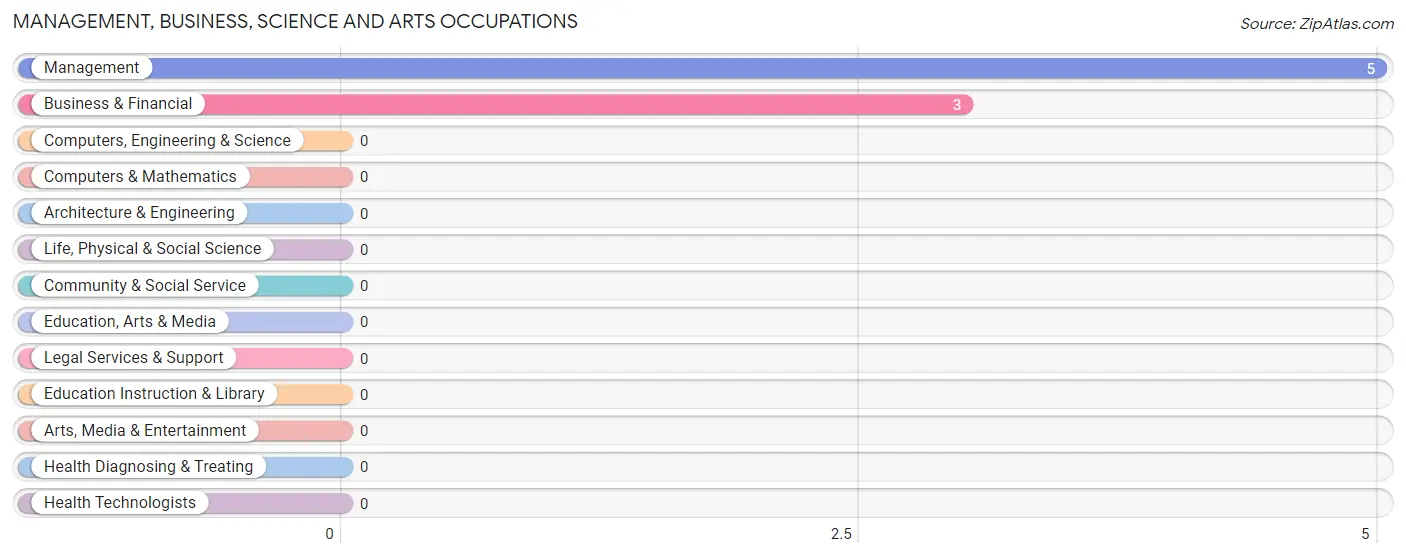
Management, Business, Science and Arts Occupations by Sex
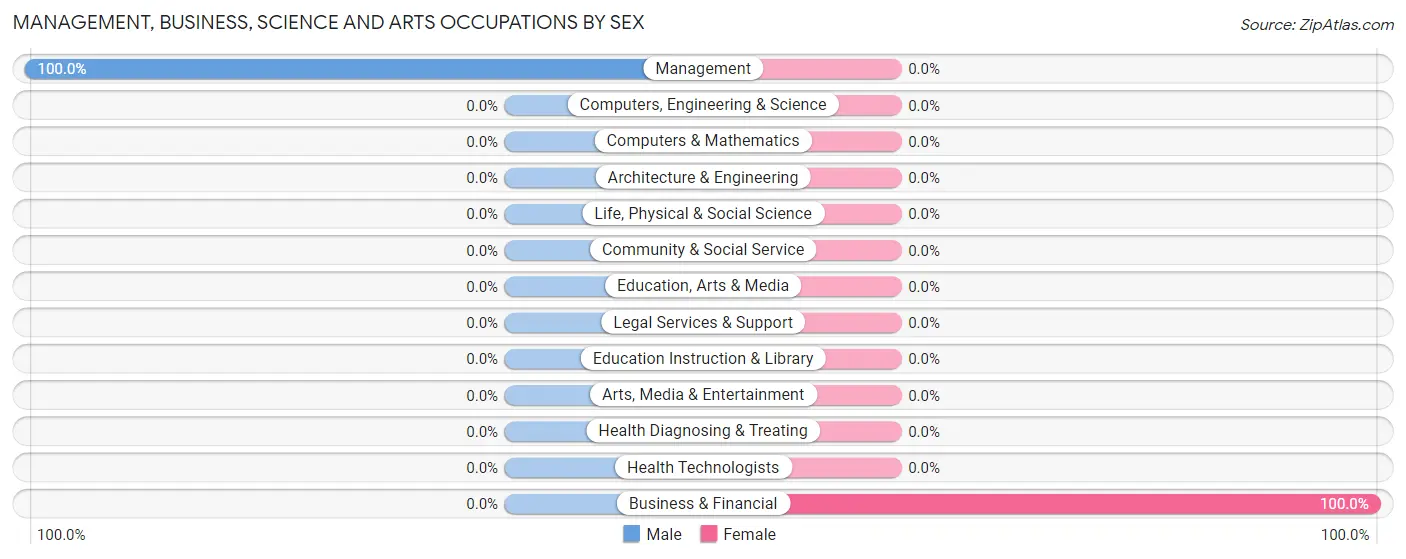
| Occupation | Male | Female |
| Management | 5 (100.0%) | 0 (0.0%) |
| Business & Financial | 0 (0.0%) | 3 (100.0%) |
| Computers, Engineering & Science | 0 (0.0%) | 0 (0.0%) |
| Computers & Mathematics | 0 (0.0%) | 0 (0.0%) |
| Architecture & Engineering | 0 (0.0%) | 0 (0.0%) |
| Life, Physical & Social Science | 0 (0.0%) | 0 (0.0%) |
| Community & Social Service | 0 (0.0%) | 0 (0.0%) |
| Education, Arts & Media | 0 (0.0%) | 0 (0.0%) |
| Legal Services & Support | 0 (0.0%) | 0 (0.0%) |
| Education Instruction & Library | 0 (0.0%) | 0 (0.0%) |
| Arts, Media & Entertainment | 0 (0.0%) | 0 (0.0%) |
| Health Diagnosing & Treating | 0 (0.0%) | 0 (0.0%) |
| Health Technologists | 0 (0.0%) | 0 (0.0%) |
| Total (Category) | 5 (62.5%) | 3 (37.5%) |
| Total (Overall) | 21 (51.2%) | 20 (48.8%) |
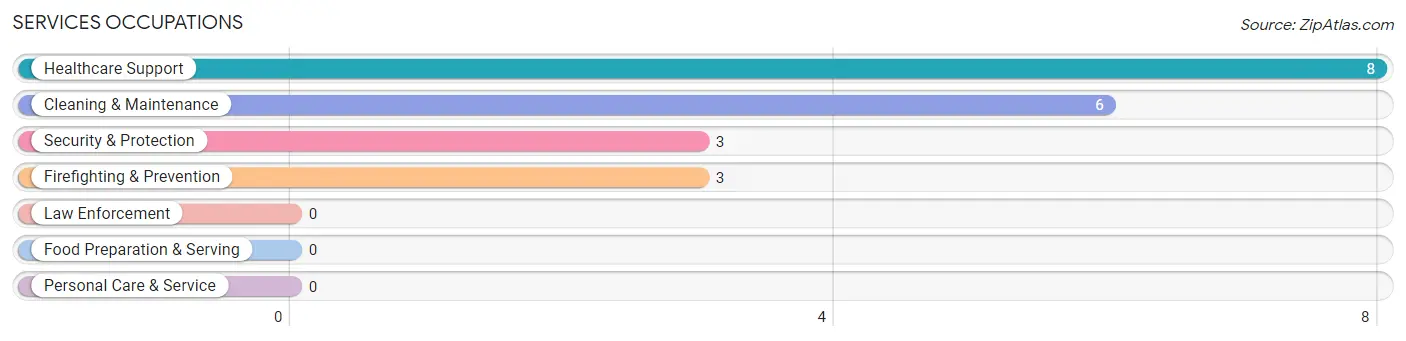
Services Occupations
The most common Services occupations in Thorp are Healthcare Support (8 | 19.5%), Cleaning & Maintenance (6 | 14.6%), Security & Protection (3 | 7.3%), and Firefighting & Prevention (3 | 7.3%).
Services Occupations by Sex
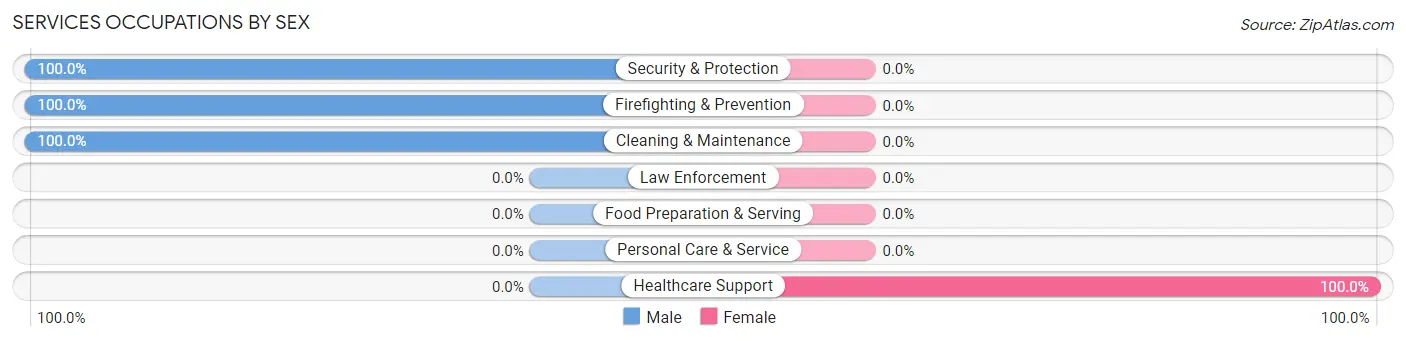
| Occupation | Male | Female |
| Healthcare Support | 0 (0.0%) | 8 (100.0%) |
| Security & Protection | 3 (100.0%) | 0 (0.0%) |
| Firefighting & Prevention | 3 (100.0%) | 0 (0.0%) |
| Law Enforcement | 0 (0.0%) | 0 (0.0%) |
| Food Preparation & Serving | 0 (0.0%) | 0 (0.0%) |
| Cleaning & Maintenance | 6 (100.0%) | 0 (0.0%) |
| Personal Care & Service | 0 (0.0%) | 0 (0.0%) |
| Total (Category) | 9 (52.9%) | 8 (47.1%) |
| Total (Overall) | 21 (51.2%) | 20 (48.8%) |
Sales and Office Occupations
The most common Sales and Office occupations in Thorp are , and Office & Administration (9 | 22.0%).
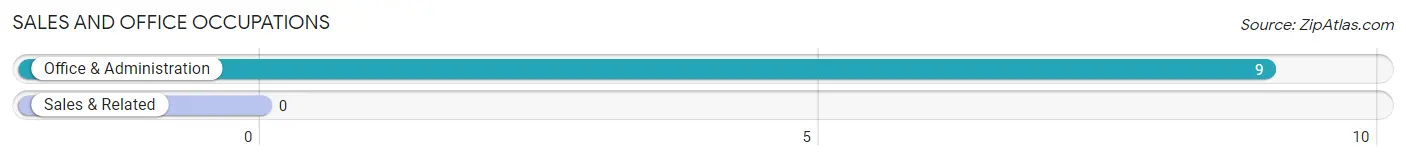
Sales and Office Occupations by Sex
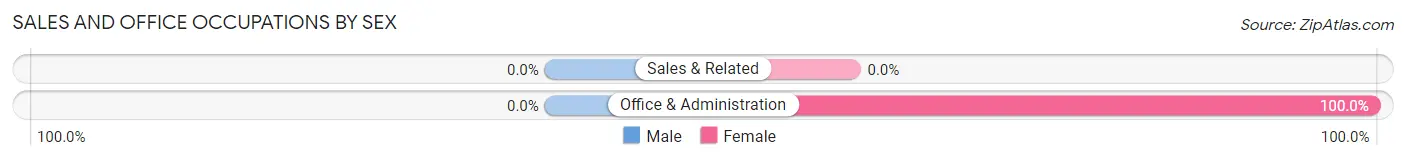
| Occupation | Male | Female |
| Sales & Related | 0 (0.0%) | 0 (0.0%) |
| Office & Administration | 0 (0.0%) | 9 (100.0%) |
| Total (Category) | 0 (0.0%) | 9 (100.0%) |
| Total (Overall) | 21 (51.2%) | 20 (48.8%) |
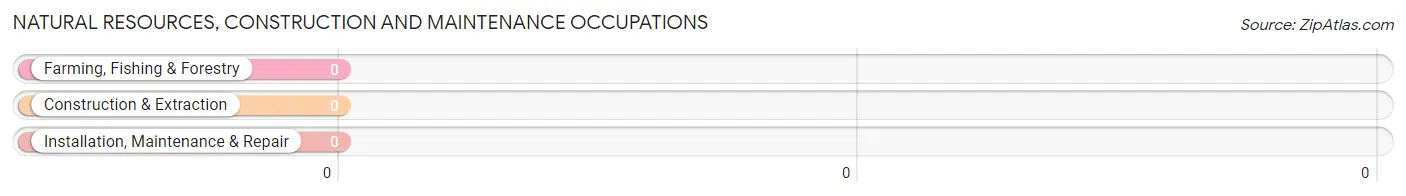
Natural Resources, Construction and Maintenance Occupations
Natural Resources, Construction and Maintenance Occupations by Sex
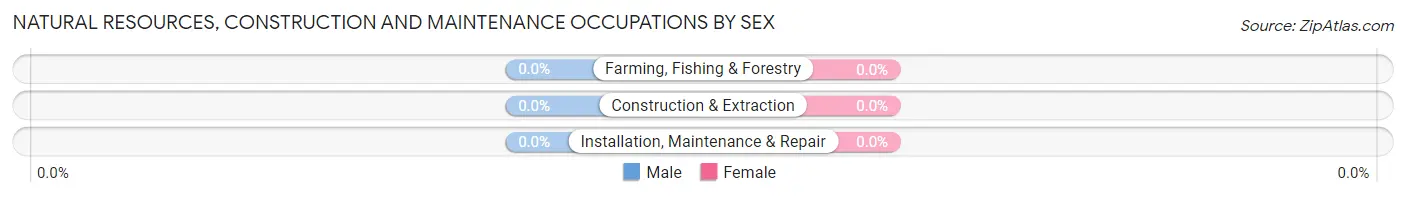
| Occupation | Male | Female |
| Farming, Fishing & Forestry | 0 (0.0%) | 0 (0.0%) |
| Construction & Extraction | 0 (0.0%) | 0 (0.0%) |
| Installation, Maintenance & Repair | 0 (0.0%) | 0 (0.0%) |
| Total (Category) | 0 (0.0%) | 0 (0.0%) |
| Total (Overall) | 21 (51.2%) | 20 (48.8%) |
Production, Transportation and Moving Occupations
The most common Production, Transportation and Moving occupations in Thorp are , and Production (7 | 17.1%).
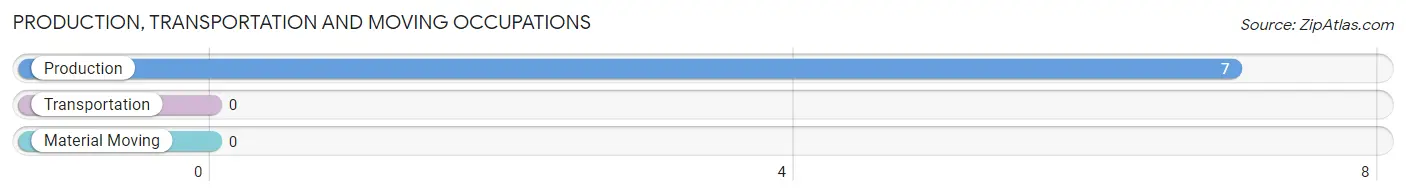
Production, Transportation and Moving Occupations by Sex
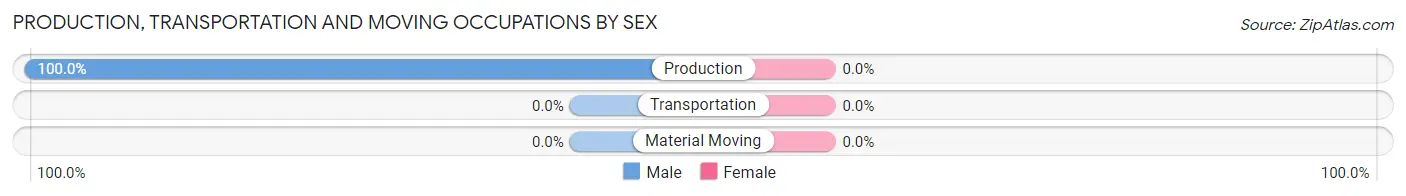
| Occupation | Male | Female |
| Production | 7 (100.0%) | 0 (0.0%) |
| Transportation | 0 (0.0%) | 0 (0.0%) |
| Material Moving | 0 (0.0%) | 0 (0.0%) |
| Total (Category) | 7 (100.0%) | 0 (0.0%) |
| Total (Overall) | 21 (51.2%) | 20 (48.8%) |
Employment Industries by Sex in Thorp
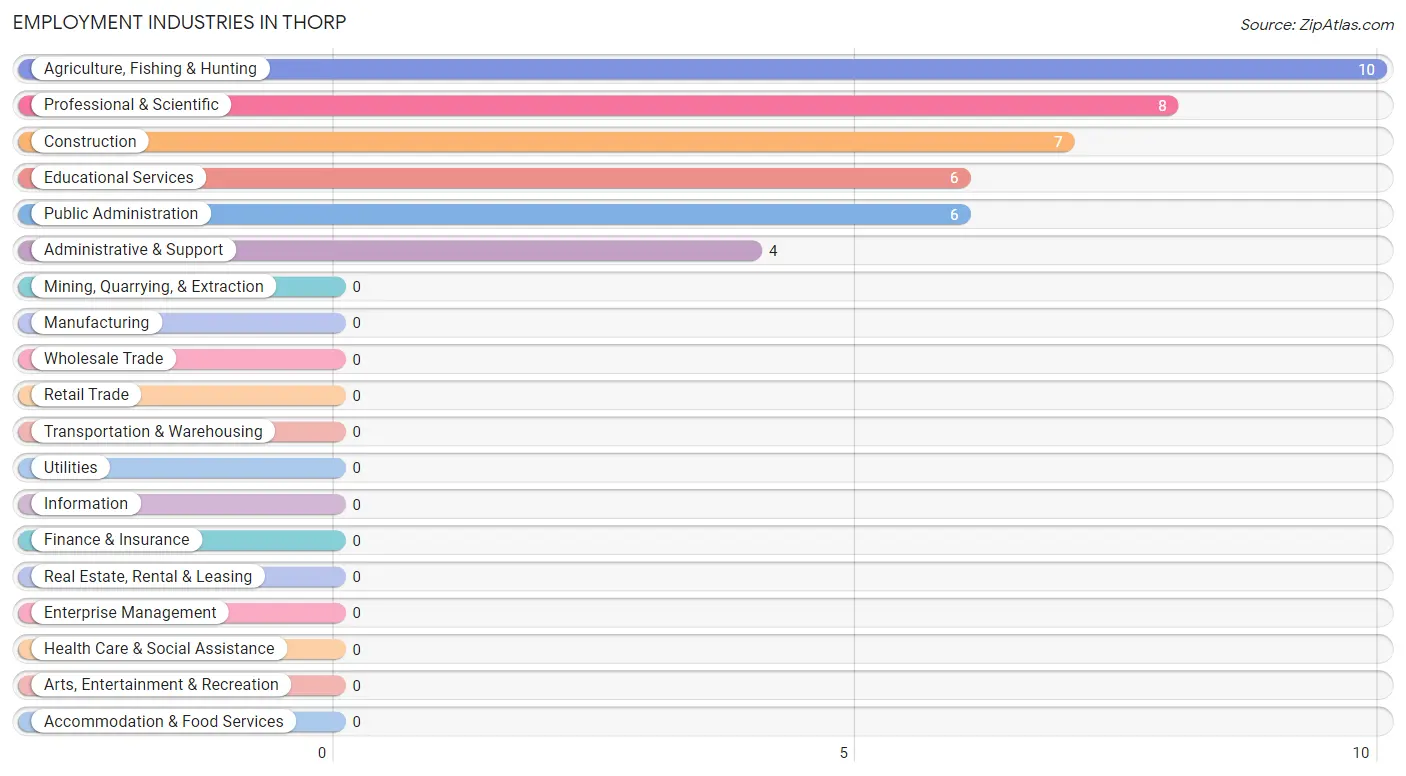
Employment Industries in Thorp
The major employment industries in Thorp include Agriculture, Fishing & Hunting (10 | 24.4%), Professional & Scientific (8 | 19.5%), Construction (7 | 17.1%), Educational Services (6 | 14.6%), and Public Administration (6 | 14.6%).
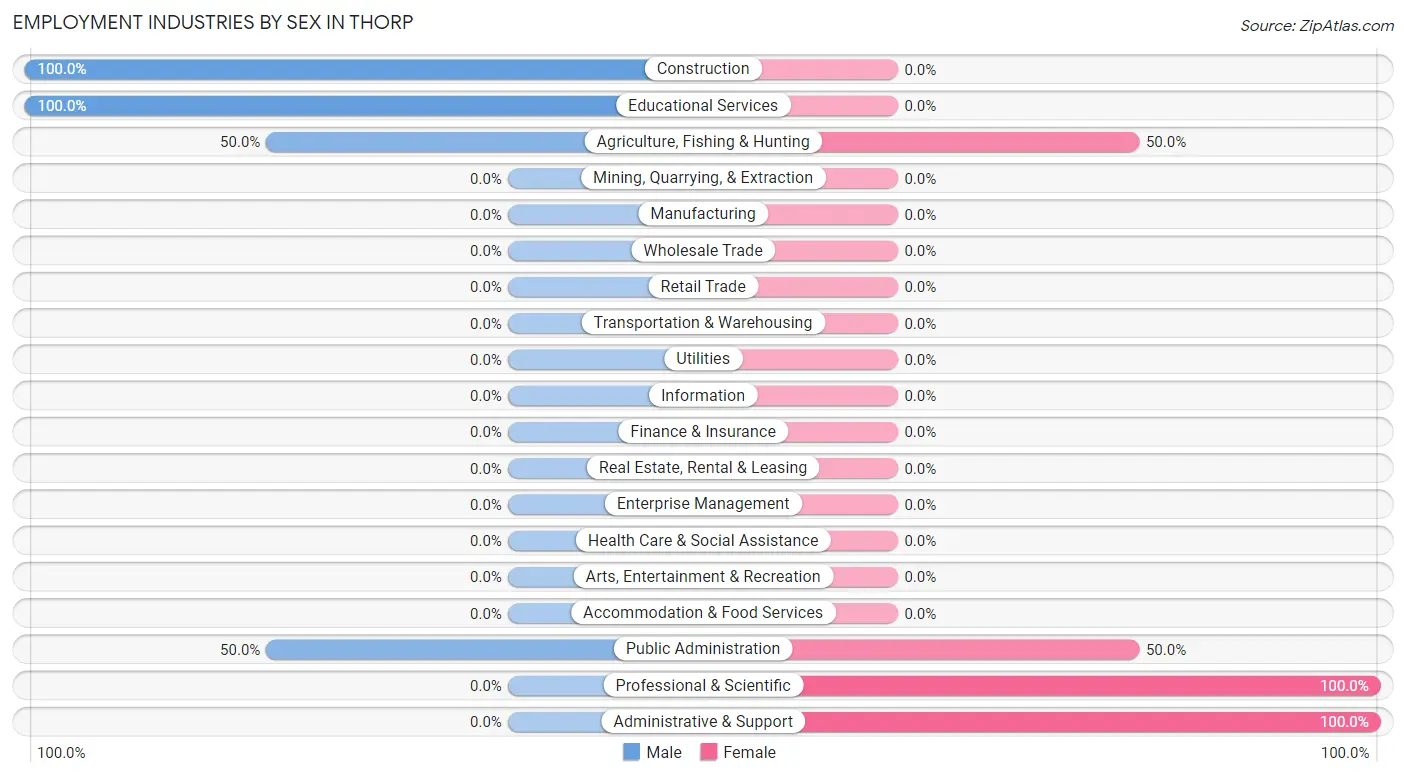
Employment Industries by Sex in Thorp
The Thorp industries that see more men than women are Construction (100.0%), Educational Services (100.0%), and Agriculture, Fishing & Hunting (50.0%), whereas the industries that tend to have a higher number of women are Professional & Scientific (100.0%), Administrative & Support (100.0%), and Agriculture, Fishing & Hunting (50.0%).
| Industry | Male | Female |
| Agriculture, Fishing & Hunting | 5 (50.0%) | 5 (50.0%) |
| Mining, Quarrying, & Extraction | 0 (0.0%) | 0 (0.0%) |
| Construction | 7 (100.0%) | 0 (0.0%) |
| Manufacturing | 0 (0.0%) | 0 (0.0%) |
| Wholesale Trade | 0 (0.0%) | 0 (0.0%) |
| Retail Trade | 0 (0.0%) | 0 (0.0%) |
| Transportation & Warehousing | 0 (0.0%) | 0 (0.0%) |
| Utilities | 0 (0.0%) | 0 (0.0%) |
| Information | 0 (0.0%) | 0 (0.0%) |
| Finance & Insurance | 0 (0.0%) | 0 (0.0%) |
| Real Estate, Rental & Leasing | 0 (0.0%) | 0 (0.0%) |
| Professional & Scientific | 0 (0.0%) | 8 (100.0%) |
| Enterprise Management | 0 (0.0%) | 0 (0.0%) |
| Administrative & Support | 0 (0.0%) | 4 (100.0%) |
| Educational Services | 6 (100.0%) | 0 (0.0%) |
| Health Care & Social Assistance | 0 (0.0%) | 0 (0.0%) |
| Arts, Entertainment & Recreation | 0 (0.0%) | 0 (0.0%) |
| Accommodation & Food Services | 0 (0.0%) | 0 (0.0%) |
| Public Administration | 3 (50.0%) | 3 (50.0%) |
| Total | 21 (51.2%) | 20 (48.8%) |
Education in Thorp
School Enrollment in Thorp
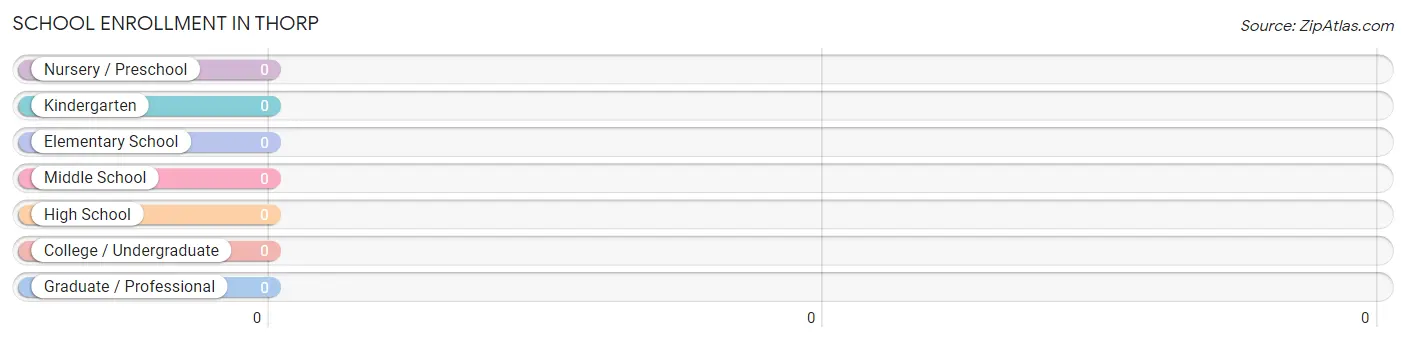
| School Level | # Students | % Students |
| Nursery / Preschool | 0 | 0.0% |
| Kindergarten | 0 | 0.0% |
| Elementary School | 0 | 0.0% |
| Middle School | 0 | 0.0% |
| High School | 0 | 0.0% |
| College / Undergraduate | 0 | 0.0% |
| Graduate / Professional | 0 | 0.0% |
| Total | 0 | 0.0% |
School Enrollment by Age by Funding Source in Thorp
| Age Bracket | Public School | Private School |
| 3 to 4 Year Olds | 0 (0.0%) | 0 (0.0%) |
| 5 to 9 Year Old | 0 (0.0%) | 0 (0.0%) |
| 10 to 14 Year Olds | 0 (0.0%) | 0 (0.0%) |
| 15 to 17 Year Olds | 0 (0.0%) | 0 (0.0%) |
| 18 to 19 Year Olds | 0 (0.0%) | 0 (0.0%) |
| 20 to 24 Year Olds | 0 (0.0%) | 0 (0.0%) |
| 25 to 34 Year Olds | 0 (0.0%) | 0 (0.0%) |
| 35 Years and over | 0 (0.0%) | 0 (0.0%) |
| Total | 0 (0.0%) | 0 (0.0%) |
Educational Attainment by Field of Study in Thorp
Liberal arts & history (8 | 40.0%), bio, nature & agricultural (6 | 30.0%), education (5 | 25.0%), and social sciences (1 | 5.0%) are the most common fields of study among 20 individuals in Thorp who have obtained a bachelor's degree or higher.
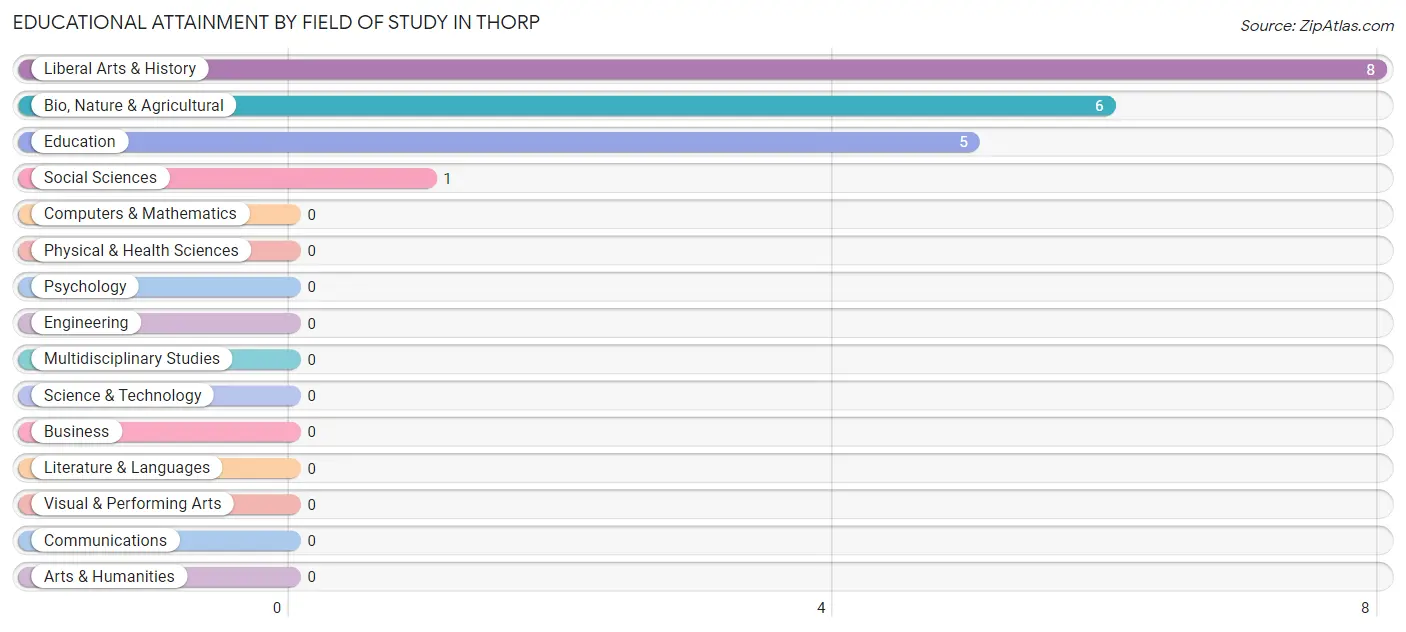
| Field of Study | # Graduates | % Graduates |
| Computers & Mathematics | 0 | 0.0% |
| Bio, Nature & Agricultural | 6 | 30.0% |
| Physical & Health Sciences | 0 | 0.0% |
| Psychology | 0 | 0.0% |
| Social Sciences | 1 | 5.0% |
| Engineering | 0 | 0.0% |
| Multidisciplinary Studies | 0 | 0.0% |
| Science & Technology | 0 | 0.0% |
| Business | 0 | 0.0% |
| Education | 5 | 25.0% |
| Literature & Languages | 0 | 0.0% |
| Liberal Arts & History | 8 | 40.0% |
| Visual & Performing Arts | 0 | 0.0% |
| Communications | 0 | 0.0% |
| Arts & Humanities | 0 | 0.0% |
| Total | 20 | 100.0% |
Transportation & Commute in Thorp
Vehicle Availability by Sex in Thorp
The most prevalent vehicle ownership categories in Thorp are males with 3 vehicles (11, accounting for 52.4%) and females with 3 vehicles (17, making up 55.0%).
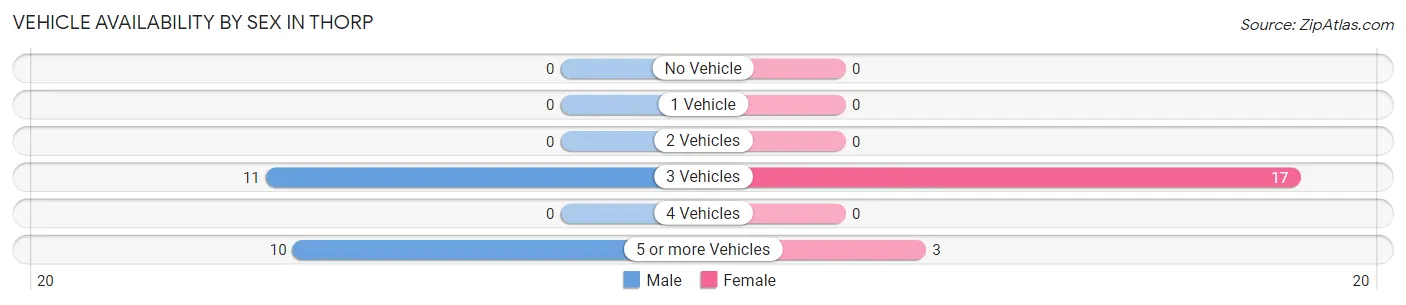
| Vehicles Available | Male | Female |
| No Vehicle | 0 (0.0%) | 0 (0.0%) |
| 1 Vehicle | 0 (0.0%) | 0 (0.0%) |
| 2 Vehicles | 0 (0.0%) | 0 (0.0%) |
| 3 Vehicles | 11 (52.4%) | 17 (85.0%) |
| 4 Vehicles | 0 (0.0%) | 0 (0.0%) |
| 5 or more Vehicles | 10 (47.6%) | 3 (15.0%) |
| Total | 21 (100.0%) | 20 (100.0%) |
Commute Time in Thorp
The most frequently occuring commute durations in Thorp are 5 to 9 minutes (15 commuters, 48.4%), 10 to 14 minutes (6 commuters, 19.4%), and 35 to 39 minutes (4 commuters, 12.9%).
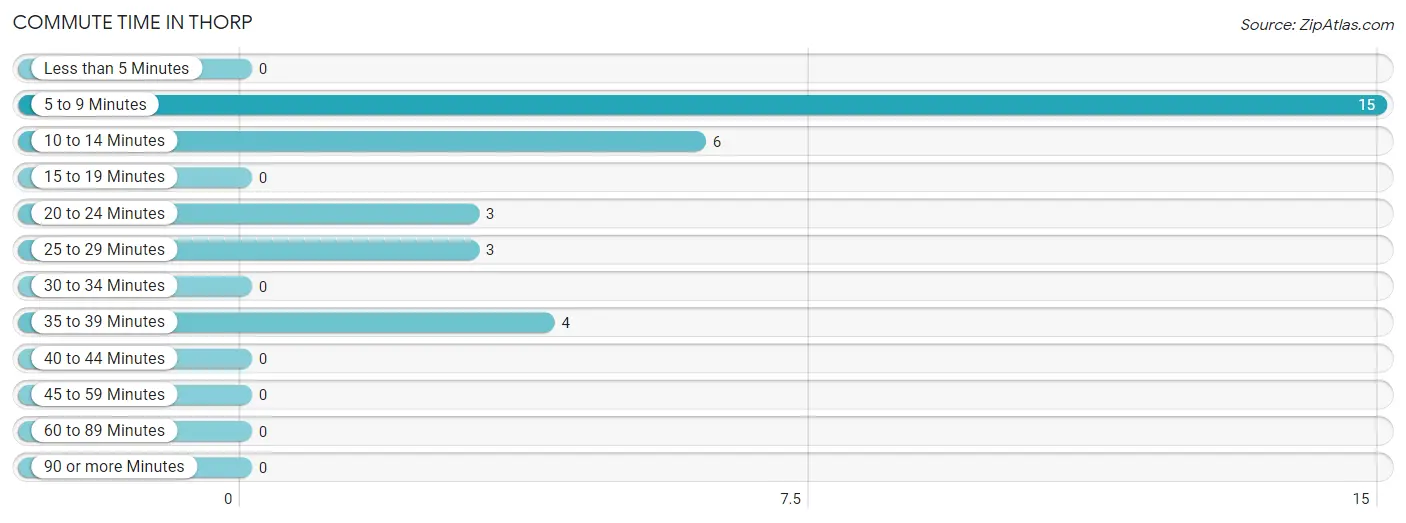
| Commute Time | # Commuters | % Commuters |
| Less than 5 Minutes | 0 | 0.0% |
| 5 to 9 Minutes | 15 | 48.4% |
| 10 to 14 Minutes | 6 | 19.4% |
| 15 to 19 Minutes | 0 | 0.0% |
| 20 to 24 Minutes | 3 | 9.7% |
| 25 to 29 Minutes | 3 | 9.7% |
| 30 to 34 Minutes | 0 | 0.0% |
| 35 to 39 Minutes | 4 | 12.9% |
| 40 to 44 Minutes | 0 | 0.0% |
| 45 to 59 Minutes | 0 | 0.0% |
| 60 to 89 Minutes | 0 | 0.0% |
| 90 or more Minutes | 0 | 0.0% |
Commute Time by Sex in Thorp
The most common commute times in Thorp are 5 to 9 minutes (7 commuters, 43.8%) for males and 5 to 9 minutes (8 commuters, 53.3%) for females.
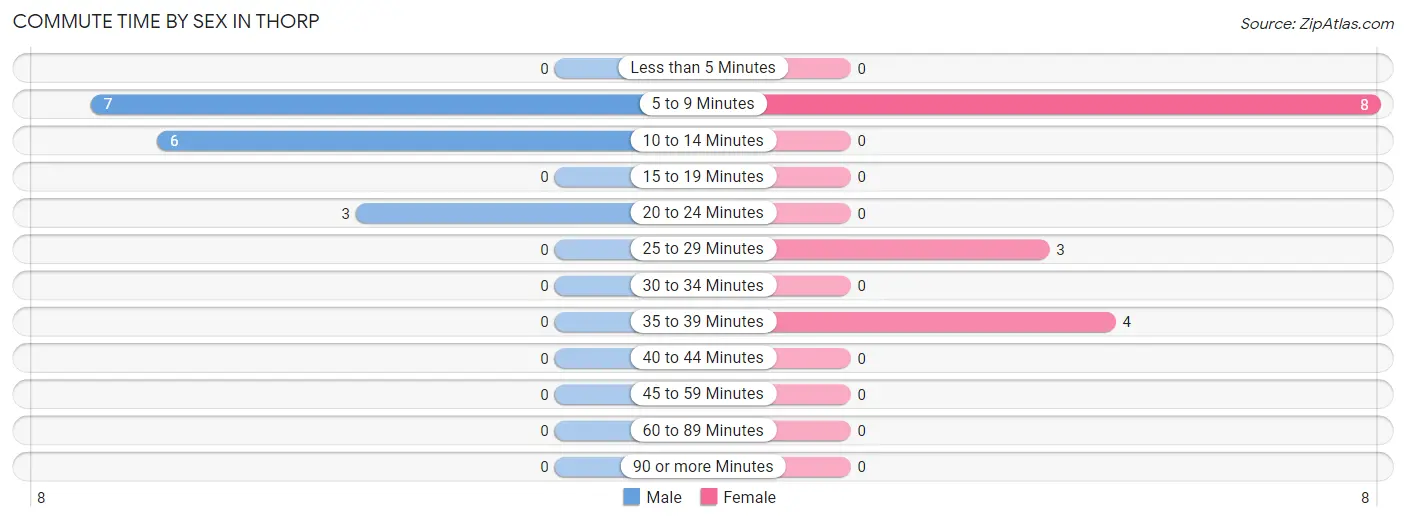
| Commute Time | Male | Female |
| Less than 5 Minutes | 0 (0.0%) | 0 (0.0%) |
| 5 to 9 Minutes | 7 (43.8%) | 8 (53.3%) |
| 10 to 14 Minutes | 6 (37.5%) | 0 (0.0%) |
| 15 to 19 Minutes | 0 (0.0%) | 0 (0.0%) |
| 20 to 24 Minutes | 3 (18.8%) | 0 (0.0%) |
| 25 to 29 Minutes | 0 (0.0%) | 3 (20.0%) |
| 30 to 34 Minutes | 0 (0.0%) | 0 (0.0%) |
| 35 to 39 Minutes | 0 (0.0%) | 4 (26.7%) |
| 40 to 44 Minutes | 0 (0.0%) | 0 (0.0%) |
| 45 to 59 Minutes | 0 (0.0%) | 0 (0.0%) |
| 60 to 89 Minutes | 0 (0.0%) | 0 (0.0%) |
| 90 or more Minutes | 0 (0.0%) | 0 (0.0%) |
Time of Departure to Work by Sex in Thorp
The most frequent times of departure to work in Thorp are 6:00 AM to 6:29 AM (7, 43.8%) for males and 9:00 AM to 9:59 AM (12, 80.0%) for females.
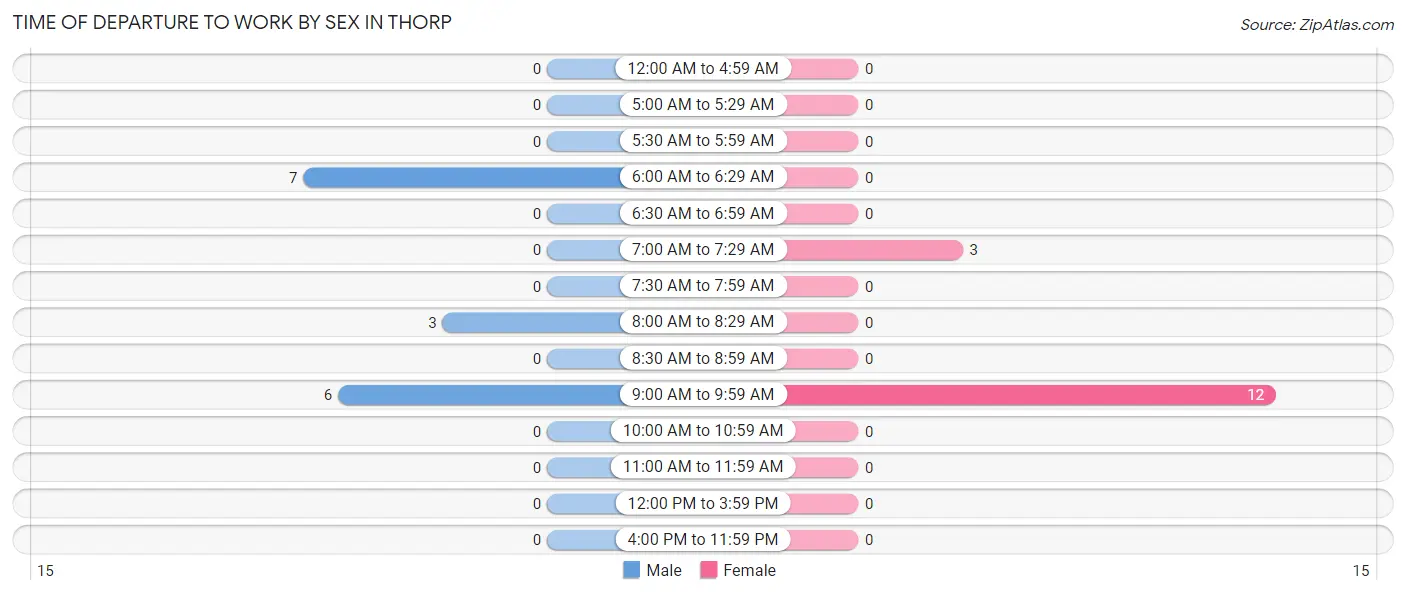
| Time of Departure | Male | Female |
| 12:00 AM to 4:59 AM | 0 (0.0%) | 0 (0.0%) |
| 5:00 AM to 5:29 AM | 0 (0.0%) | 0 (0.0%) |
| 5:30 AM to 5:59 AM | 0 (0.0%) | 0 (0.0%) |
| 6:00 AM to 6:29 AM | 7 (43.8%) | 0 (0.0%) |
| 6:30 AM to 6:59 AM | 0 (0.0%) | 0 (0.0%) |
| 7:00 AM to 7:29 AM | 0 (0.0%) | 3 (20.0%) |
| 7:30 AM to 7:59 AM | 0 (0.0%) | 0 (0.0%) |
| 8:00 AM to 8:29 AM | 3 (18.8%) | 0 (0.0%) |
| 8:30 AM to 8:59 AM | 0 (0.0%) | 0 (0.0%) |
| 9:00 AM to 9:59 AM | 6 (37.5%) | 12 (80.0%) |
| 10:00 AM to 10:59 AM | 0 (0.0%) | 0 (0.0%) |
| 11:00 AM to 11:59 AM | 0 (0.0%) | 0 (0.0%) |
| 12:00 PM to 3:59 PM | 0 (0.0%) | 0 (0.0%) |
| 4:00 PM to 11:59 PM | 0 (0.0%) | 0 (0.0%) |
| Total | 16 (100.0%) | 15 (100.0%) |
Housing Occupancy in Thorp
Occupancy by Ownership in Thorp
Of the total 50 dwellings in Thorp, owner-occupied units account for 28 (56.0%), while renter-occupied units make up 22 (44.0%).
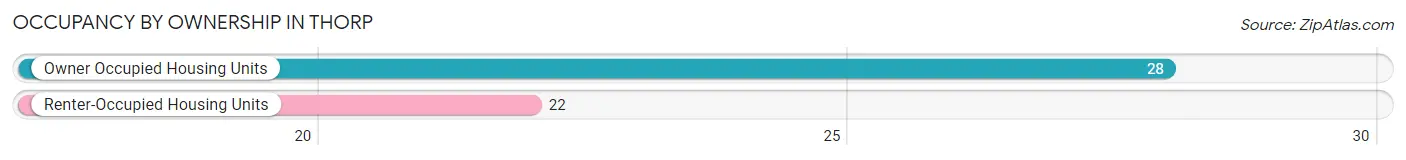
| Occupancy | # Housing Units | % Housing Units |
| Owner Occupied Housing Units | 28 | 56.0% |
| Renter-Occupied Housing Units | 22 | 44.0% |
| Total Occupied Housing Units | 50 | 100.0% |
Occupancy by Household Size in Thorp
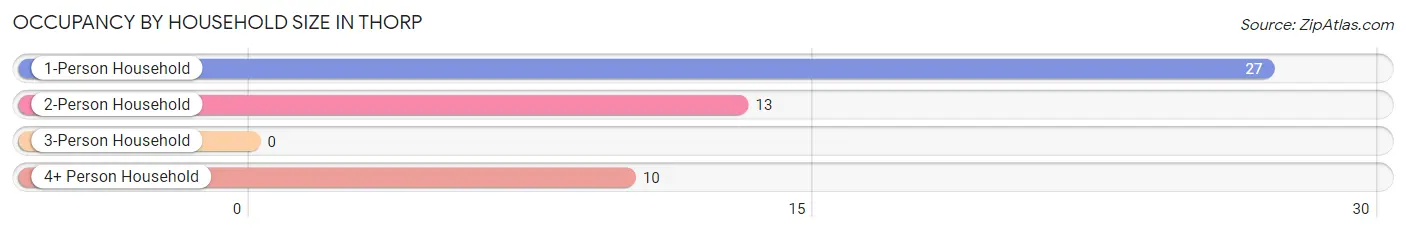
| Household Size | # Housing Units | % Housing Units |
| 1-Person Household | 27 | 54.0% |
| 2-Person Household | 13 | 26.0% |
| 3-Person Household | 0 | 0.0% |
| 4+ Person Household | 10 | 20.0% |
| Total Housing Units | 50 | 100.0% |
Occupancy by Ownership by Household Size in Thorp
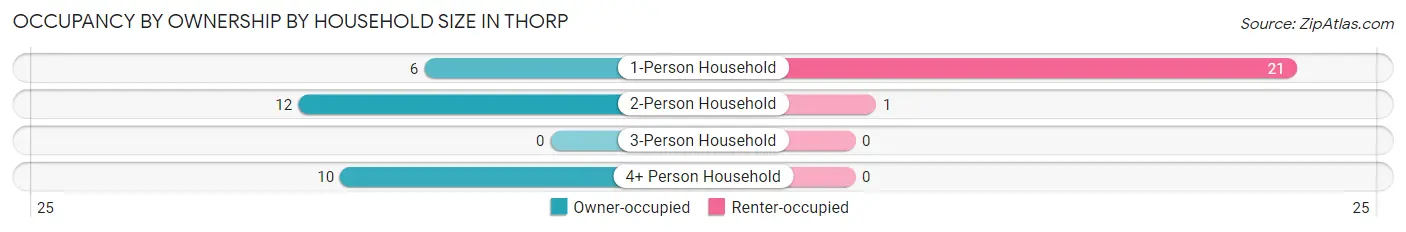
| Household Size | Owner-occupied | Renter-occupied |
| 1-Person Household | 6 (22.2%) | 21 (77.8%) |
| 2-Person Household | 12 (92.3%) | 1 (7.7%) |
| 3-Person Household | 0 (0.0%) | 0 (0.0%) |
| 4+ Person Household | 10 (100.0%) | 0 (0.0%) |
| Total Housing Units | 28 (56.0%) | 22 (44.0%) |
Occupancy by Educational Attainment in Thorp
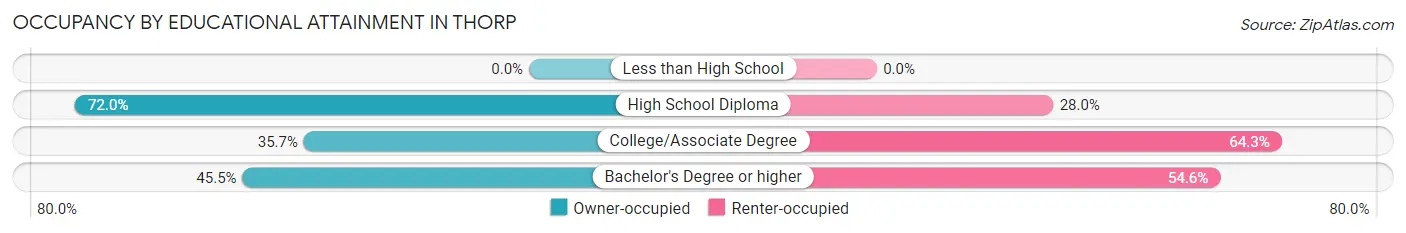
| Household Size | Owner-occupied | Renter-occupied |
| Less than High School | 0 (0.0%) | 0 (0.0%) |
| High School Diploma | 18 (72.0%) | 7 (28.0%) |
| College/Associate Degree | 5 (35.7%) | 9 (64.3%) |
| Bachelor's Degree or higher | 5 (45.5%) | 6 (54.5%) |
Occupancy by Age of Householder in Thorp
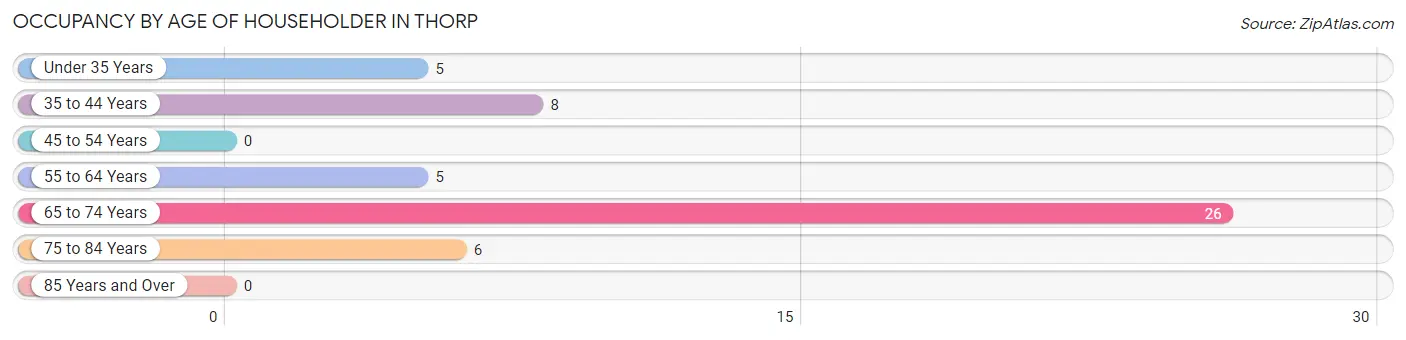
| Age Bracket | # Households | % Households |
| Under 35 Years | 5 | 10.0% |
| 35 to 44 Years | 8 | 16.0% |
| 45 to 54 Years | 0 | 0.0% |
| 55 to 64 Years | 5 | 10.0% |
| 65 to 74 Years | 26 | 52.0% |
| 75 to 84 Years | 6 | 12.0% |
| 85 Years and Over | 0 | 0.0% |
| Total | 50 | 100.0% |
Housing Finances in Thorp
Median Income by Occupancy in Thorp
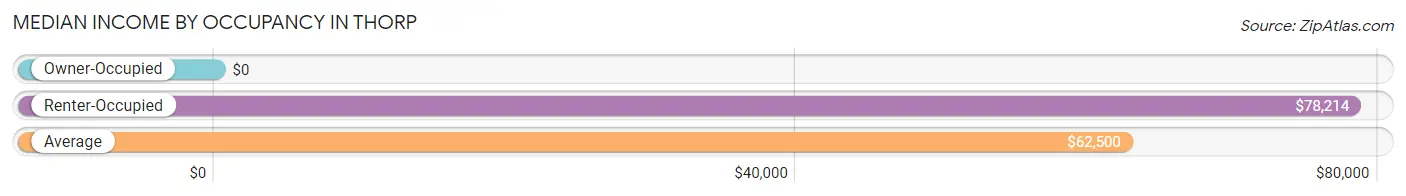
| Occupancy Type | # Households | Median Income |
| Owner-Occupied | 28 (56.0%) | $0 |
| Renter-Occupied | 22 (44.0%) | $78,214 |
| Average | 50 (100.0%) | $62,500 |
Occupancy by Householder Income Bracket in Thorp
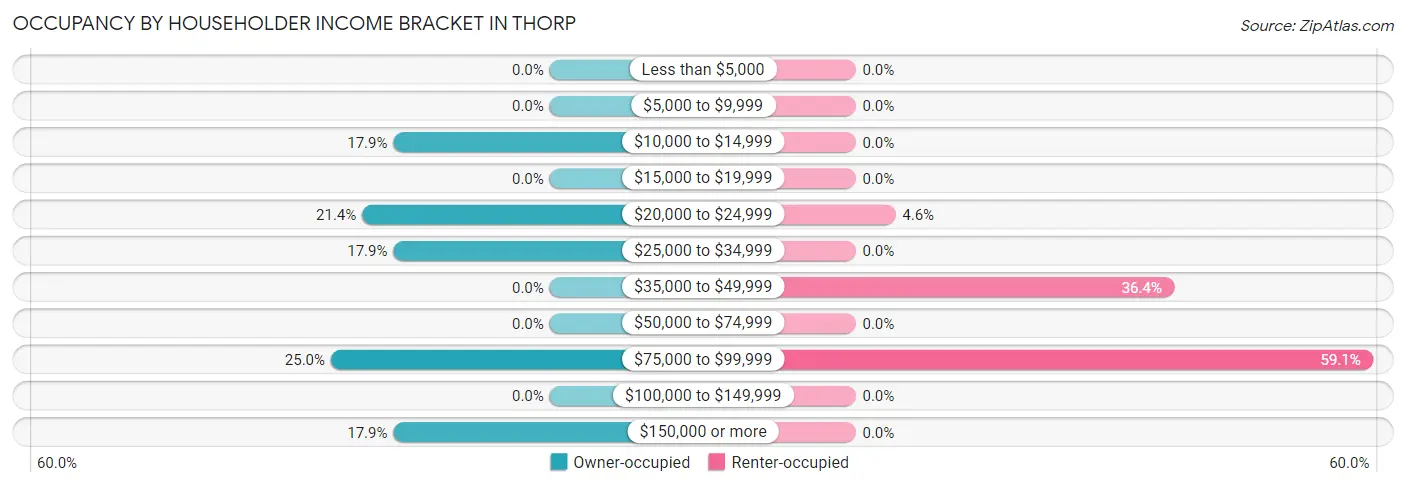
| Income Bracket | Owner-occupied | Renter-occupied |
| Less than $5,000 | 0 (0.0%) | 0 (0.0%) |
| $5,000 to $9,999 | 0 (0.0%) | 0 (0.0%) |
| $10,000 to $14,999 | 5 (17.9%) | 0 (0.0%) |
| $15,000 to $19,999 | 0 (0.0%) | 0 (0.0%) |
| $20,000 to $24,999 | 6 (21.4%) | 1 (4.5%) |
| $25,000 to $34,999 | 5 (17.9%) | 0 (0.0%) |
| $35,000 to $49,999 | 0 (0.0%) | 8 (36.4%) |
| $50,000 to $74,999 | 0 (0.0%) | 0 (0.0%) |
| $75,000 to $99,999 | 7 (25.0%) | 13 (59.1%) |
| $100,000 to $149,999 | 0 (0.0%) | 0 (0.0%) |
| $150,000 or more | 5 (17.9%) | 0 (0.0%) |
| Total | 28 (100.0%) | 22 (100.0%) |
Monthly Housing Cost Tiers in Thorp
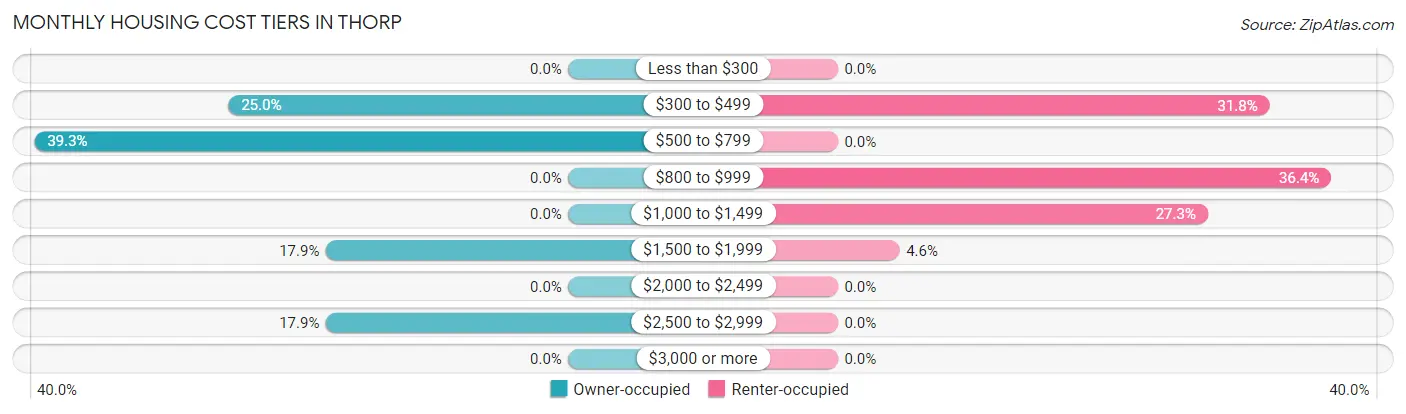
| Monthly Cost | Owner-occupied | Renter-occupied |
| Less than $300 | 0 (0.0%) | 0 (0.0%) |
| $300 to $499 | 7 (25.0%) | 7 (31.8%) |
| $500 to $799 | 11 (39.3%) | 0 (0.0%) |
| $800 to $999 | 0 (0.0%) | 8 (36.4%) |
| $1,000 to $1,499 | 0 (0.0%) | 6 (27.3%) |
| $1,500 to $1,999 | 5 (17.9%) | 1 (4.5%) |
| $2,000 to $2,499 | 0 (0.0%) | 0 (0.0%) |
| $2,500 to $2,999 | 5 (17.9%) | 0 (0.0%) |
| $3,000 or more | 0 (0.0%) | 0 (0.0%) |
| Total | 28 (100.0%) | 22 (100.0%) |
Physical Housing Characteristics in Thorp
Housing Structures in Thorp
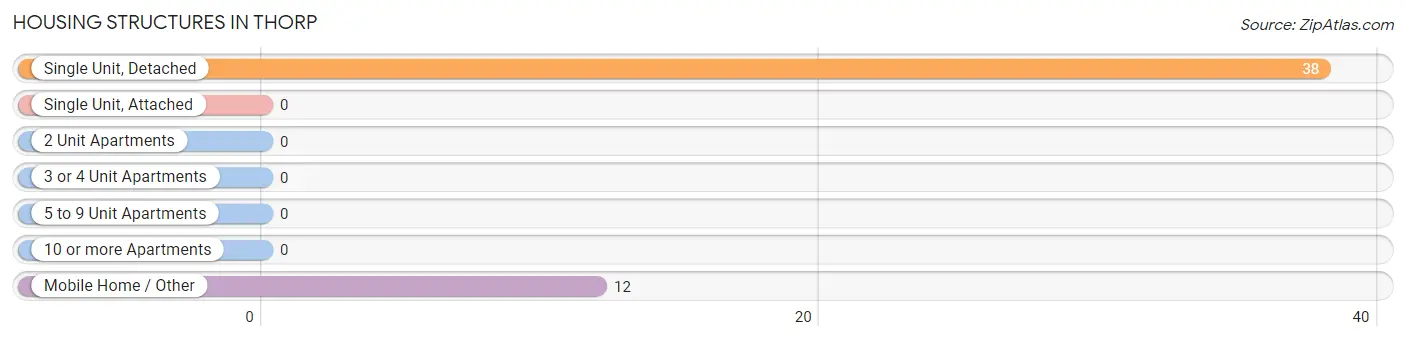
| Structure Type | # Housing Units | % Housing Units |
| Single Unit, Detached | 38 | 76.0% |
| Single Unit, Attached | 0 | 0.0% |
| 2 Unit Apartments | 0 | 0.0% |
| 3 or 4 Unit Apartments | 0 | 0.0% |
| 5 to 9 Unit Apartments | 0 | 0.0% |
| 10 or more Apartments | 0 | 0.0% |
| Mobile Home / Other | 12 | 24.0% |
| Total | 50 | 100.0% |
Housing Structures by Occupancy in Thorp
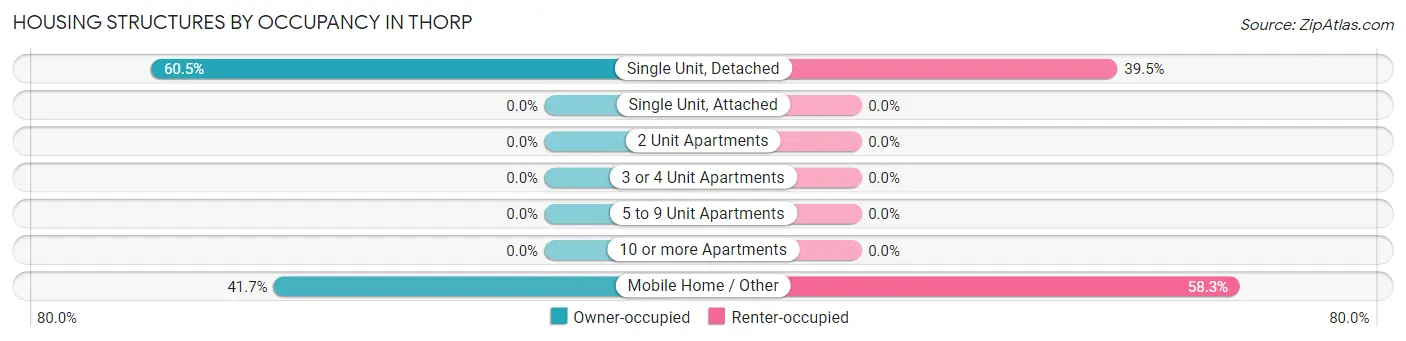
| Structure Type | Owner-occupied | Renter-occupied |
| Single Unit, Detached | 23 (60.5%) | 15 (39.5%) |
| Single Unit, Attached | 0 (0.0%) | 0 (0.0%) |
| 2 Unit Apartments | 0 (0.0%) | 0 (0.0%) |
| 3 or 4 Unit Apartments | 0 (0.0%) | 0 (0.0%) |
| 5 to 9 Unit Apartments | 0 (0.0%) | 0 (0.0%) |
| 10 or more Apartments | 0 (0.0%) | 0 (0.0%) |
| Mobile Home / Other | 5 (41.7%) | 7 (58.3%) |
| Total | 28 (56.0%) | 22 (44.0%) |
Housing Structures by Number of Rooms in Thorp
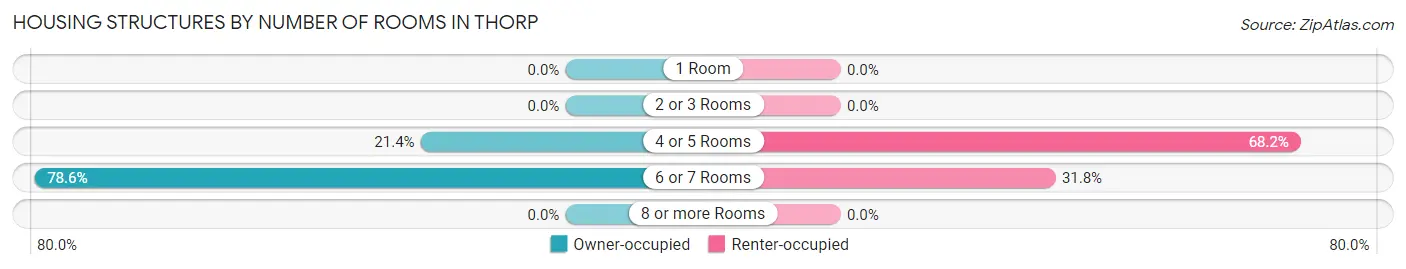
| Number of Rooms | Owner-occupied | Renter-occupied |
| 1 Room | 0 (0.0%) | 0 (0.0%) |
| 2 or 3 Rooms | 0 (0.0%) | 0 (0.0%) |
| 4 or 5 Rooms | 6 (21.4%) | 15 (68.2%) |
| 6 or 7 Rooms | 22 (78.6%) | 7 (31.8%) |
| 8 or more Rooms | 0 (0.0%) | 0 (0.0%) |
| Total | 28 (100.0%) | 22 (100.0%) |
Housing Structure by Heating Type in Thorp
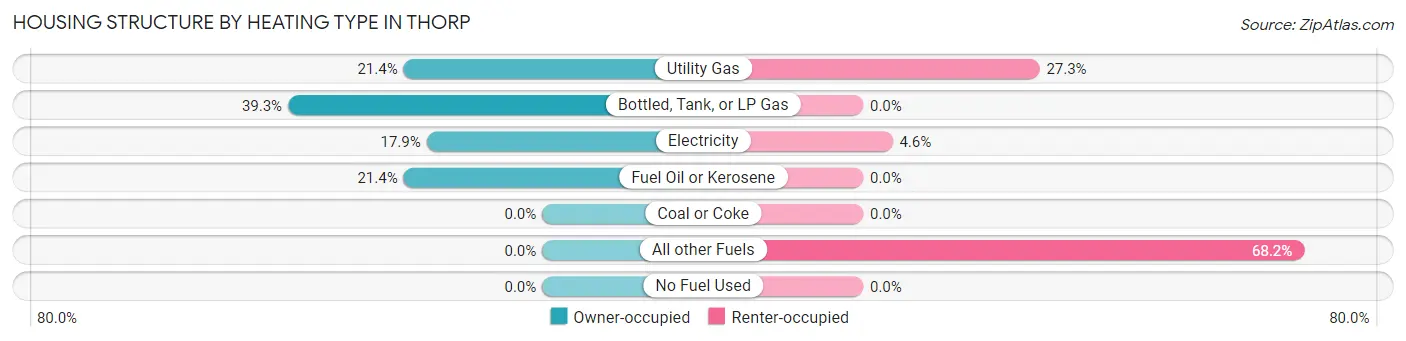
| Heating Type | Owner-occupied | Renter-occupied |
| Utility Gas | 6 (21.4%) | 6 (27.3%) |
| Bottled, Tank, or LP Gas | 11 (39.3%) | 0 (0.0%) |
| Electricity | 5 (17.9%) | 1 (4.5%) |
| Fuel Oil or Kerosene | 6 (21.4%) | 0 (0.0%) |
| Coal or Coke | 0 (0.0%) | 0 (0.0%) |
| All other Fuels | 0 (0.0%) | 15 (68.2%) |
| No Fuel Used | 0 (0.0%) | 0 (0.0%) |
| Total | 28 (100.0%) | 22 (100.0%) |
Household Vehicle Usage in Thorp
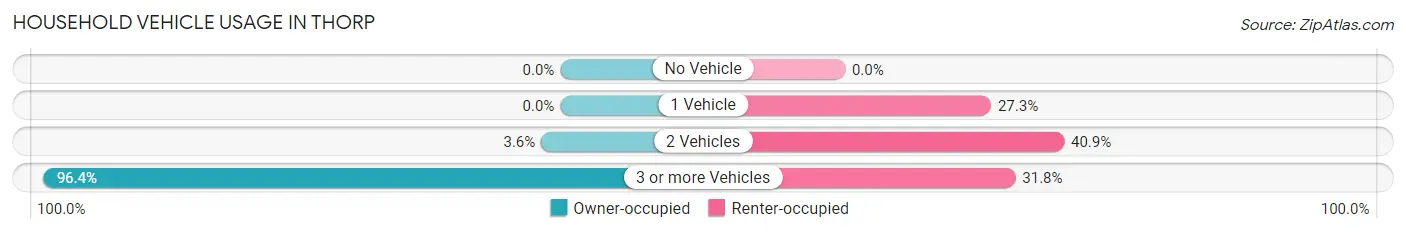
| Vehicles per Household | Owner-occupied | Renter-occupied |
| No Vehicle | 0 (0.0%) | 0 (0.0%) |
| 1 Vehicle | 0 (0.0%) | 6 (27.3%) |
| 2 Vehicles | 1 (3.6%) | 9 (40.9%) |
| 3 or more Vehicles | 27 (96.4%) | 7 (31.8%) |
| Total | 28 (100.0%) | 22 (100.0%) |
Real Estate & Mortgages in Thorp
Real Estate and Mortgage Overview in Thorp
| Characteristic | Without Mortgage | With Mortgage |
| Housing Units | 18 | 10 |
| Median Property Value | - | - |
| Median Household Income | - | - |
| Monthly Housing Costs | $618 | $0 |
| Real Estate Taxes | $1,250 | $0 |
Property Value by Mortgage Status in Thorp
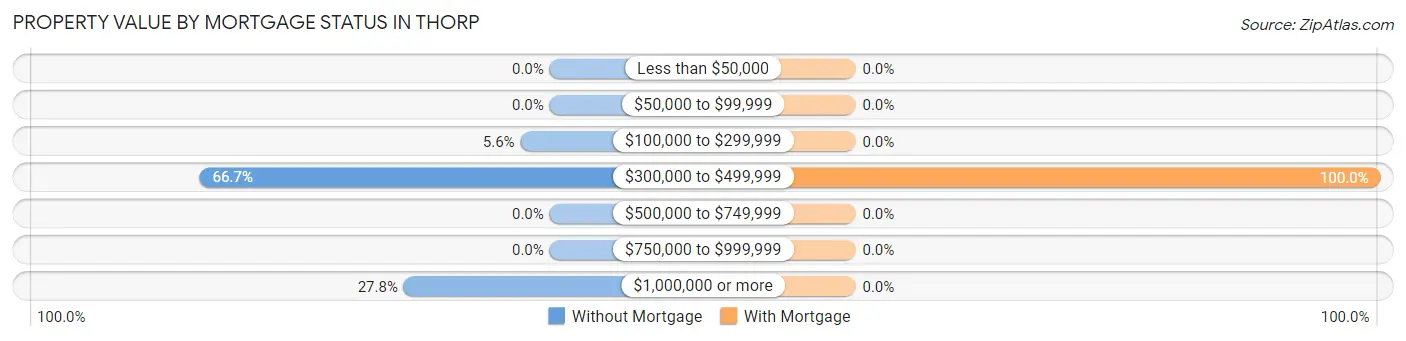
| Property Value | Without Mortgage | With Mortgage |
| Less than $50,000 | 0 (0.0%) | 0 (0.0%) |
| $50,000 to $99,999 | 0 (0.0%) | 0 (0.0%) |
| $100,000 to $299,999 | 1 (5.6%) | 0 (0.0%) |
| $300,000 to $499,999 | 12 (66.7%) | 10 (100.0%) |
| $500,000 to $749,999 | 0 (0.0%) | 0 (0.0%) |
| $750,000 to $999,999 | 0 (0.0%) | 0 (0.0%) |
| $1,000,000 or more | 5 (27.8%) | 0 (0.0%) |
| Total | 18 (100.0%) | 10 (100.0%) |
Household Income by Mortgage Status in Thorp
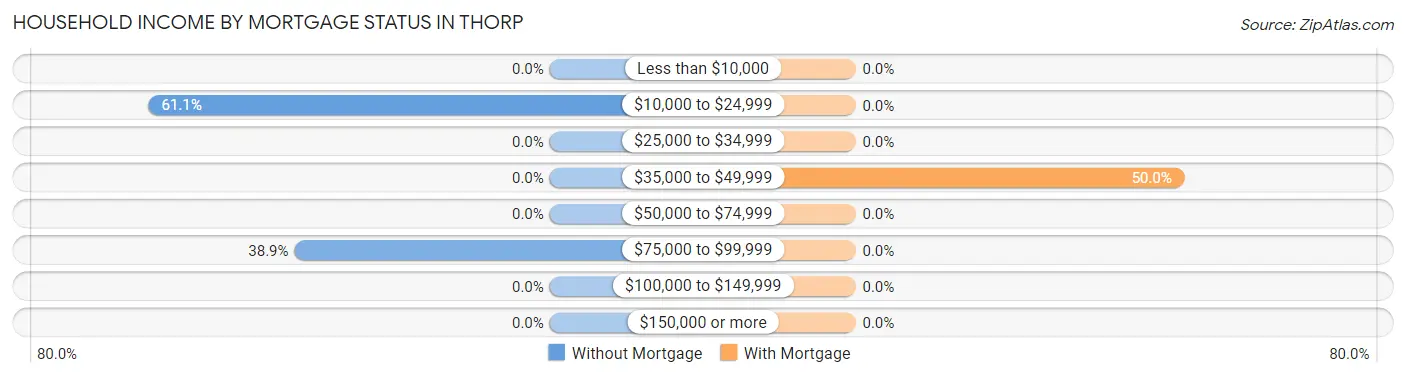
| Household Income | Without Mortgage | With Mortgage |
| Less than $10,000 | 0 (0.0%) | 0 (0.0%) |
| $10,000 to $24,999 | 11 (61.1%) | 0 (0.0%) |
| $25,000 to $34,999 | 0 (0.0%) | 0 (0.0%) |
| $35,000 to $49,999 | 0 (0.0%) | 5 (50.0%) |
| $50,000 to $74,999 | 0 (0.0%) | 0 (0.0%) |
| $75,000 to $99,999 | 7 (38.9%) | 0 (0.0%) |
| $100,000 to $149,999 | 0 (0.0%) | 0 (0.0%) |
| $150,000 or more | 0 (0.0%) | 0 (0.0%) |
| Total | 18 (100.0%) | 10 (100.0%) |
Property Value to Household Income Ratio in Thorp
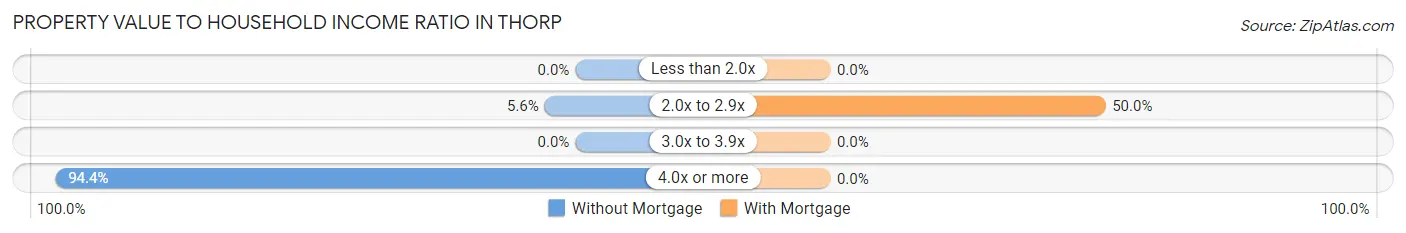
| Value-to-Income Ratio | Without Mortgage | With Mortgage |
| Less than 2.0x | 0 (0.0%) | 0 (0.0%) |
| 2.0x to 2.9x | 1 (5.6%) | 5 (50.0%) |
| 3.0x to 3.9x | 0 (0.0%) | 0 (0.0%) |
| 4.0x or more | 17 (94.4%) | 0 (0.0%) |
| Total | 18 (100.0%) | 10 (100.0%) |
Real Estate Taxes by Mortgage Status in Thorp
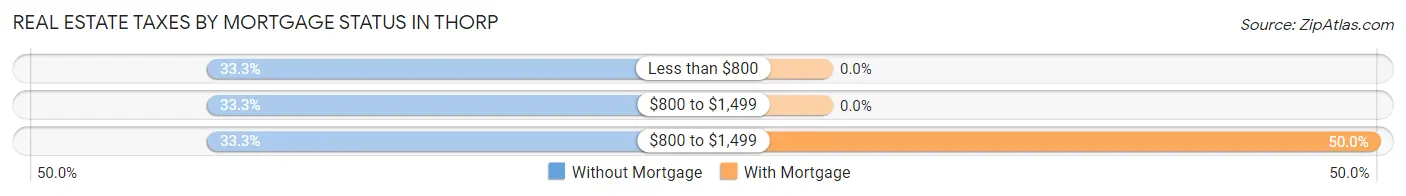
| Property Taxes | Without Mortgage | With Mortgage |
| Less than $800 | 6 (33.3%) | 0 (0.0%) |
| $800 to $1,499 | 6 (33.3%) | 0 (0.0%) |
| $800 to $1,499 | 6 (33.3%) | 5 (50.0%) |
| Total | 18 (100.0%) | 10 (100.0%) |
Health & Disability in Thorp
Health Insurance Coverage by Age in Thorp
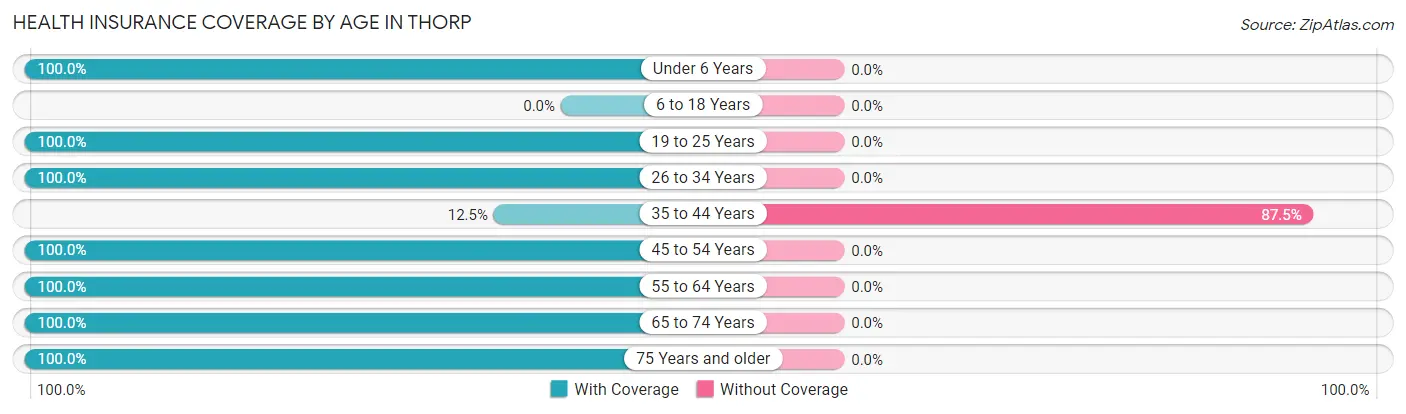
| Age Bracket | With Coverage | Without Coverage |
| Under 6 Years | 6 (100.0%) | 0 (0.0%) |
| 6 to 18 Years | 0 (0.0%) | 0 (0.0%) |
| 19 to 25 Years | 4 (100.0%) | 0 (0.0%) |
| 26 to 34 Years | 10 (100.0%) | 0 (0.0%) |
| 35 to 44 Years | 1 (12.5%) | 7 (87.5%) |
| 45 to 54 Years | 7 (100.0%) | 0 (0.0%) |
| 55 to 64 Years | 10 (100.0%) | 0 (0.0%) |
| 65 to 74 Years | 35 (100.0%) | 0 (0.0%) |
| 75 Years and older | 10 (100.0%) | 0 (0.0%) |
| Total | 83 (92.2%) | 7 (7.8%) |
Health Insurance Coverage by Citizenship Status in Thorp
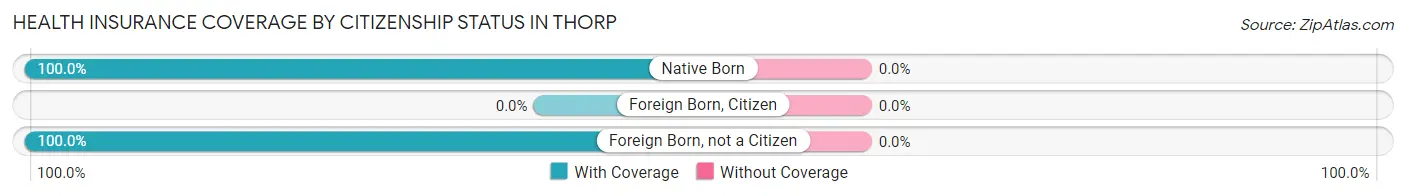
| Citizenship Status | With Coverage | Without Coverage |
| Native Born | 6 (100.0%) | 0 (0.0%) |
| Foreign Born, Citizen | 0 (0.0%) | 0 (0.0%) |
| Foreign Born, not a Citizen | 4 (100.0%) | 0 (0.0%) |
Health Insurance Coverage by Household Income in Thorp
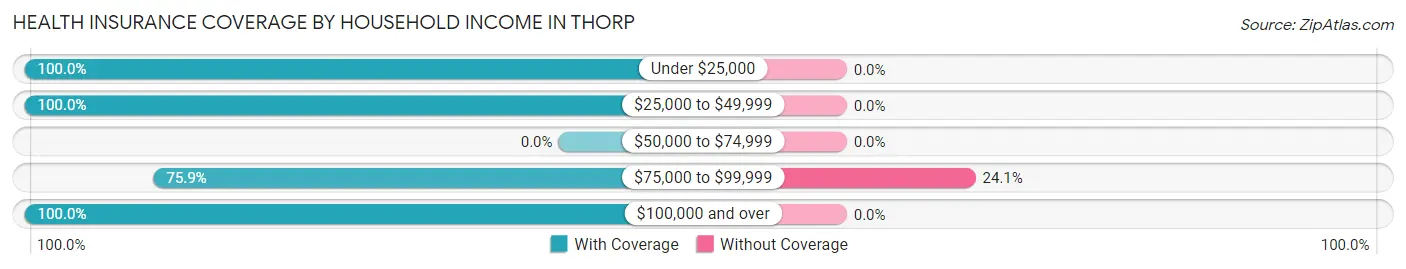
| Household Income | With Coverage | Without Coverage |
| Under $25,000 | 18 (100.0%) | 0 (0.0%) |
| $25,000 to $49,999 | 23 (100.0%) | 0 (0.0%) |
| $50,000 to $74,999 | 0 (0.0%) | 0 (0.0%) |
| $75,000 to $99,999 | 22 (75.9%) | 7 (24.1%) |
| $100,000 and over | 20 (100.0%) | 0 (0.0%) |
Public vs Private Health Insurance Coverage by Age in Thorp
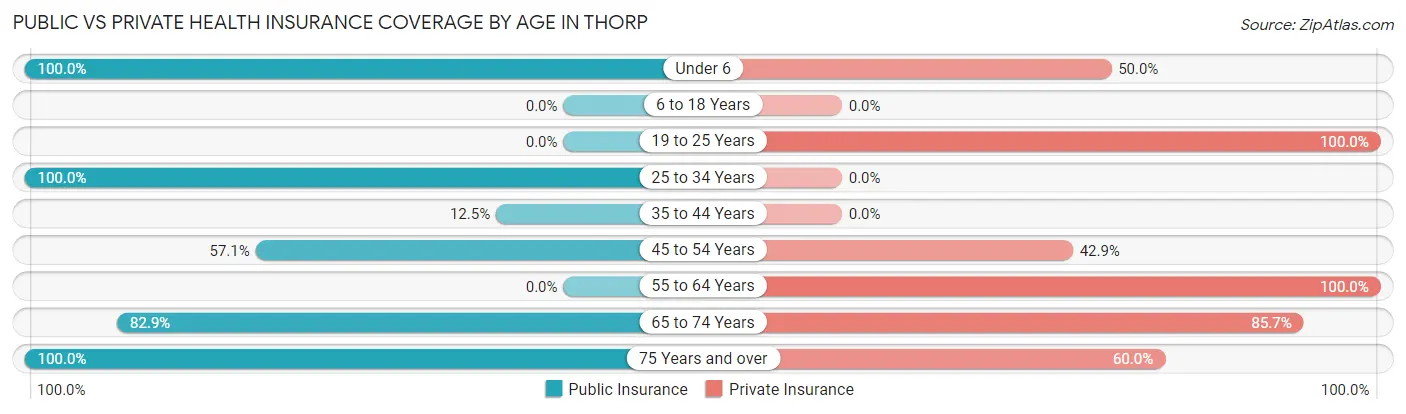
| Age Bracket | Public Insurance | Private Insurance |
| Under 6 | 6 (100.0%) | 3 (50.0%) |
| 6 to 18 Years | 0 (0.0%) | 0 (0.0%) |
| 19 to 25 Years | 0 (0.0%) | 4 (100.0%) |
| 25 to 34 Years | 10 (100.0%) | 0 (0.0%) |
| 35 to 44 Years | 1 (12.5%) | 0 (0.0%) |
| 45 to 54 Years | 4 (57.1%) | 3 (42.9%) |
| 55 to 64 Years | 0 (0.0%) | 10 (100.0%) |
| 65 to 74 Years | 29 (82.9%) | 30 (85.7%) |
| 75 Years and over | 10 (100.0%) | 6 (60.0%) |
| Total | 60 (66.7%) | 56 (62.2%) |
Disability Status by Sex by Age in Thorp
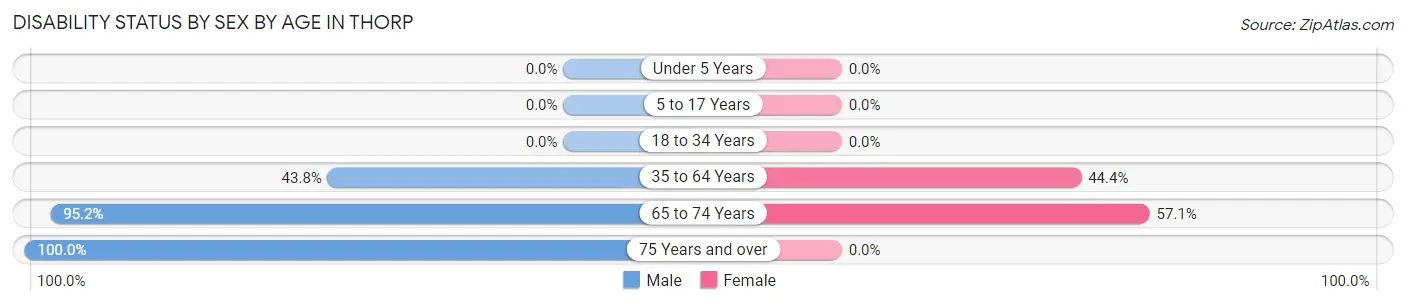
| Age Bracket | Male | Female |
| Under 5 Years | 0 (0.0%) | 0 (0.0%) |
| 5 to 17 Years | 0 (0.0%) | 0 (0.0%) |
| 18 to 34 Years | 0 (0.0%) | 0 (0.0%) |
| 35 to 64 Years | 7 (43.8%) | 4 (44.4%) |
| 65 to 74 Years | 20 (95.2%) | 8 (57.1%) |
| 75 Years and over | 10 (100.0%) | 0 (0.0%) |
Disability Class by Sex by Age in Thorp
Disability Class: Hearing Difficulty
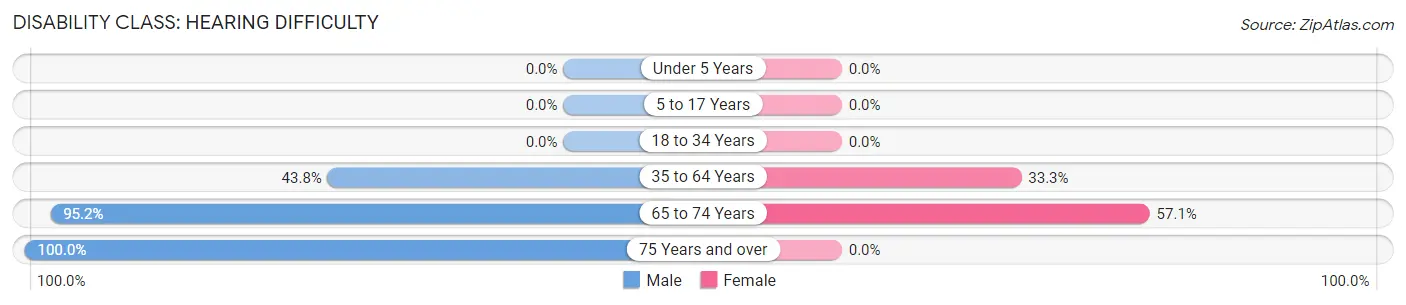
| Age Bracket | Male | Female |
| Under 5 Years | 0 (0.0%) | 0 (0.0%) |
| 5 to 17 Years | 0 (0.0%) | 0 (0.0%) |
| 18 to 34 Years | 0 (0.0%) | 0 (0.0%) |
| 35 to 64 Years | 7 (43.8%) | 3 (33.3%) |
| 65 to 74 Years | 20 (95.2%) | 8 (57.1%) |
| 75 Years and over | 10 (100.0%) | 0 (0.0%) |
Disability Class: Vision Difficulty
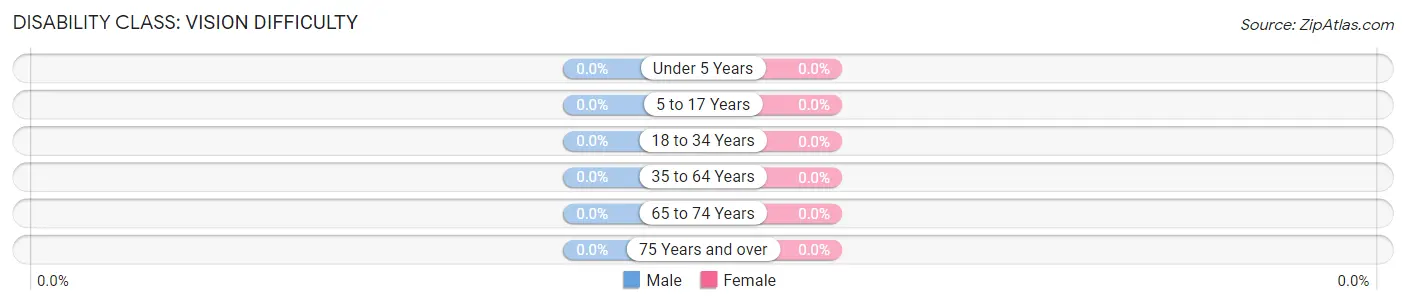
| Age Bracket | Male | Female |
| Under 5 Years | 0 (0.0%) | 0 (0.0%) |
| 5 to 17 Years | 0 (0.0%) | 0 (0.0%) |
| 18 to 34 Years | 0 (0.0%) | 0 (0.0%) |
| 35 to 64 Years | 0 (0.0%) | 0 (0.0%) |
| 65 to 74 Years | 0 (0.0%) | 0 (0.0%) |
| 75 Years and over | 0 (0.0%) | 0 (0.0%) |
Disability Class: Cognitive Difficulty
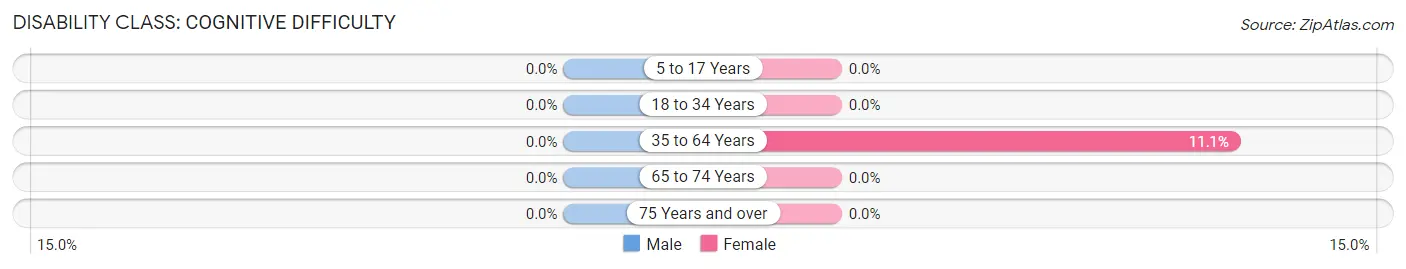
| Age Bracket | Male | Female |
| 5 to 17 Years | 0 (0.0%) | 0 (0.0%) |
| 18 to 34 Years | 0 (0.0%) | 0 (0.0%) |
| 35 to 64 Years | 0 (0.0%) | 1 (11.1%) |
| 65 to 74 Years | 0 (0.0%) | 0 (0.0%) |
| 75 Years and over | 0 (0.0%) | 0 (0.0%) |
Disability Class: Ambulatory Difficulty
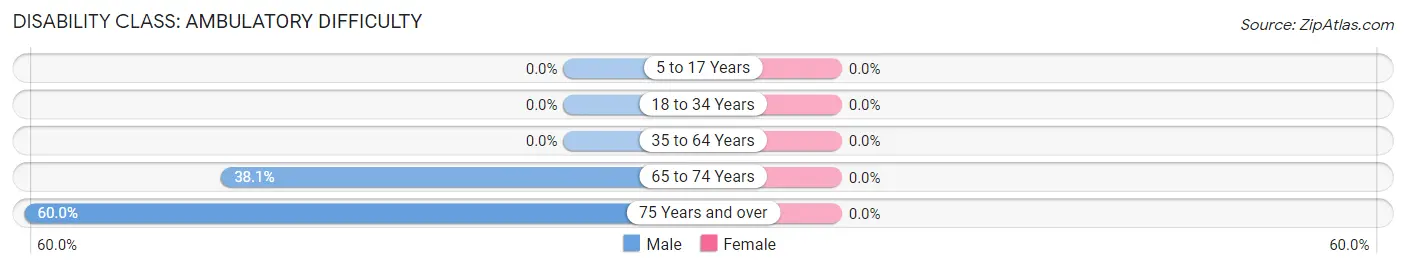
| Age Bracket | Male | Female |
| 5 to 17 Years | 0 (0.0%) | 0 (0.0%) |
| 18 to 34 Years | 0 (0.0%) | 0 (0.0%) |
| 35 to 64 Years | 0 (0.0%) | 0 (0.0%) |
| 65 to 74 Years | 8 (38.1%) | 0 (0.0%) |
| 75 Years and over | 6 (60.0%) | 0 (0.0%) |
Disability Class: Self-Care Difficulty
| Age Bracket | Male | Female |
| 5 to 17 Years | 0 (0.0%) | 0 (0.0%) |
| 18 to 34 Years | 0 (0.0%) | 0 (0.0%) |
| 35 to 64 Years | 0 (0.0%) | 0 (0.0%) |
| 65 to 74 Years | 0 (0.0%) | 0 (0.0%) |
| 75 Years and over | 0 (0.0%) | 0 (0.0%) |
Technology Access in Thorp
Computing Device Access in Thorp
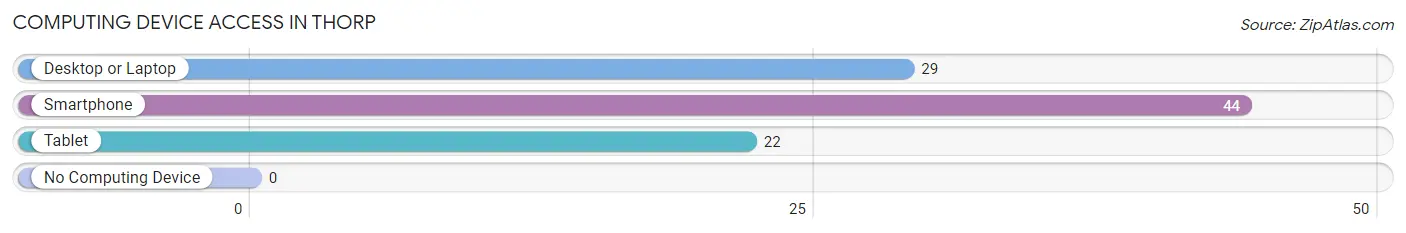
| Device Type | # Households | % Households |
| Desktop or Laptop | 29 | 58.0% |
| Smartphone | 44 | 88.0% |
| Tablet | 22 | 44.0% |
| No Computing Device | 0 | 0.0% |
| Total | 50 | 100.0% |
Internet Access in Thorp
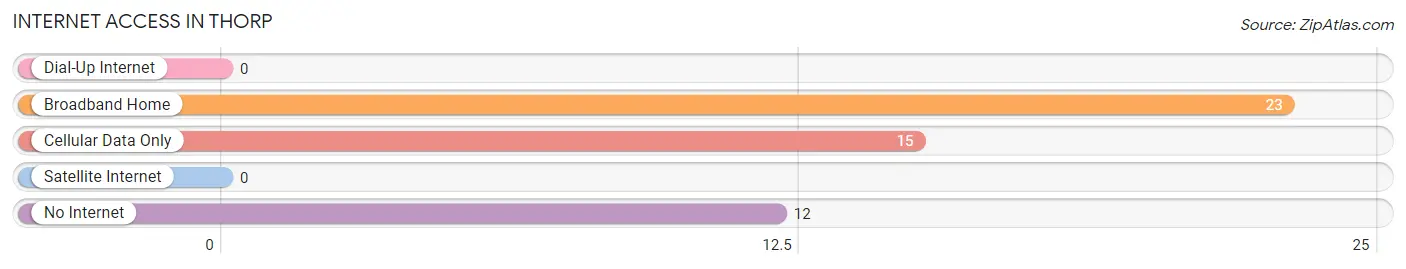
| Internet Type | # Households | % Households |
| Dial-Up Internet | 0 | 0.0% |
| Broadband Home | 23 | 46.0% |
| Cellular Data Only | 15 | 30.0% |
| Satellite Internet | 0 | 0.0% |
| No Internet | 12 | 24.0% |
| Total | 50 | 100.0% |
Thorp Summary
Thorp is a small unincorporated community located in Kittitas County, Washington, United States. It is situated in the Cascade Mountains, approximately 20 miles east of Ellensburg. Thorp is a rural community with a population of approximately 500 people.
History
Thorp was founded in 1883 by a group of settlers from the Midwest. The settlers were attracted to the area by the abundance of timber and the potential for farming. The town was named after one of the settlers, John Thorp, who was a prominent figure in the early development of the area.
The first post office in Thorp was established in 1884. The town grew slowly over the next few decades, with the population reaching around 200 by the early 1900s. The town was primarily an agricultural community, with the main crops being wheat, oats, and hay.
In the early 1900s, the town began to experience a period of growth. The Great Northern Railway built a line through Thorp in 1909, connecting the town to Ellensburg and other nearby towns. This allowed for increased trade and commerce, and the population of Thorp began to grow.
By the mid-1900s, Thorp had become a popular tourist destination. The town was known for its scenic beauty and outdoor activities, such as fishing, hunting, and camping. The town also had a number of small businesses, including a general store, a hotel, and a saloon.
Geography
Thorp is located in the Cascade Mountains of Washington State. The town is situated at an elevation of 2,400 feet, and is surrounded by mountains and forests. The nearby mountains include Mount Stuart, Mount Rainier, and Mount Adams.
The climate in Thorp is generally mild, with warm summers and cold winters. The average annual temperature is around 50 degrees Fahrenheit. The area receives an average of 20 inches of precipitation per year, with most of it falling in the form of snow during the winter months.
Economy
The economy of Thorp is largely based on agriculture and tourism. The town is home to several small farms, which produce a variety of crops, including wheat, oats, hay, and vegetables. The town also has a number of small businesses, including a general store, a hotel, and a saloon.
Tourism is an important part of the economy of Thorp. The town is a popular destination for outdoor activities, such as fishing, hunting, and camping. The nearby mountains provide a scenic backdrop for these activities.
Demographics
As of the 2010 census, the population of Thorp was 498. The racial makeup of the town was 95.2% White, 0.2% African American, 0.4% Native American, 0.4% Asian, 0.2% Pacific Islander, and 3.6% from other races. The median household income was $37,500, and the median age was 39.7 years.
Thorp is a small, rural community with a close-knit population. The town is known for its friendly atmosphere and its scenic beauty. It is a popular destination for outdoor activities, and is a great place to live for those who enjoy the outdoors.
Common Questions
What is Per Capita Income in Thorp?
Per Capita income in Thorp is $39,111.
What is the Median Household income in Thorp?
Median Household Income in Thorp is $62,500.
What is Inequality or Gini Index in Thorp?
Inequality or Gini Index in Thorp is 0.46.
What is the Total Population of Thorp?
Total Population of Thorp is 90.
What is the Total Male Population of Thorp?
Total Male Population of Thorp is 55.
What is the Total Female Population of Thorp?
Total Female Population of Thorp is 35.
What is the Ratio of Males per 100 Females in Thorp?
There are 157.14 Males per 100 Females in Thorp.
What is the Ratio of Females per 100 Males in Thorp?
There are 63.64 Females per 100 Males in Thorp.
What is the Median Population Age in Thorp?
Median Population Age in Thorp is 61.5 Years.
What is the Average Family Size in Thorp
Average Family Size in Thorp is 2.7 People.
What is the Average Household Size in Thorp
Average Household Size in Thorp is 1.8 People.
How Large is the Labor Force in Thorp?
There are 47 People in the Labor Forcein in Thorp.
What is the Percentage of People in the Labor Force in Thorp?
56.0% of People are in the Labor Force in Thorp.
What is the Unemployment Rate in Thorp?
Unemployment Rate in Thorp is 12.8%.