Koosharem, UT Map & Demographics
Koosharem Map
Koosharem Overview
$17,071
PER CAPITA INCOME
$63,500
AVG FAMILY INCOME
$58,594
AVG HOUSEHOLD INCOME
63.4%
WAGE / INCOME GAP [ % ]
36.6¢/ $1
WAGE / INCOME GAP [ $ ]
0.31
INEQUALITY / GINI INDEX
251
TOTAL POPULATION
128
MALE POPULATION
123
FEMALE POPULATION
104.07
MALES / 100 FEMALES
96.09
FEMALES / 100 MALES
19.3
MEDIAN AGE
3.3
AVG FAMILY SIZE
2.8
AVG HOUSEHOLD SIZE
74
LABOR FORCE [ PEOPLE ]
46.0%
PERCENT IN LABOR FORCE
Koosharem Zip Codes
Koosharem Area Codes
Income in Koosharem
Income Overview in Koosharem
Per Capita Income in Koosharem is $17,071, while median incomes of families and households are $63,500 and $58,594 respectively.
| Characteristic | Number | Measure |
| Per Capita Income | 251 | $17,071 |
| Median Family Income | 52 | $63,500 |
| Mean Family Income | 52 | $67,171 |
| Median Household Income | 67 | $58,594 |
| Mean Household Income | 67 | $57,809 |
| Income Deficit | 52 | $0 |
| Wage / Income Gap (%) | 251 | 63.36% |
| Wage / Income Gap ($) | 251 | 36.64¢ per $1 |
| Gini / Inequality Index | 251 | 0.31 |
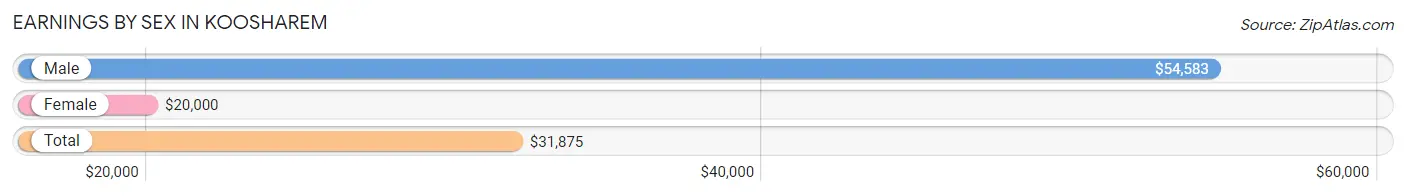
Earnings by Sex in Koosharem
Average Earnings in Koosharem are $31,875, $54,583 for men and $20,000 for women, a difference of 63.4%.
| Sex | Number | Average Earnings |
| Male | 37 (41.6%) | $54,583 |
| Female | 52 (58.4%) | $20,000 |
| Total | 89 (100.0%) | $31,875 |
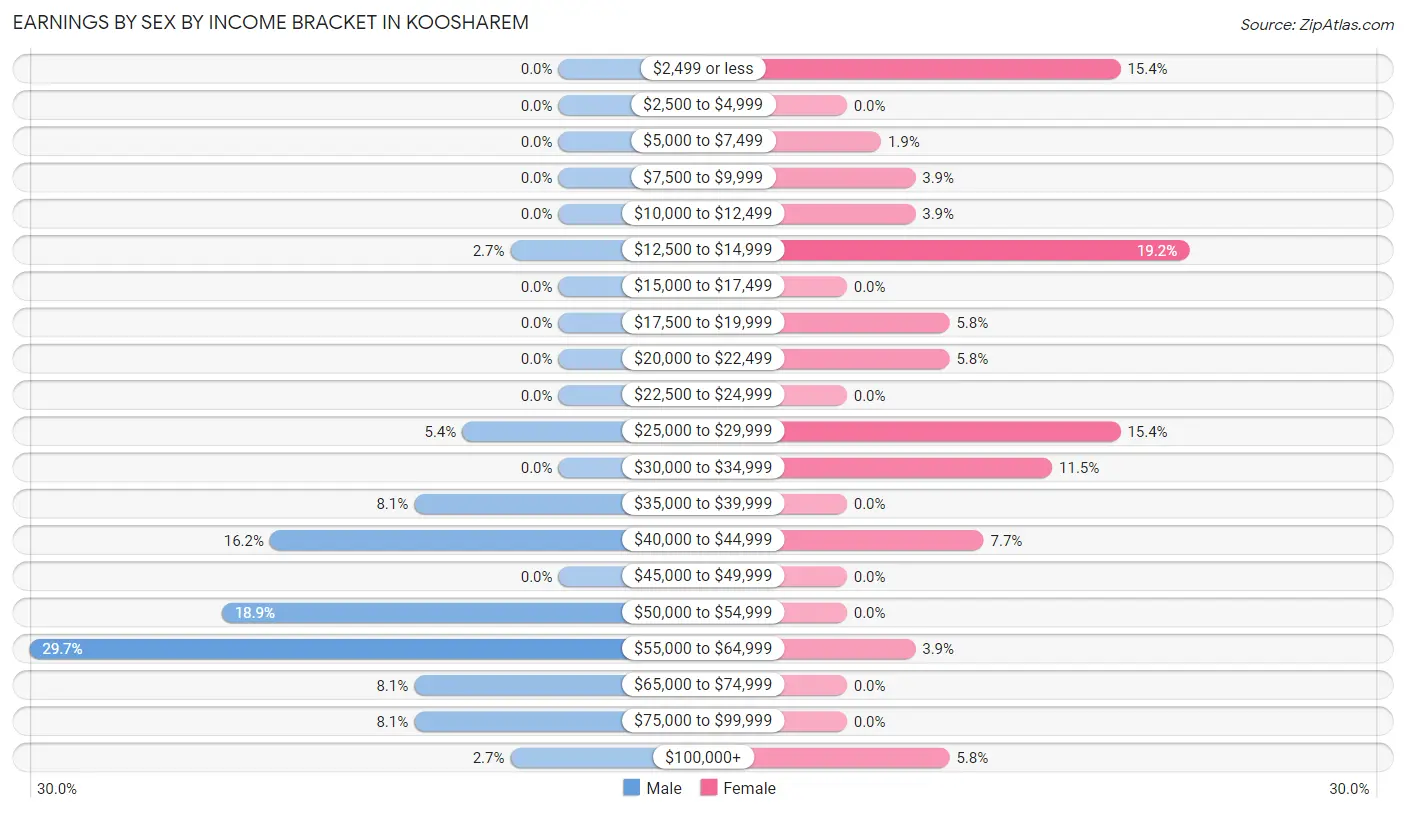
Earnings by Sex by Income Bracket in Koosharem
The most common earnings brackets in Koosharem are $55,000 to $64,999 for men (11 | 29.7%) and $12,500 to $14,999 for women (10 | 19.2%).
| Income | Male | Female |
| $2,499 or less | 0 (0.0%) | 8 (15.4%) |
| $2,500 to $4,999 | 0 (0.0%) | 0 (0.0%) |
| $5,000 to $7,499 | 0 (0.0%) | 1 (1.9%) |
| $7,500 to $9,999 | 0 (0.0%) | 2 (3.8%) |
| $10,000 to $12,499 | 0 (0.0%) | 2 (3.8%) |
| $12,500 to $14,999 | 1 (2.7%) | 10 (19.2%) |
| $15,000 to $17,499 | 0 (0.0%) | 0 (0.0%) |
| $17,500 to $19,999 | 0 (0.0%) | 3 (5.8%) |
| $20,000 to $22,499 | 0 (0.0%) | 3 (5.8%) |
| $22,500 to $24,999 | 0 (0.0%) | 0 (0.0%) |
| $25,000 to $29,999 | 2 (5.4%) | 8 (15.4%) |
| $30,000 to $34,999 | 0 (0.0%) | 6 (11.5%) |
| $35,000 to $39,999 | 3 (8.1%) | 0 (0.0%) |
| $40,000 to $44,999 | 6 (16.2%) | 4 (7.7%) |
| $45,000 to $49,999 | 0 (0.0%) | 0 (0.0%) |
| $50,000 to $54,999 | 7 (18.9%) | 0 (0.0%) |
| $55,000 to $64,999 | 11 (29.7%) | 2 (3.8%) |
| $65,000 to $74,999 | 3 (8.1%) | 0 (0.0%) |
| $75,000 to $99,999 | 3 (8.1%) | 0 (0.0%) |
| $100,000+ | 1 (2.7%) | 3 (5.8%) |
| Total | 37 (100.0%) | 52 (100.0%) |
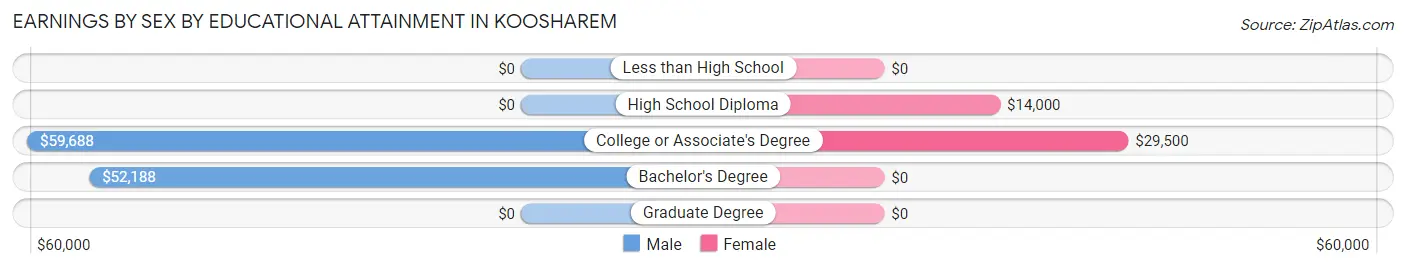
Earnings by Sex by Educational Attainment in Koosharem
Average earnings in Koosharem are $54,583 for men and $27,813 for women, a difference of 49.0%. Men with an educational attainment of college or associate's degree enjoy the highest average annual earnings of $59,688, while those with bachelor's degree education earn the least with $52,188. Women with an educational attainment of college or associate's degree earn the most with the average annual earnings of $29,500, while those with high school diploma education have the smallest earnings of $14,000.
| Educational Attainment | Male Income | Female Income |
| Less than High School | - | - |
| High School Diploma | - | - |
| College or Associate's Degree | $59,688 | $29,500 |
| Bachelor's Degree | $52,188 | $0 |
| Graduate Degree | - | - |
| Total | $54,583 | $27,813 |
Family Income in Koosharem
Family Income Brackets in Koosharem
According to the Koosharem family income data, there are 19 families falling into the $50,000 to $74,999 income range, which is the most common income bracket and makes up 36.5% of all families.
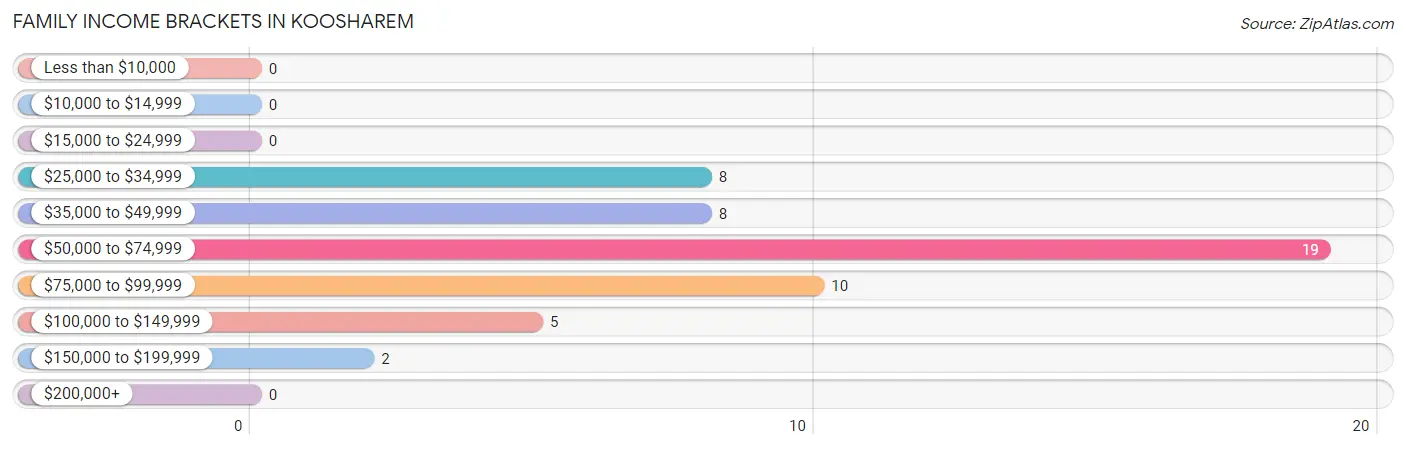
| Income Bracket | # Families | % Families |
| Less than $10,000 | 0 | 0.0% |
| $10,000 to $14,999 | 0 | 0.0% |
| $15,000 to $24,999 | 0 | 0.0% |
| $25,000 to $34,999 | 8 | 15.4% |
| $35,000 to $49,999 | 8 | 15.4% |
| $50,000 to $74,999 | 19 | 36.5% |
| $75,000 to $99,999 | 10 | 19.2% |
| $100,000 to $149,999 | 5 | 9.6% |
| $150,000 to $199,999 | 2 | 3.8% |
| $200,000+ | 0 | 0.0% |
Family Income by Famaliy Size in Koosharem
2-person families (29 | 55.8%) account for the highest median family income in Koosharem with $47,031 per family, while 2-person families (29 | 55.8%) have the highest median income of $23,516 per family member.
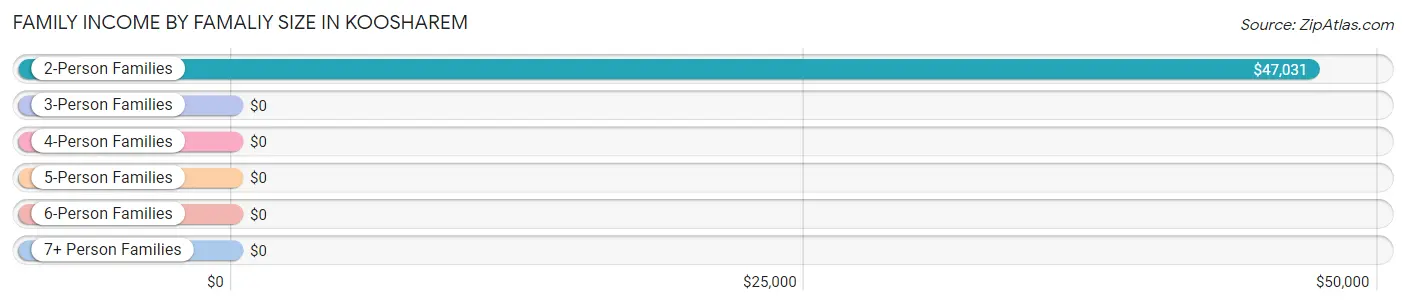
| Income Bracket | # Families | Median Income |
| 2-Person Families | 29 (55.8%) | $47,031 |
| 3-Person Families | 7 (13.5%) | $0 |
| 4-Person Families | 7 (13.5%) | $0 |
| 5-Person Families | 0 (0.0%) | $0 |
| 6-Person Families | 6 (11.5%) | $0 |
| 7+ Person Families | 3 (5.8%) | $0 |
| Total | 52 (100.0%) | $63,500 |
Family Income by Number of Earners in Koosharem
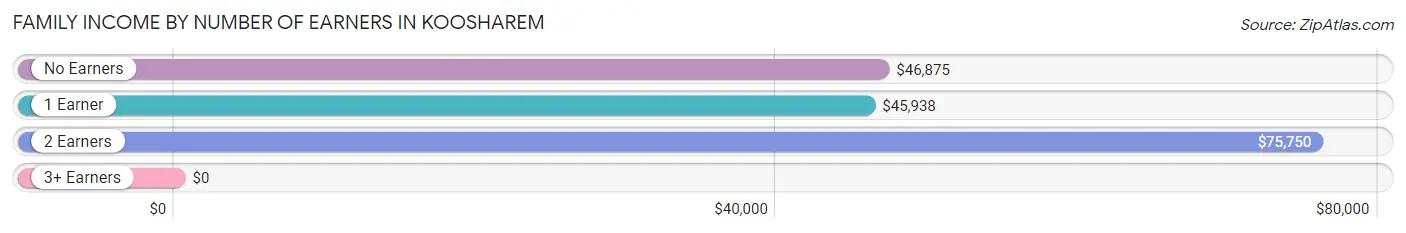
| Number of Earners | # Families | Median Income |
| No Earners | 10 (19.2%) | $46,875 |
| 1 Earner | 15 (28.8%) | $45,938 |
| 2 Earners | 23 (44.2%) | $75,750 |
| 3+ Earners | 4 (7.7%) | $0 |
| Total | 52 (100.0%) | $63,500 |
Household Income in Koosharem
Household Income Brackets in Koosharem
With 19 households falling in the category, the $50,000 to $74,999 income range is the most frequent in Koosharem, accounting for 28.4% of all households.
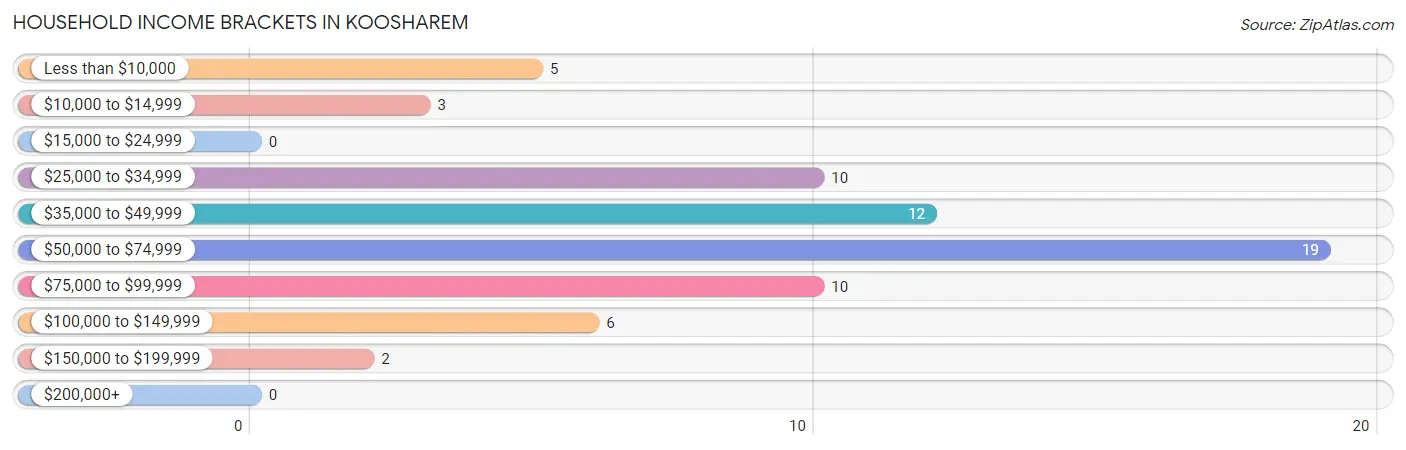
| Income Bracket | # Households | % Households |
| Less than $10,000 | 5 | 7.5% |
| $10,000 to $14,999 | 3 | 4.5% |
| $15,000 to $24,999 | 0 | 0.0% |
| $25,000 to $34,999 | 10 | 14.9% |
| $35,000 to $49,999 | 12 | 17.9% |
| $50,000 to $74,999 | 19 | 28.4% |
| $75,000 to $99,999 | 10 | 14.9% |
| $100,000 to $149,999 | 6 | 9.0% |
| $150,000 to $199,999 | 2 | 3.0% |
| $200,000+ | 0 | 0.0% |
Household Income by Householder Age in Koosharem
The median household income in Koosharem is $58,594, with the highest median household income of $73,958 found in the 25 to 44 years age bracket for the primary householder. A total of 15 households (22.4%) fall into this category. Meanwhile, the 15 to 24 years age bracket for the primary householder has the lowest median household income of $0, with 3 households (4.5%) in this group.
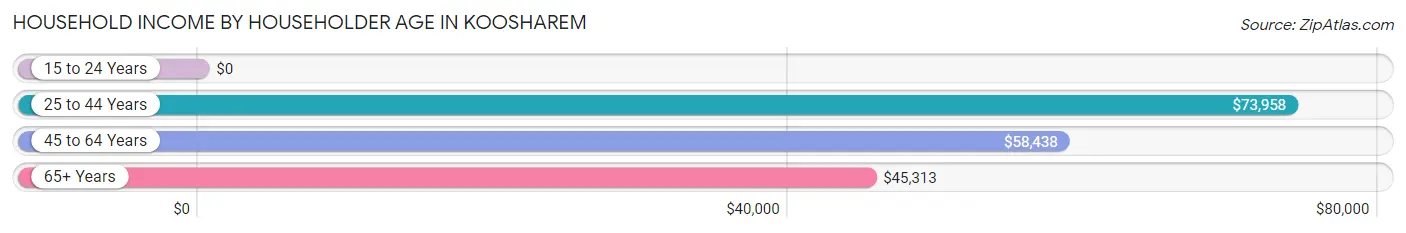
| Income Bracket | # Households | Median Income |
| 15 to 24 Years | 3 (4.5%) | $0 |
| 25 to 44 Years | 15 (22.4%) | $73,958 |
| 45 to 64 Years | 23 (34.3%) | $58,438 |
| 65+ Years | 26 (38.8%) | $45,313 |
| Total | 67 (100.0%) | $58,594 |
Poverty in Koosharem
Income Below Poverty by Sex and Age in Koosharem
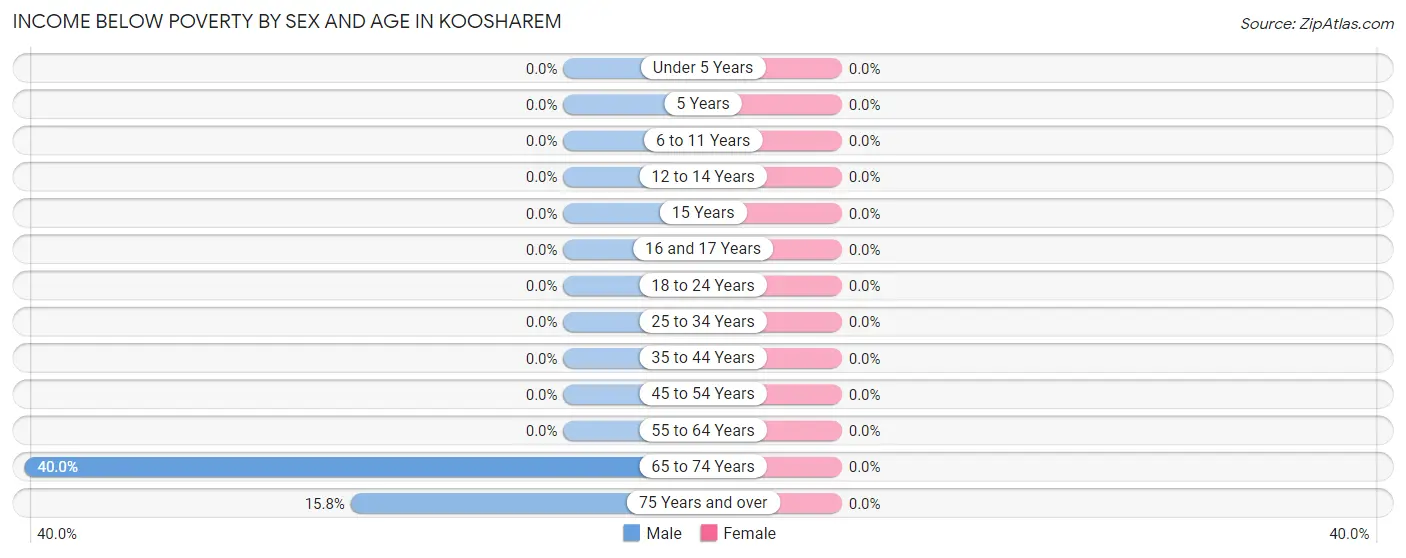
| Age Bracket | Male | Female |
| Under 5 Years | 0 (0.0%) | 0 (0.0%) |
| 5 Years | 0 (0.0%) | 0 (0.0%) |
| 6 to 11 Years | 0 (0.0%) | 0 (0.0%) |
| 12 to 14 Years | 0 (0.0%) | 0 (0.0%) |
| 15 Years | 0 (0.0%) | 0 (0.0%) |
| 16 and 17 Years | 0 (0.0%) | 0 (0.0%) |
| 18 to 24 Years | 0 (0.0%) | 0 (0.0%) |
| 25 to 34 Years | 0 (0.0%) | 0 (0.0%) |
| 35 to 44 Years | 0 (0.0%) | 0 (0.0%) |
| 45 to 54 Years | 0 (0.0%) | 0 (0.0%) |
| 55 to 64 Years | 0 (0.0%) | 0 (0.0%) |
| 65 to 74 Years | 2 (40.0%) | 0 (0.0%) |
| 75 Years and over | 3 (15.8%) | 0 (0.0%) |
| Total | 5 (5.3%) | 0 (0.0%) |
Income Above Poverty by Sex and Age in Koosharem
According to the poverty statistics in Koosharem, males aged under 5 years and females aged under 5 years are the age groups that are most secure financially, with 100.0% of males and 100.0% of females in these age groups living above the poverty line.
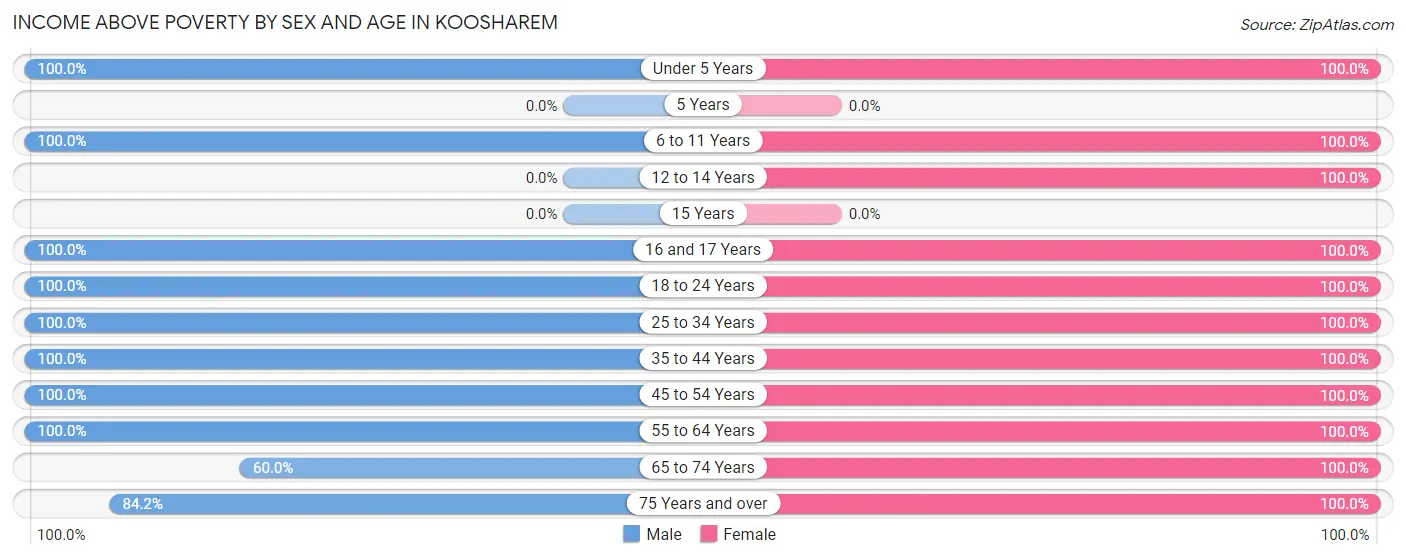
| Age Bracket | Male | Female |
| Under 5 Years | 7 (100.0%) | 7 (100.0%) |
| 5 Years | 0 (0.0%) | 0 (0.0%) |
| 6 to 11 Years | 14 (100.0%) | 17 (100.0%) |
| 12 to 14 Years | 0 (0.0%) | 3 (100.0%) |
| 15 Years | 0 (0.0%) | 0 (0.0%) |
| 16 and 17 Years | 8 (100.0%) | 2 (100.0%) |
| 18 to 24 Years | 10 (100.0%) | 1 (100.0%) |
| 25 to 34 Years | 12 (100.0%) | 13 (100.0%) |
| 35 to 44 Years | 6 (100.0%) | 6 (100.0%) |
| 45 to 54 Years | 3 (100.0%) | 16 (100.0%) |
| 55 to 64 Years | 11 (100.0%) | 7 (100.0%) |
| 65 to 74 Years | 3 (60.0%) | 8 (100.0%) |
| 75 Years and over | 16 (84.2%) | 13 (100.0%) |
| Total | 90 (94.7%) | 93 (100.0%) |
Income Below Poverty Among Married-Couple Families in Koosharem
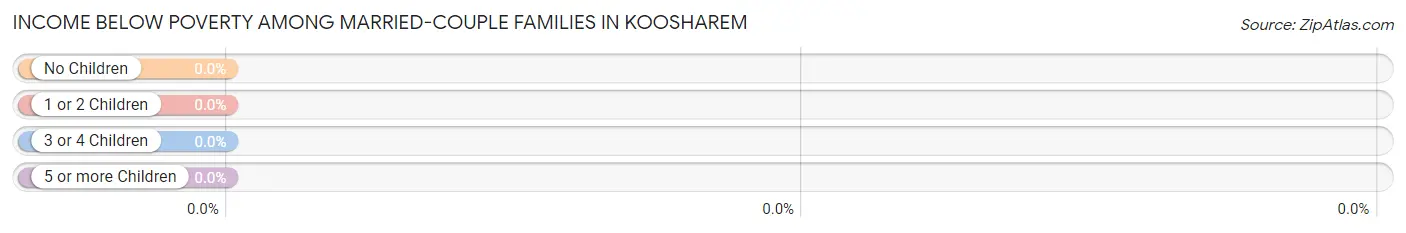
| Children | Above Poverty | Below Poverty |
| No Children | 25 (100.0%) | 0 (0.0%) |
| 1 or 2 Children | 10 (100.0%) | 0 (0.0%) |
| 3 or 4 Children | 6 (100.0%) | 0 (0.0%) |
| 5 or more Children | 3 (100.0%) | 0 (0.0%) |
| Total | 44 (100.0%) | 0 (0.0%) |
Income Below Poverty Among Single-Parent Households in Koosharem
| Children | Single Father | Single Mother |
| No Children | 0 (0.0%) | 0 (0.0%) |
| 1 or 2 Children | 0 (0.0%) | 0 (0.0%) |
| 3 or 4 Children | 0 (0.0%) | 0 (0.0%) |
| 5 or more Children | 0 (0.0%) | 0 (0.0%) |
| Total | 0 (0.0%) | 0 (0.0%) |
Income Below Poverty Among Married-Couple vs Single-Parent Households in Koosharem
| Children | Married-Couple Families | Single-Parent Households |
| No Children | 0 (0.0%) | 0 (0.0%) |
| 1 or 2 Children | 0 (0.0%) | 0 (0.0%) |
| 3 or 4 Children | 0 (0.0%) | 0 (0.0%) |
| 5 or more Children | 0 (0.0%) | 0 (0.0%) |
| Total | 0 (0.0%) | 0 (0.0%) |
Race in Koosharem
The most populous races in Koosharem are White / Caucasian (238 | 94.8%), Hispanic or Latino (16 | 6.4%), and Some other Race (8 | 3.2%).
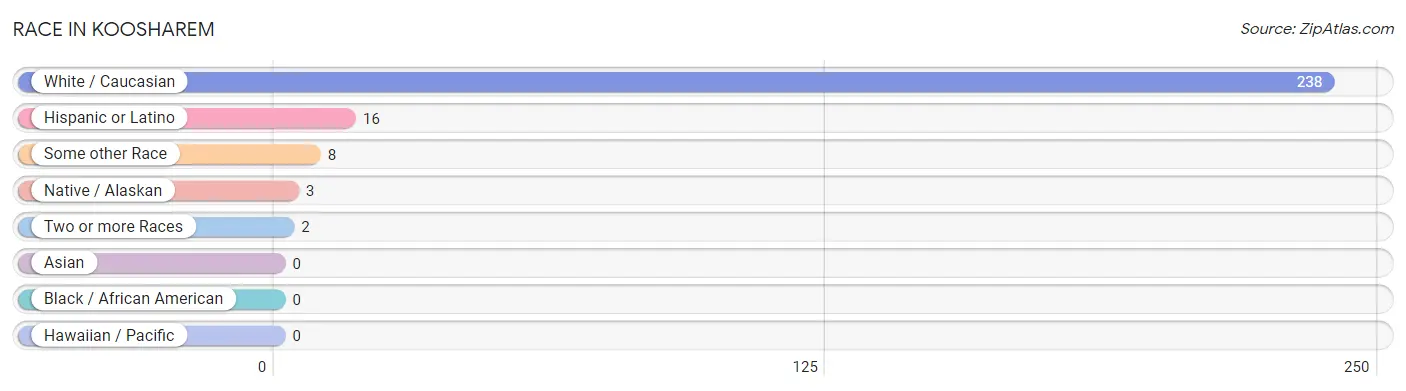
| Race | # Population | % Population |
| Asian | 0 | 0.0% |
| Black / African American | 0 | 0.0% |
| Hawaiian / Pacific | 0 | 0.0% |
| Hispanic or Latino | 16 | 6.4% |
| Native / Alaskan | 3 | 1.2% |
| White / Caucasian | 238 | 94.8% |
| Two or more Races | 2 | 0.8% |
| Some other Race | 8 | 3.2% |
| Total | 251 | 100.0% |
Ancestry in Koosharem
The most populous ancestries reported in Koosharem are English (70 | 27.9%), German (22 | 8.8%), Scottish (21 | 8.4%), Icelander (20 | 8.0%), and Danish (18 | 7.2%), together accounting for 60.2% of all Koosharem residents.
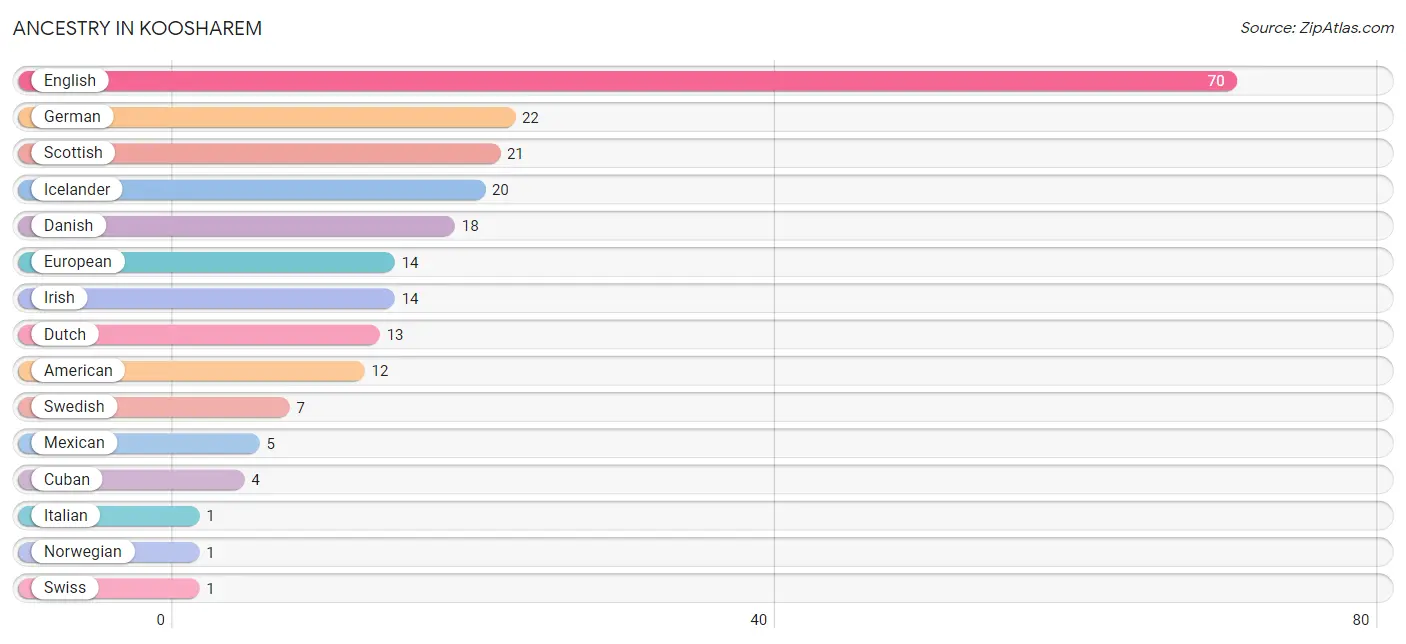
| Ancestry | # Population | % Population |
| American | 12 | 4.8% |
| Cuban | 4 | 1.6% |
| Danish | 18 | 7.2% |
| Dutch | 13 | 5.2% |
| English | 70 | 27.9% |
| European | 14 | 5.6% |
| German | 22 | 8.8% |
| Icelander | 20 | 8.0% |
| Irish | 14 | 5.6% |
| Italian | 1 | 0.4% |
| Mexican | 5 | 2.0% |
| Norwegian | 1 | 0.4% |
| Scottish | 21 | 8.4% |
| Swedish | 7 | 2.8% |
| Swiss | 1 | 0.4% | View All 15 Rows |
Immigrants in Koosharem
The most numerous immigrant groups reported in Koosharem came from Europe (6 | 2.4%), Germany (6 | 2.4%), Western Europe (6 | 2.4%), and Canada (1 | 0.4%), together accounting for 7.6% of all Koosharem residents.
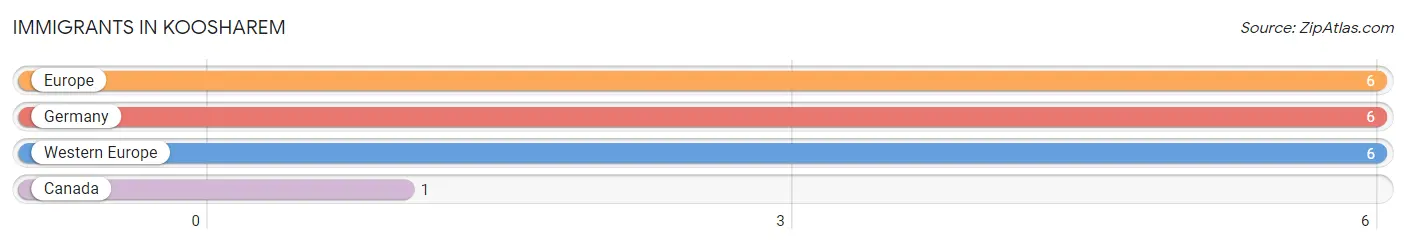
| Immigration Origin | # Population | % Population |
| Canada | 1 | 0.4% |
| Europe | 6 | 2.4% |
| Germany | 6 | 2.4% |
| Western Europe | 6 | 2.4% | View All 4 Rows |
Sex and Age in Koosharem
Sex and Age in Koosharem
The most populous age groups in Koosharem are 15 to 19 Years (38 | 29.7%) for men and 15 to 19 Years (23 | 18.7%) for women.
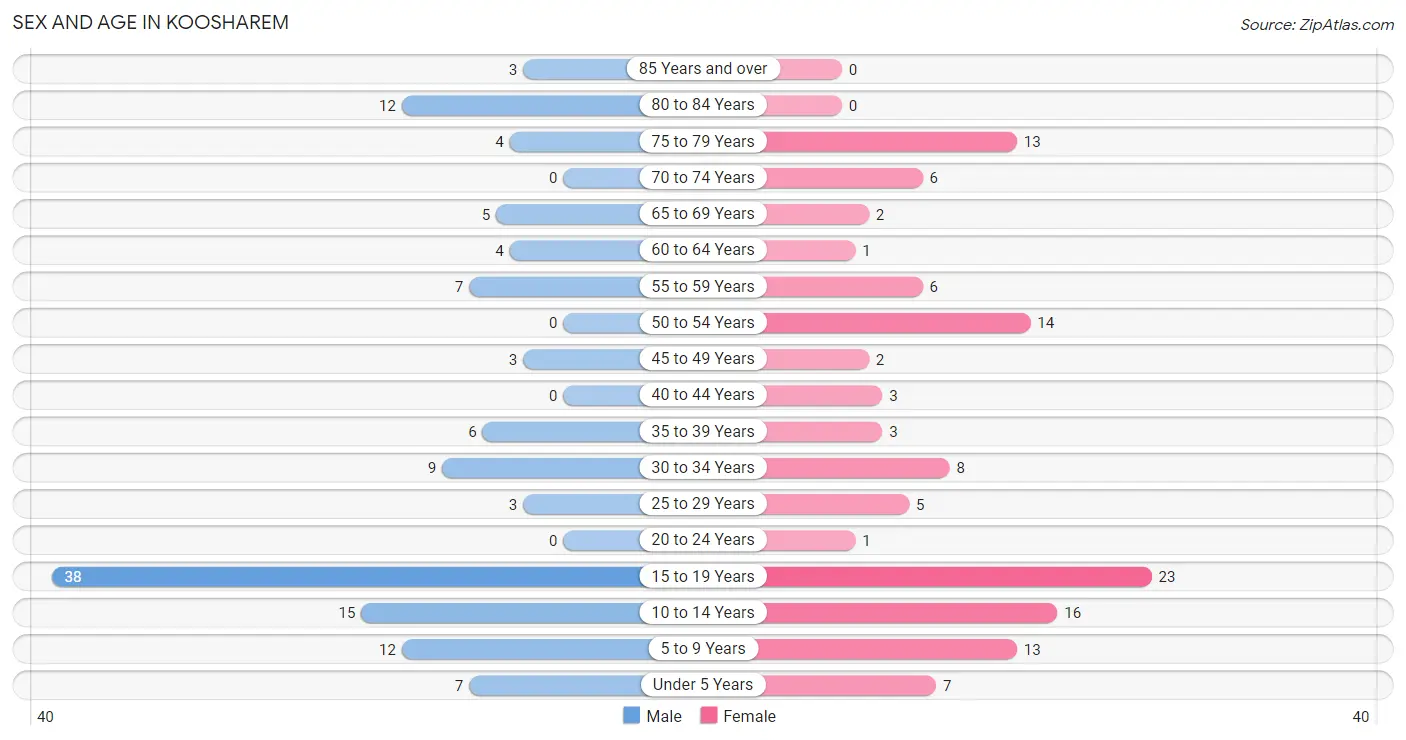
| Age Bracket | Male | Female |
| Under 5 Years | 7 (5.5%) | 7 (5.7%) |
| 5 to 9 Years | 12 (9.4%) | 13 (10.6%) |
| 10 to 14 Years | 15 (11.7%) | 16 (13.0%) |
| 15 to 19 Years | 38 (29.7%) | 23 (18.7%) |
| 20 to 24 Years | 0 (0.0%) | 1 (0.8%) |
| 25 to 29 Years | 3 (2.3%) | 5 (4.1%) |
| 30 to 34 Years | 9 (7.0%) | 8 (6.5%) |
| 35 to 39 Years | 6 (4.7%) | 3 (2.4%) |
| 40 to 44 Years | 0 (0.0%) | 3 (2.4%) |
| 45 to 49 Years | 3 (2.3%) | 2 (1.6%) |
| 50 to 54 Years | 0 (0.0%) | 14 (11.4%) |
| 55 to 59 Years | 7 (5.5%) | 6 (4.9%) |
| 60 to 64 Years | 4 (3.1%) | 1 (0.8%) |
| 65 to 69 Years | 5 (3.9%) | 2 (1.6%) |
| 70 to 74 Years | 0 (0.0%) | 6 (4.9%) |
| 75 to 79 Years | 4 (3.1%) | 13 (10.6%) |
| 80 to 84 Years | 12 (9.4%) | 0 (0.0%) |
| 85 Years and over | 3 (2.3%) | 0 (0.0%) |
| Total | 128 (100.0%) | 123 (100.0%) |
Families and Households in Koosharem
Median Family Size in Koosharem
The median family size in Koosharem is 3.27 persons per family, with married-couple families (44 | 84.6%) accounting for the largest median family size of 3.48 persons per family. On the other hand, single male/father families (2 | 3.8%) represent the smallest median family size with 1.50 persons per family.
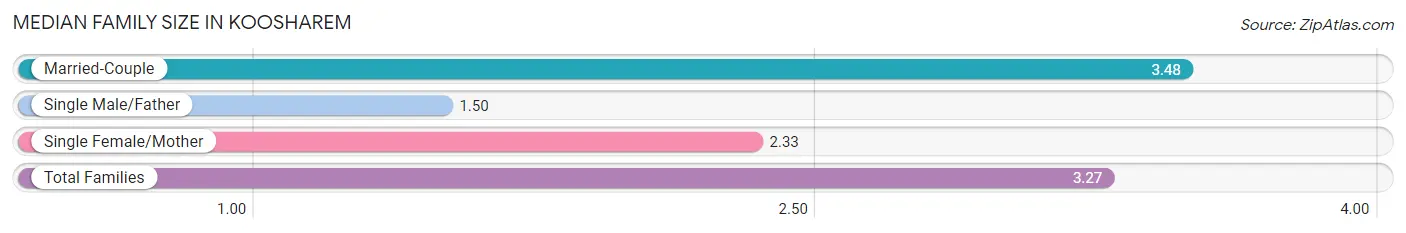
| Family Type | # Families | Family Size |
| Married-Couple | 44 (84.6%) | 3.48 |
| Single Male/Father | 2 (3.8%) | 1.50 |
| Single Female/Mother | 6 (11.5%) | 2.33 |
| Total Families | 52 (100.0%) | 3.27 |
Median Household Size in Koosharem
The median household size in Koosharem is 2.81 persons per household, with married-couple households (44 | 65.7%) accounting for the largest median household size of 3.48 persons per household. non-family households (15 | 22.4%) represent the smallest median household size with 1.20 persons per household.
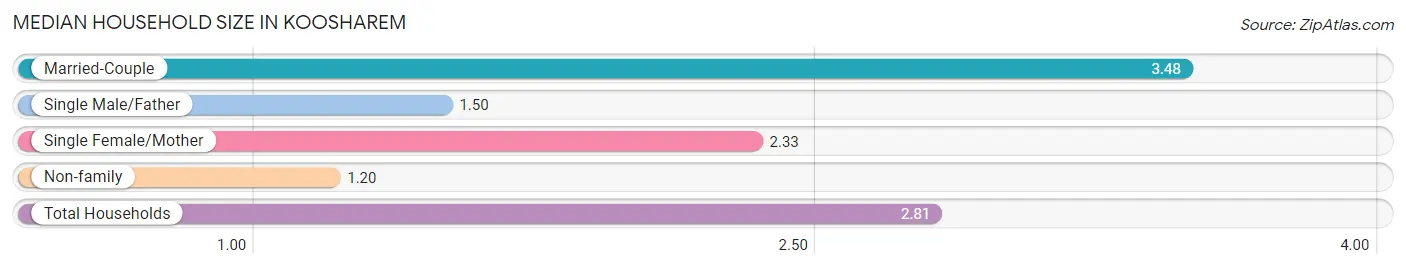
| Household Type | # Households | Household Size |
| Married-Couple | 44 (65.7%) | 3.48 |
| Single Male/Father | 2 (3.0%) | 1.50 |
| Single Female/Mother | 6 (9.0%) | 2.33 |
| Non-family | 15 (22.4%) | 1.20 |
| Total Households | 67 (100.0%) | 2.81 |
Household Size by Marriage Status in Koosharem
Out of a total of 67 households in Koosharem, 52 (77.6%) are family households, while 15 (22.4%) are nonfamily households. The most numerous type of family households are 2-person households, comprising 29, and the most common type of nonfamily households are 1-person households, comprising 14.

| Household Size | Family Households | Nonfamily Households |
| 1-Person Households | - | 14 (20.9%) |
| 2-Person Households | 29 (43.3%) | 0 (0.0%) |
| 3-Person Households | 7 (10.4%) | 1 (1.5%) |
| 4-Person Households | 7 (10.4%) | 0 (0.0%) |
| 5-Person Households | 0 (0.0%) | 0 (0.0%) |
| 6-Person Households | 6 (9.0%) | 0 (0.0%) |
| 7+ Person Households | 3 (4.5%) | 0 (0.0%) |
| Total | 52 (77.6%) | 15 (22.4%) |
Female Fertility in Koosharem
Fertility by Age in Koosharem
| Age Bracket | Women with Births | Births / 1,000 Women |
| 15 to 19 years | 0 (0.0%) | 0.0 |
| 20 to 34 years | 0 (0.0%) | 0.0 |
| 35 to 50 years | 0 (0.0%) | 0.0 |
| Total | 0 (0.0%) | 0.0 |
Fertility by Age by Marriage Status in Koosharem

| Age Bracket | Married | Unmarried |
| 15 to 19 years | 0 (0.0%) | 0 (0.0%) |
| 20 to 34 years | 0 (0.0%) | 0 (0.0%) |
| 35 to 50 years | 0 (0.0%) | 0 (0.0%) |
| Total | 0 (0.0%) | 0 (0.0%) |
Fertility by Education in Koosharem
| Educational Attainment | Women with Births | Births / 1,000 Women |
| Less than High School | 0 (0.0%) | 0.0 |
| High School Diploma | 0 (0.0%) | 0.0 |
| College or Associate's Degree | 0 (0.0%) | 0.0 |
| Bachelor's Degree | 0 (0.0%) | 0.0 |
| Graduate Degree | 0 (0.0%) | 0.0 |
| Total | 0 (0.0%) | 0.0 |
Fertility by Education by Marriage Status in Koosharem
| Educational Attainment | Married | Unmarried |
| Less than High School | 0 (0.0%) | 0 (0.0%) |
| High School Diploma | 0 (0.0%) | 0 (0.0%) |
| College or Associate's Degree | 0 (0.0%) | 0 (0.0%) |
| Bachelor's Degree | 0 (0.0%) | 0 (0.0%) |
| Graduate Degree | 0 (0.0%) | 0 (0.0%) |
| Total | 0 (0.0%) | 0 (0.0%) |
Employment Characteristics in Koosharem
Employment by Class of Employer in Koosharem
Among the 72 employed individuals in Koosharem, private company employees (50 | 69.4%), local government employees (14 | 19.4%), and self-employed (not incorporated) (5 | 6.9%) make up the most common classes of employment.
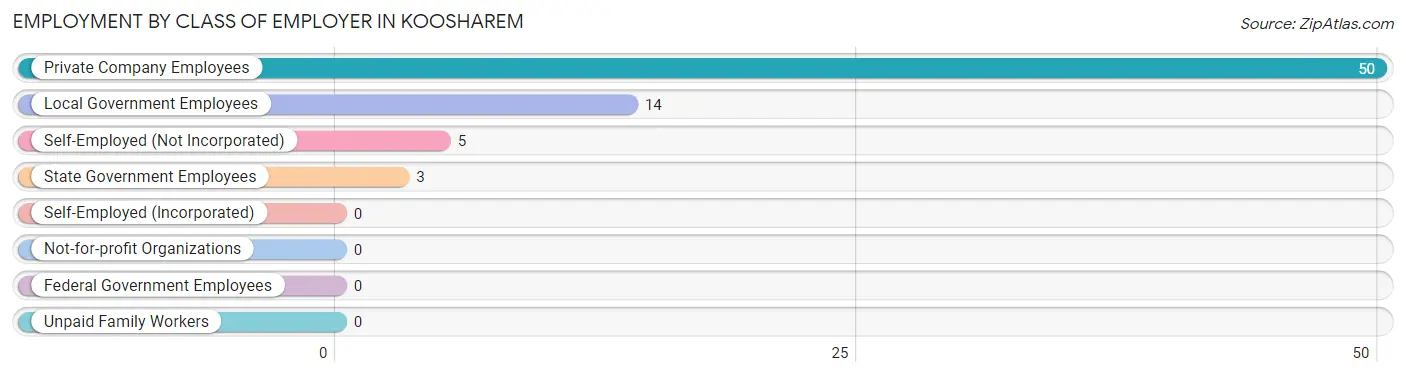
| Employer Class | # Employees | % Employees |
| Private Company Employees | 50 | 69.4% |
| Self-Employed (Incorporated) | 0 | 0.0% |
| Self-Employed (Not Incorporated) | 5 | 6.9% |
| Not-for-profit Organizations | 0 | 0.0% |
| Local Government Employees | 14 | 19.4% |
| State Government Employees | 3 | 4.2% |
| Federal Government Employees | 0 | 0.0% |
| Unpaid Family Workers | 0 | 0.0% |
| Total | 72 | 100.0% |
Employment Status by Age in Koosharem
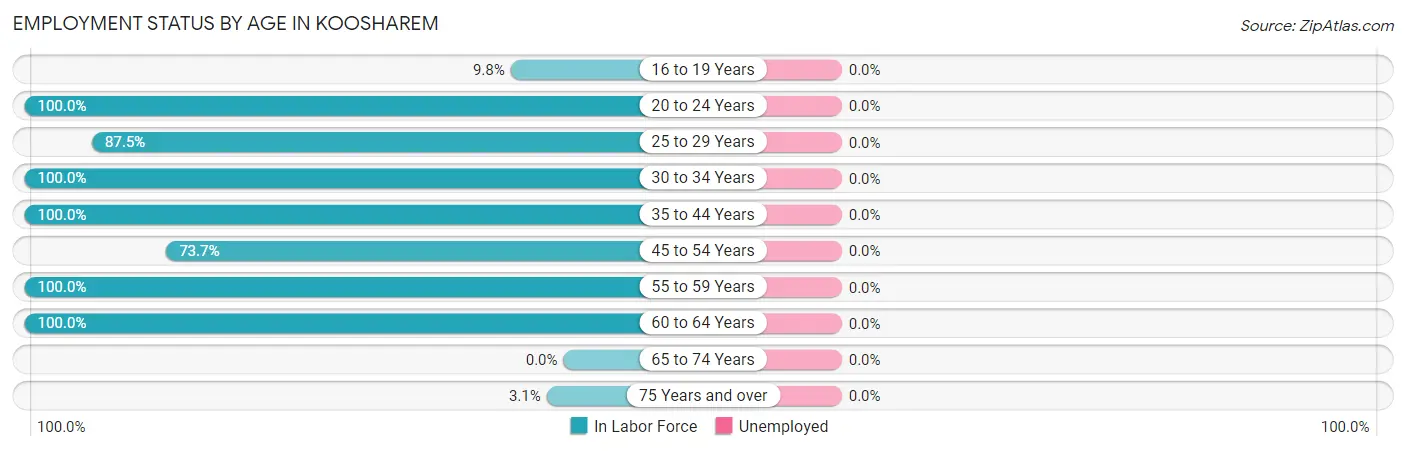
| Age Bracket | In Labor Force | Unemployed |
| 16 to 19 Years | 4 (9.8%) | 0 (0.0%) |
| 20 to 24 Years | 1 (100.0%) | 0 (0.0%) |
| 25 to 29 Years | 7 (87.5%) | 0 (0.0%) |
| 30 to 34 Years | 17 (100.0%) | 0 (0.0%) |
| 35 to 44 Years | 12 (100.0%) | 0 (0.0%) |
| 45 to 54 Years | 14 (73.7%) | 0 (0.0%) |
| 55 to 59 Years | 13 (100.0%) | 0 (0.0%) |
| 60 to 64 Years | 5 (100.0%) | 0 (0.0%) |
| 65 to 74 Years | 0 (0.0%) | 0 (0.0%) |
| 75 Years and over | 1 (3.1%) | 0 (0.0%) |
| Total | 74 (46.0%) | 0 (0.0%) |
Employment Status by Educational Attainment in Koosharem
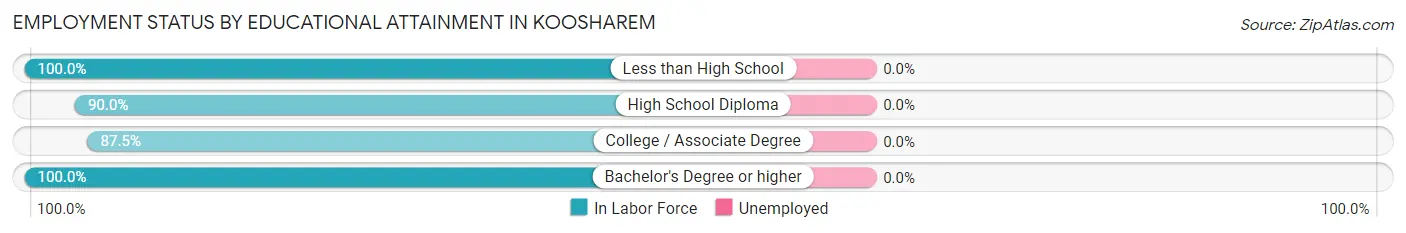
| Educational Attainment | In Labor Force | Unemployed |
| Less than High School | 6 (100.0%) | 0 (0.0%) |
| High School Diploma | 9 (90.0%) | 0 (0.0%) |
| College / Associate Degree | 35 (87.5%) | 0 (0.0%) |
| Bachelor's Degree or higher | 18 (100.0%) | 0 (0.0%) |
| Total | 68 (91.9%) | 0 (0.0%) |
Employment Occupations by Sex in Koosharem
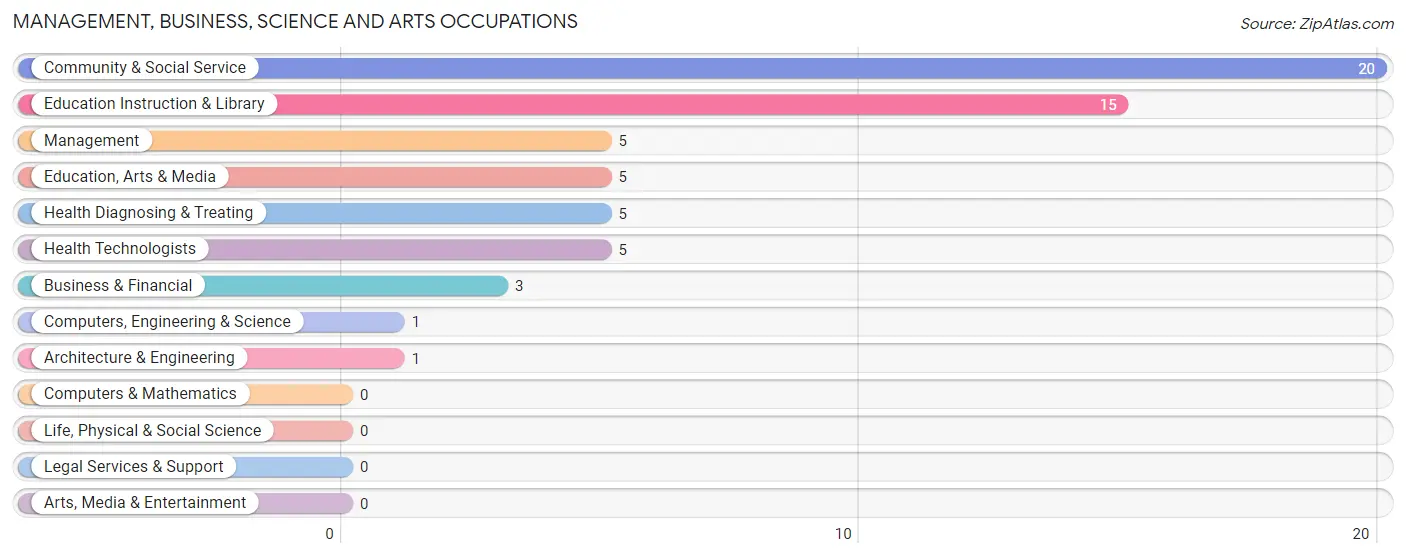
Management, Business, Science and Arts Occupations
The most common Management, Business, Science and Arts occupations in Koosharem are Community & Social Service (20 | 27.0%), Education Instruction & Library (15 | 20.3%), Management (5 | 6.8%), Education, Arts & Media (5 | 6.8%), and Health Diagnosing & Treating (5 | 6.8%).
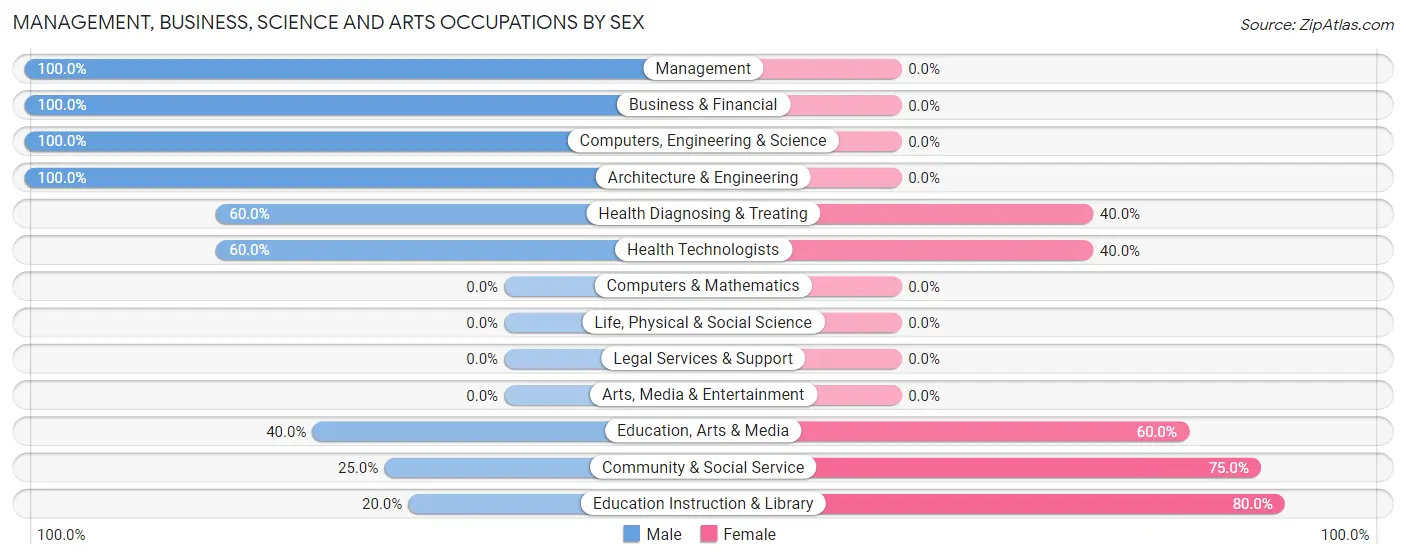
Management, Business, Science and Arts Occupations by Sex
Within the Management, Business, Science and Arts occupations in Koosharem, the most male-oriented occupations are Management (100.0%), Business & Financial (100.0%), and Computers, Engineering & Science (100.0%), while the most female-oriented occupations are Education Instruction & Library (80.0%), Community & Social Service (75.0%), and Education, Arts & Media (60.0%).
| Occupation | Male | Female |
| Management | 5 (100.0%) | 0 (0.0%) |
| Business & Financial | 3 (100.0%) | 0 (0.0%) |
| Computers, Engineering & Science | 1 (100.0%) | 0 (0.0%) |
| Computers & Mathematics | 0 (0.0%) | 0 (0.0%) |
| Architecture & Engineering | 1 (100.0%) | 0 (0.0%) |
| Life, Physical & Social Science | 0 (0.0%) | 0 (0.0%) |
| Community & Social Service | 5 (25.0%) | 15 (75.0%) |
| Education, Arts & Media | 2 (40.0%) | 3 (60.0%) |
| Legal Services & Support | 0 (0.0%) | 0 (0.0%) |
| Education Instruction & Library | 3 (20.0%) | 12 (80.0%) |
| Arts, Media & Entertainment | 0 (0.0%) | 0 (0.0%) |
| Health Diagnosing & Treating | 3 (60.0%) | 2 (40.0%) |
| Health Technologists | 3 (60.0%) | 2 (40.0%) |
| Total (Category) | 17 (50.0%) | 17 (50.0%) |
| Total (Overall) | 36 (48.6%) | 38 (51.3%) |
Services Occupations
The most common Services occupations in Koosharem are Personal Care & Service (8 | 10.8%), and Healthcare Support (1 | 1.3%).
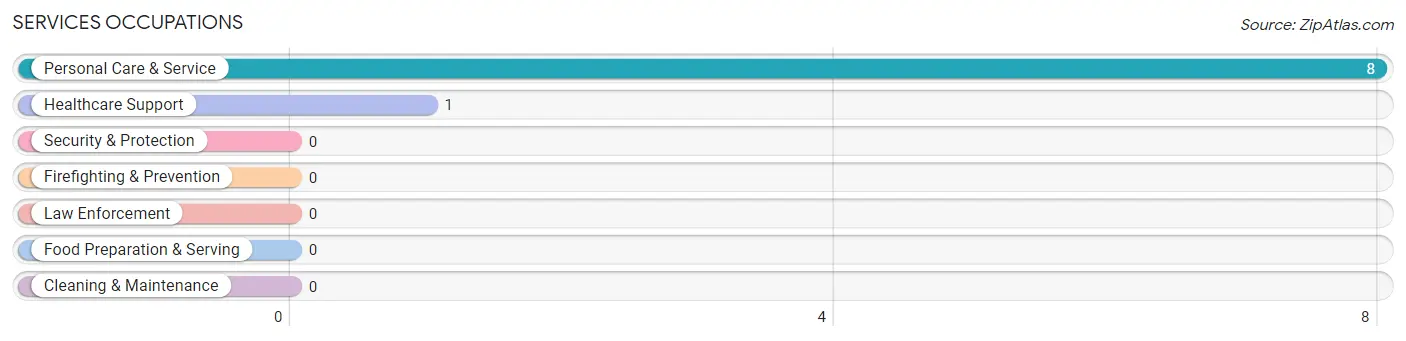
Services Occupations by Sex
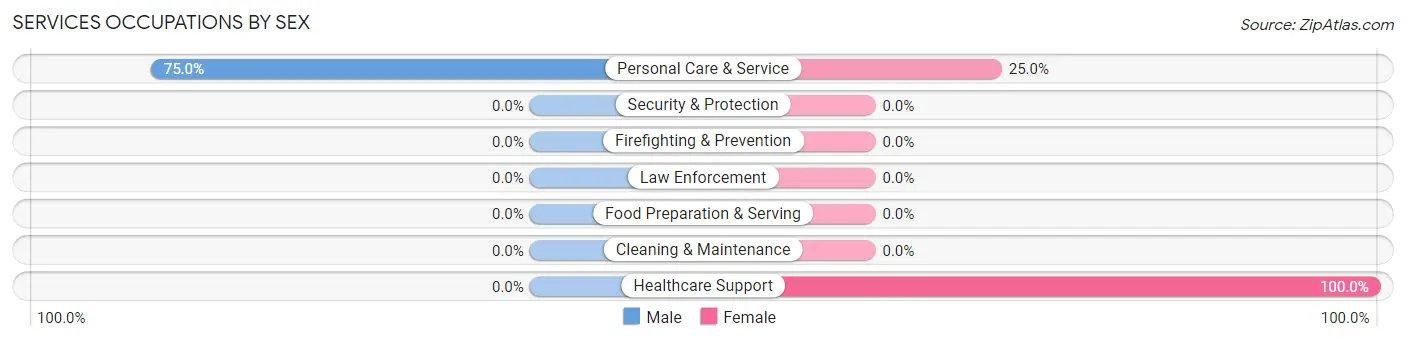
| Occupation | Male | Female |
| Healthcare Support | 0 (0.0%) | 1 (100.0%) |
| Security & Protection | 0 (0.0%) | 0 (0.0%) |
| Firefighting & Prevention | 0 (0.0%) | 0 (0.0%) |
| Law Enforcement | 0 (0.0%) | 0 (0.0%) |
| Food Preparation & Serving | 0 (0.0%) | 0 (0.0%) |
| Cleaning & Maintenance | 0 (0.0%) | 0 (0.0%) |
| Personal Care & Service | 6 (75.0%) | 2 (25.0%) |
| Total (Category) | 6 (66.7%) | 3 (33.3%) |
| Total (Overall) | 36 (48.6%) | 38 (51.3%) |
Sales and Office Occupations
The most common Sales and Office occupations in Koosharem are Office & Administration (15 | 20.3%), and Sales & Related (3 | 4.1%).
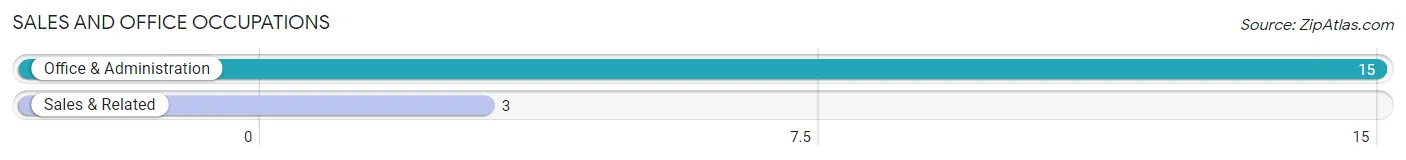
Sales and Office Occupations by Sex
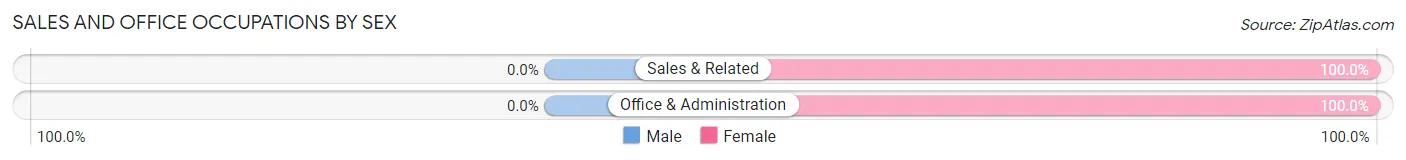
| Occupation | Male | Female |
| Sales & Related | 0 (0.0%) | 3 (100.0%) |
| Office & Administration | 0 (0.0%) | 15 (100.0%) |
| Total (Category) | 0 (0.0%) | 18 (100.0%) |
| Total (Overall) | 36 (48.6%) | 38 (51.3%) |
Natural Resources, Construction and Maintenance Occupations
The most common Natural Resources, Construction and Maintenance occupations in Koosharem are Construction & Extraction (6 | 8.1%), and Installation, Maintenance & Repair (3 | 4.1%).
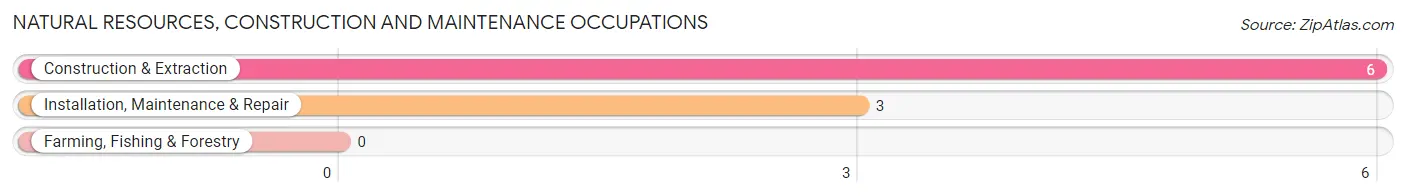
Natural Resources, Construction and Maintenance Occupations by Sex
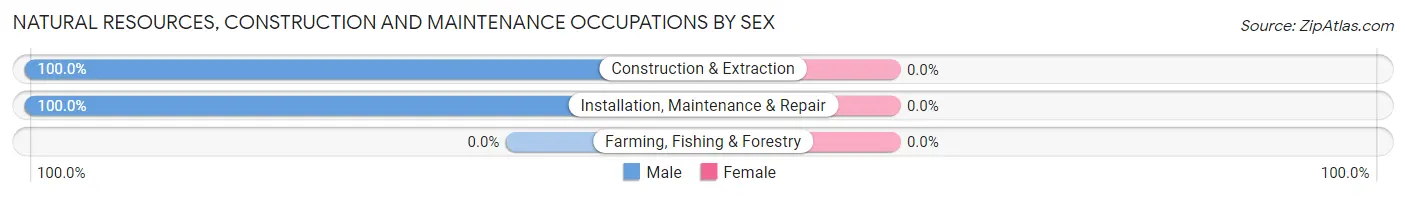
| Occupation | Male | Female |
| Farming, Fishing & Forestry | 0 (0.0%) | 0 (0.0%) |
| Construction & Extraction | 6 (100.0%) | 0 (0.0%) |
| Installation, Maintenance & Repair | 3 (100.0%) | 0 (0.0%) |
| Total (Category) | 9 (100.0%) | 0 (0.0%) |
| Total (Overall) | 36 (48.6%) | 38 (51.3%) |
Production, Transportation and Moving Occupations
The most common Production, Transportation and Moving occupations in Koosharem are Production (2 | 2.7%), and Transportation (2 | 2.7%).
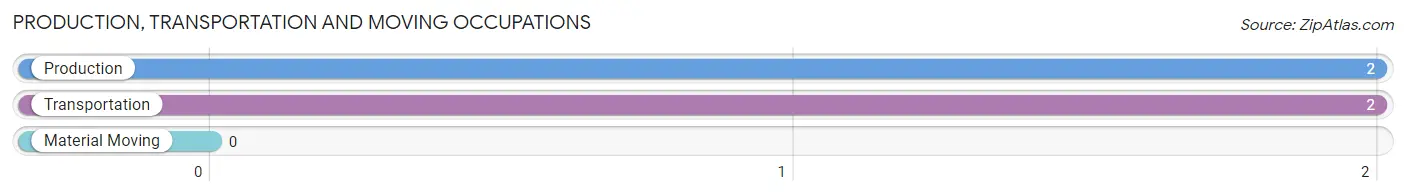
Production, Transportation and Moving Occupations by Sex
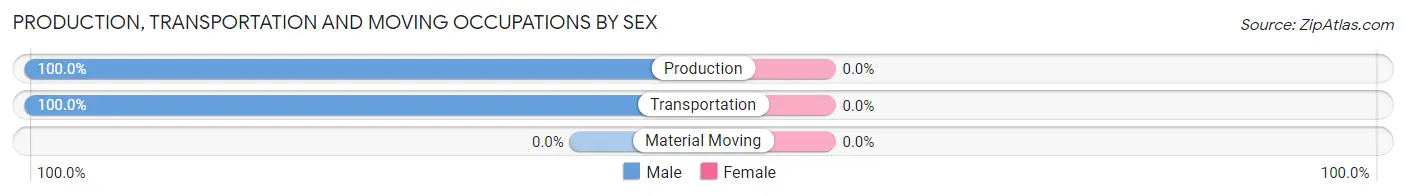
| Occupation | Male | Female |
| Production | 2 (100.0%) | 0 (0.0%) |
| Transportation | 2 (100.0%) | 0 (0.0%) |
| Material Moving | 0 (0.0%) | 0 (0.0%) |
| Total (Category) | 4 (100.0%) | 0 (0.0%) |
| Total (Overall) | 36 (48.6%) | 38 (51.3%) |
Employment Industries by Sex in Koosharem
Employment Industries in Koosharem
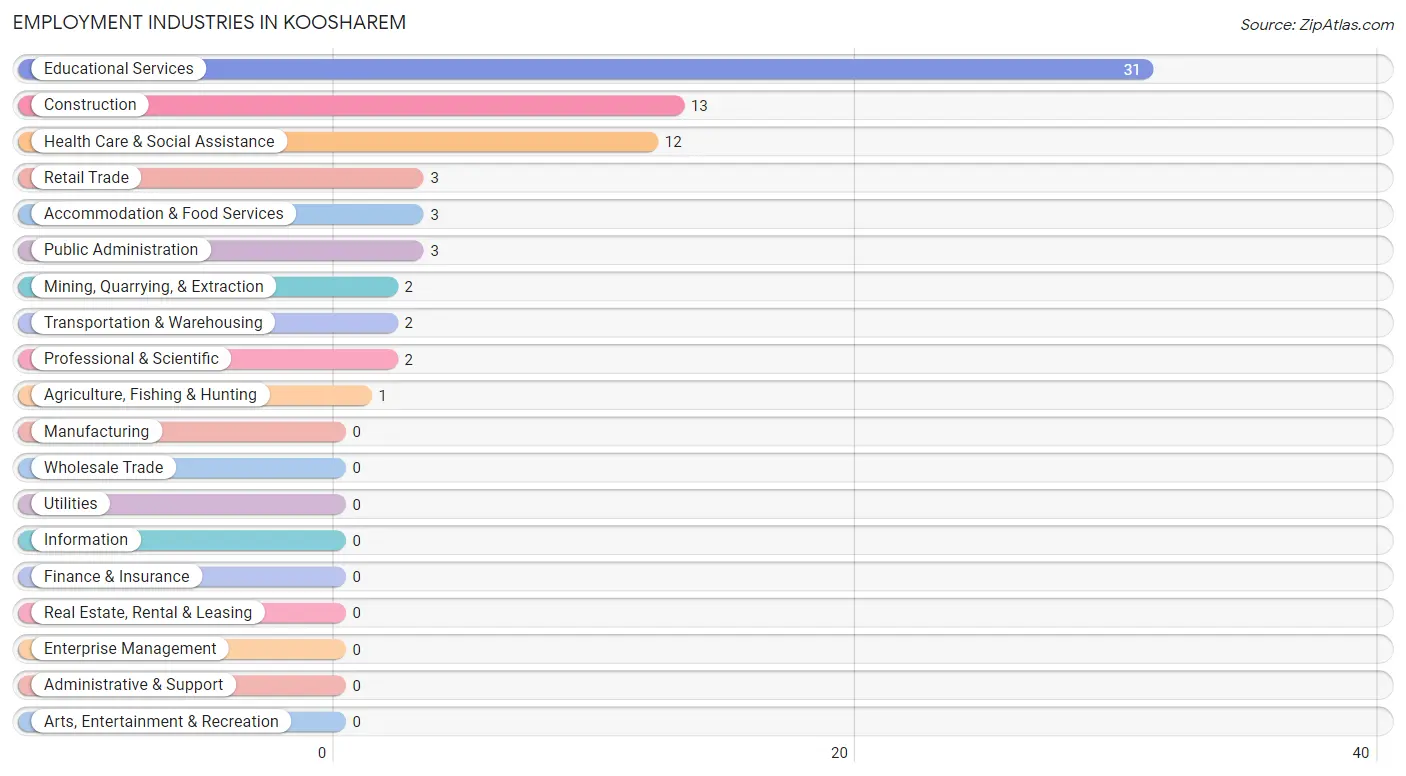
The major employment industries in Koosharem include Educational Services (31 | 41.9%), Construction (13 | 17.6%), Health Care & Social Assistance (12 | 16.2%), Retail Trade (3 | 4.1%), and Accommodation & Food Services (3 | 4.1%).
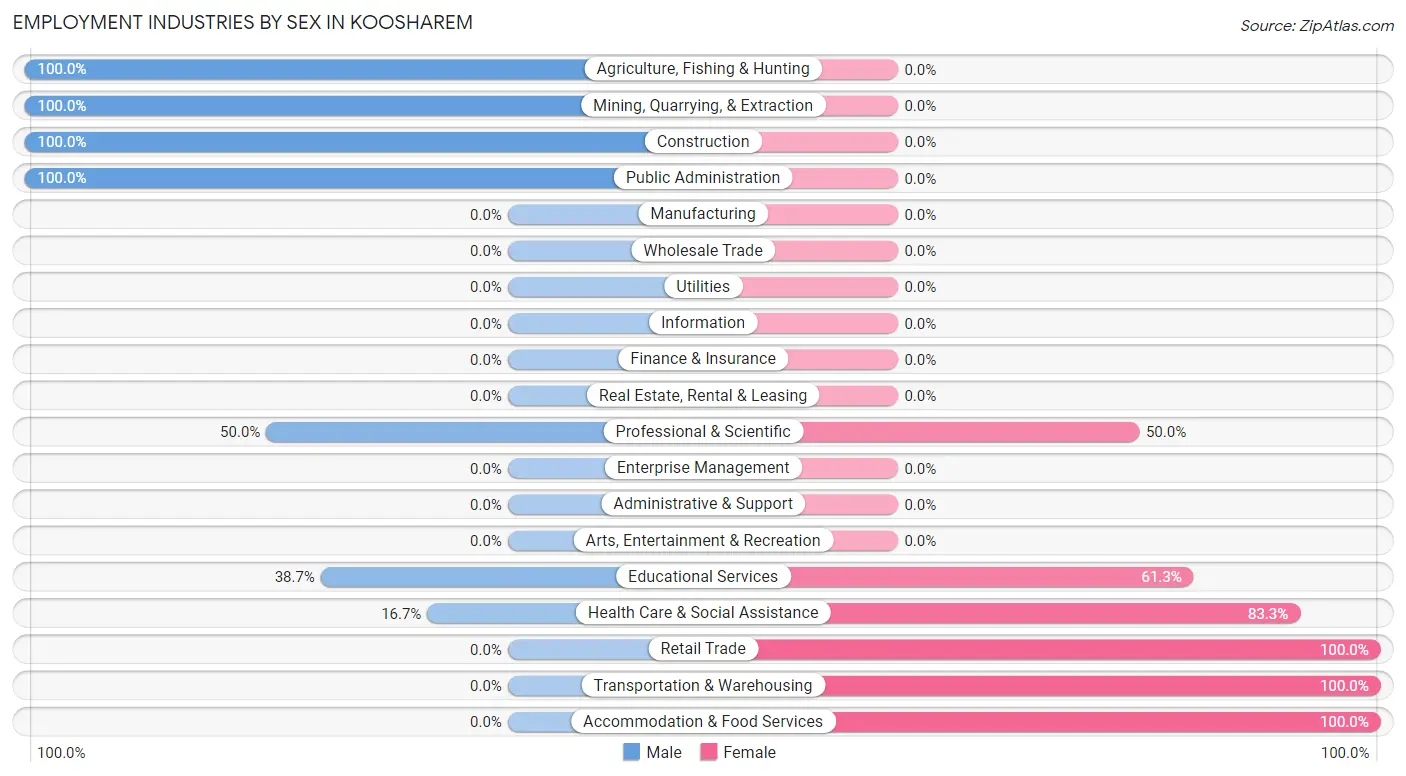
Employment Industries by Sex in Koosharem
The Koosharem industries that see more men than women are Agriculture, Fishing & Hunting (100.0%), Mining, Quarrying, & Extraction (100.0%), and Construction (100.0%), whereas the industries that tend to have a higher number of women are Retail Trade (100.0%), Transportation & Warehousing (100.0%), and Accommodation & Food Services (100.0%).
| Industry | Male | Female |
| Agriculture, Fishing & Hunting | 1 (100.0%) | 0 (0.0%) |
| Mining, Quarrying, & Extraction | 2 (100.0%) | 0 (0.0%) |
| Construction | 13 (100.0%) | 0 (0.0%) |
| Manufacturing | 0 (0.0%) | 0 (0.0%) |
| Wholesale Trade | 0 (0.0%) | 0 (0.0%) |
| Retail Trade | 0 (0.0%) | 3 (100.0%) |
| Transportation & Warehousing | 0 (0.0%) | 2 (100.0%) |
| Utilities | 0 (0.0%) | 0 (0.0%) |
| Information | 0 (0.0%) | 0 (0.0%) |
| Finance & Insurance | 0 (0.0%) | 0 (0.0%) |
| Real Estate, Rental & Leasing | 0 (0.0%) | 0 (0.0%) |
| Professional & Scientific | 1 (50.0%) | 1 (50.0%) |
| Enterprise Management | 0 (0.0%) | 0 (0.0%) |
| Administrative & Support | 0 (0.0%) | 0 (0.0%) |
| Educational Services | 12 (38.7%) | 19 (61.3%) |
| Health Care & Social Assistance | 2 (16.7%) | 10 (83.3%) |
| Arts, Entertainment & Recreation | 0 (0.0%) | 0 (0.0%) |
| Accommodation & Food Services | 0 (0.0%) | 3 (100.0%) |
| Public Administration | 3 (100.0%) | 0 (0.0%) |
| Total | 36 (48.6%) | 38 (51.3%) |
Education in Koosharem
School Enrollment in Koosharem
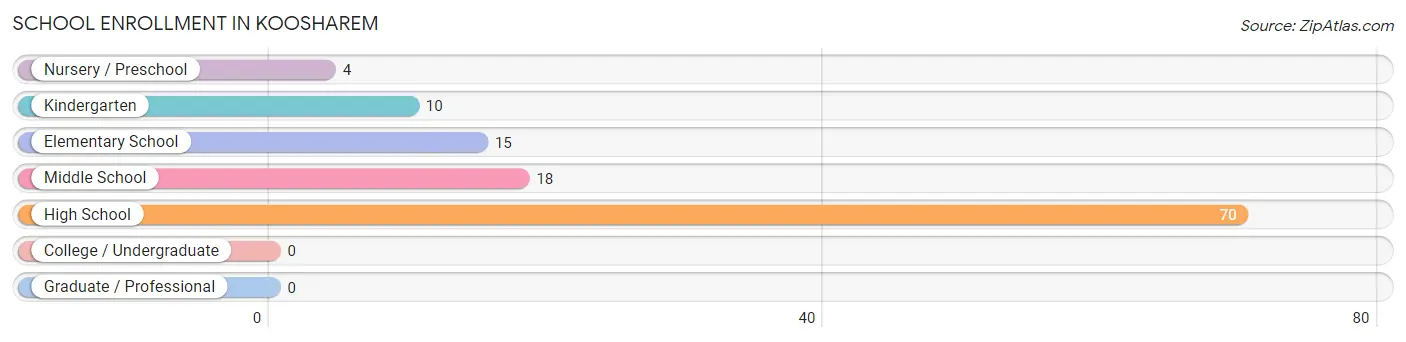
The most common levels of schooling among the 117 students in Koosharem are high school (70 | 59.8%), middle school (18 | 15.4%), and elementary school (15 | 12.8%).
| School Level | # Students | % Students |
| Nursery / Preschool | 4 | 3.4% |
| Kindergarten | 10 | 8.6% |
| Elementary School | 15 | 12.8% |
| Middle School | 18 | 15.4% |
| High School | 70 | 59.8% |
| College / Undergraduate | 0 | 0.0% |
| Graduate / Professional | 0 | 0.0% |
| Total | 117 | 100.0% |
School Enrollment by Age by Funding Source in Koosharem
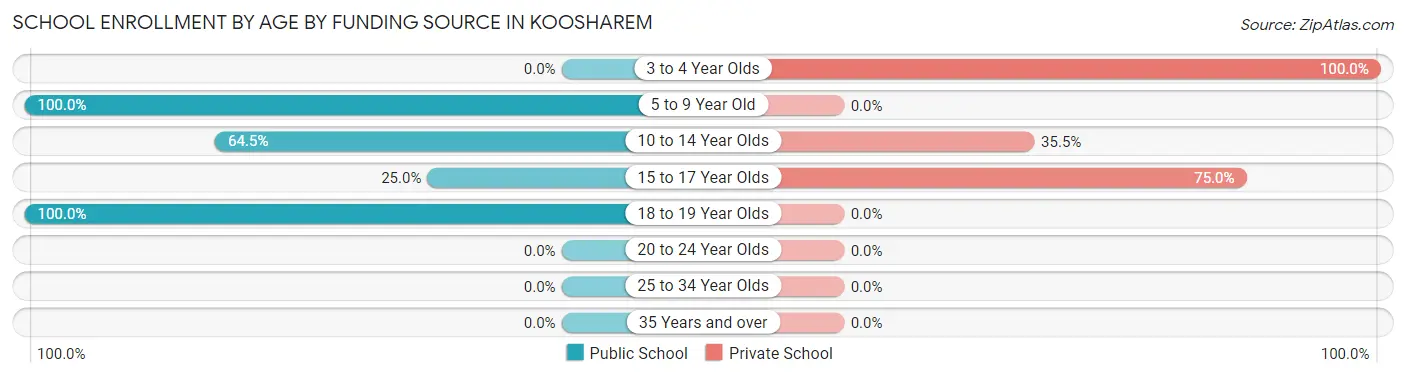
Out of a total of 117 students who are enrolled in schools in Koosharem, 51 (43.6%) attend a private institution, while the remaining 66 (56.4%) are enrolled in public schools. The age group of 3 to 4 year olds has the highest likelihood of being enrolled in private schools, with 4 (100.0% in the age bracket) enrolled. Conversely, the age group of 5 to 9 year old has the lowest likelihood of being enrolled in a private school, with 25 (100.0% in the age bracket) attending a public institution.
| Age Bracket | Public School | Private School |
| 3 to 4 Year Olds | 0 (0.0%) | 4 (100.0%) |
| 5 to 9 Year Old | 25 (100.0%) | 0 (0.0%) |
| 10 to 14 Year Olds | 20 (64.5%) | 11 (35.5%) |
| 15 to 17 Year Olds | 12 (25.0%) | 36 (75.0%) |
| 18 to 19 Year Olds | 9 (100.0%) | 0 (0.0%) |
| 20 to 24 Year Olds | 0 (0.0%) | 0 (0.0%) |
| 25 to 34 Year Olds | 0 (0.0%) | 0 (0.0%) |
| 35 Years and over | 0 (0.0%) | 0 (0.0%) |
| Total | 66 (56.4%) | 51 (43.6%) |
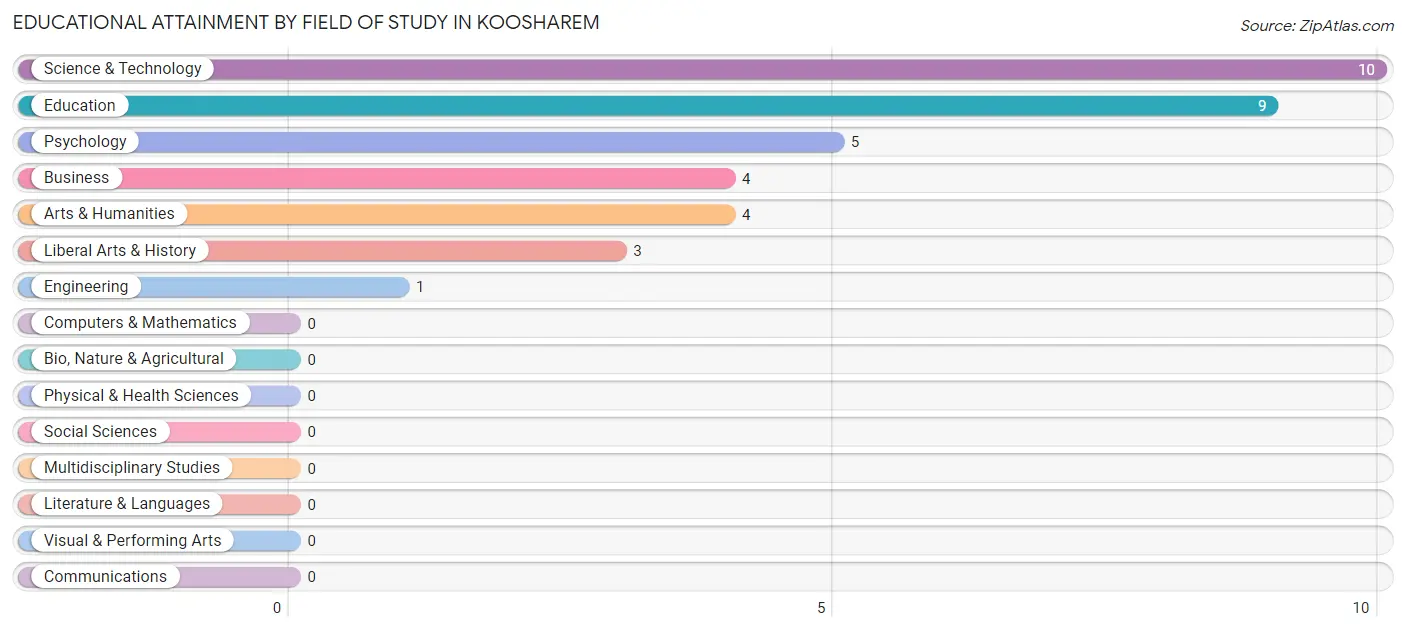
Educational Attainment by Field of Study in Koosharem
Science & technology (10 | 27.8%), education (9 | 25.0%), psychology (5 | 13.9%), business (4 | 11.1%), and arts & humanities (4 | 11.1%) are the most common fields of study among 36 individuals in Koosharem who have obtained a bachelor's degree or higher.
| Field of Study | # Graduates | % Graduates |
| Computers & Mathematics | 0 | 0.0% |
| Bio, Nature & Agricultural | 0 | 0.0% |
| Physical & Health Sciences | 0 | 0.0% |
| Psychology | 5 | 13.9% |
| Social Sciences | 0 | 0.0% |
| Engineering | 1 | 2.8% |
| Multidisciplinary Studies | 0 | 0.0% |
| Science & Technology | 10 | 27.8% |
| Business | 4 | 11.1% |
| Education | 9 | 25.0% |
| Literature & Languages | 0 | 0.0% |
| Liberal Arts & History | 3 | 8.3% |
| Visual & Performing Arts | 0 | 0.0% |
| Communications | 0 | 0.0% |
| Arts & Humanities | 4 | 11.1% |
| Total | 36 | 100.0% |
Transportation & Commute in Koosharem
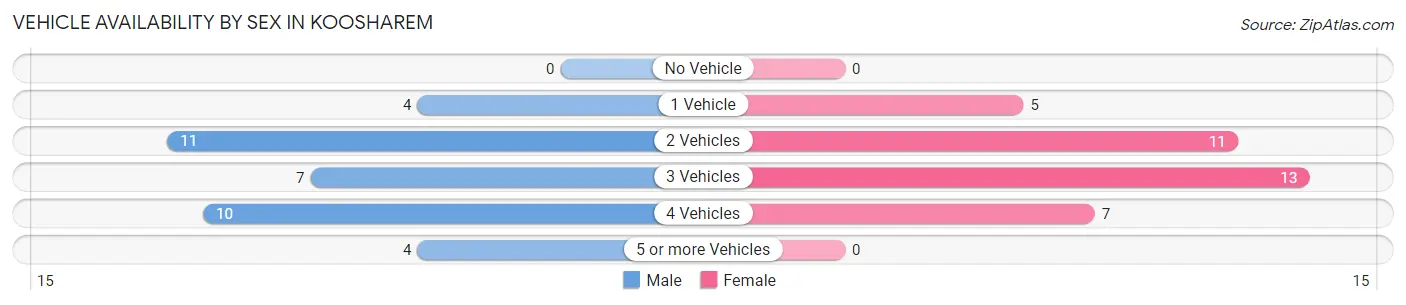
Vehicle Availability by Sex in Koosharem
The most prevalent vehicle ownership categories in Koosharem are males with 2 vehicles (11, accounting for 30.6%) and females with 2 vehicles (11, making up 30.6%).
| Vehicles Available | Male | Female |
| No Vehicle | 0 (0.0%) | 0 (0.0%) |
| 1 Vehicle | 4 (11.1%) | 5 (13.9%) |
| 2 Vehicles | 11 (30.6%) | 11 (30.6%) |
| 3 Vehicles | 7 (19.4%) | 13 (36.1%) |
| 4 Vehicles | 10 (27.8%) | 7 (19.4%) |
| 5 or more Vehicles | 4 (11.1%) | 0 (0.0%) |
| Total | 36 (100.0%) | 36 (100.0%) |
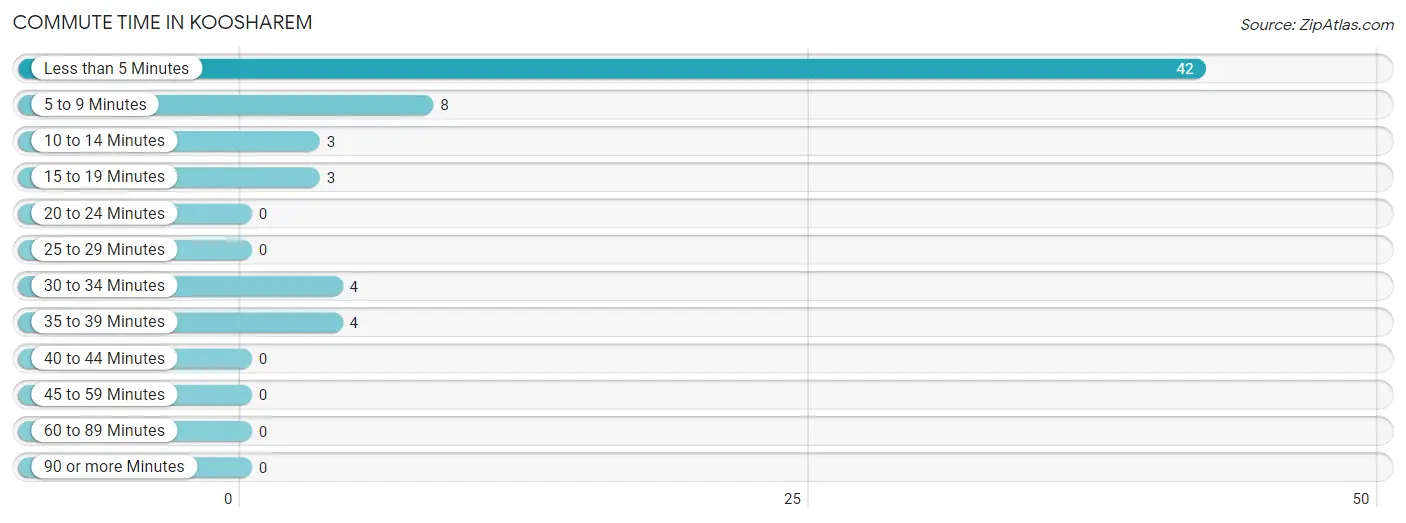
Commute Time in Koosharem
The most frequently occuring commute durations in Koosharem are less than 5 minutes (42 commuters, 65.6%), 5 to 9 minutes (8 commuters, 12.5%), and 30 to 34 minutes (4 commuters, 6.2%).
| Commute Time | # Commuters | % Commuters |
| Less than 5 Minutes | 42 | 65.6% |
| 5 to 9 Minutes | 8 | 12.5% |
| 10 to 14 Minutes | 3 | 4.7% |
| 15 to 19 Minutes | 3 | 4.7% |
| 20 to 24 Minutes | 0 | 0.0% |
| 25 to 29 Minutes | 0 | 0.0% |
| 30 to 34 Minutes | 4 | 6.2% |
| 35 to 39 Minutes | 4 | 6.2% |
| 40 to 44 Minutes | 0 | 0.0% |
| 45 to 59 Minutes | 0 | 0.0% |
| 60 to 89 Minutes | 0 | 0.0% |
| 90 or more Minutes | 0 | 0.0% |
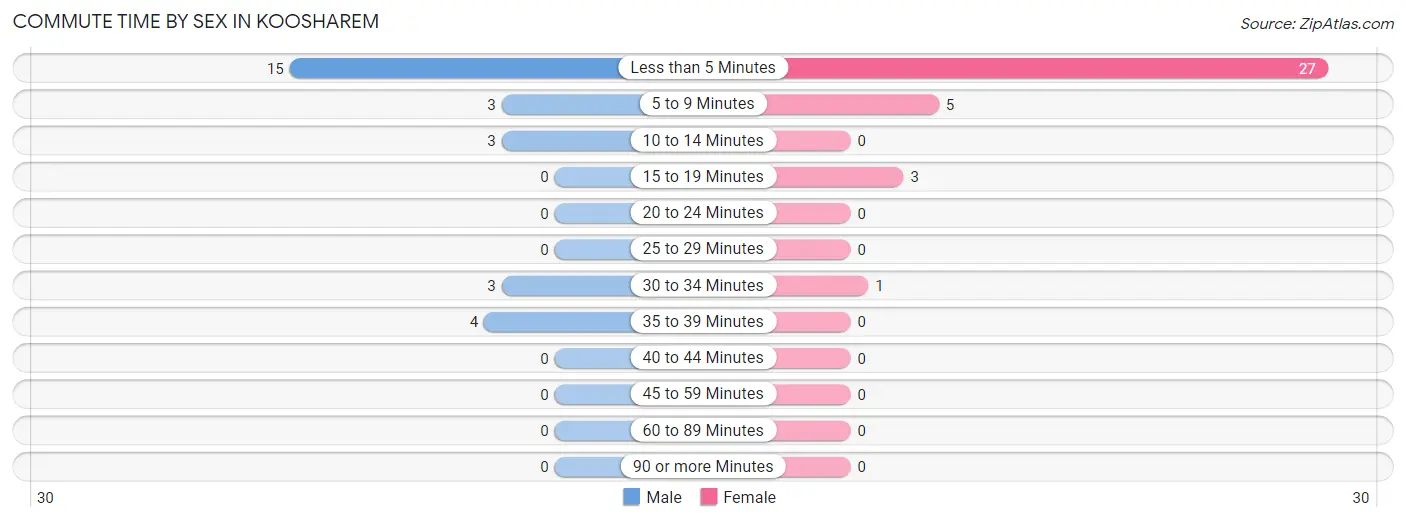
Commute Time by Sex in Koosharem
The most common commute times in Koosharem are less than 5 minutes (15 commuters, 53.6%) for males and less than 5 minutes (27 commuters, 75.0%) for females.
| Commute Time | Male | Female |
| Less than 5 Minutes | 15 (53.6%) | 27 (75.0%) |
| 5 to 9 Minutes | 3 (10.7%) | 5 (13.9%) |
| 10 to 14 Minutes | 3 (10.7%) | 0 (0.0%) |
| 15 to 19 Minutes | 0 (0.0%) | 3 (8.3%) |
| 20 to 24 Minutes | 0 (0.0%) | 0 (0.0%) |
| 25 to 29 Minutes | 0 (0.0%) | 0 (0.0%) |
| 30 to 34 Minutes | 3 (10.7%) | 1 (2.8%) |
| 35 to 39 Minutes | 4 (14.3%) | 0 (0.0%) |
| 40 to 44 Minutes | 0 (0.0%) | 0 (0.0%) |
| 45 to 59 Minutes | 0 (0.0%) | 0 (0.0%) |
| 60 to 89 Minutes | 0 (0.0%) | 0 (0.0%) |
| 90 or more Minutes | 0 (0.0%) | 0 (0.0%) |
Time of Departure to Work by Sex in Koosharem
The most frequent times of departure to work in Koosharem are 12:00 PM to 3:59 PM (8, 28.6%) for males and 8:00 AM to 8:29 AM (9, 25.0%) for females.
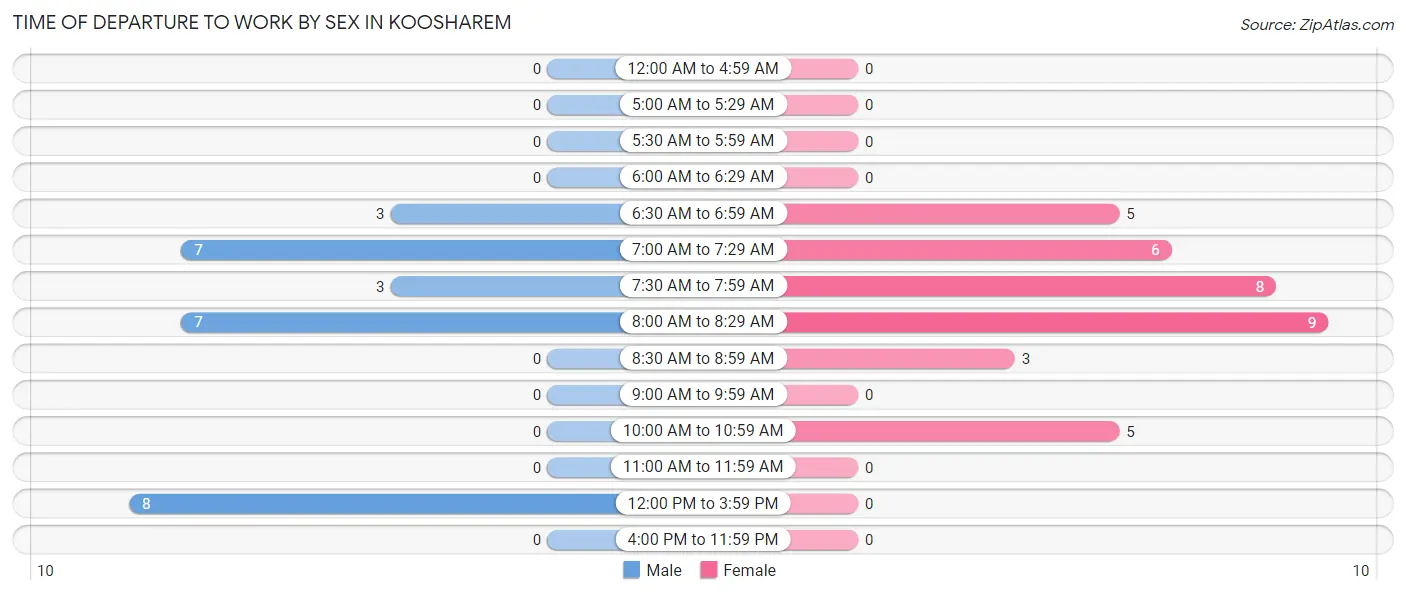
| Time of Departure | Male | Female |
| 12:00 AM to 4:59 AM | 0 (0.0%) | 0 (0.0%) |
| 5:00 AM to 5:29 AM | 0 (0.0%) | 0 (0.0%) |
| 5:30 AM to 5:59 AM | 0 (0.0%) | 0 (0.0%) |
| 6:00 AM to 6:29 AM | 0 (0.0%) | 0 (0.0%) |
| 6:30 AM to 6:59 AM | 3 (10.7%) | 5 (13.9%) |
| 7:00 AM to 7:29 AM | 7 (25.0%) | 6 (16.7%) |
| 7:30 AM to 7:59 AM | 3 (10.7%) | 8 (22.2%) |
| 8:00 AM to 8:29 AM | 7 (25.0%) | 9 (25.0%) |
| 8:30 AM to 8:59 AM | 0 (0.0%) | 3 (8.3%) |
| 9:00 AM to 9:59 AM | 0 (0.0%) | 0 (0.0%) |
| 10:00 AM to 10:59 AM | 0 (0.0%) | 5 (13.9%) |
| 11:00 AM to 11:59 AM | 0 (0.0%) | 0 (0.0%) |
| 12:00 PM to 3:59 PM | 8 (28.6%) | 0 (0.0%) |
| 4:00 PM to 11:59 PM | 0 (0.0%) | 0 (0.0%) |
| Total | 28 (100.0%) | 36 (100.0%) |
Housing Occupancy in Koosharem
Occupancy by Ownership in Koosharem
Of the total 67 dwellings in Koosharem, owner-occupied units account for 47 (70.2%), while renter-occupied units make up 20 (29.8%).
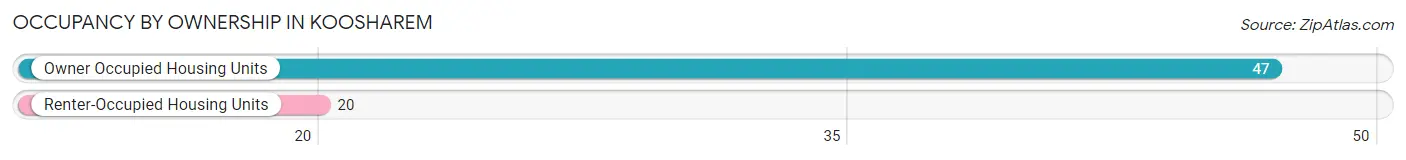
| Occupancy | # Housing Units | % Housing Units |
| Owner Occupied Housing Units | 47 | 70.2% |
| Renter-Occupied Housing Units | 20 | 29.8% |
| Total Occupied Housing Units | 67 | 100.0% |
Occupancy by Household Size in Koosharem
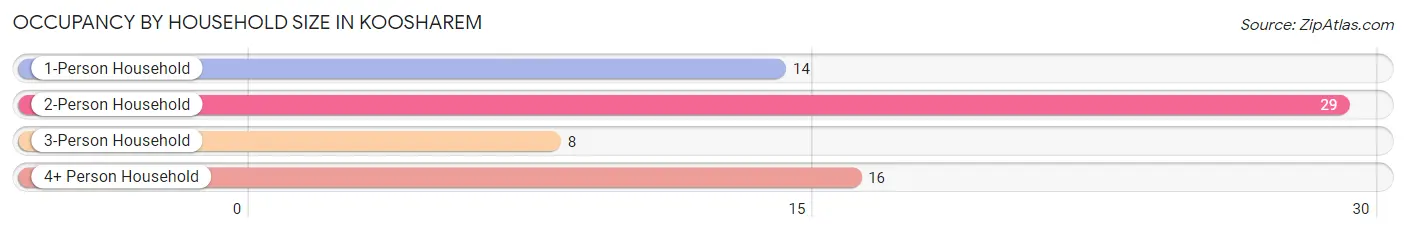
| Household Size | # Housing Units | % Housing Units |
| 1-Person Household | 14 | 20.9% |
| 2-Person Household | 29 | 43.3% |
| 3-Person Household | 8 | 11.9% |
| 4+ Person Household | 16 | 23.9% |
| Total Housing Units | 67 | 100.0% |
Occupancy by Ownership by Household Size in Koosharem
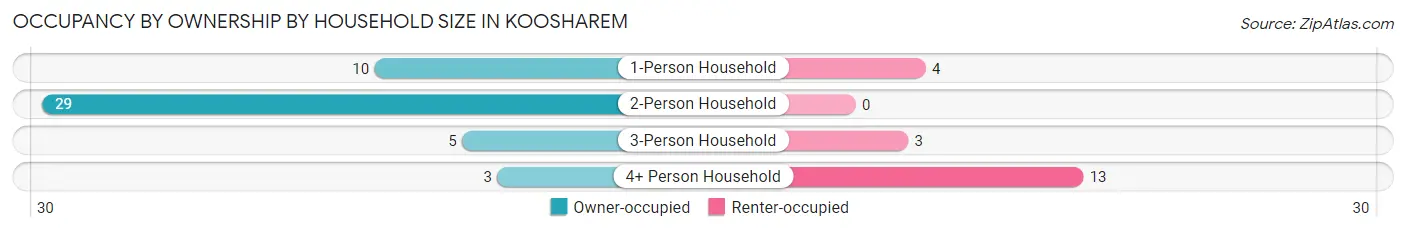
| Household Size | Owner-occupied | Renter-occupied |
| 1-Person Household | 10 (71.4%) | 4 (28.6%) |
| 2-Person Household | 29 (100.0%) | 0 (0.0%) |
| 3-Person Household | 5 (62.5%) | 3 (37.5%) |
| 4+ Person Household | 3 (18.8%) | 13 (81.2%) |
| Total Housing Units | 47 (70.2%) | 20 (29.8%) |
Occupancy by Educational Attainment in Koosharem
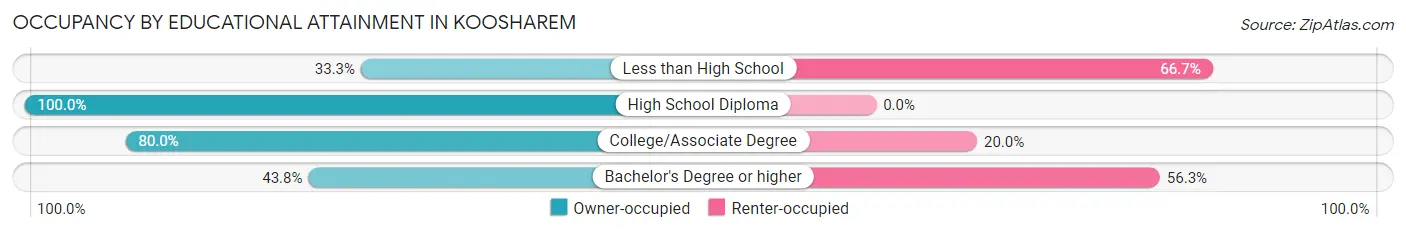
| Household Size | Owner-occupied | Renter-occupied |
| Less than High School | 3 (33.3%) | 6 (66.7%) |
| High School Diploma | 17 (100.0%) | 0 (0.0%) |
| College/Associate Degree | 20 (80.0%) | 5 (20.0%) |
| Bachelor's Degree or higher | 7 (43.8%) | 9 (56.2%) |
Occupancy by Age of Householder in Koosharem
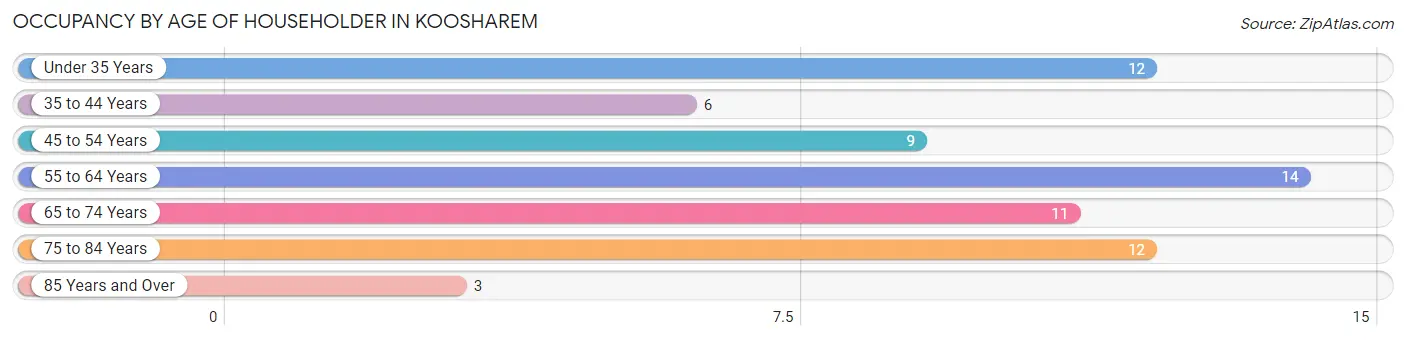
| Age Bracket | # Households | % Households |
| Under 35 Years | 12 | 17.9% |
| 35 to 44 Years | 6 | 9.0% |
| 45 to 54 Years | 9 | 13.4% |
| 55 to 64 Years | 14 | 20.9% |
| 65 to 74 Years | 11 | 16.4% |
| 75 to 84 Years | 12 | 17.9% |
| 85 Years and Over | 3 | 4.5% |
| Total | 67 | 100.0% |
Housing Finances in Koosharem
Median Income by Occupancy in Koosharem
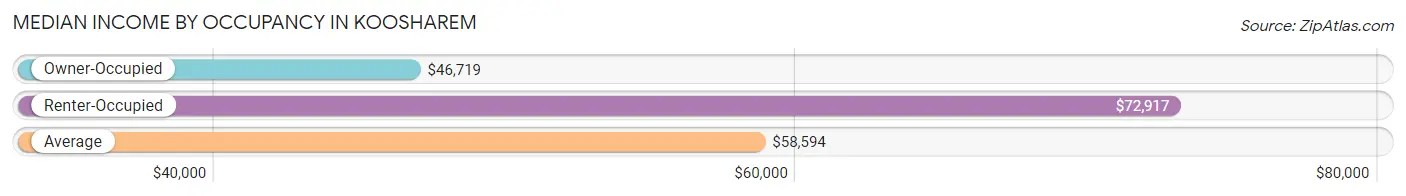
| Occupancy Type | # Households | Median Income |
| Owner-Occupied | 47 (70.2%) | $46,719 |
| Renter-Occupied | 20 (29.8%) | $72,917 |
| Average | 67 (100.0%) | $58,594 |
Occupancy by Householder Income Bracket in Koosharem
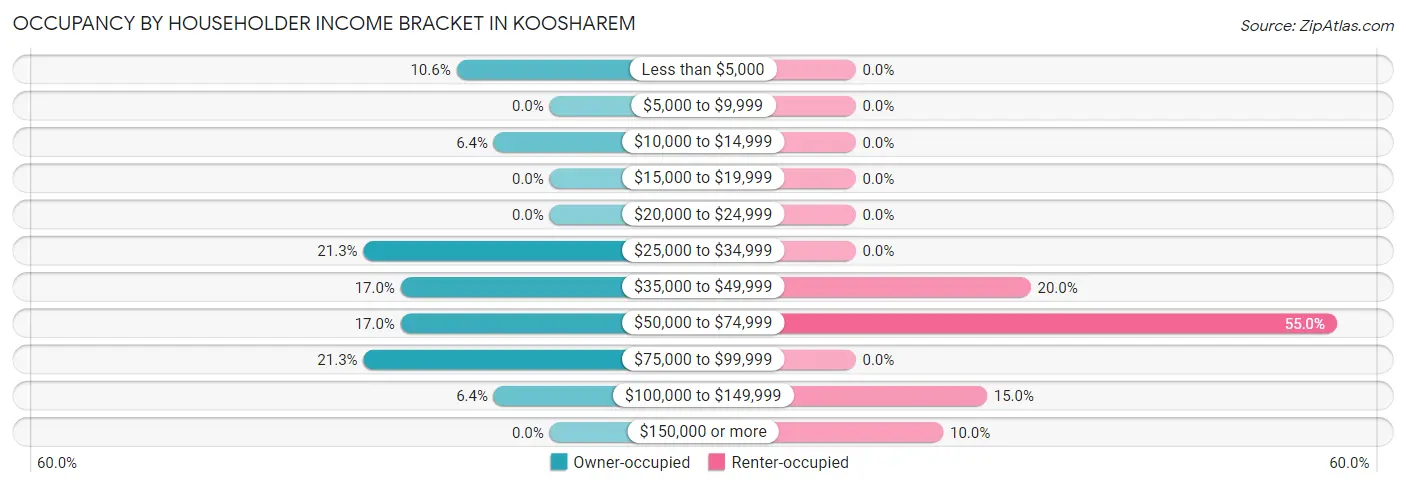
| Income Bracket | Owner-occupied | Renter-occupied |
| Less than $5,000 | 5 (10.6%) | 0 (0.0%) |
| $5,000 to $9,999 | 0 (0.0%) | 0 (0.0%) |
| $10,000 to $14,999 | 3 (6.4%) | 0 (0.0%) |
| $15,000 to $19,999 | 0 (0.0%) | 0 (0.0%) |
| $20,000 to $24,999 | 0 (0.0%) | 0 (0.0%) |
| $25,000 to $34,999 | 10 (21.3%) | 0 (0.0%) |
| $35,000 to $49,999 | 8 (17.0%) | 4 (20.0%) |
| $50,000 to $74,999 | 8 (17.0%) | 11 (55.0%) |
| $75,000 to $99,999 | 10 (21.3%) | 0 (0.0%) |
| $100,000 to $149,999 | 3 (6.4%) | 3 (15.0%) |
| $150,000 or more | 0 (0.0%) | 2 (10.0%) |
| Total | 47 (100.0%) | 20 (100.0%) |
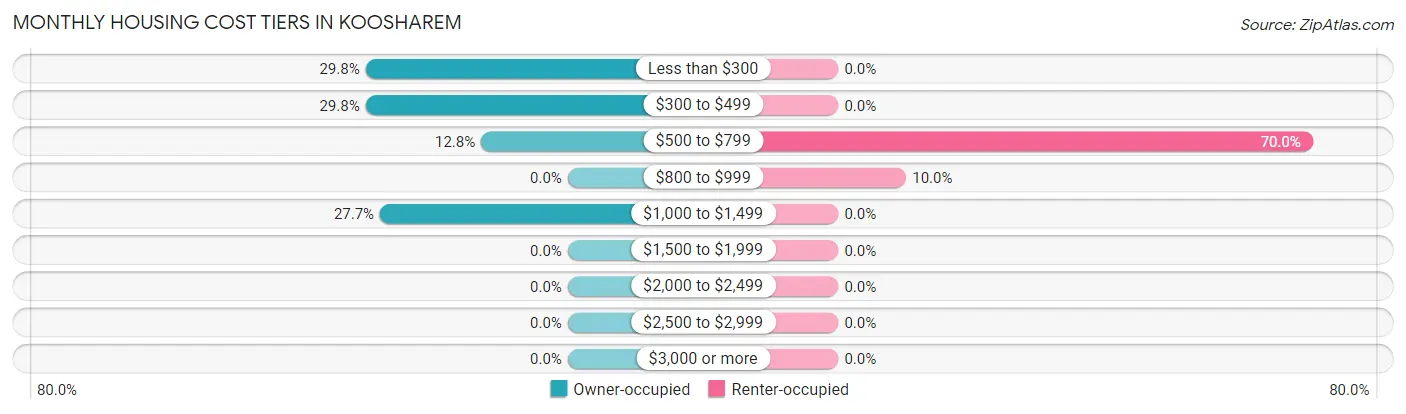
Monthly Housing Cost Tiers in Koosharem
| Monthly Cost | Owner-occupied | Renter-occupied |
| Less than $300 | 14 (29.8%) | 0 (0.0%) |
| $300 to $499 | 14 (29.8%) | 0 (0.0%) |
| $500 to $799 | 6 (12.8%) | 14 (70.0%) |
| $800 to $999 | 0 (0.0%) | 2 (10.0%) |
| $1,000 to $1,499 | 13 (27.7%) | 0 (0.0%) |
| $1,500 to $1,999 | 0 (0.0%) | 0 (0.0%) |
| $2,000 to $2,499 | 0 (0.0%) | 0 (0.0%) |
| $2,500 to $2,999 | 0 (0.0%) | 0 (0.0%) |
| $3,000 or more | 0 (0.0%) | 0 (0.0%) |
| Total | 47 (100.0%) | 20 (100.0%) |
Physical Housing Characteristics in Koosharem
Housing Structures in Koosharem
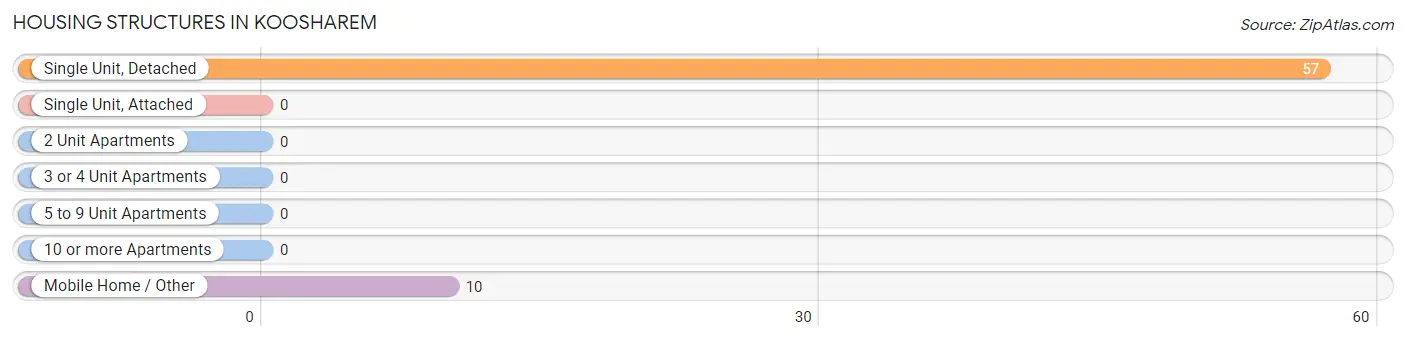
| Structure Type | # Housing Units | % Housing Units |
| Single Unit, Detached | 57 | 85.1% |
| Single Unit, Attached | 0 | 0.0% |
| 2 Unit Apartments | 0 | 0.0% |
| 3 or 4 Unit Apartments | 0 | 0.0% |
| 5 to 9 Unit Apartments | 0 | 0.0% |
| 10 or more Apartments | 0 | 0.0% |
| Mobile Home / Other | 10 | 14.9% |
| Total | 67 | 100.0% |
Housing Structures by Occupancy in Koosharem
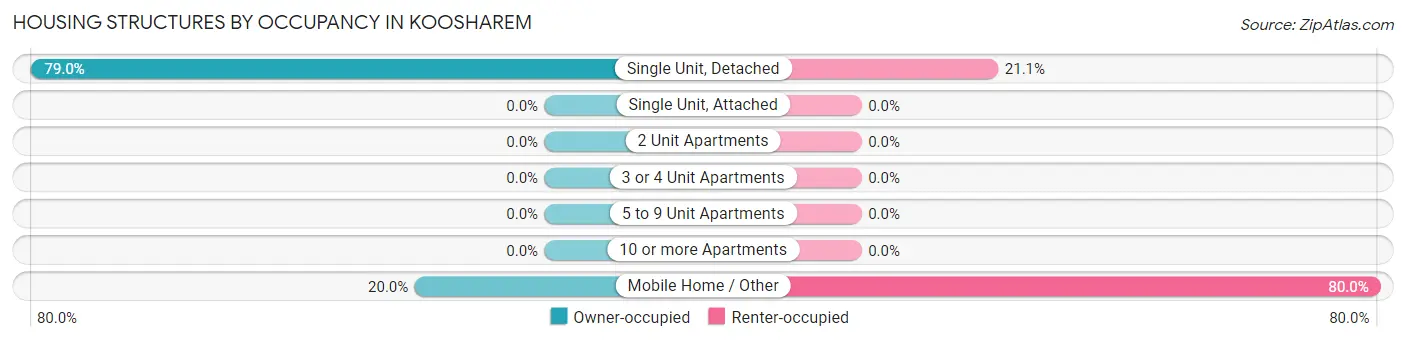
| Structure Type | Owner-occupied | Renter-occupied |
| Single Unit, Detached | 45 (78.9%) | 12 (21.0%) |
| Single Unit, Attached | 0 (0.0%) | 0 (0.0%) |
| 2 Unit Apartments | 0 (0.0%) | 0 (0.0%) |
| 3 or 4 Unit Apartments | 0 (0.0%) | 0 (0.0%) |
| 5 to 9 Unit Apartments | 0 (0.0%) | 0 (0.0%) |
| 10 or more Apartments | 0 (0.0%) | 0 (0.0%) |
| Mobile Home / Other | 2 (20.0%) | 8 (80.0%) |
| Total | 47 (70.2%) | 20 (29.8%) |
Housing Structures by Number of Rooms in Koosharem
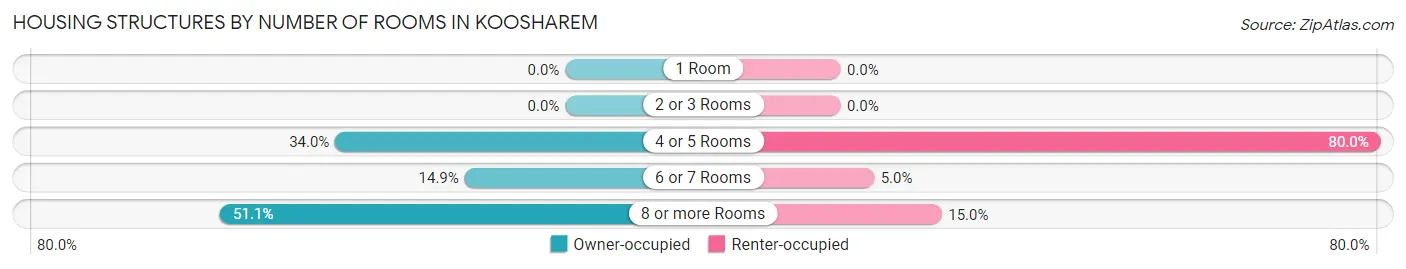
| Number of Rooms | Owner-occupied | Renter-occupied |
| 1 Room | 0 (0.0%) | 0 (0.0%) |
| 2 or 3 Rooms | 0 (0.0%) | 0 (0.0%) |
| 4 or 5 Rooms | 16 (34.0%) | 16 (80.0%) |
| 6 or 7 Rooms | 7 (14.9%) | 1 (5.0%) |
| 8 or more Rooms | 24 (51.1%) | 3 (15.0%) |
| Total | 47 (100.0%) | 20 (100.0%) |
Housing Structure by Heating Type in Koosharem
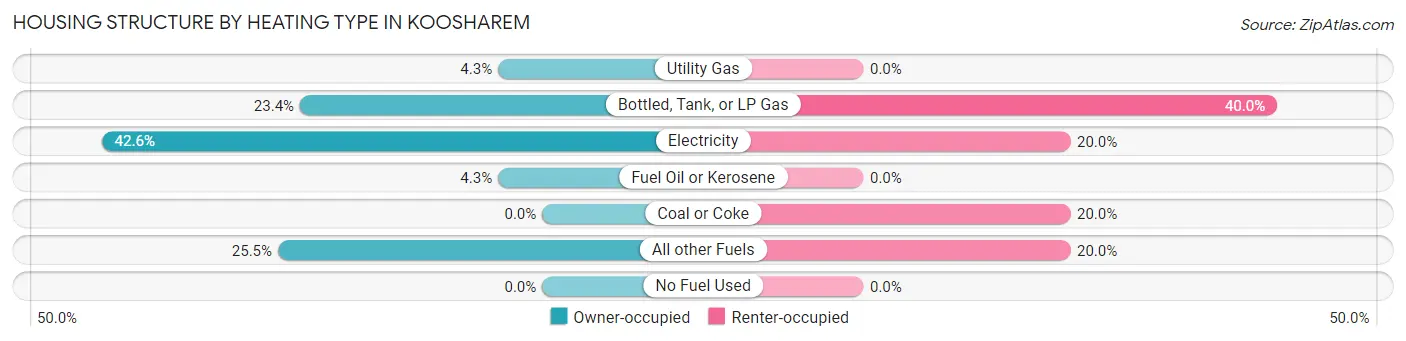
| Heating Type | Owner-occupied | Renter-occupied |
| Utility Gas | 2 (4.3%) | 0 (0.0%) |
| Bottled, Tank, or LP Gas | 11 (23.4%) | 8 (40.0%) |
| Electricity | 20 (42.5%) | 4 (20.0%) |
| Fuel Oil or Kerosene | 2 (4.3%) | 0 (0.0%) |
| Coal or Coke | 0 (0.0%) | 4 (20.0%) |
| All other Fuels | 12 (25.5%) | 4 (20.0%) |
| No Fuel Used | 0 (0.0%) | 0 (0.0%) |
| Total | 47 (100.0%) | 20 (100.0%) |
Household Vehicle Usage in Koosharem
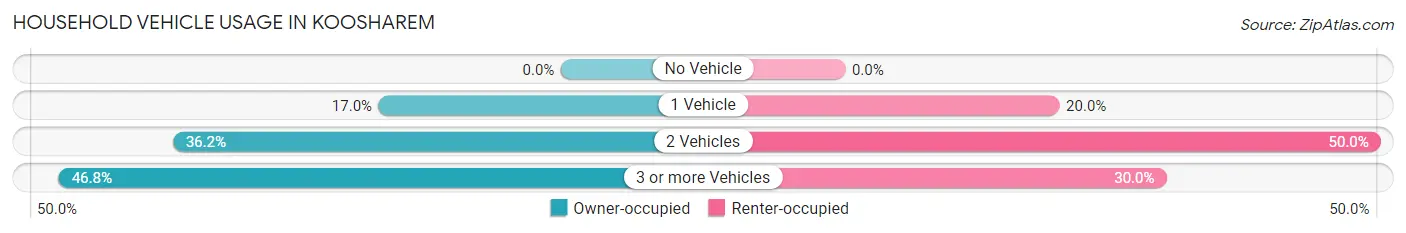
| Vehicles per Household | Owner-occupied | Renter-occupied |
| No Vehicle | 0 (0.0%) | 0 (0.0%) |
| 1 Vehicle | 8 (17.0%) | 4 (20.0%) |
| 2 Vehicles | 17 (36.2%) | 10 (50.0%) |
| 3 or more Vehicles | 22 (46.8%) | 6 (30.0%) |
| Total | 47 (100.0%) | 20 (100.0%) |
Real Estate & Mortgages in Koosharem
Real Estate and Mortgage Overview in Koosharem
| Characteristic | Without Mortgage | With Mortgage |
| Housing Units | 34 | 13 |
| Median Property Value | $181,300 | $243,800 |
| Median Household Income | $46,563 | $0 |
| Monthly Housing Costs | $319 | $0 |
| Real Estate Taxes | $714 | $0 |
Property Value by Mortgage Status in Koosharem
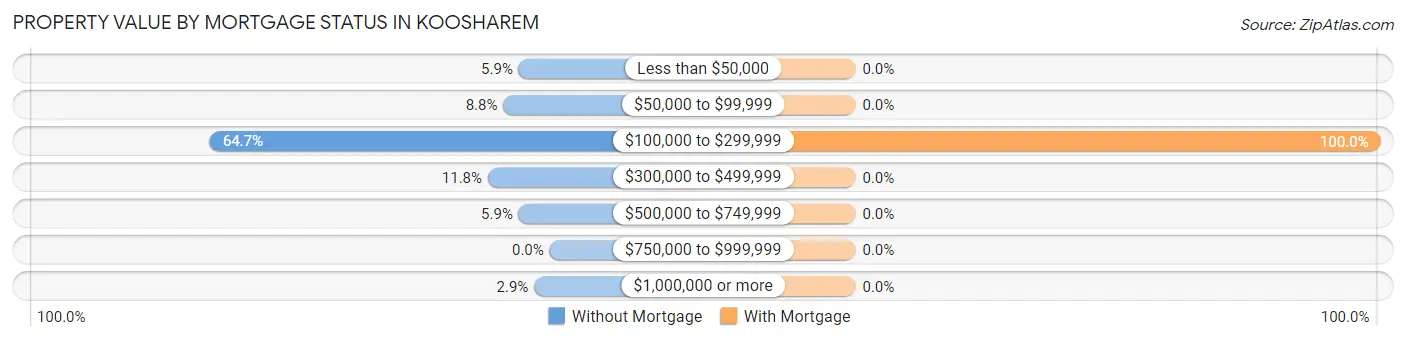
| Property Value | Without Mortgage | With Mortgage |
| Less than $50,000 | 2 (5.9%) | 0 (0.0%) |
| $50,000 to $99,999 | 3 (8.8%) | 0 (0.0%) |
| $100,000 to $299,999 | 22 (64.7%) | 13 (100.0%) |
| $300,000 to $499,999 | 4 (11.8%) | 0 (0.0%) |
| $500,000 to $749,999 | 2 (5.9%) | 0 (0.0%) |
| $750,000 to $999,999 | 0 (0.0%) | 0 (0.0%) |
| $1,000,000 or more | 1 (2.9%) | 0 (0.0%) |
| Total | 34 (100.0%) | 13 (100.0%) |
Household Income by Mortgage Status in Koosharem
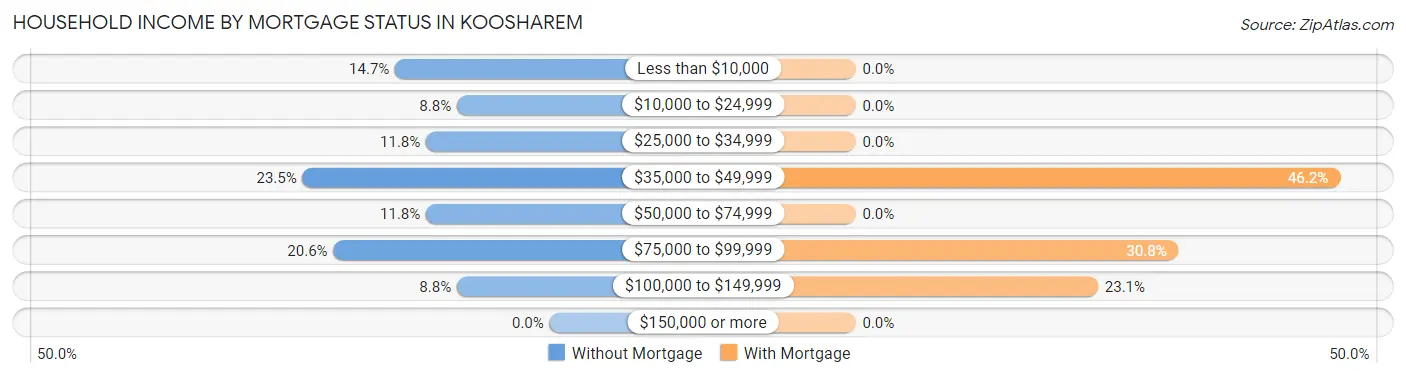
| Household Income | Without Mortgage | With Mortgage |
| Less than $10,000 | 5 (14.7%) | 0 (0.0%) |
| $10,000 to $24,999 | 3 (8.8%) | 0 (0.0%) |
| $25,000 to $34,999 | 4 (11.8%) | 0 (0.0%) |
| $35,000 to $49,999 | 8 (23.5%) | 6 (46.2%) |
| $50,000 to $74,999 | 4 (11.8%) | 0 (0.0%) |
| $75,000 to $99,999 | 7 (20.6%) | 4 (30.8%) |
| $100,000 to $149,999 | 3 (8.8%) | 3 (23.1%) |
| $150,000 or more | 0 (0.0%) | 0 (0.0%) |
| Total | 34 (100.0%) | 13 (100.0%) |
Property Value to Household Income Ratio in Koosharem
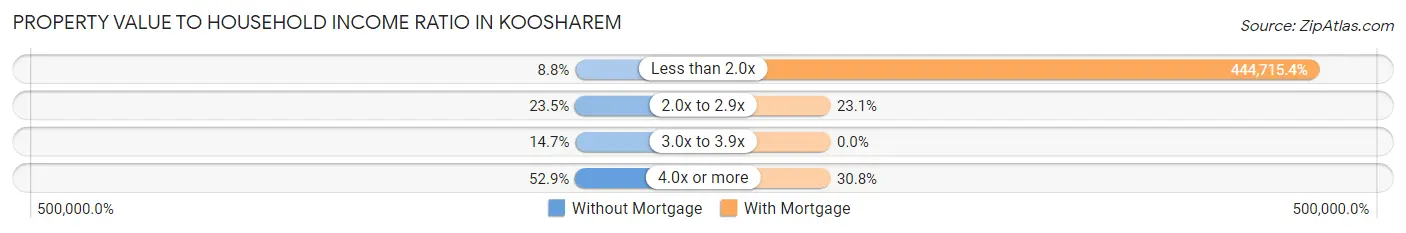
| Value-to-Income Ratio | Without Mortgage | With Mortgage |
| Less than 2.0x | 3 (8.8%) | 57,813 (444,715.4%) |
| 2.0x to 2.9x | 8 (23.5%) | 3 (23.1%) |
| 3.0x to 3.9x | 5 (14.7%) | 0 (0.0%) |
| 4.0x or more | 18 (52.9%) | 4 (30.8%) |
| Total | 34 (100.0%) | 13 (100.0%) |
Real Estate Taxes by Mortgage Status in Koosharem
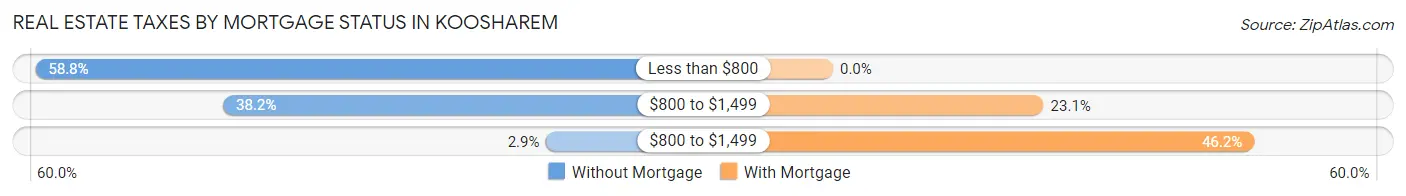
| Property Taxes | Without Mortgage | With Mortgage |
| Less than $800 | 20 (58.8%) | 0 (0.0%) |
| $800 to $1,499 | 13 (38.2%) | 3 (23.1%) |
| $800 to $1,499 | 1 (2.9%) | 6 (46.2%) |
| Total | 34 (100.0%) | 13 (100.0%) |
Health & Disability in Koosharem
Health Insurance Coverage by Age in Koosharem
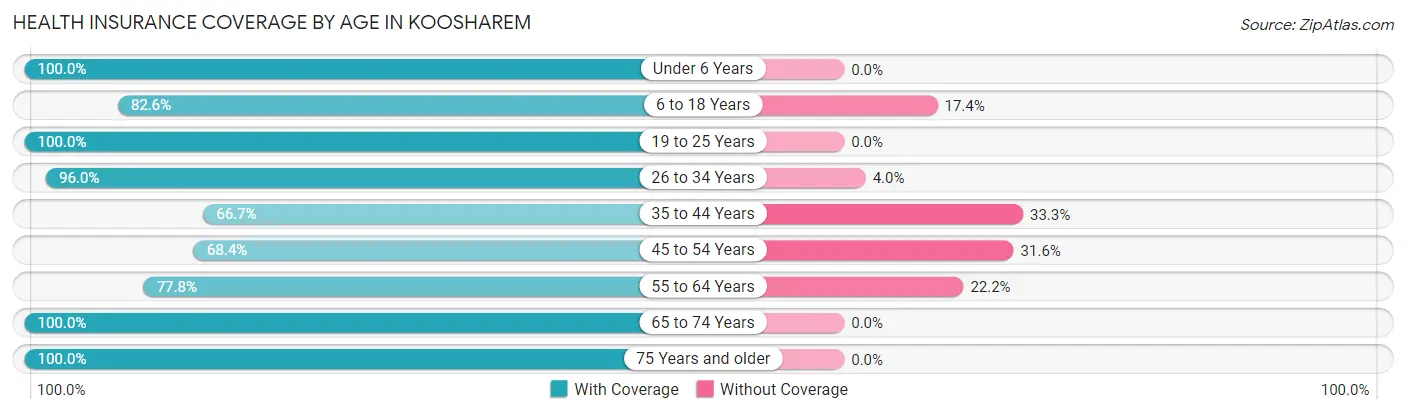
| Age Bracket | With Coverage | Without Coverage |
| Under 6 Years | 14 (100.0%) | 0 (0.0%) |
| 6 to 18 Years | 38 (82.6%) | 8 (17.4%) |
| 19 to 25 Years | 9 (100.0%) | 0 (0.0%) |
| 26 to 34 Years | 24 (96.0%) | 1 (4.0%) |
| 35 to 44 Years | 8 (66.7%) | 4 (33.3%) |
| 45 to 54 Years | 13 (68.4%) | 6 (31.6%) |
| 55 to 64 Years | 14 (77.8%) | 4 (22.2%) |
| 65 to 74 Years | 13 (100.0%) | 0 (0.0%) |
| 75 Years and older | 32 (100.0%) | 0 (0.0%) |
| Total | 165 (87.8%) | 23 (12.2%) |
Health Insurance Coverage by Citizenship Status in Koosharem
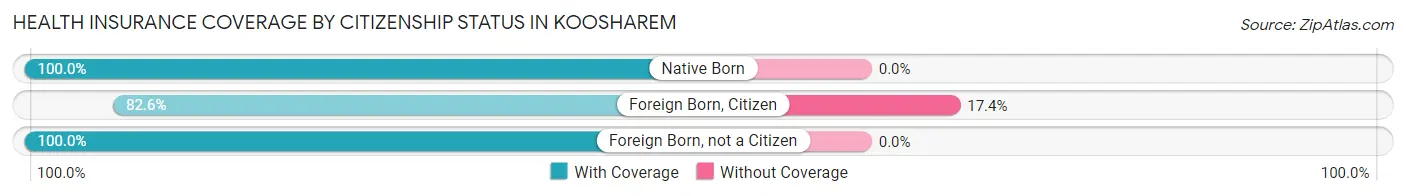
| Citizenship Status | With Coverage | Without Coverage |
| Native Born | 14 (100.0%) | 0 (0.0%) |
| Foreign Born, Citizen | 38 (82.6%) | 8 (17.4%) |
| Foreign Born, not a Citizen | 9 (100.0%) | 0 (0.0%) |
Health Insurance Coverage by Household Income in Koosharem
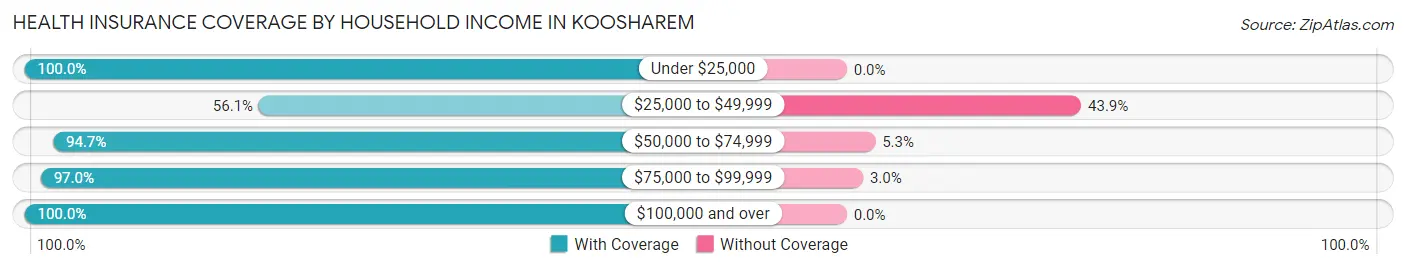
| Household Income | With Coverage | Without Coverage |
| Under $25,000 | 8 (100.0%) | 0 (0.0%) |
| $25,000 to $49,999 | 23 (56.1%) | 18 (43.9%) |
| $50,000 to $74,999 | 71 (94.7%) | 4 (5.3%) |
| $75,000 to $99,999 | 32 (97.0%) | 1 (3.0%) |
| $100,000 and over | 31 (100.0%) | 0 (0.0%) |
Public vs Private Health Insurance Coverage by Age in Koosharem
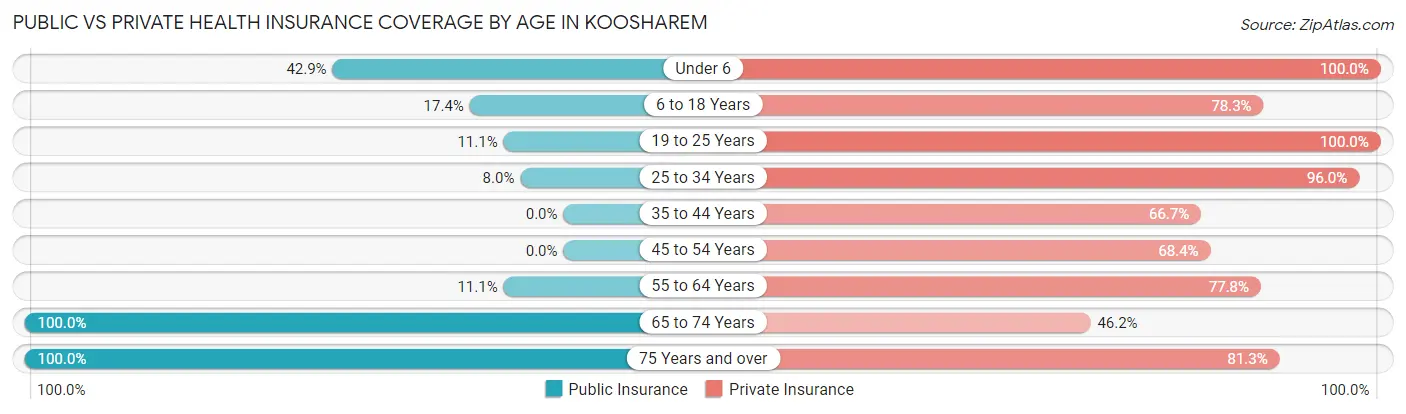
| Age Bracket | Public Insurance | Private Insurance |
| Under 6 | 6 (42.9%) | 14 (100.0%) |
| 6 to 18 Years | 8 (17.4%) | 36 (78.3%) |
| 19 to 25 Years | 1 (11.1%) | 9 (100.0%) |
| 25 to 34 Years | 2 (8.0%) | 24 (96.0%) |
| 35 to 44 Years | 0 (0.0%) | 8 (66.7%) |
| 45 to 54 Years | 0 (0.0%) | 13 (68.4%) |
| 55 to 64 Years | 2 (11.1%) | 14 (77.8%) |
| 65 to 74 Years | 13 (100.0%) | 6 (46.2%) |
| 75 Years and over | 32 (100.0%) | 26 (81.2%) |
| Total | 64 (34.0%) | 150 (79.8%) |
Disability Status by Sex by Age in Koosharem
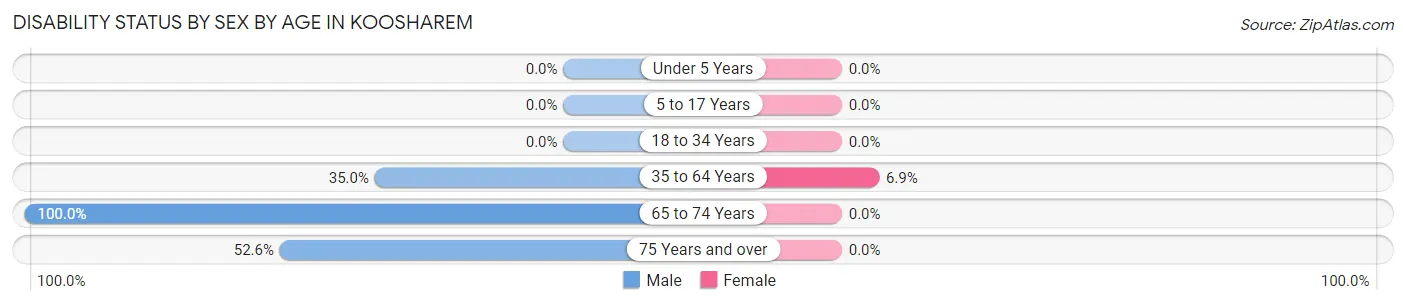
| Age Bracket | Male | Female |
| Under 5 Years | 0 (0.0%) | 0 (0.0%) |
| 5 to 17 Years | 0 (0.0%) | 0 (0.0%) |
| 18 to 34 Years | 0 (0.0%) | 0 (0.0%) |
| 35 to 64 Years | 7 (35.0%) | 2 (6.9%) |
| 65 to 74 Years | 5 (100.0%) | 0 (0.0%) |
| 75 Years and over | 10 (52.6%) | 0 (0.0%) |
Disability Class by Sex by Age in Koosharem
Disability Class: Hearing Difficulty
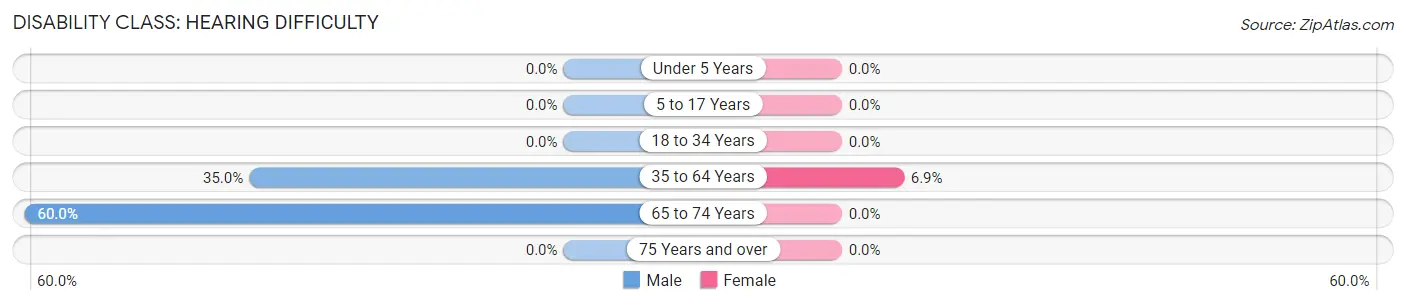
| Age Bracket | Male | Female |
| Under 5 Years | 0 (0.0%) | 0 (0.0%) |
| 5 to 17 Years | 0 (0.0%) | 0 (0.0%) |
| 18 to 34 Years | 0 (0.0%) | 0 (0.0%) |
| 35 to 64 Years | 7 (35.0%) | 2 (6.9%) |
| 65 to 74 Years | 3 (60.0%) | 0 (0.0%) |
| 75 Years and over | 0 (0.0%) | 0 (0.0%) |
Disability Class: Vision Difficulty
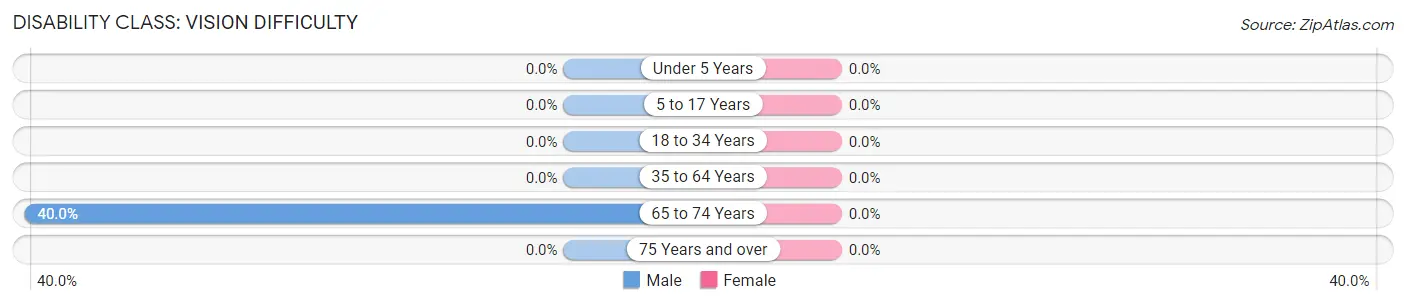
| Age Bracket | Male | Female |
| Under 5 Years | 0 (0.0%) | 0 (0.0%) |
| 5 to 17 Years | 0 (0.0%) | 0 (0.0%) |
| 18 to 34 Years | 0 (0.0%) | 0 (0.0%) |
| 35 to 64 Years | 0 (0.0%) | 0 (0.0%) |
| 65 to 74 Years | 2 (40.0%) | 0 (0.0%) |
| 75 Years and over | 0 (0.0%) | 0 (0.0%) |
Disability Class: Cognitive Difficulty
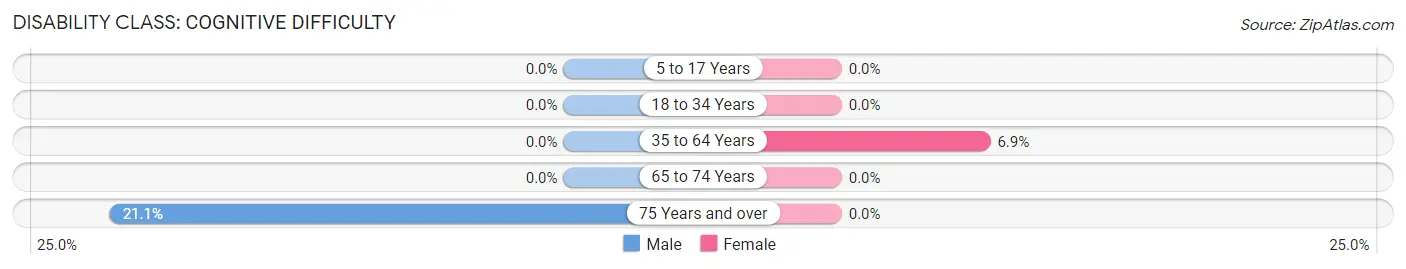
| Age Bracket | Male | Female |
| 5 to 17 Years | 0 (0.0%) | 0 (0.0%) |
| 18 to 34 Years | 0 (0.0%) | 0 (0.0%) |
| 35 to 64 Years | 0 (0.0%) | 2 (6.9%) |
| 65 to 74 Years | 0 (0.0%) | 0 (0.0%) |
| 75 Years and over | 4 (21.0%) | 0 (0.0%) |
Disability Class: Ambulatory Difficulty
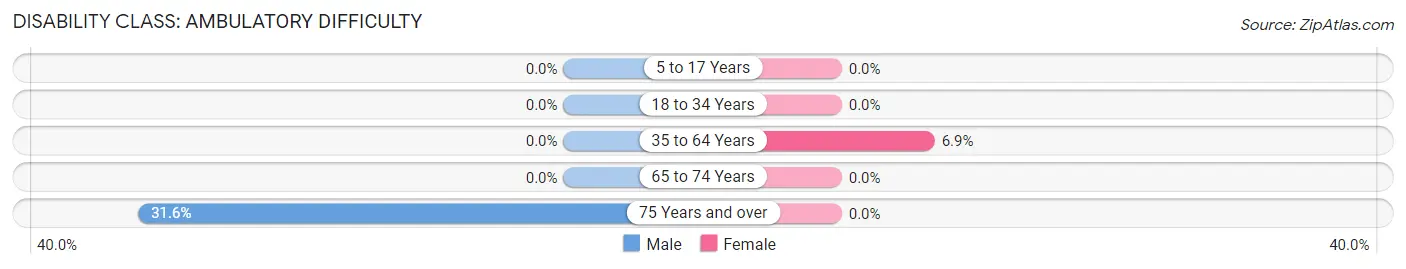
| Age Bracket | Male | Female |
| 5 to 17 Years | 0 (0.0%) | 0 (0.0%) |
| 18 to 34 Years | 0 (0.0%) | 0 (0.0%) |
| 35 to 64 Years | 0 (0.0%) | 2 (6.9%) |
| 65 to 74 Years | 0 (0.0%) | 0 (0.0%) |
| 75 Years and over | 6 (31.6%) | 0 (0.0%) |
Disability Class: Self-Care Difficulty
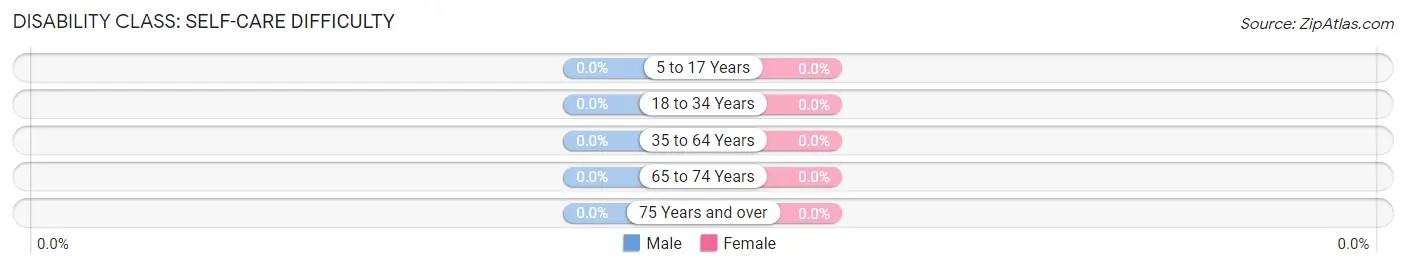
| Age Bracket | Male | Female |
| 5 to 17 Years | 0 (0.0%) | 0 (0.0%) |
| 18 to 34 Years | 0 (0.0%) | 0 (0.0%) |
| 35 to 64 Years | 0 (0.0%) | 0 (0.0%) |
| 65 to 74 Years | 0 (0.0%) | 0 (0.0%) |
| 75 Years and over | 0 (0.0%) | 0 (0.0%) |
Technology Access in Koosharem
Computing Device Access in Koosharem
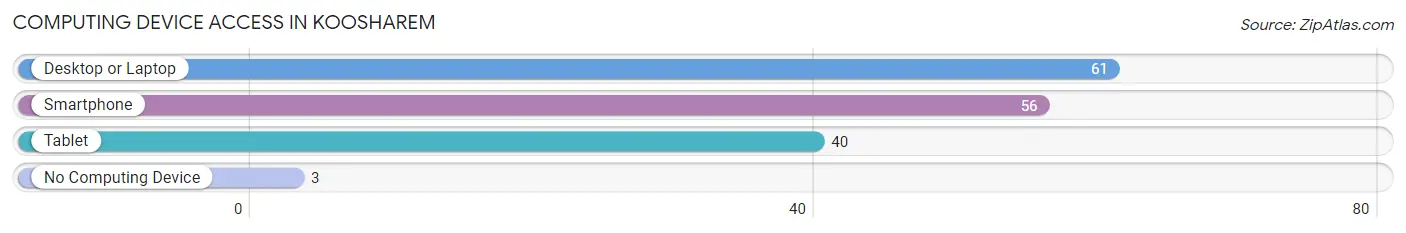
| Device Type | # Households | % Households |
| Desktop or Laptop | 61 | 91.0% |
| Smartphone | 56 | 83.6% |
| Tablet | 40 | 59.7% |
| No Computing Device | 3 | 4.5% |
| Total | 67 | 100.0% |
Internet Access in Koosharem
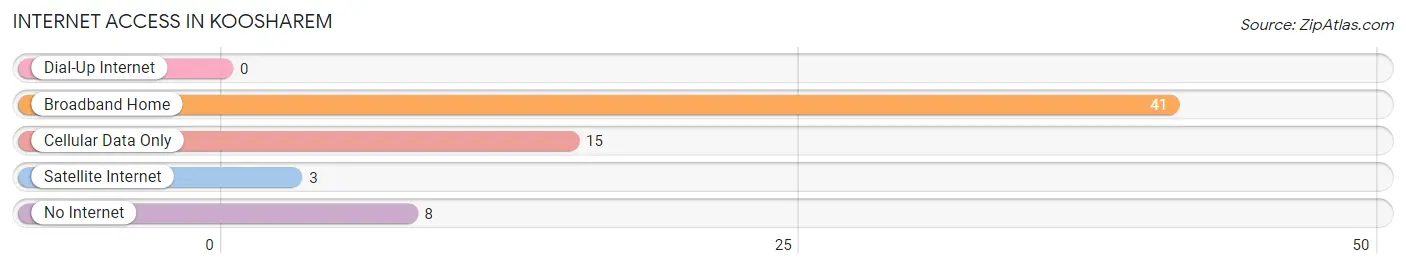
| Internet Type | # Households | % Households |
| Dial-Up Internet | 0 | 0.0% |
| Broadband Home | 41 | 61.2% |
| Cellular Data Only | 15 | 22.4% |
| Satellite Internet | 3 | 4.5% |
| No Internet | 8 | 11.9% |
| Total | 67 | 100.0% |
Koosharem Summary
Koosharem is a small town located in Sevier County, Utah. It is situated in the Fishlake National Forest, about 20 miles south of Richfield. The town was founded in 1876 by a group of Mormon settlers and was named after a Native American chief. As of the 2010 census, the population of Koosharem was just over 200 people.
History
Koosharem was founded in 1876 by a group of Mormon settlers who were sent to the area by Brigham Young. The town was named after a Native American chief, Chief Koosharem, who was friendly to the settlers. The settlers built a fort and a school, and the town quickly grew. By the early 1900s, Koosharem had a post office, a general store, a blacksmith shop, and a hotel.
In the early 1900s, the town was a popular stop for travelers on the Salt Lake to Los Angeles stagecoach line. The town also had a thriving agricultural industry, with many farmers growing hay, wheat, and other crops.
In the 1950s, the town began to decline as many of the residents moved away in search of better economic opportunities. By the 1970s, the population had dropped to just over 100 people.
Geography
Koosharem is located in the Fishlake National Forest in Sevier County, Utah. The town is situated at an elevation of 6,000 feet and is surrounded by mountains and forests. The town is located about 20 miles south of Richfield and is accessible via State Route 24.
Economy
The economy of Koosharem is largely based on tourism and agriculture. The town is a popular destination for outdoor enthusiasts, with many visitors coming to the area to enjoy the nearby forests and mountains. The town also has a thriving agricultural industry, with many farmers growing hay, wheat, and other crops.
Demographics
As of the 2010 census, the population of Koosharem was just over 200 people. The racial makeup of the town was 97.5% White, 0.5% Native American, 0.5% Asian, and 1.5% from two or more races. The median household income was $37,500 and the median family income was $41,250. The per capita income was $17,500.
Conclusion
Koosharem is a small town located in Sevier County, Utah. It was founded in 1876 by a group of Mormon settlers and was named after a Native American chief. The town has a population of just over 200 people and is largely dependent on tourism and agriculture for its economy. The town is a popular destination for outdoor enthusiasts and has a thriving agricultural industry.
Common Questions
What is Per Capita Income in Koosharem?
Per Capita income in Koosharem is $17,071.
What is the Median Family Income in Koosharem?
Median Family Income in Koosharem is $63,500.
What is the Median Household income in Koosharem?
Median Household Income in Koosharem is $58,594.
What is Income or Wage Gap in Koosharem?
Income or Wage Gap in Koosharem is 63.4%.
Women in Koosharem earn 36.6 cents for every dollar earned by a man.
What is Inequality or Gini Index in Koosharem?
Inequality or Gini Index in Koosharem is 0.31.
What is the Total Population of Koosharem?
Total Population of Koosharem is 251.
What is the Total Male Population of Koosharem?
Total Male Population of Koosharem is 128.
What is the Total Female Population of Koosharem?
Total Female Population of Koosharem is 123.
What is the Ratio of Males per 100 Females in Koosharem?
There are 104.07 Males per 100 Females in Koosharem.
What is the Ratio of Females per 100 Males in Koosharem?
There are 96.09 Females per 100 Males in Koosharem.
What is the Median Population Age in Koosharem?
Median Population Age in Koosharem is 19.3 Years.
What is the Average Family Size in Koosharem
Average Family Size in Koosharem is 3.3 People.
What is the Average Household Size in Koosharem
Average Household Size in Koosharem is 2.8 People.
How Large is the Labor Force in Koosharem?
There are 74 People in the Labor Forcein in Koosharem.
What is the Percentage of People in the Labor Force in Koosharem?
46.0% of People are in the Labor Force in Koosharem.